
Abstract
Objective:
The aims of this study were (1) to examine cerebrovascular autoregulation in subjects with impaired glucose tolerance and type 2 diabetes and (2) to clarify whether cardiovascular autonomic nerve function is associated with abnormal cerebrovascular autoregulation.
Research design and methods:
Totally, 46 subjects were recruited (12 = impaired glucose tolerance, 17 = type 2 diabetes and 17 = healthy volunteers). Arterial blood flow was assessed within the internal carotid artery at baseline and 20 min after intravenous pharmacological stress (1 g acetazolamide), using quantitative magnetic resonance phase-contrast angiography. Internal carotid artery vascular reactivity and pulsatility index was determined. All subjects underwent baroreceptor reflex sensitivity assessment.
Results:
Subjects with impaired glucose tolerance and type 2 diabetes had significantly lower internal carotid artery vascular reactivity [40.2%(19.8) and 41.5%(18.7)], respectively, compared with healthy volunteers [57.0%(14.2); analysis of variance, p = 0.02]. There was no significant difference in internal carotid artery vascular reactivity between type 2 diabetes and impaired glucose tolerance groups (p = 0.84). There was a significant positive correlation between baroreceptor reflex sensitivity (low frequency:high frequency) with cardiac rhythm variability (ρ = 0.47, p = 0.04) and PI (ρ = 0.46, p = 0.04).
Conclusion:
We have demonstrated significant cerebrovascular haemodynamic abnormalities in subjects with type 2 diabetes and impaired glucose tolerance. This was associated with greater sympathovagal imbalance. This may provide an important mechanistic explanation for increased risk of cerebrovascular disease in diabetes. It also highlights that these abnormalities may already be present in prediabetes.
Keywords
Type 2 diabetes mellitus (T2DM) and impaired glucose tolerance (IGT) increases the risk of ischaemic stroke.1–4 Although, epidemiological studies have linked increased duration of diabetes and poor metabolic control to stroke risk, paradoxically, large randomised studies have failed conclusively to show that intensively lowering glucose reduces cardiovascular event rates (including stroke).5,6 Hence, the cause of an increased stroke risk in diabetes remains unclear.
Cerebral blood flow is carefully regulated to exceed the metabolic demands of the brain. 7 Metabolic coupling mechanisms ensure that blood flow is increased in regions that are metabolically active, 8 and autoregulation maintains blood flow during changes in perfusion pressure. 9 Abnormal cerebrovascular autoregulation is associated with an increased risk of stroke as it impairs the ability to compensate in response to a fall in perfusion pressure.10–14 This has been widely reported in patients with diabetes as impaired cerebrovascular reactivity to a variety of haemodynamic challenges [e.g. hypercapnia, acetazolamide (ACZ) and blood pressure changes15–18]. Abnormal cerebrovascular autoregulation has also been demonstrated in diabetic subjects with severe cardiac autonomic neuropathy. 19
Given the increased risk of stroke in prediabetes, we evaluated whether IGT is associated with abnormal cerebrovascular autoregulation by examining vascular reactivity of the internal carotid artery (ICA) in response to pharmacological vasodilatory challenge using quantitative magnetic resonance (MR) angiography. We also examined the relationship between cerebrovascular autoregulation and cardiovascular autonomic function. Therefore, the aims of this study were (1) to examine the cerebrovascular autoregulation in patients with IGT and (2) to examine the relationship between cerebrovascular autoregulation and autonomic function assessed by baroreceptor gain using established spectral techniques.
Research design and methods
Totally, 46 subjects [IGT, n = 12; T2DM, n = 17 and healthy volunteers (HV), n=17] were studied. IGT was defined as previously described. 20 We excluded any patients with uncontrolled diabetes (Hba1c > 120 mmol/mol), a history of cerebrovascular disease or the presence of MR imaging (MRI) findings compatible with stroke/ischaemic change or had evidence of significant carotid artery stenosis, known symptomatic heart disease that can alter cardiac output, peripheral vascular disease, neurological diseases, uncontrolled hypertension (systolic blood pressure (BP) > 170 mmHg), insulin treatment, renal impairment (eGFR < 90) current smokers or ex-smokers (<12 months) and medications (e.g. β-blockers) or illnesses (e.g. anaemia or polycythaemia) that can alter cerebrovascular reactivity, central chemosensitivity or cerebral blood flow. Standard MR exclusion criteria were adopted. If present, the degree of diabetic retinopathy (DR) was quantified using digital retinal photography from the annual eye-screening database. All subjects gave written, informed consent before participation in the study, which had prior approval by the Regional Ethics Committee.
Baroreceptor reflex sensitivity
Spectral measurements of baroreflex gain were performed in the morning, in the supine position using the Portapres Device (Finapres Medical Systems, Amsterdam, The Netherlands). Portapres self-adjustment was performed for 15 min to ensure patient and signal stabilisation. Following self-adjustment, an 8 min recording of electrocardiogram (ECG) and blood pressure signals was performed.
Arterial baroreceptor sensitivity was assessed using the software package intended for Baroreflex Sensitivity Analysis (Nevrokard™, Nevrokard Kiauta, Slovenia). Input data are those generated by a blood pressure monitor (Portapres™, Finapres Medical Systems, Netherlands) together with simultaneously acquired single channel ECG data from a custom ECG amplifier. Computation of spectral components in the low frequency (LF) band (from 0.04 Hz to 0.15 Hz) and in the high frequency (HF) band (from 0.15 Hz to 0.45 Hz) was performed. The square root of the ratio between cardiac and systolic arterial pressure spectral components in both bands provided the alpha-LF and alpha-HF indices, respectively. The ratio between LF and HF was also calculated.
MRI protocol
All data were acquired at 3.0 T (Achieva 3.0T, Philips Healthcare, Best, Holland). Standard T2-weighted and fluid attenuated inversion recovery (FLAIR) images were acquired in the axial plane using two-dimensional, fast-spin-echo techniques. Finger-prick blood glucose testing was performed during the MR imaging session to ensure it remained within 4–12 mmol/L. MR angiography (MRA): Standard time-of-flight MRA was performed over the right carotid artery bifurcation to aid subsequent angiographic slice placement. Quantitative phase-contrast angiography (PCA) data [time to echo (TE) = 4.4 ms; time to repeat (TR) = 8.0 ms; flip angle (FA) = 10°; velocity encoding factor (VENC) = 120 cm/s] were acquired from a single 4-mm-thick slice with in-plane pixel dimensions of 1.72 × 1.59 cm2. The PCA-acquisition slice was placed approximately 3 cm distal to the carotid bifurcation, perpendicular to the axis of flow within the right ICA, in order to maximise the extent of laminar flow-detection. Centrally acquired vector ECG data were used to retrospectively gate 40 time points within the cardiac cycle allowing blood flow to be assessed during each phase of the cardiac cycle. Following initial PCA, 1 g ACZ (Diamox Sodium parenteral, Wyeth laboratories, Maidenhead) was administered intravenously over 10 min through a cannulated antecubital vein while the subject remained in the scanner. An identical PCA acquisition was repeated 20 min post-ACZ administration.
Quantitative velocity and flow – encoded information were extracted from the MR-PCA datasets obtained from each subject via user-defined region of interest, post-acquisition, proprietary processing software (Q-flow, Philips Healthcare, Best, Holland). Regions of interest were drawn on the resultant phase-contrast images corresponding to the time-point of maximum arterial flow. The following established markers of ICA haemodynamics and autoregulation were used as outcome variables.21,22
Arterial blood flow (fICA, mL/s), refers to the average volume of blood per unit time;
ICA vascular reactivity (CVRICA, %) = [(fICAPOST−fICAPRE)/fICAPRE] × 100, where fICAPRE = mean blood flow through the ICA pre-ACZ administration and fICAPOST = mean blood flow through the ICA flow post-ACZ administration.
Pulsatility index (PI) = [fICAMAX- fICAMIN]/fICAMEAN, where fICAMAX = maximum flow during the cardiac cycle, fICAMIN = minimum flow during the cardiac cycle and fICAMEAN = mean flow throughout the cardiac cycle. Severely impaired VRICA was defined as <10% increase as described previously. 23
Statistical analysis
All analyses were performed using standard statistical techniques (SPSS 21.0, IBM Inc.). Baseline characteristics were described as means and standard deviation for normally distributed variables. The appropriate tests for normality were conducted to guide subsequent analysis. Demographic and outcome variables were compared between groups using one-way ANOVA, with Fisher’s post hoc test. Paired sample t-tests were used to compare mean fICA determined pre- and post-ACZ. Finally, analysis of covariance (ANCOVA) (age as covariate) was used to examine mean PI and RI of HV, IGT and T2DM subject groups divided into those with (T2DM-DR; n = 7) and without (T2DM-NoDR; n = 7) retinopathy. The linear association between the baroreceptor sensitivity and MR measures of ICA haemodynamics and autoregulation was assessed by Spearman correlation analysis in IGT and T2DM subgroups.
Results
There were no significant group differences in age or gender distribution (Table 1). IGT and T2DM subjects had significantly greater body mass index, waist circumference and prevalence of hypertension compared with HV (Table 1). Mean HbA1c in the T2DM cohort was 9.5 (1.9)% (75.0 mmol/mol). There were no significant differences in pre-ACZ mean fICA between groups [mL/s; HV (4.36 (0.7), IGT 4.88 (0.9), T2DM 4.34 (1.0); analysis of variance (ANOVA) p = 0.19; Figure 1(b)]. In all groups, there was a significant increase in subject fICA post-ACZ [mL/s; HV (6.85 (1.2), IGT 6.75 (1.0), T2DM 5.37 (2.4); p < 0.001; Figure 1(b)].
Comparison of demographic variables between study groups.
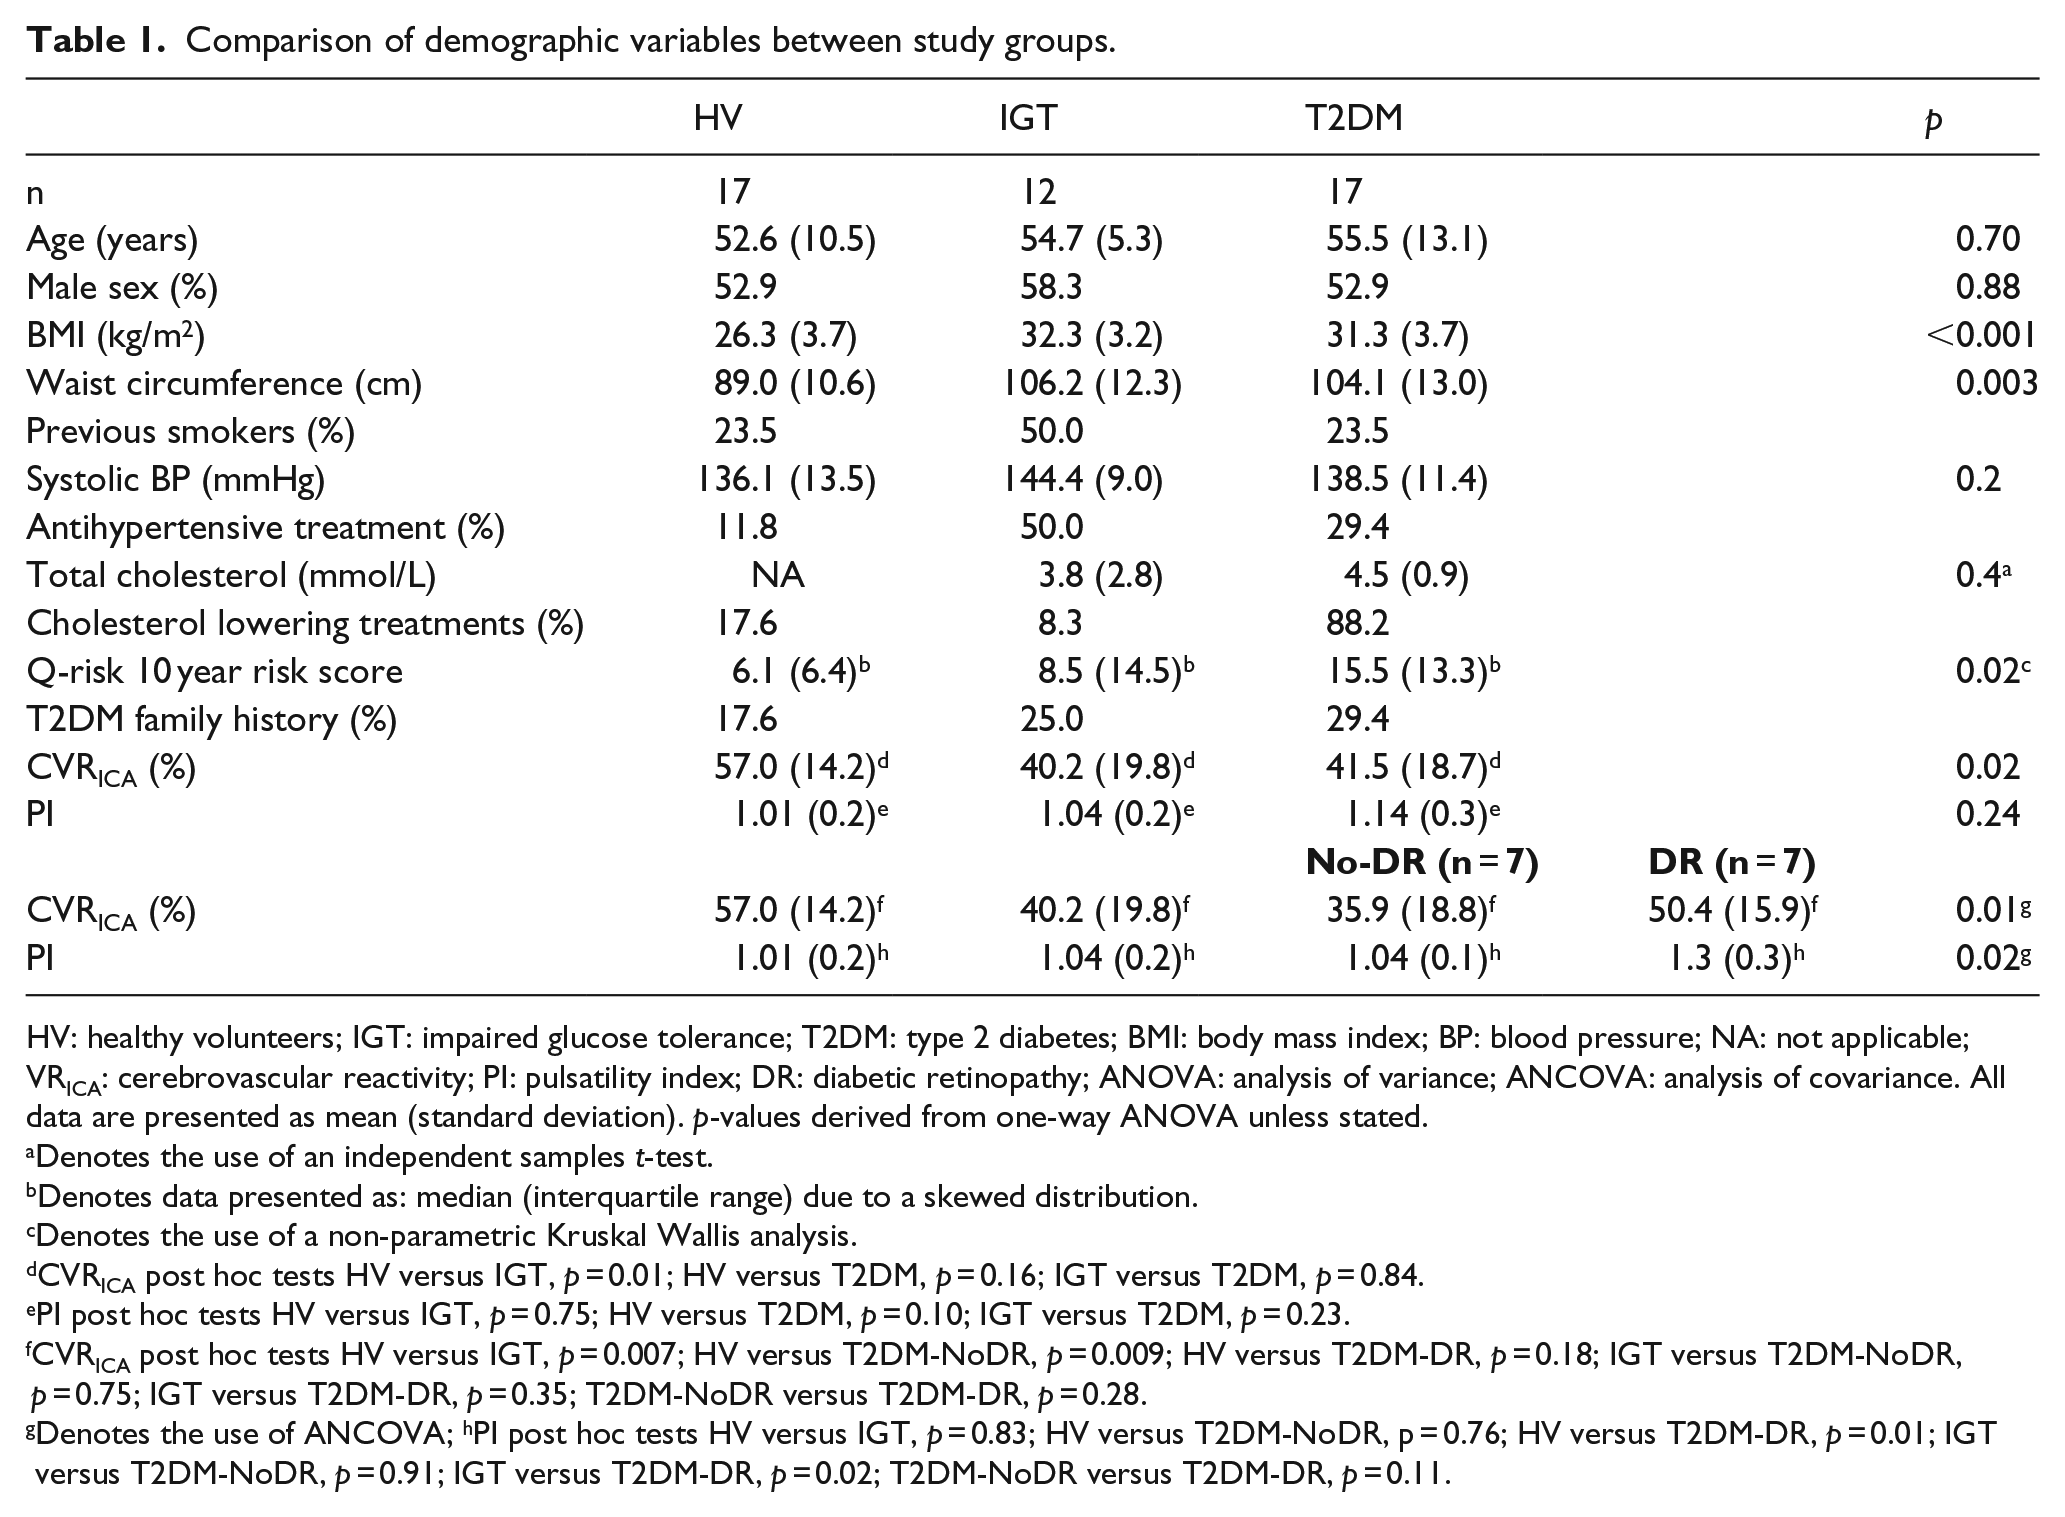
HV: healthy volunteers; IGT: impaired glucose tolerance; T2DM: type 2 diabetes; BMI: body mass index; BP: blood pressure; NA: not applicable; VRICA: cerebrovascular reactivity; PI: pulsatility index; DR: diabetic retinopathy; ANOVA: analysis of variance; ANCOVA: analysis of covariance. All data are presented as mean (standard deviation). p-values derived from one-way ANOVA unless stated.
Denotes the use of an independent samples t-test.
Denotes data presented as: median (interquartile range) due to a skewed distribution.
Denotes the use of a non-parametric Kruskal Wallis analysis.
CVRICA post hoc tests HV versus IGT, p = 0.01; HV versus T2DM, p = 0.16; IGT versus T2DM, p = 0.84.
PI post hoc tests HV versus IGT, p = 0.75; HV versus T2DM, p = 0.10; IGT versus T2DM, p = 0.23.
CVRICA post hoc tests HV versus IGT, p = 0.007; HV versus T2DM-NoDR, p = 0.009; HV versus T2DM-DR, p = 0.18; IGT versus T2DM-NoDR, p = 0.75; IGT versus T2DM-DR, p = 0.35; T2DM-NoDR versus T2DM-DR, p = 0.28.
Denotes the use of ANCOVA; hPI post hoc tests HV versus IGT, p = 0.83; HV versus T2DM-NoDR, p = 0.76; HV versus T2DM-DR, p = 0.01; IGT versus T2DM-NoDR, p = 0.91; IGT versus T2DM-DR, p = 0.02; T2DM-NoDR versus T2DM-DR, p = 0.11.
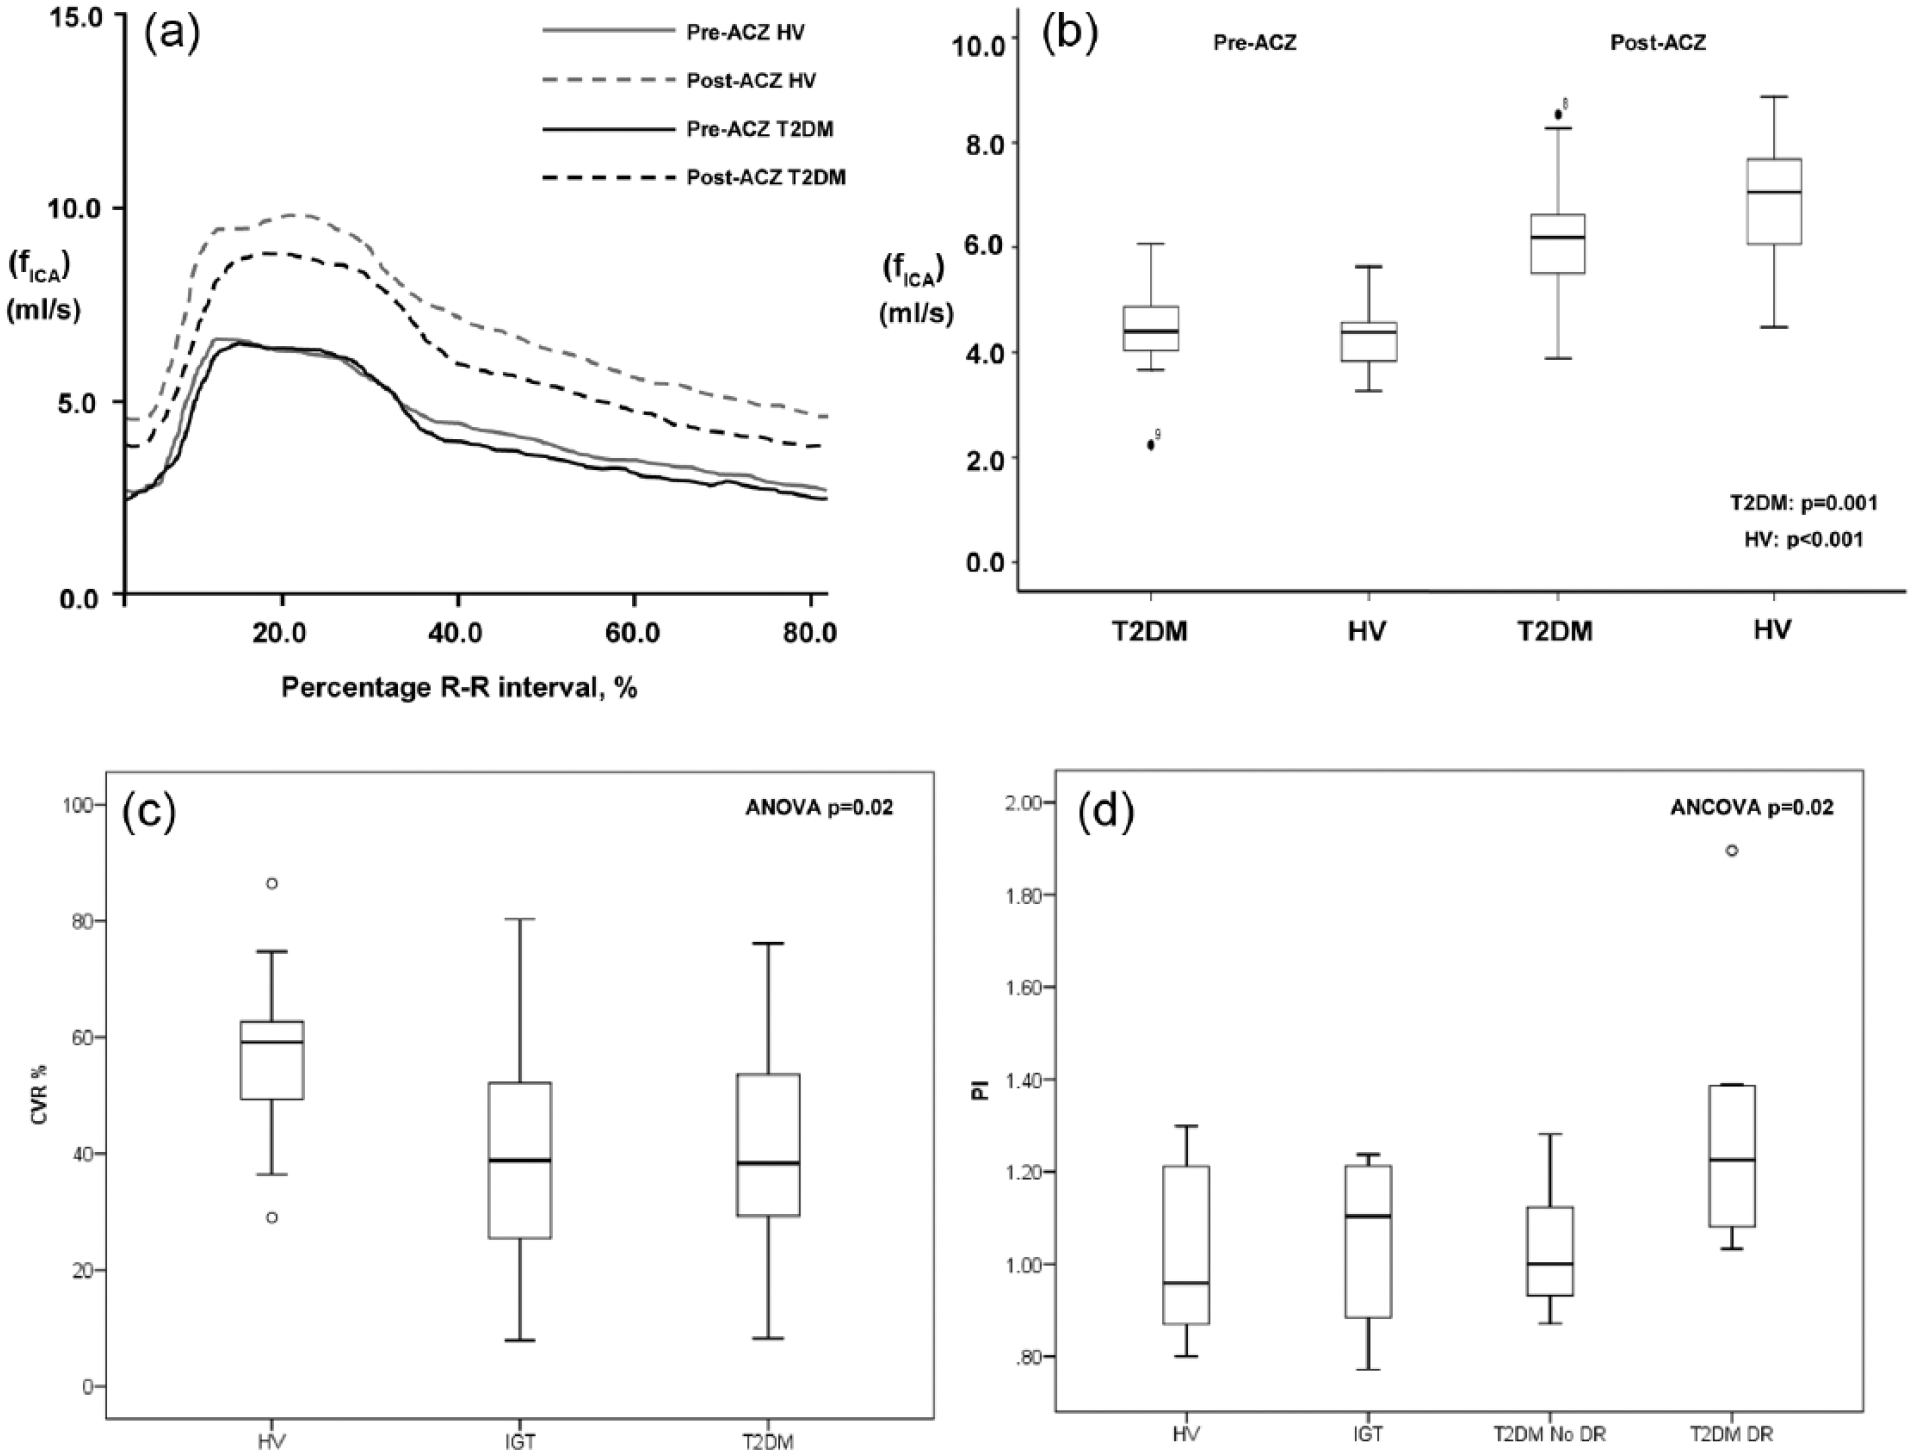
(a) Composite internal carotid artery cerebral blood flow (fICA, ml/s) over the duration of the cardiac cycle (arbitrary units) in healthy volunteers (HV) and subjects with type 2 diabetes (T2DM) before (pre-ACZ) and after (post-ACZ) acetazolamide (ACZ). (b) Box and whisker plots displaying mean fICA and 95% confidence intervals of HV and T2DM before and after ACZ. (c) Box and whisker plots displaying mean and 95% confidence intervals of cerebrovascular reactivity (CVR, %) in HV, IGT and T2DM cohorts. (d) Box and whisker plots displaying mean and 95% confidence intervals of pulsatility index (PI) in HV, IGT and subjects with T2DM with (T2DM-DR) and without (T2DM-NoDR) diabetic retinopathy (DR).
VRICA (%) was significantly greater in HV [57.0 (14.2)] compared to IGT [40.2 (19.8)] and T2DM [41.5 (18.7), ANOVA p = 0.02; Figure 1(c), post hoc tests Table 1]. After correction for body mass index (BMI) and hypertension status, mean VRICA remained significantly greater in HV (ANCOVA p = 0.04). There was no significant difference in VRICA (%) between IGT and T2DM subjects (p = 0.84). One subject each from T2DM (5.9%) and IGT (8.3%) cohorts had severely impaired VRICA. Subjects with T2DM [1.14 (0.3)] had the highest mean PI compared to HV [1.01 (0.2)] and IGT [1.04 (0.2); ANOVA p = 0.24, Table 1]. T2DM-DR subjects were older compared to T2DM-NoDR subjects [years, 60.6 (15.8) vs 51.0 (9.5)]. After correction for age, mean PI was significantly higher in T2DM-DR when compared with the T2DM-NoDR subgroup, IGT and HV groups [ANCOVA, p = 0.02; Figure 1(d), post hoc tests Table 1].
There was a significant positive correlation between baroreceptor reflex sensitivity measure LF:HF with cardiac rhythm variability (CRV) (ρ = 0.47, p = 0.04) and PI (ρ = 0.46, p = 0.04). Only HF and not LF demonstrated a significant correlation with CRV (ρ = −0.53, p = 0.02) and PI (ρ = −0.46, p = 0.04).
Discussion
In this preliminary study, we have demonstrated impaired cerebrovascular reactivity not only in T2DM subjects but also in those with IGT. This suggests poor cerebral blood flow reserve and abnormal cerebral autoregulation. Therefore, during an acute ischaemic insult, collateral vessels may be unable to re-perfuse the ischaemic penumbra to maintain its viability. To our knowledge, this is the first report of impaired cerebrovascular reactivity in subjects with IGT. Endothelial cell–mediated vasodilatation is thought to play an important role in the intracerebral response to ACZ 24 and could be responsible for impaired cerebrovascular reactivity in IGT and T2DM.
The Gosling PI is a measure of vascular resistance originally performed on the brachial artery in humans. 25 It has since been frequently used in studies to reflect increase in cerebrovascular resistance.26,27 In our study, ICA PI was significantly greater in T2DM subjects with microvascular disease (DR). This is consistent with the literature and thought to reflect greater cerebrovascular microangiopathy. Thus, our finding of impaired CVR but not pulsatility in IGT subjects probably reflects a relatively greater degree of endothelial vasodilatory dysfunctional pathology than a microangiopathic pathology. This would suggest that it could be amenable to pharmacological treatment (e.g. low-dose aspirin is known to have vasoactive properties that may be through a cyclooxygenase independent pathway) or aggressive risk factor modification.
Autonomic nervous system alterations may also play a role in the cerebrovascular haemodynamic differences demonstrated. We found that changes in sympathovagal balance (LF:HF ratio) were moderately associated with CVR and PI. This appears to be driven by the variance in HF but not LF. Efferent vagal activity is a major contributor to the HF component of spectral analysis of baroreceptor gain as seen in clinical and experimental observations. Interpretation of the LF component is less clear, some consider it a marker of sympathetic modulation and by others as a parameter that includes both sympathetic and vagal influences. The LF:HF ratio assesses the controlled and balanced activity of the two branches of the autonomic nervous system. Although the results of this study are consistent with the hypothesis of autonomic dysfunction being involved in abnormal cerebrovascular reactivity, the cross-sectional design limits interpretation of causality. Further work is necessary to examine if abnormal sympathovagal balance results in worse outcomes post-stroke, and if pharmacological treatments can ameliorate this.
A number of different techniques have been used to assess CVR. The most common method is the use of transcranial Doppler ultrasound measurement of middle cerebral artery velocity. Using this method, several investigators have demonstrated reduced CVR in patients with type 1 and 2 diabetes.28,29 Impaired CVR was also demonstrated in diabetic subjects with established microvascular complications (retinopathy 30 and nephropathy 31 ). Transcranial Doppler ultrasound is a non-invasive, inexpensive technique that only measures blood velocity. Its main limitation is it assumes that changes in velocity are directly proportional to changes in blood flow, and therefore the arterial diameter remains constant. 32 Consequently it overestimates blood flow. 33 There is also significant inter-operator variability influencing its reliability and 5–15% of patients cannot undergo transcranial Doppler of the middle cerebral artery as there is an insufficient temporal bone acoustic window. 34 Magnetic resonance PCA provides a reliable and reproducible method of quantifying blood flow and can be used to investigate arterial blood input to the brain, within the carotid and vertebral arteries. It also measures both blood flow and velocity and does not rely on the assumption of arterial diameter being constant. The disadvantages are that it is costly, requires longer imaging times, and there are more contraindications to MRI scanning compared to ultrasound techniques. A recent study reported impaired vascular reactivity in subjects with IGT and T2DM by measuring changes in retinal vessel diameter to flickering light. 35 However, their exclusion of subjects with retinopathy limits the widespread application of this method to the population of diabetes as a whole.
The main limitation of this study is the relative small sample size. However, our goal was to assess whether abnormalities in cerebrovascular autoregulation are present in IGT. The data presented here at least preliminarily support this view. There are also limitations associated with the use of ACZ. Although it is the most applied stimulus for cerebral vasodilatation in a clinical setting, there is a degree of individual variability in response to a standardised dose of ACZ. While a single 1 g dose of ACZ is often used, this does not necessarily produce a maximum CBF, if it is less than 15 mg/kg. 36 Even with an effective supramaximal ACZ dose, CBF continues to respond to ventilation-induced changes in PCO2 and to changes in blood pressure, 37 both are confounding factors that can affect CBF. Future studies should consider using CO2 inhalation as an alternative stimulus as its administration is non-invasive and easily terminated. 38 Such studies may lead to identification of objective haemodynamic correlates of cerebrovascular disease that may serve as surrogate biological endpoints to evaluate interventions designed to prevent vascular complications of diabetes.
Footnotes
Acknowledgements
The authors would also like to acknowledge the invaluable contributions of the Quantitative MR Angiographers in this study.
Author contributions
D.S. researched data and wrote manuscript; T.H., J.R., E.C., J.M. and R.G. researched data and contributed to discussion; P.D.G. contributed discussion; S.T. and I.D.W. researched data, contributed to discussion and reviewed/edited manuscript.
Declaration of conflicting interests
The author(s) declared no potential conflicts of interest with respect to the research, authorship and/or publication of this article.
Funding
The author(s) received no financial support for the research, authorship and/or publication of this article.