
Abstract
Background:
The formal identification of subgroups with varying levels of risk is uncommon in observational studies of cardiovascular disease, although such insight might be useful for clinical management.
Methods:
Tree-structured survival analysis was utilized to determine whether there are meaningful subgroups at varying levels of cardiovascular disease risk in the Pittsburgh Epidemiology of Diabetes Complications study, a prospective cohort study of childhood-onset (<17 years old) type 1 diabetes.
Results:
Of the 561 participants free of cardiovascular disease (coronary artery disease, stroke or lower extremity arterial disease) at baseline, 263 (46.9%) had an incident cardiovascular disease event over the 25-year follow-up. Tree-structured survival analysis revealed a range of risk groups, from 24% to 85%, which demonstrate that those with short diabetes duration and elevated non–high-density lipoprotein cholesterol have similar cardiovascular disease risk to those with long diabetes duration and that renal disease is a better discriminator of risk in men than in women.
Conclusion:
Our findings suggest that subgroups with major cardiovascular disease risk differences exist in this type 1 diabetes cohort. Using tree-structured survival analysis may help to identify these groups and the interrelationships between their associated risk factors. This approach may improve our understanding of various clinical pathways to cardiovascular disease and help target intervention strategies.
Introduction
As in the general population, cardiovascular disease (CVD) is a major contributor to morbidity and mortality in individuals with type 1 diabetes, however, the risk of CVD is greatly increased. 1 The reasons for this increased risk are not fully understood, as the hyperglycaemia that characterizes type 1 diabetes has been an inconsistent predictor of CVD incidence across studies.2,3 Notably, the sex difference in CVD incidence observed in the general population seems to be narrowed in type 1 diabetes, so that women have nearly the same risk as men.4,5
There is some evidence to support the existence of important subgroups with respect to CVD incidence and risk factors in type 1 diabetes. While nephropathy is considered a major risk factor for CVD in type 1 diabetes, this relationship is not well understood.6–9 Nephropathy seems to affect the presentation of coronary artery disease (CAD), such that individuals with nephropathy are more likely to present with a ‘harder’ or more severe event, such as a myocardial infarction. 1 There is also evidence that the risk factors for CVD differ in men and women, despite their nearly equal risk of developing CVD. 4
Formal identification of important subgroups is not often undertaken in observational cohort studies of CVD. Utilizing methodology to formally identify subgroups at varying levels of risk may reveal relationships between risk factors and outcomes that are not detected using usual methods, such as comparing means, which assesses aggregate data, or regression, which generally assumes a constant increasing risk of an outcome for each unit increment of a risk factor. Neither of these commonly used approaches accounts for potential heterogeneity within the group being studied, the possibility of complex higher order interactions between risk factors or a potential non-linearity or threshold effect of a risk factor on the outcome of interest.10,11 Even when identification of subgroups is attempted, interactions between groups are often not assessed, because it is cumbersome to do so with traditional regression techniques. 11 Studies wherein decision tree methods have been utilized demonstrate the potential importance of such an approach in identifying CVD risk groups.10,12,13 Decision tree analysis of the Western Collaborative Group Study data identified different groups of men, based on interactions between obesity, age and hypertension status, who were at very high risk of coronary heart disease mortality. 10 Also, in an earlier exploration of the Pittsburgh Epidemiology of Diabetes Complications (EDC) study, decision tree methods were used to identify subgroups of participants who were at low risk for diabetes complications based on biologic risk factors. Genetic markers were then examined within the lowest risk groups identified by the trees and, using this approach, associations between the genes and complications emerged that were not observed in the overall study population. 13 These examples demonstrate that decision trees may reveal relationships between risk factors and outcomes that would otherwise remain undetected. Additionally, the resulting trees are potentially well suited for clinical applications, as they are presented in a manner that is often similar to the medical decision-making process. 11 Thus, we used tree-structured survival analysis (TSSA), a hierarchical decision tree method that can accommodate time-to-event outcomes, to determine whether there are meaningful subgroups at varying levels of CVD risk in the Pittsburgh EDC study. In addition to total CVD, specific manifestations of CVD, including CAD, stroke, lower extremity arterial disease (LEAD) and fatal CAD and stroke events, were assessed as separate outcomes to explore whether differences in subgroups and higher order interactions would emerge.
Methods
Study population
The Pittsburgh EDC Study is a prospective cohort study of childhood-onset (<17 years old) type 1 diabetes. All participants were diagnosed, or seen within 1 year of diagnosis, at Children’s Hospital of Pittsburgh between 1950 and 1980. The cohort has been described in detail elsewhere.14,15 In brief, participants have been followed since 1986–1988, initially with biennial examinations for 10 years and thereafter with biennial questionnaires and further examinations at 18 and 25 years post-baseline. Research protocols were approved by the University of Pittsburgh institutional review board and all participants provided written informed consent.
Ascertainment of cardiovascular outcomes
Participants were followed for 25 years to assess the incidence of total CVD, defined as the first instance of CAD (i.e. fatal CAD, myocardial infarction, revascularization procedure, blockage ⩾50%, ischaemic electrocardiogram (ECG) or angina), stroke or LEAD (ankle brachial index, ABI < 0.8, lower limb amputation due to vascular cause or intermittent claudication). Fatal events were ascertained using medical records, death certificates, autopsy reports and/or interview with next of kin and were classified according to the Diabetes Epidemiology Research International (DERI) system. 16 Myocardial infarction, revascularization/blockage and stroke were self-reported by the study participants and confirmed by medical records. Amputation was ascertained by self-report and/or physician examination. ABI was determined using a Doppler blood-flow detector with the subject supine, and ratios for each of the right and left tibialis posterior and dorsalis pedis systolic pressures were calculated with arm systolic pressure as the denominator. Intermittent claudication was assessed using the Rose questionnaire. 17 In addition to total CVD, the following alternative outcomes were assessed: total CAD, stroke, LEAD and CVD mortality (CAD death, fatal myocardial infarction (MI) or fatal stroke). Participants with prevalent CVD at baseline were excluded from analyses of the corresponding outcome.
Risk factor assessment
Fasting blood samples were taken to measure HbA1c, lipids, lipoproteins, serum creatinine and serum albumin. HbA1c values were converted to DCCT (Diabetes Control and Complications Trial)-aligned values using a regression equation derived from duplicate assays [DCCT HbA1c = 0.14 + 0.83 (EDC HbA1c)]. 18 Total cholesterol and triglycerides were determined enzymatically.19,20 High-density lipoprotein (HDL) cholesterol was determined using a modified precipitation technique. 21 Non-HDL cholesterol (non-HDLc) was calculated by subtracting HDLc from total cholesterol. Blood pressure was measured according to the Hypertension Detection and Follow-Up protocol with a random-zero sphygmomanometer. 22 Serum creatinine was measured using an Ectachem 400 Analyzer (Eastman Kodak Co.). Pulse rate (beats/min) was determined by palpitating the radial pulse for 30 s and multiplying by two. Serum and urinary albumin were measured by immunonephelometry. 23 Albumin excretion rate (AER) was calculated for each of three timed urine samples (24-h, overnight and 4-h collections obtained over a 2-week period); the median of the three AERs was used in analyses. Glomerular filtration rate was estimated by the Chronic Kidney Disease Epidemiology Collaboration (CKD-EPI) creatinine equation. 24 White blood cell (WBC) count and haemoglobin were measured using a Coulter Counter S-Plus IV. Fibrinogen was measured using the Biuret method. Height and weight were measured using standard methods to calculate body mass index (BMI). Waist and hip circumference were measured at least twice; the average of each was used to calculate the waist–hip ratio (WHR). Current smoking status was obtained by self-report. Insulin dose was calculated as insulin units per day divided by body weight (kg).
Tree-structured survival analysis
In 1984, Breiman et al. developed Classification and Regression Tree (CART), an algorithm which generated decision trees for continuous and categorical outcomes. 25 The general concept underlying decision tree construction is that attributes are split into subsets (nodes), each of which is homogeneous with respect to the outcome of interest. Split points are based on values of attributes that maximize a criterion quantifying heterogeneity of outcomes among each of the daughter nodes. The largest heterogeneity occurs in the initial split. Subsequent splits can be made on either the same or other attributes. This hierarchical process is repeated recursively until all instances within a node are as homogenous as possible, with regard to outcome classification. Traditionally, decision trees are used to derive subgroups for the prediction of a binary outcome. However, in the 1980s and 1990s, the decision tree framework was extended to accommodate time-to-event survival data with censored observations.26,27 Cross-validation is the most commonly used method for training and testing to find the best tree. Rather than simply building a single tree and holding out a proportion of the data for testing, cross-validation is an iterative process which repeats the process several times on random samples that partition the data into n relatively equally sized subsets (n is usually 5 or 10). One of the subsets is dropped and the tree is refit. This process is repeated for each of the other n−1 subsets and then error rates from the n fits are used to identify the best fitting and most parsimonious tree. 28
In our analyses, we used the rpart routine of R version 3.0.2 (R Development Team 2013) to fit decision trees to the EDC data for the time to CVD event outcome. The rpart routine has been described in detail. 28 Data from EDC participants who were free of CVD at baseline were included in these analyses (n = 561). The list of baseline variables made available for tree building is shown in Table 1. A minimum of 15 observations in each child node was required for further splitting to be considered. The complexity parameter corresponding to the minimum cross-validated error was chosen to prune the tree. Separate trees were also constructed for each manifestation of CVD outcome variable described above, in an attempt to identify subgroups and potentially important interactions between risk factors. Additionally, separate trees were constructed for men and women and for the two diabetes diagnosis subcohorts (1950–1964 vs 1965–1980). We have previously examined these two subcohorts and found that they have significantly different survival experiences. 29
Baseline characteristics of the Pittsburgh EDC cohort by 25-year total cardiovascular disease (CVD) incidence status (n = 561; free of prevalent CVD at baseline).
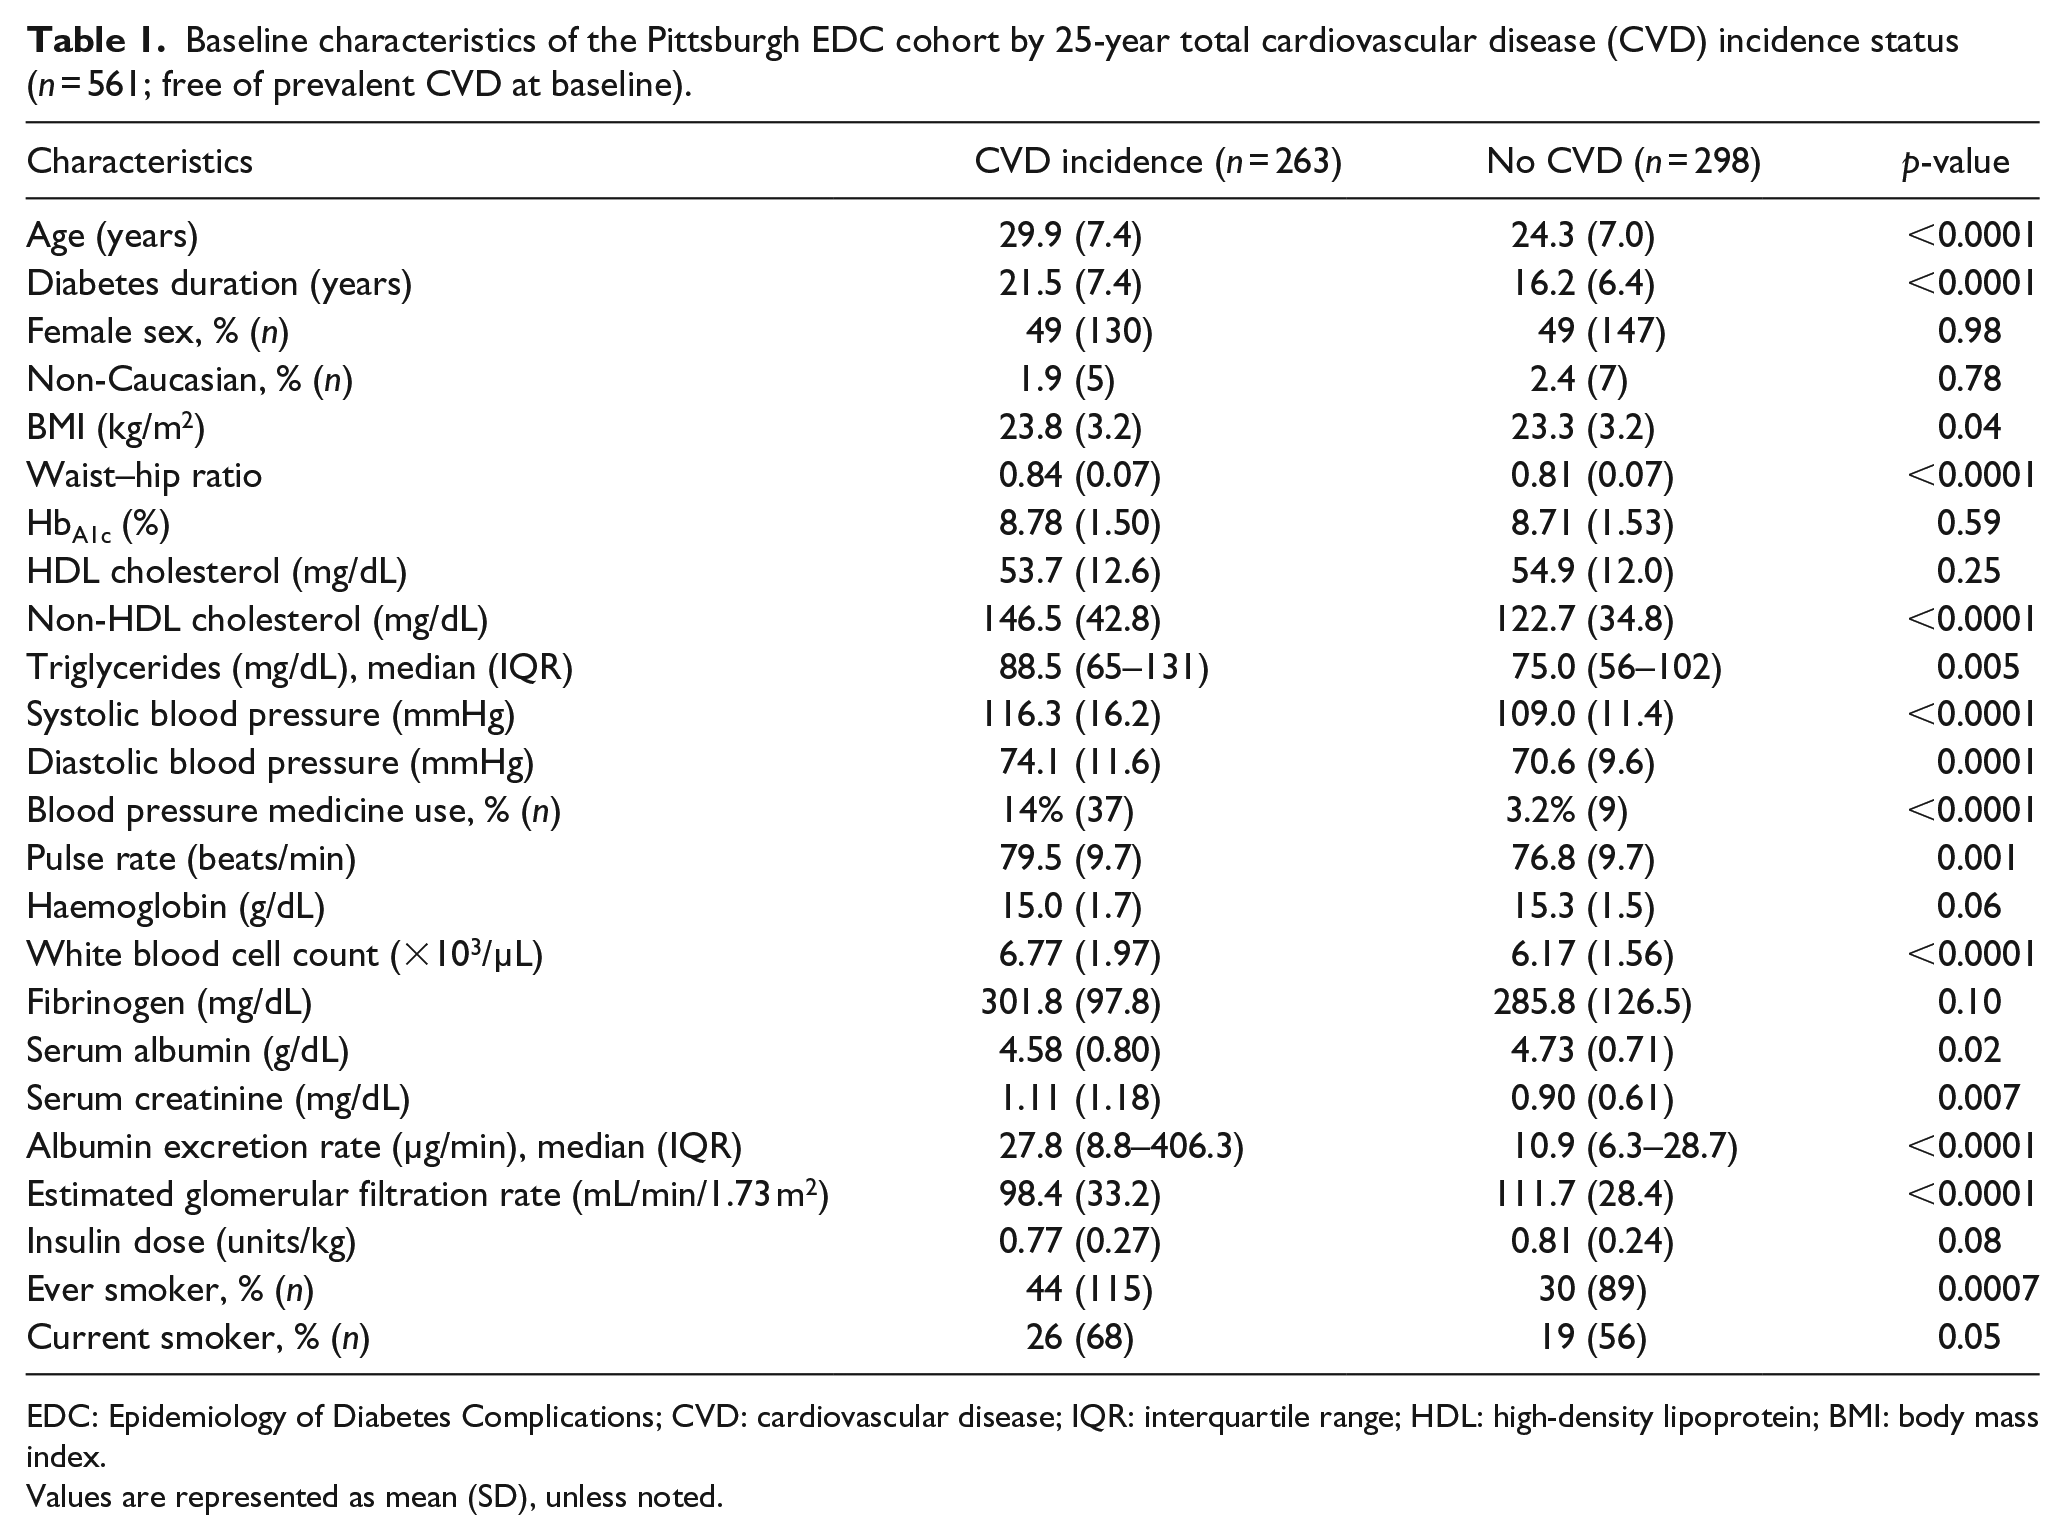
EDC: Epidemiology of Diabetes Complications; CVD: cardiovascular disease; IQR: interquartile range; HDL: high-density lipoprotein; BMI: body mass index.
Values are represented as mean (SD), unless noted.
Results
Of the 561 participants free of CVD at baseline, there were 263 (46.9%) cases of incident CVD over the 25-year follow-up. Participant characteristics at baseline are shown in Table 1. EDC participants who developed CVD were significantly older; had longer diabetes duration, higher BMI, WHR, non-HDLc, triglycerides, systolic and diastolic blood pressures, pulse rate, WBC, serum creatinine and AER; had lower serum albumin, estimated glomerular filtration rate (eGFR) and insulin dose; and were more likely to be smokers.
Total CVD decision tree
The best survival tree for total CVD incidence identified five distinct risk groups (Figure 1). The tree first split on diabetes duration at the selected cut-point of 20.9 years. In those with diabetes duration <20.9 years, and thus low risk, the tree further split on non-HDLc at 132.5 mg/dL (CVD incidence 24.2% below (Group A) and 50.4% above (Group B) the non-HDLc cut-point). In those with diabetes duration ⩾20.9 years, the tree first split on AER at a cut-point of 91.7 µg/min and in those with AER < 91.7 µg/min, a second split on WBC at 7.15 × 10³/µl is identified (CVD incidence 52.5% below (Group C) and 81.5% above (Group D) the WBC cut-point). Finally, in those defined by duration ⩾20.9 years and AER ⩾ 91.7 µg/min, the highest risk group had a CVD incidence of 85.2% (Group E). Kaplan–Meier curves for the five groups confirmed the pattern of CVD incidence identified by the tree (Figure 2). The baseline characteristics of the five groups identified by TSSA are shown in Table 2.
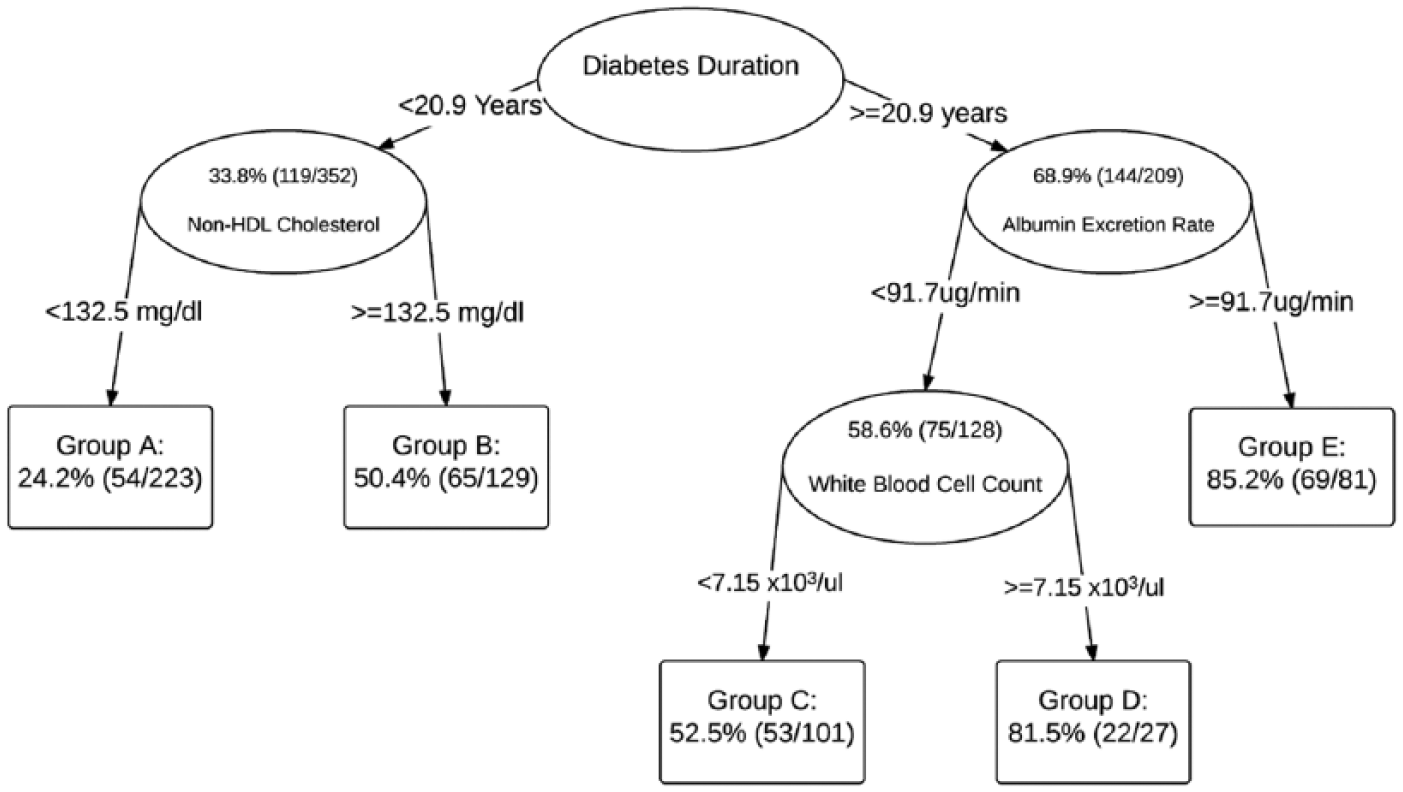
Survival tree for the 25-year incidence of total cardiovascular disease in the Pittsburgh EDC study overall cohort.
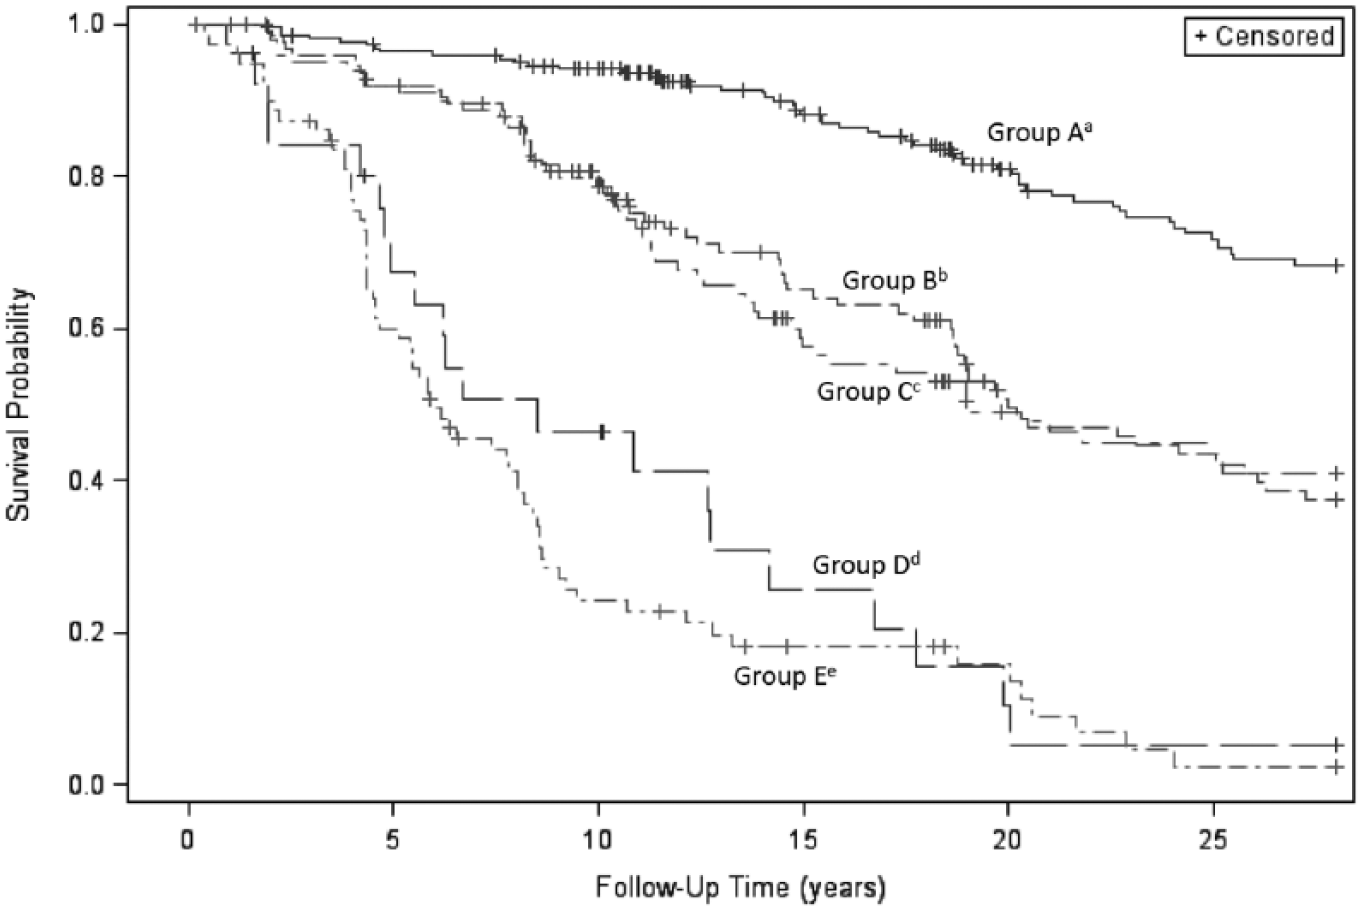
Kaplan–Meier survival curves for the 25-year incidence of total cardiovascular disease by risk groups identified by tree-structured survival analysis.
Baseline characteristics of the five Pittsburgh EDC 25-year total cardiovascular disease (CVD) risk groups identified by tree-structured survival analysis.
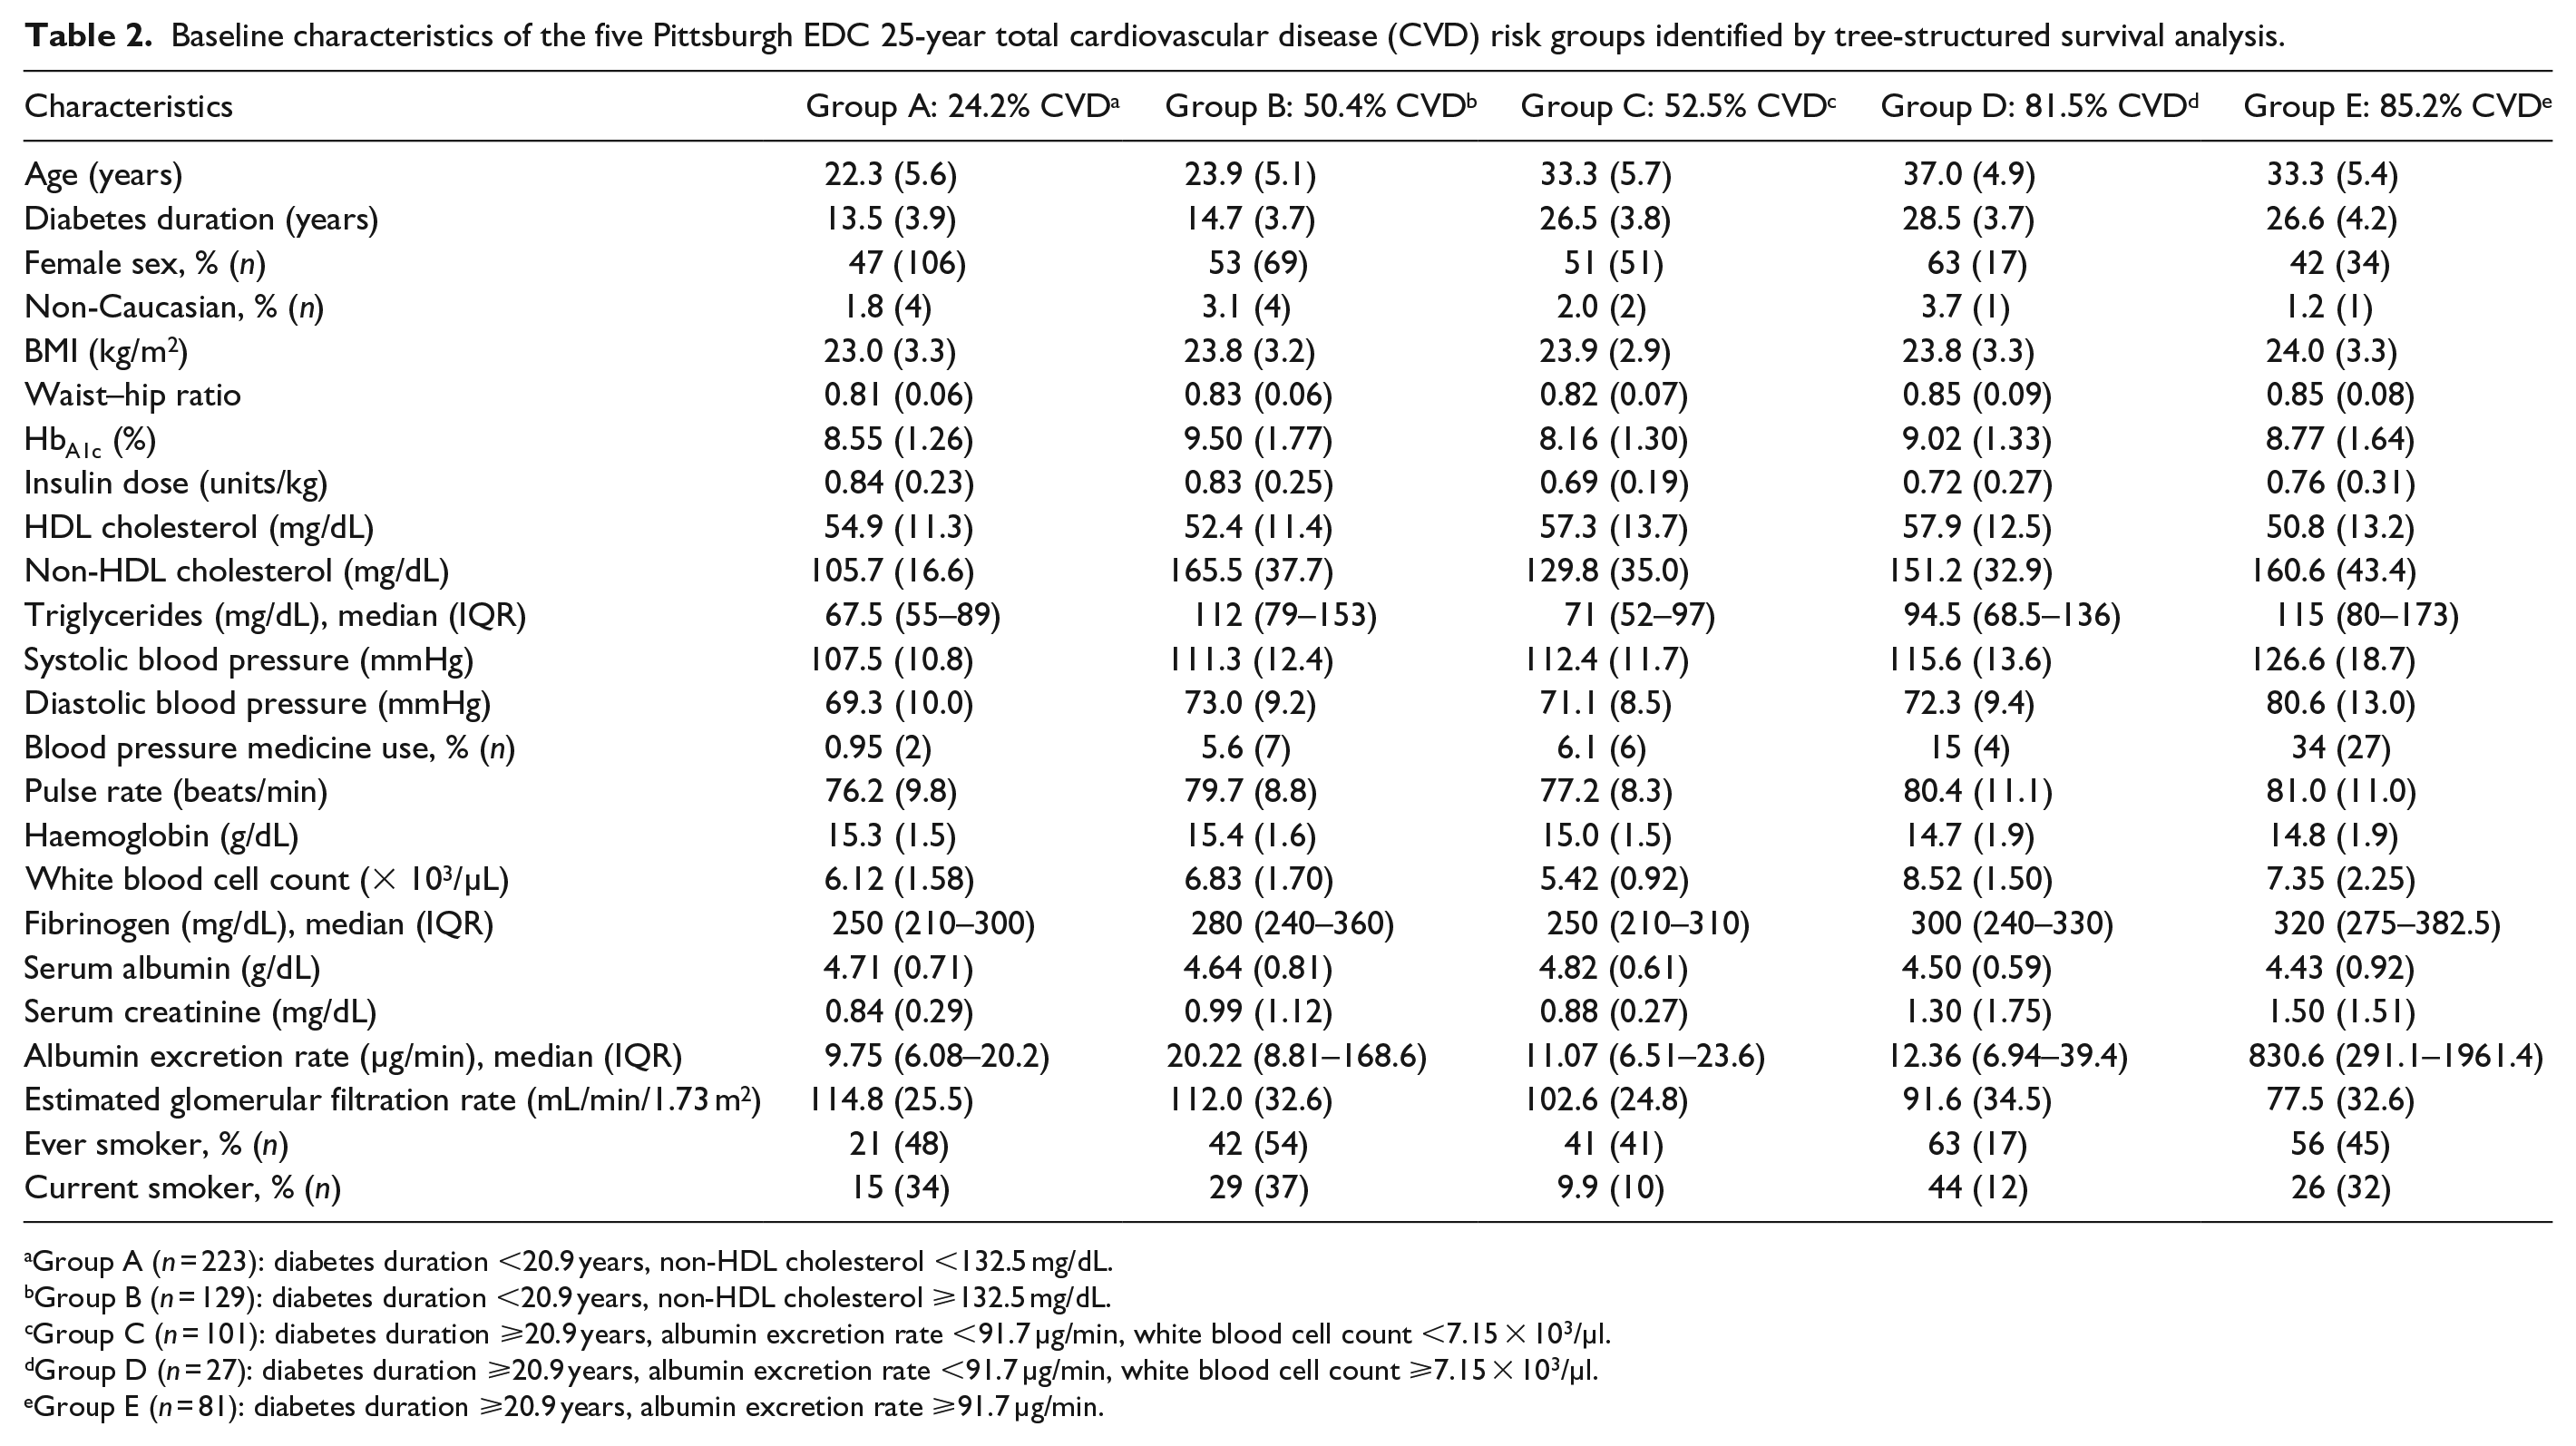
Group A (n = 223): diabetes duration <20.9 years, non-HDL cholesterol <132.5 mg/dL.
Group B (n = 129): diabetes duration <20.9 years, non-HDL cholesterol ⩾132.5 mg/dL.
Group C (n = 101): diabetes duration ⩾20.9 years, albumin excretion rate <91.7 µg/min, white blood cell count <7.15 × 10³/µl.
Group D (n = 27): diabetes duration ⩾20.9 years, albumin excretion rate <91.7 µg/min, white blood cell count ⩾7.15 × 10³/µl.
Group E (n = 81): diabetes duration ⩾20.9 years, albumin excretion rate ⩾91.7 µg/min.
Separate decision trees were also derived for total CVD incidence by sex and diabetes diagnosis subcohort (1950–1964 vs 1965–1980) (Figure 3). In women (Figure 3(a)), the 25-year incidence of CVD was 46.9% (130 cases) and the tree first split on diabetes duration at 17.6 years. In lower risk women with diabetes duration <17.6 years, non-HDLc further discriminated CVD risk, with a chosen cut-point of 125.3 mg/dL (CVD incidence 13% below and 46% above cut-point). In women with diabetes duration ⩾17.6 years, no further discriminating factors were identified, and the 25-year risk of CVD was 66%. In men (Figure 3(b)), there was a similar 46.8% (133 cases) 25-year incidence of CVD, but the tree first split on AER at 104.3 µg/min. In men with AER <104.3 µg/min, the tree split on non-HDLc. Those with non-HDLc <133.2 mg/dL had a 24.1% 25-year risk of CVD, while those with non-HDLc ⩾133.2 mg/dL WHR further discriminated risk (CVD incidence 0% below and 64.3% above cut-point). Men with AER ⩾104.3 µg/min had the highest risk and the tree further split on diabetes duration at 26 years (CVD incidence 65.2% below and 96.2% above cut-point).
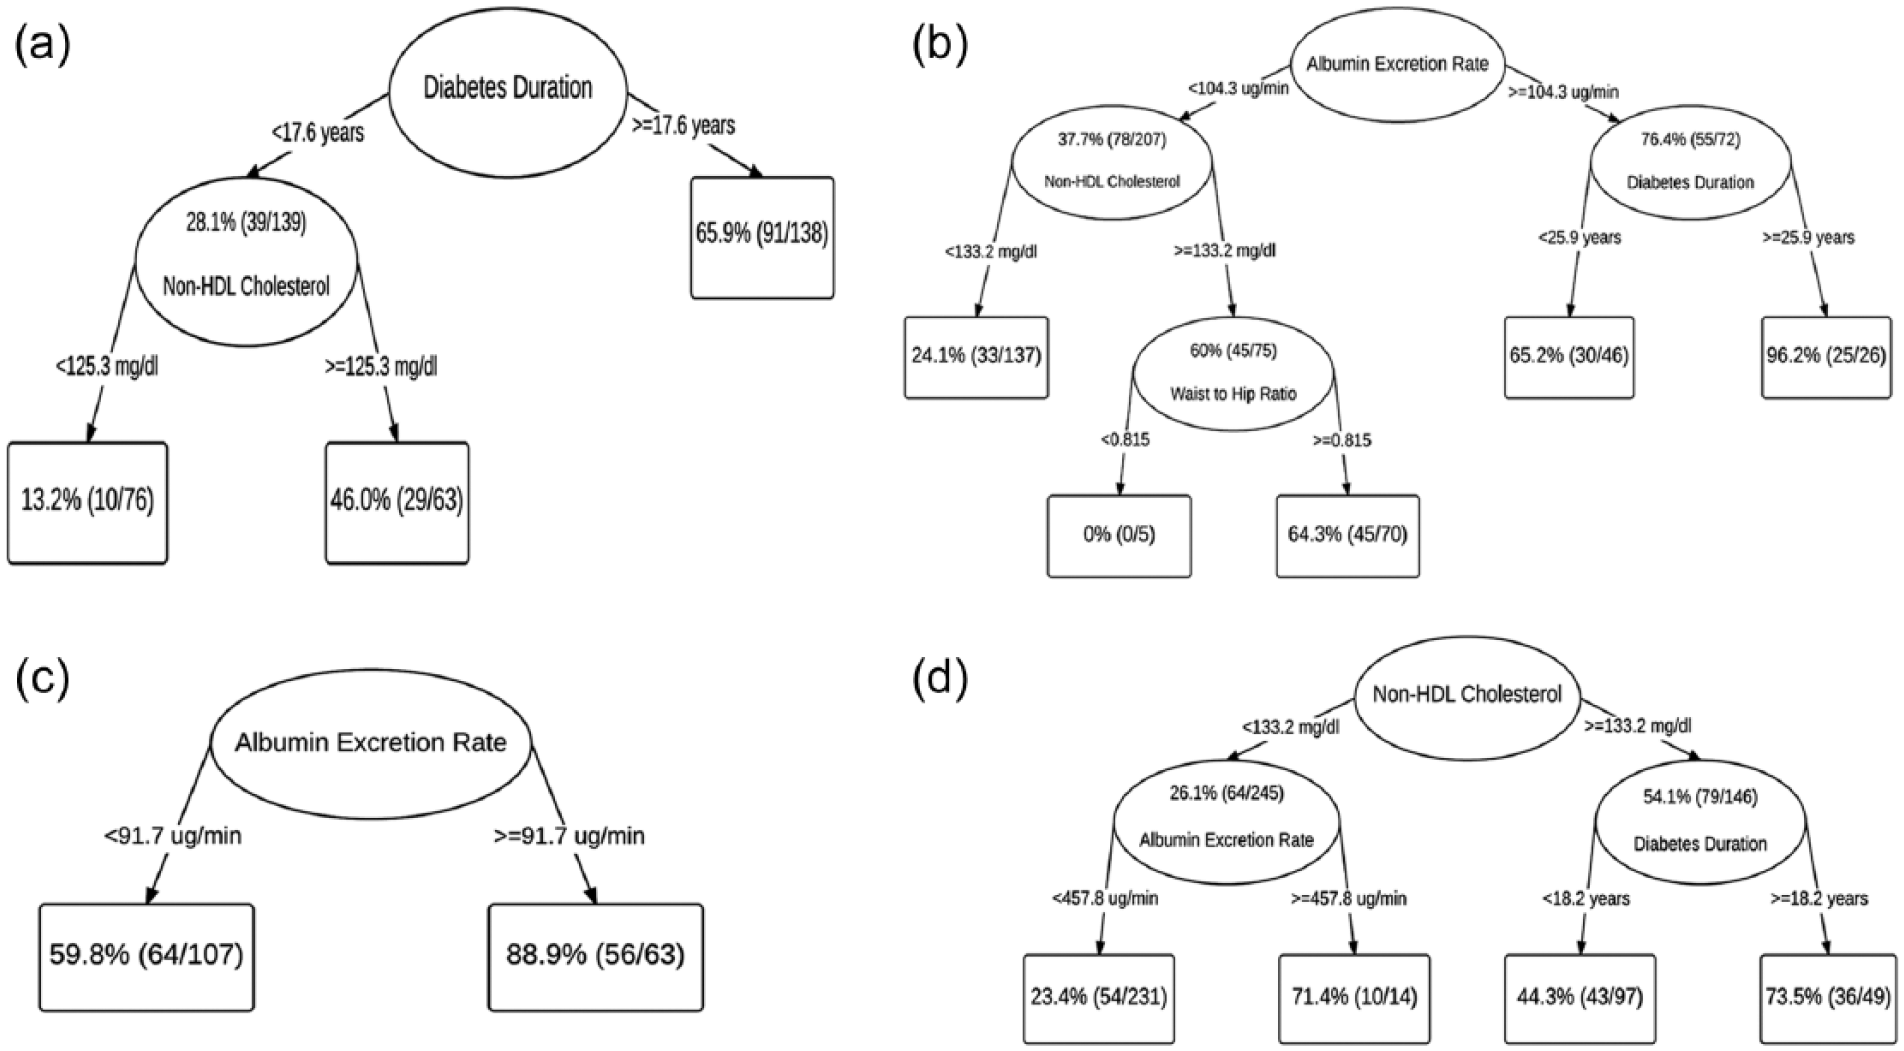
Survival trees for the 25-year incidence of total cardiovascular disease: (a) women, (b) men, (c) type 1 diabetes diagnosed 1950–1964 subcohort, (d) type 1 diabetes diagnosed 1965–1980 cohort.
In the 1950–1964 subcohort (Figure 3(c)), the 25-year incidence of CVD was 70.6% (120 cases) and the tree split only on AER at 91.7 µg/min (CVD incidence 59.8% below and 88.9% above cut-point). The 1965–1980 subcohort (Figure 3(d)) had a 36.6% (143 cases) 25-year CVD incidence. The tree first split on non-HDLc at 133.2 mg/dL. In those with non-HDLc <133.2 mg/dL, the tree split on AER: those with AER <458 µg/min had 23.4% risk, while those with AER ⩾458 µg/min had 71.4% risk. In those with non-HDLc ⩾133.2 mg/dL, diabetes duration further discriminated risk, such that those with duration <18.2 years had 44.3% risk and those with duration ⩾18.2 years had 73.5% risk.
Specific manifestations of CVD
The best fitting survival trees for the specific manifestations of CVD are shown in Figure 4. The 25-year incidence of CVD death was 17.0% (112 deaths). The tree for CVD mortality (Figure 4(a)) first split on AER. In those with AER<26.93 μg/min diabetes duration further discriminated risk of CVD mortality at a cut-point of 23.09 years in those with AER <26.93 µg/min. Diabetes duration was also selected as the discriminating factor in those with AER ⩾26.93 µg/min, but at a slightly lower cut-point of 21.95 years (Figure 4(a)).
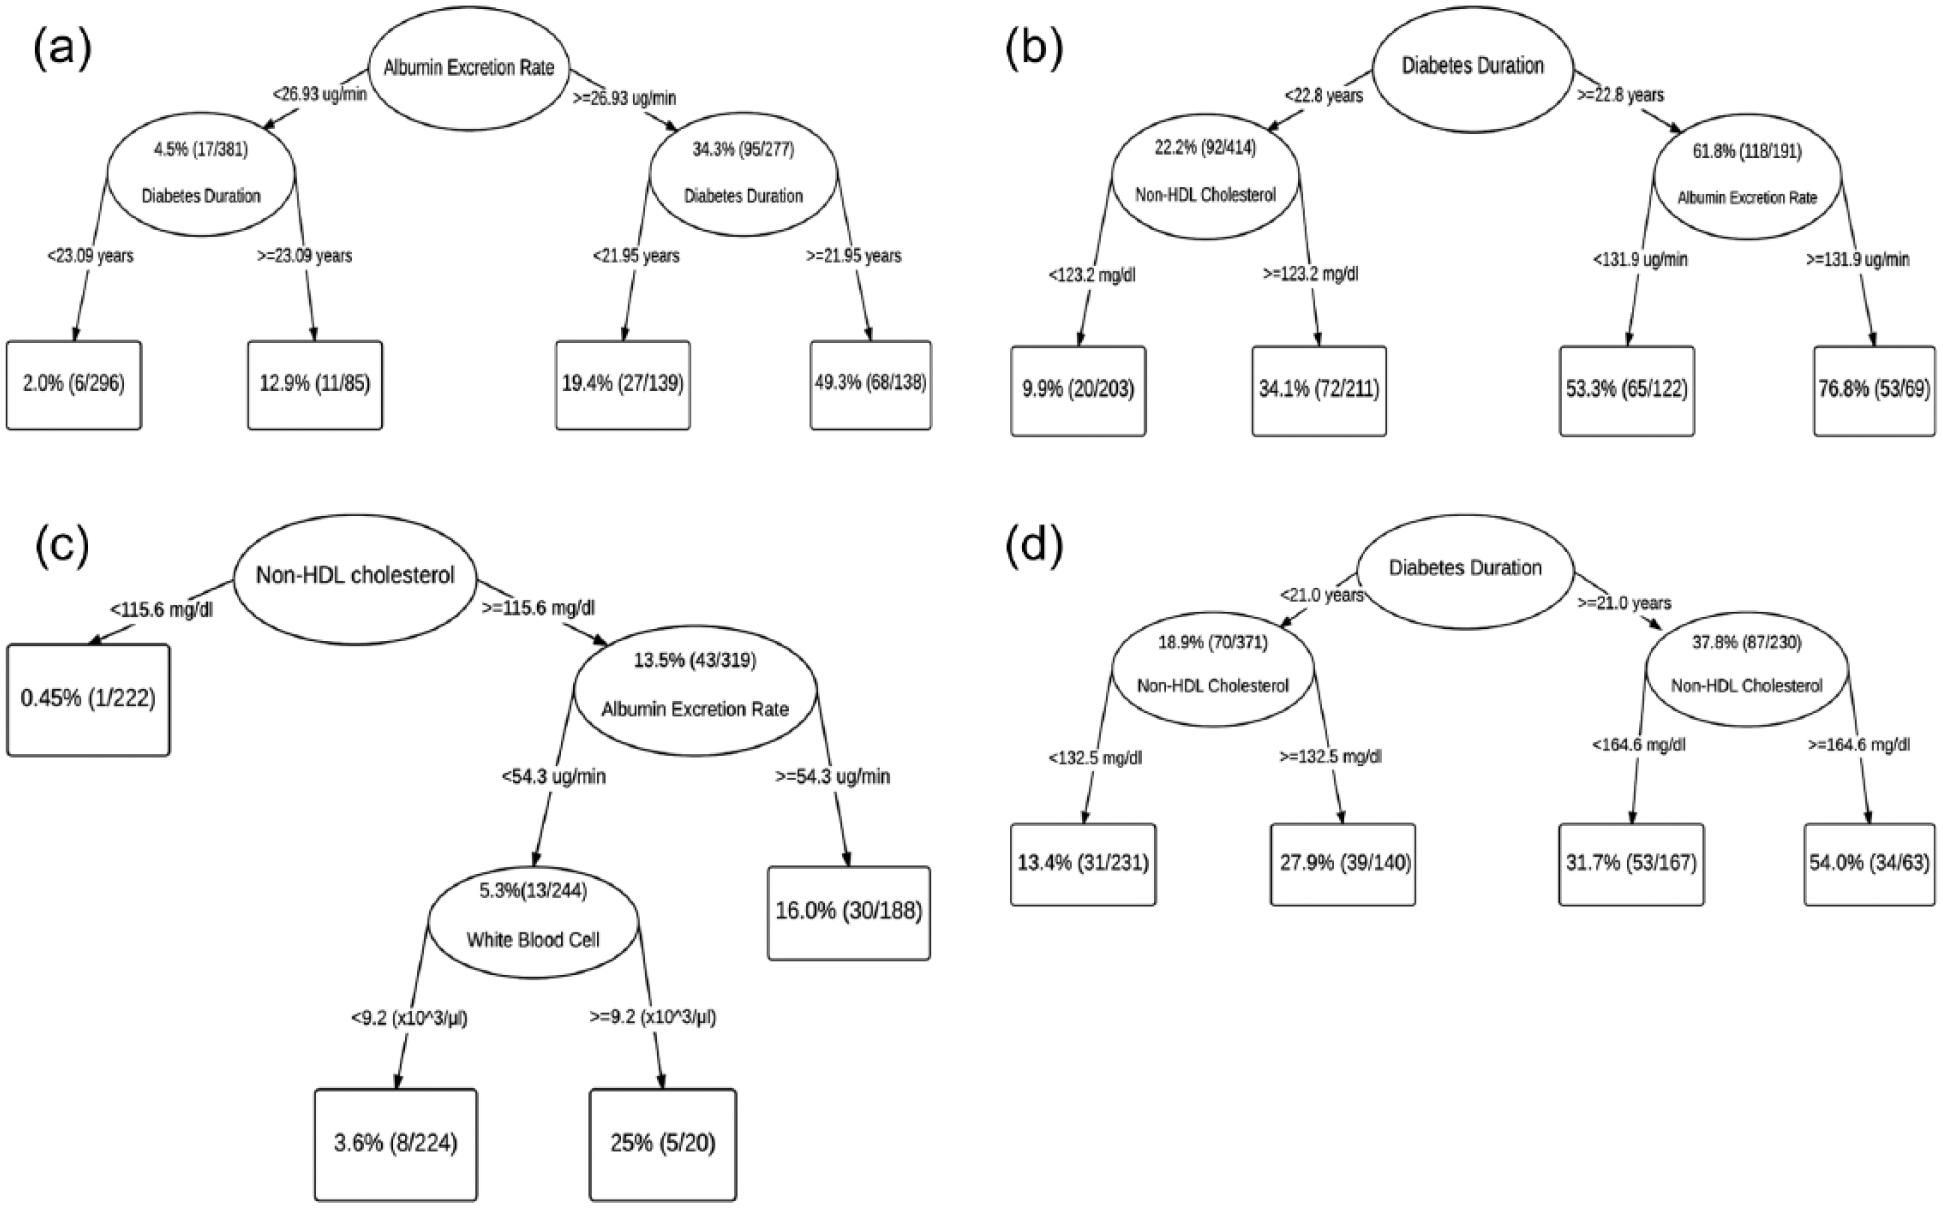
Survival trees for the 25-year incidence of the specific manifestations of cardiovascular disease: (a) cardiovascular mortality, (b) coronary artery disease, (c) stroke, (d) lower extremity arterial disease.
For CAD, the 25-year incidence was 34.7% (210 cases out of 605 free of CAD at baseline), with the first split on diabetes duration at the selected cut-point of 22.8 years (Figure 4(b)). In those with diabetes duration <22.8 years, the tree further split on non-HDLc at 123.2 mg/dL, while in those with diabetes duration ⩾22.8 years the tree further split on AER at 131.9 µg/min.
The 25-year incidence of stroke was 6.7% (44 cases out of 654 free of stroke at baseline). The tree for stroke (Figure 4(c)) first split on non-HDLc at 115.6 mg/dL. In those with non-HDLc <115.6 mg/dL, no further splits were selected, but in those with non-HDLc ⩾115.6 mg/dL, stroke risk split on AER at 54.3 µg/min, with the lower AER group further splitting on WBC at 9.2 × 10³/µl.
The 25-year incidence of LEAD was 26.1% (157 cases out of 601 free of LEAD at baseline). For LEAD (Figure 4(d)), diabetes duration was chosen for the first split, such that with diabetes duration <21 years, the tree split on non-HDLc at 132.5 mg/dL. Likewise, in those with diabetes duration ⩾21 years, the tree also split on non-HDLc, but at a higher cut-point of 164.6 mg/dL.
Discussion
TSSA of the EDC study data suggest that subgroups with major CVD risk differences exist in this cohort of childhood-onset type 1 diabetes over 25 years of follow-up and that these subgroups are identifiable by threshold effects of continuously measured risk factors measured only once at baseline. A wide range of CVD risk was observed across the TSSA-identified subgroups, ranging from 24% to 85% over the 25-year follow-up. Though various combinations of diabetes duration, non-HDLc and/or AER, generally discriminated risk for both total CVD and the specific manifestations of CVD, the identified optimal cut-points of the risk factors varied and WBC and WHR also discriminated in some subgroups.
For total CVD, five subgroups were identified through varying combinations of risk factors and they corresponded to three levels of CVD risk. The lowest risk (24.2%) group was characterized by shorter diabetes duration/younger age and had a relatively good risk factor profile (Group A). Two moderate risk groups were identified: one with shorter diabetes duration/younger age and non-HDLc ⩾132.5 mg/dL (Group B, CVD risk 50.4%) and the other with longer diabetes duration/older age, but a relatively good risk factor profile (Group C, CVD risk 52.5%). The nearly equivalent 25-year CVD risk in these two groups suggests that moderate dyslipidemia can ‘accelerate’ CVD risk in shorter duration type 1 diabetes to the equivalent of older, longer duration individuals. Further examination of the risk factor profile of Group B showed that the mean non-HDLc was 165.5 (standard deviation (SD) = 37.7) and HbA1c was 9.5 (SD = 1.8), both of which were the highest of all of the five groups identified by TSSA (Table 2). These results provide considerable support for more intensive lipid and HbA1c control in short duration type 1 diabetes. Finally, two high-risk groups were identified: both had longer diabetes duration/older age, but one mostly female, characterized by higher WBC and smoking rates (Group D, CVD risk 81.5%), and the other mostly male, characterized primarily by renal disease (Group E, CVD risk 85.2%).
That AER was the primary factor discriminating risk at longer, but not shorter, duration may be related to more severe albuminuria as diabetes duration increases. The chosen AER cut-point of approximately 92 µg/min falls within the microalbuminuria range (20–200 µg/min). However, further investigation (Table 2) of the group with AER >92 µg/min (Group E) showed that the majority had overt nephropathy (AER > 200 µg/min), which is a well-established CVD risk factor in type 1 diabetes.6–9 Within the lower AER group, WBC further discriminated total CVD risk, such that those with lower AER, but higher WBC (Group D, 82% CVD risk) were at nearly equivalent risk to those with higher AER (Group E, 85% CVD risk). Further examination of Group D showed that it had the highest rate of smoking of the five groups identified by the TSSA analyses (Table 2), which may contribute to both high WBC levels and CVD rate of this group.
When separate trees were fit by sex, AER only discriminated CVD risk in men. This supports the earlier observation that renal disease may be a more important CVD risk factor in men compared to women. 4 Non-HDLc discriminated risk in men only if AER was lower. In women, diabetes duration was the major discriminating factor, and non-HDLc further discriminated CVD risk in those with shorter diabetes duration.
In the earlier 1950–1964 diagnosis cohort, AER was the only discriminating factor identified, which concurs with the total CVD tree, where AER was important at longer diabetes duration. In contrast, the 1965–1980 diagnosis cohort first split on non-HDLc and AER only discriminated risk at lower levels of non-HDLc. Interestingly, the lower non-HDLc/higher AER group had nearly the same CVD risk as the higher non-HDLc/longer duration group (71% and 74%, respectively). The differences in the trees between the two diagnosis cohorts support the evidence that there may be a declining role of renal disease on CVD. Rates of renal disease, particularly end-stage renal disease, have declined with time and albuminuria has been shown to be less likely to precede CVD than previously reported.15,30
The tree for CVD mortality first split on AER at a cut-point of 26.9 µg/min. This cut-point is close to the cut-point used to define the lower limit of microalbuminuria (20–200 µg/min), which is strongly associated with higher all-cause mortality and CVD rates in type 1 diabetes.9,31,32 Diabetes duration modified risk at both levels of AER, such that having duration ⩾23 years was associated with a sixfold increase in risk within the lower AER group and having duration of ⩾22 years was associated with an approximately 2.5-fold risk within the higher AER group.
The tree for CAD was similar to the total CVD tree, which is not surprising, as CAD was the most common manifestation CVD in this cohort. The chosen optimal cut-points for the risk factors differed slightly than those chosen for total CVD, with the non-HDLc cut-point in the CAD tree being 9 units lower than in the total CVD tree (123 and 132 mg/dL, respectively). Conversely, the AER cut-point was 40 units higher in the CAD compared to the total CVD tree (132 and 92 µg/min, respectively).
For stroke, non-HDLc <115.6 mg/dL was associated with very low risk of <0.5% over 25 years. The combination of non-HDLc ⩾115.6 mg/dL and AER ⩾54.3 µg/min led to a moderate 16% risk of stroke. Interestingly, having higher non-HDLc and WBC ⩾9.2 × 10³/µl, but lower AER, led to the highest level of risk, at 25%. This relationship between very elevated WBC and stroke merits further study. WBC has been reported as a risk factor for stroke in the EDC study, as well as in the general population, but a threshold effect at such a high WBC level on the long-term risk of stroke has not been previously reported, to our knowledge.33–35 Generally, little is known about the predictors of stoke in type 1 diabetes, as there have been few reports. Serum lipids have been associated with stroke incidence in the Fremantle and EDC studies, but not in the WHO Multinational Study of Vascular Disease in Diabetes (WHO MSVDD), while nephropathy was shown to be strongly associated with stroke in both the EDC and the MSVDD.33,36,37
Finally, the tree for LEAD split on diabetes duration and then, within both shorter and longer duration, split on non-HDLc at 132.5 mg/dL and 164.6 mg/dL, respectively. The shorter duration/higher non-HDLc group had nearly the same risk of LEAD as the longer duration/lower non-HDLc group (28% and 32%, respectively), again underscoring the importance of lipid control in type 1 diabetes, especially with diabetes duration <25 years. This relatively short duration corresponds to an average age of only 33 years in this cohort of childhood-onset type 1 diabetes. That non-HDLc was the major discriminating factor concurs with the results from an earlier analysis of the EDC study at 6 years of follow-up, which found that serum lipids predicted LEAD, but renal damage did not. 38 In the general population, serum lipids have also been strongly associated with the development of LEAD.39,40
Strengths and limitations
The EDC cohort is a prospective study with 25 years of follow-up to ascertain CVD outcomes. The cohort is well characterized, with data available for many clinical risk factors, and represents a wide range of diabetes diagnosis years. CVD events were verified using death certificates and medical records by reviewers masked to risk factor status. One limitation of the study is that the cohort is 98% Caucasian, due to the demographics of Allegheny County, Pennsylvania (<15% African American), and lower type 1 diabetes incidence among African Americans during the period when the cohort was diagnosed, so it is not known if these results apply to other groups. There is also a potential for ‘survivor bias’, particularly in the older 1950–1964 diagnosis subcohort, because prevalent cases of CVD were excluded from these analyses of incident events. Only baseline risk factor data were included as predictors in these analyses, thus we cannot account for the impact of patterns of risk factor change over time. However, this situation is very appropriate for clinicians having only a single data point available. Finally, TSSA is considered to be an exploratory method and these results require external validation in other type 1 diabetes cohorts before they can be applied in clinical settings. In particular, TSSA is not easily amenable to the construction of models where inferential statements (using, for example, p-values) can be made about the data.
In conclusion, TSSA of the EDC study data suggests that subgroups with major CVD risk differences are identifiable by threshold effects of continuously measured risk factors. In many cases, similar levels of CVD risk are reached through different combinations of risk factor groupings. For total CVD, a high-risk group with shorter diabetes duration was identified which suggests that elevated non-HDLc increases CVD risk to the level of a longer diabetes duration group. Within longer diabetes duration individuals, two high-risk groups were identified through distinct pathways: one mostly female, with high rates of smoking and WBC, and the other mostly male, characterized by renal disease. Utilizing decision tree methods to identify subgroups at higher levels of risk in this manner may help to shed light on the various pathways leading to CVD outcomes, particularly by elucidating the interrelationships between risk factors. Further study, including external validation, is needed to better determine the prognostic utility of TSSA and the identification of subgroups at varying levels of CVD risk in type 1 diabetes.
Footnotes
Declaration of conflicting interests
Trevor J. Orchard provides consulting for Eli Lilly and Company and Profil Institute for Clinical Research. The other authors have no potential conflicts to declare.
Funding
Research reported in this manuscript was supported by the National Institute of Diabetes and Digestive and Kidney Diseases at the National Institutes of Health (Grant No. R01-DK034818) and the Rossi Memorial Fund. Stewart J. Anderson is supported by NIH (Grant No. P30-MH090333). The content is solely the responsibility of the authors and does not necessarily represent the views of the National Institutes of Health.