
Abstract
Objective:
This study evaluates cardiac autonomic neuropathy and heart rate variability according to the vitamin D status in type 2 diabetes mellitus.
Methods:
A total of 163 patients were recruited. Cardiac autonomic neuropathy was assessed using five tests according to Ewing’s protocol. The time and frequency domains of the heart rate variability were also evaluated. Patients were separated into three groups: vitamin D sufficient [25(OH)D ⩾ 20 ng/mL], vitamin D insufficient [10 ⩽ 25(OH)D < 20] and vitamin D deficiency [25(OH)D < 10] groups.
Results:
Both standard deviation of normal-to-normal RR intervals and square root of the average of the sum of the squares of the differences between adjacent NN intervals in the supine position were significantly lower in vitamin D deficient group. Low frequency/high frequency ratio in the upright position was significantly higher in the vitamin D deficient group. 25(OH)D levels are positively correlated with standard deviation of normal-to-normal RR intervals in the supine position. In multivariate logistic analysis, patients with vitamin D levels of 10 < 25(OH)D < 20 ng/mL showed borderline significantly lower cardiac autonomic neuropathy risk than those with 25(OH)D levels <10 ng/mL (odds ratio = 0.45 (0.23–1.01), p = 0.051).
Conclusion:
Vitamin D deficiency was significantly correlated with heart rate variability parameters. However, there was only borderline significant association between vitamin D concentration and presence of cardiac autonomic neuropathy. Therefore, future studies are required to establish a relationship between vitamin D levels and cardiac autonomic neuropathy.
Keywords
Introduction
Recently, vitamin D’s non-skeletal pleiotrophic effects have attracted a lot of attention worldwide.1,2 Vitamin D receptors are distributed in most cells and tissues of the body including the vascular smooth cells, endothelium and cardiomyocytes of the cardiovascular system. It has been suggested that vitamin D deficiency may cause myocyte hypertrophy, vascular remodelling and inflammation. 1 Several studies have demonstrated that vitamin D deficiency is associated with cardiovascular disease (CVD) and all cause mortality not only in high-risk CVD populations but also in the general population.3 –6 Vitamin D deficiency is very common irrespective of age, race, geographical location and country.7,8 In addition, the prevalence of vitamin D deficiency is higher in patients with type 2 diabetes mellitus (T2DM) than in those without diabetes mellitus (DM). 9 Increasing evidence also suggests that low vitamin D is associated with the risk of developing T2DM.10,11 In addition, a few studies have reported that vitamin D may play a role in the development of diabetic complications.12,13
Cardiac autonomic neuropathy (CAN) is one of the most common complications of diabetes and is a significant cause of morbidity and mortality in diabetic patients.14,15 Autonomic imbalance, characterized by a hyperactive sympathetic system and a hypoactive parasympathetic system, is associated with CVD in diabetes. 16 The heart rate variability (HRV) has been used to assess autonomic imbalance, disease and mortality. 17 Low HRV and sympathetic hyperactivity are predictors of CVD. 18 Until now, only a few studies had investigated the relationship between vitamin D deficiency and HRV or impaired cardiac autonomic function in an apparently healthy population.
To the best of our knowledge, no prior reports have been published regarding the association between vitamin D deficiency and CAN including HRV in T2DM. The purpose of this study, therefore, was to evaluate the relationship between vitamin D status and cardiac autonomic functions using Ewing’s test and HRV in patients with T2DM.
Methods
Study population
The study design was a retrospective. A total of 257 diabetic patients who underwent diabetic complication studies at a diabetes clinic of Soonchunhyang University Bucheon Hospital between January 2011 and December 2013 were screened for the study. Patients were excluded if they had type 1 diabetes, were taking beta-blockers, calcium, vitamin D supplementation or osteoporosis therapies, had uncontrolled thyroid or parathyroid disease or were not available for cardiac autonomic function testing and fasting serum samples. A total of 163 T2DM patients (84 males and 79 females, mean age: 56.8 years) were ultimately included in the study. We used patients’ medical records to carefully review their demographic data, biochemical data, clinical and treatment histories. Hypertension (HTN) was diagnosed by the following criteria: systolic blood pressure (BP) ⩾ 140 or diastolic BP ⩾ 90, history of HTN or the use of antihypertensive agents. T2DM was diagnosed when subjects had one among a fasting plasma glucose ⩾126 mg/dL, glycated haemoglobin (HbA1c) ⩾ 6.5%, a self-reported history of diabetes or use of antidiabetic medications. 19 All patients were informed about the purpose of this study and consented to their participation. This study was approved by the Institutional Review Board of Soonchunhyang University School of Medicine, Bucheon Hospital.
Anthropometric and biochemical measurements
Height and weight were measured to the nearest 1.0 cm and 1.0 kg, respectively. Body mass index (BMI) was calculated as body weight (kg) divided by height squared (m2).
Blood samples were taken after overnight fasting. Fasting glucose, C-peptide levels, HbA1c and lipid profiles were measured. HbA1c was measured by ion-exchange high-performance liquid chromatography (Bio-Rad, Hercules, CA, USA). Fating glucose was measured using hexokinase method (Hitachi Modulator D2400; Roche, Tokyo, Japan). Total cholesterol (TC), low-density lipoprotein cholesterol (LDL-C) and triglyceride (TG) were determined using the liquid enzymatic method with an automatic biochemical analyser (7600-110; Hitachi Inc., Tokyo, Japan), and high-density lipoprotein cholesterol (HDL-C) was measured by the selective inhibition method. Serum C-peptide was measured using an immunoradiometric assay kit. Insulin resistance was calculated using the homeostasis model assessment of insulin resistance (HOMA-IR) according to the following formula: [fasting insulin (µIU/mL) × fasting blood glucose (mmol/L)]/22.5.
Diabetic nephropathy (DN) was defined according to albuminuria, which was measured by radioimmunoassay (Immunotech, Prague, Czech Republic). Urine albumin <30 mg/g creatinine was categorized as normoalbuminuria, 30–300 mg/g creatinine as microalbuminuria and ⩾300 mg/g creatinine as overt proteinuria. Patients were considered to have nephropathy if they showed microalbuminuria or overt proteinuria. Estimated glomerular filtration rate (eGFR) was calculated using the Modification of Diet in Renal Disease Study equation.
Diabetic retinopathy (DR) was defined based on findings of dilated pupils on fundoscopy carried out by an ophthalmologist. DR was defined as having non-proliferative retinopathy or proliferative retinopathy. 20
An automated device (VP-1000; Colin, Komaki, Japan) was used to measure arterial pulse wave velocity (PWV) and ankle-brachial index (ABI).
Cardiac autonomic function testing
Autonomic function tests (AFT) were performed by a single operator in the morning in a quiet room and were analysed by one investigator. Subjects were advised to refrain from smoking, eating and drinking coffee for at least 2 h before the tests.
CAN was assessed using the five standard cardiovascular reflex tests according to Ewing’s protocol. 21 Three of these measurements mainly assess parasympathetic function. These are the heart rate (HR) responses to deep breathing (beat-to-beat variation), to standing (30:15 ratio) and to the Valsalva manoeuvre. The other two tests mainly assess sympathetic function. These include the BP responses to standing and to a sustained handgrip. The HR responses to deep breathing, standing and the Valsalva manoeuvre were assessed automatically from electrocardiography (ECG) recordings using the DICAN evaluation system (Medicore Co. Ltd, Seoul, South Korea). The results of each of the five tests were classified into three categories based on the severity of the abnormality detected. Each of them was given a definite point, as previously described by Bellavere et al. 22
Determining the CAN score
The CAN severity was quantitated by adding the points obtained from each of the five tests. Each test was given a point of 0, 0.5 or 1 if it yielded normal, borderline or abnormal values, respectively. Regarding HR responses to deep breathing, ‘abnormal’ was defined as a difference between maximal HR and minimal HR less than 10; ‘borderline’ as a difference of 11–14 and ‘normal’ as a difference of more than 15. Regarding HR responses to standing, ‘abnormal’ was defined as a ‘30 beat RR interval/15 beat RR interval’ ratio of less than 1.00; ‘borderline’ as a ratio of 1.01–1.03 and ‘normal’ as a ratio of more than 1.04. Regarding Valsalva manoeuvre, ‘abnormal’ was defined as a ratio of the longest RR to shortest RR interval of less than 1.10; ‘borderline’ as a ratio of 1.11–1.20 and ‘normal’ as a ratio of more than 1.21. In BP responses to standing, ‘abnormal’ was defined as a difference in systolic BP between lying down and after standing up of more than 30 mmHg; ‘borderline’ as a difference of 11–29 mmHg and ‘normal’ as a difference of less than 10 mmHg. In BP responses to handgrip, ‘abnormal’ was defined as a difference in diastolic BP between before and after handgrip of less than 10 mmHg; ‘borderline’ as a difference of 11–15 mmHg and ‘normal’ as a difference of more than 16 mmHg. Consequently, the minimum and maximum autonomic neuropathy points were 0 and 5, respectively. CAN was defined as the presence of at least two abnormal tests or a sum of autonomic neuropathy points of ⩾2. 23
The CAN score was categorized as follows: CAN score 0 (total points 0), CAN score 1 (points 0.5–1.5), CAN score 2 (points 2–3) and CAN score 3 (points ⩾ 3.5). CAN was considered absent, early, definite or severe if the CAN scores were 0, 1, 2 or 3, respectively.
Time domain and frequency domain of the HRV
Time domain variables
The standard deviation of normal-to-normal RR intervals (SDNN; ms, correlated to total autonomic activity) and square root of the average of the sum of the squares of the differences between adjacent NN intervals (RMSSD; ms, correlated to parasympathetic activity) were calculated.
Frequency domain variables
The total power in the frequency range of 0–0.40 Hz was divided into very low frequency (VLF: <0.04 Hz), low frequency (LF: 0.04–0.15 Hz, modulated by sympathetic nervous system (SNS)) and high frequency (HF: 0.15–0.4 Hz, modulated by parasympathetic nervous system (PNS)). LF and HF were measured in normalized units, which represent the relative value of each power component in proportion to the total power minus the VLF component. The LF/HF ratio was also calculated, which represents the balance of cardiac sympathetic-to-parasympathetic tone.
Measurement of serum vitamin D levels
The 25(OH)D concentration was measured using a radioimmunoassay (CIS Bio International, Paris, France). The patients were separated into three groups depending on their 25(OH)D levels: vitamin D sufficient [n = 43, 25(OH)D ⩾ 20 ng/mL], vitamin D insufficient [n = 88, 10 ⩽ 25(OH)D < 20 ng/mL] and vitamin D deficiency [n = 32, 25(OH)D < 10 ng/mL]. Vitamin D deficiency was defined as a 25(OH)D < 10 ng/mL in accordance with the World Health Organization (WHO) guidelines and the Institute of Medicine.24 –26
Statistical analysis
Statistical analyses were performed using SPSS 14.0 (SPSS, Inc., Chicago, IL, USA). Data are reported as mean ± standard deviation (SD) for normally distributed variables, as median (interquartile range) for variables that were not normally distributed or as number of participants (%). Non-normally distributed variables, including TG, high-sensitivity–C-reactive protein (hs-CRP) and HOMA-IR, were transformed into natural logarithms before analysis. Chi-square test was used to compare the categorical variables. The prevalence of CAN according to the vitamin D status was also compared using the chi-square test. Student’s t-test was used to evaluate the significance of the mean differences including 25(OH)D level in patients with CAN and in those without CAN. One-way analysis of variance (ANOVA) with post hoc Bonferroni’s method was used to evaluate the differences of means including HRV parameters among groups according to the vitamin D status. The correlation between serum 25(OH)D and HRV parameters was analysed with Pearson’s or Spearman’s correlation analysis. We used the odds ratio (OR) as a measure of the association between 25(OH)D or other variables and CAN in multivariate logistic regression analysis.
Results
Clinical characteristics of the participants
The general characteristics of the study participants are presented in Table 1. The mean age of the participants was 56.8 years, and the mean duration of diabetes was 6.8 years. The mean BMI was 25.0 ± 3.7 kg/m2, and the mean 25(OH)D levels were 15.1 ng/mL. A total of 58 (35.6%) patients were treated for HTN; 22 (13.5%) were treated with angiotensin converting enzyme (ACE) inhibitors or angiotensin receptor blockers and 3 (1.8%) were treated with beta-blockers. The prevalence of vitamin D deficiency, insufficiency and sufficiency in all subjects was 26.4% (16% of men and 38% of women), 54% (53% of men and 54% of women) and 19.6% (31% of men and 8% of women), respectively (Table 2).
General characteristics of the study subjects.
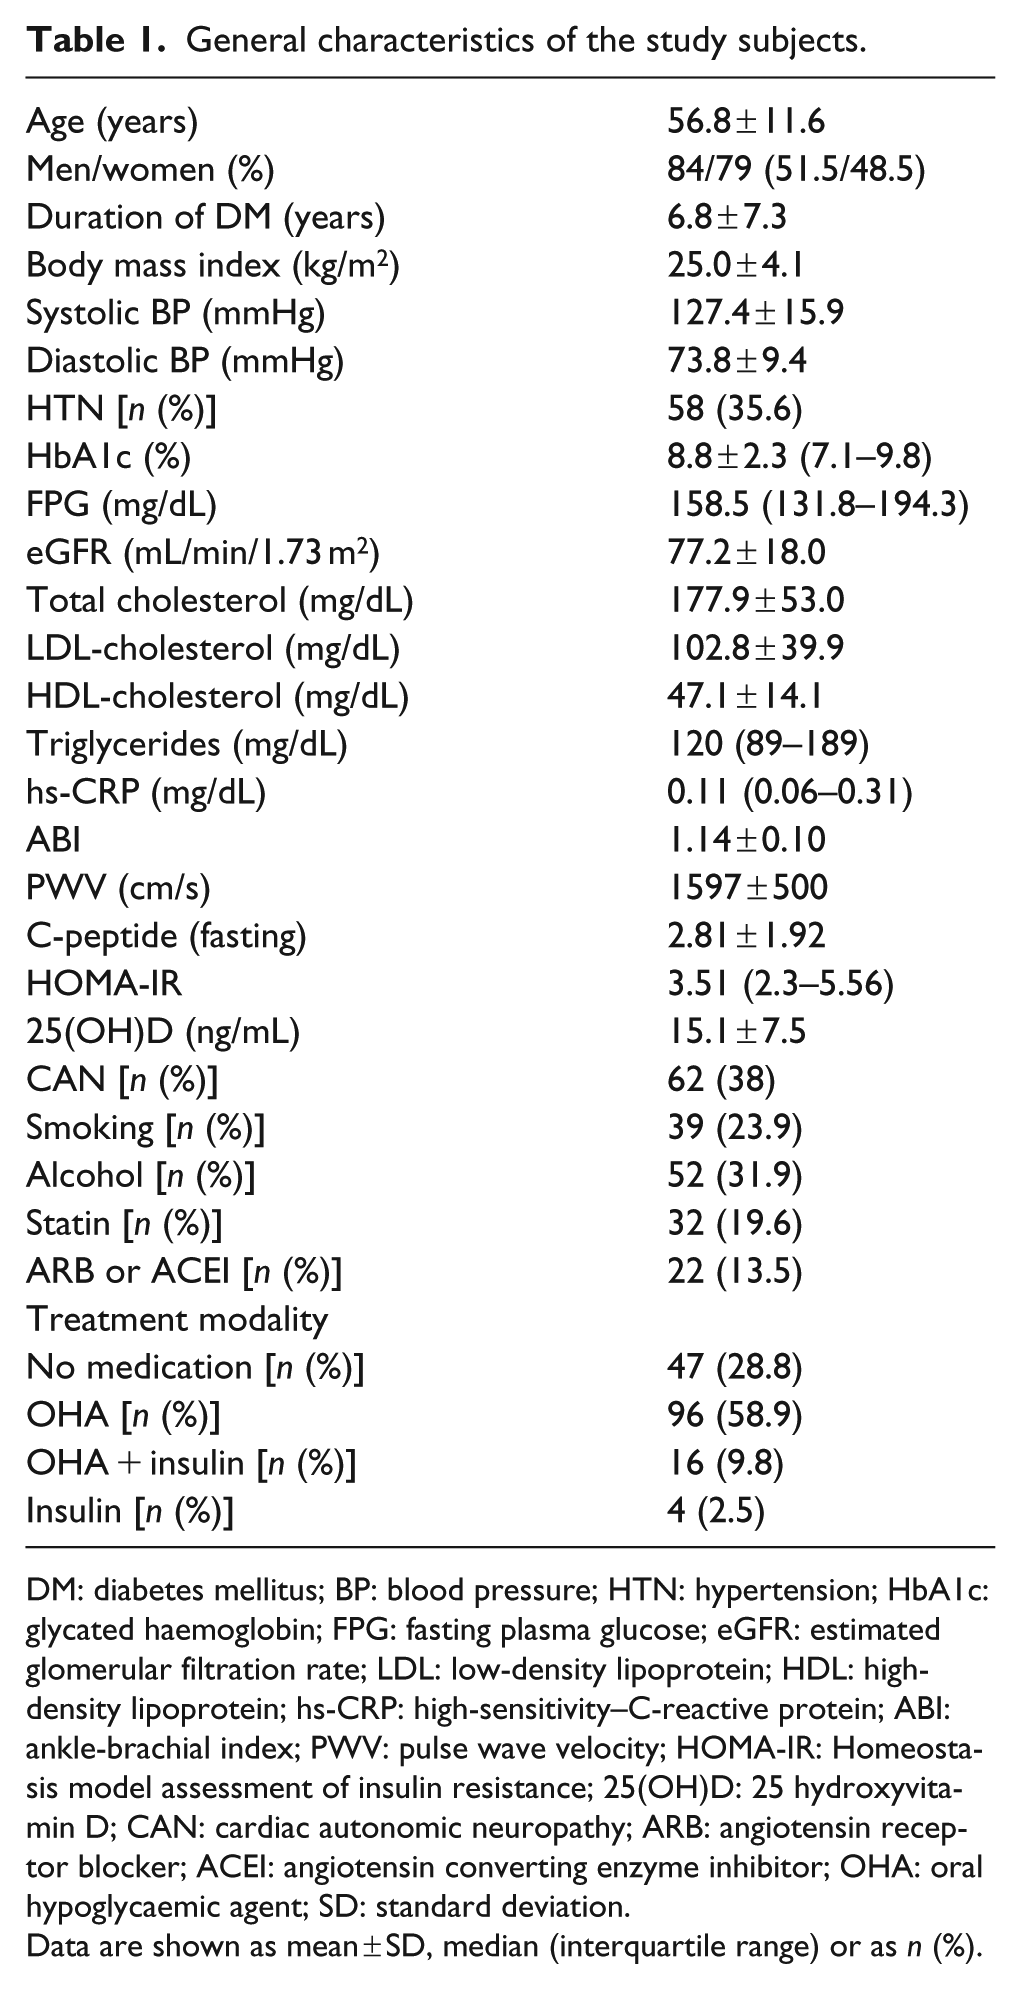
DM: diabetes mellitus; BP: blood pressure; HTN: hypertension; HbA1c: glycated haemoglobin; FPG: fasting plasma glucose; eGFR: estimated glomerular filtration rate; LDL: low-density lipoprotein; HDL: high-density lipoprotein; hs-CRP: high-sensitivity–C-reactive protein; ABI: ankle-brachial index; PWV: pulse wave velocity; HOMA-IR: Homeostasis model assessment of insulin resistance; 25(OH)D: 25 hydroxyvitamin D; CAN: cardiac autonomic neuropathy; ARB: angiotensin receptor blocker; ACEI: angiotensin converting enzyme inhibitor; OHA: oral hypoglycaemic agent; SD: standard deviation.
Data are shown as mean ± SD, median (interquartile range) or as n (%).
Clinical characteristics and laboratory findings of patients according to the status of vitamin D.
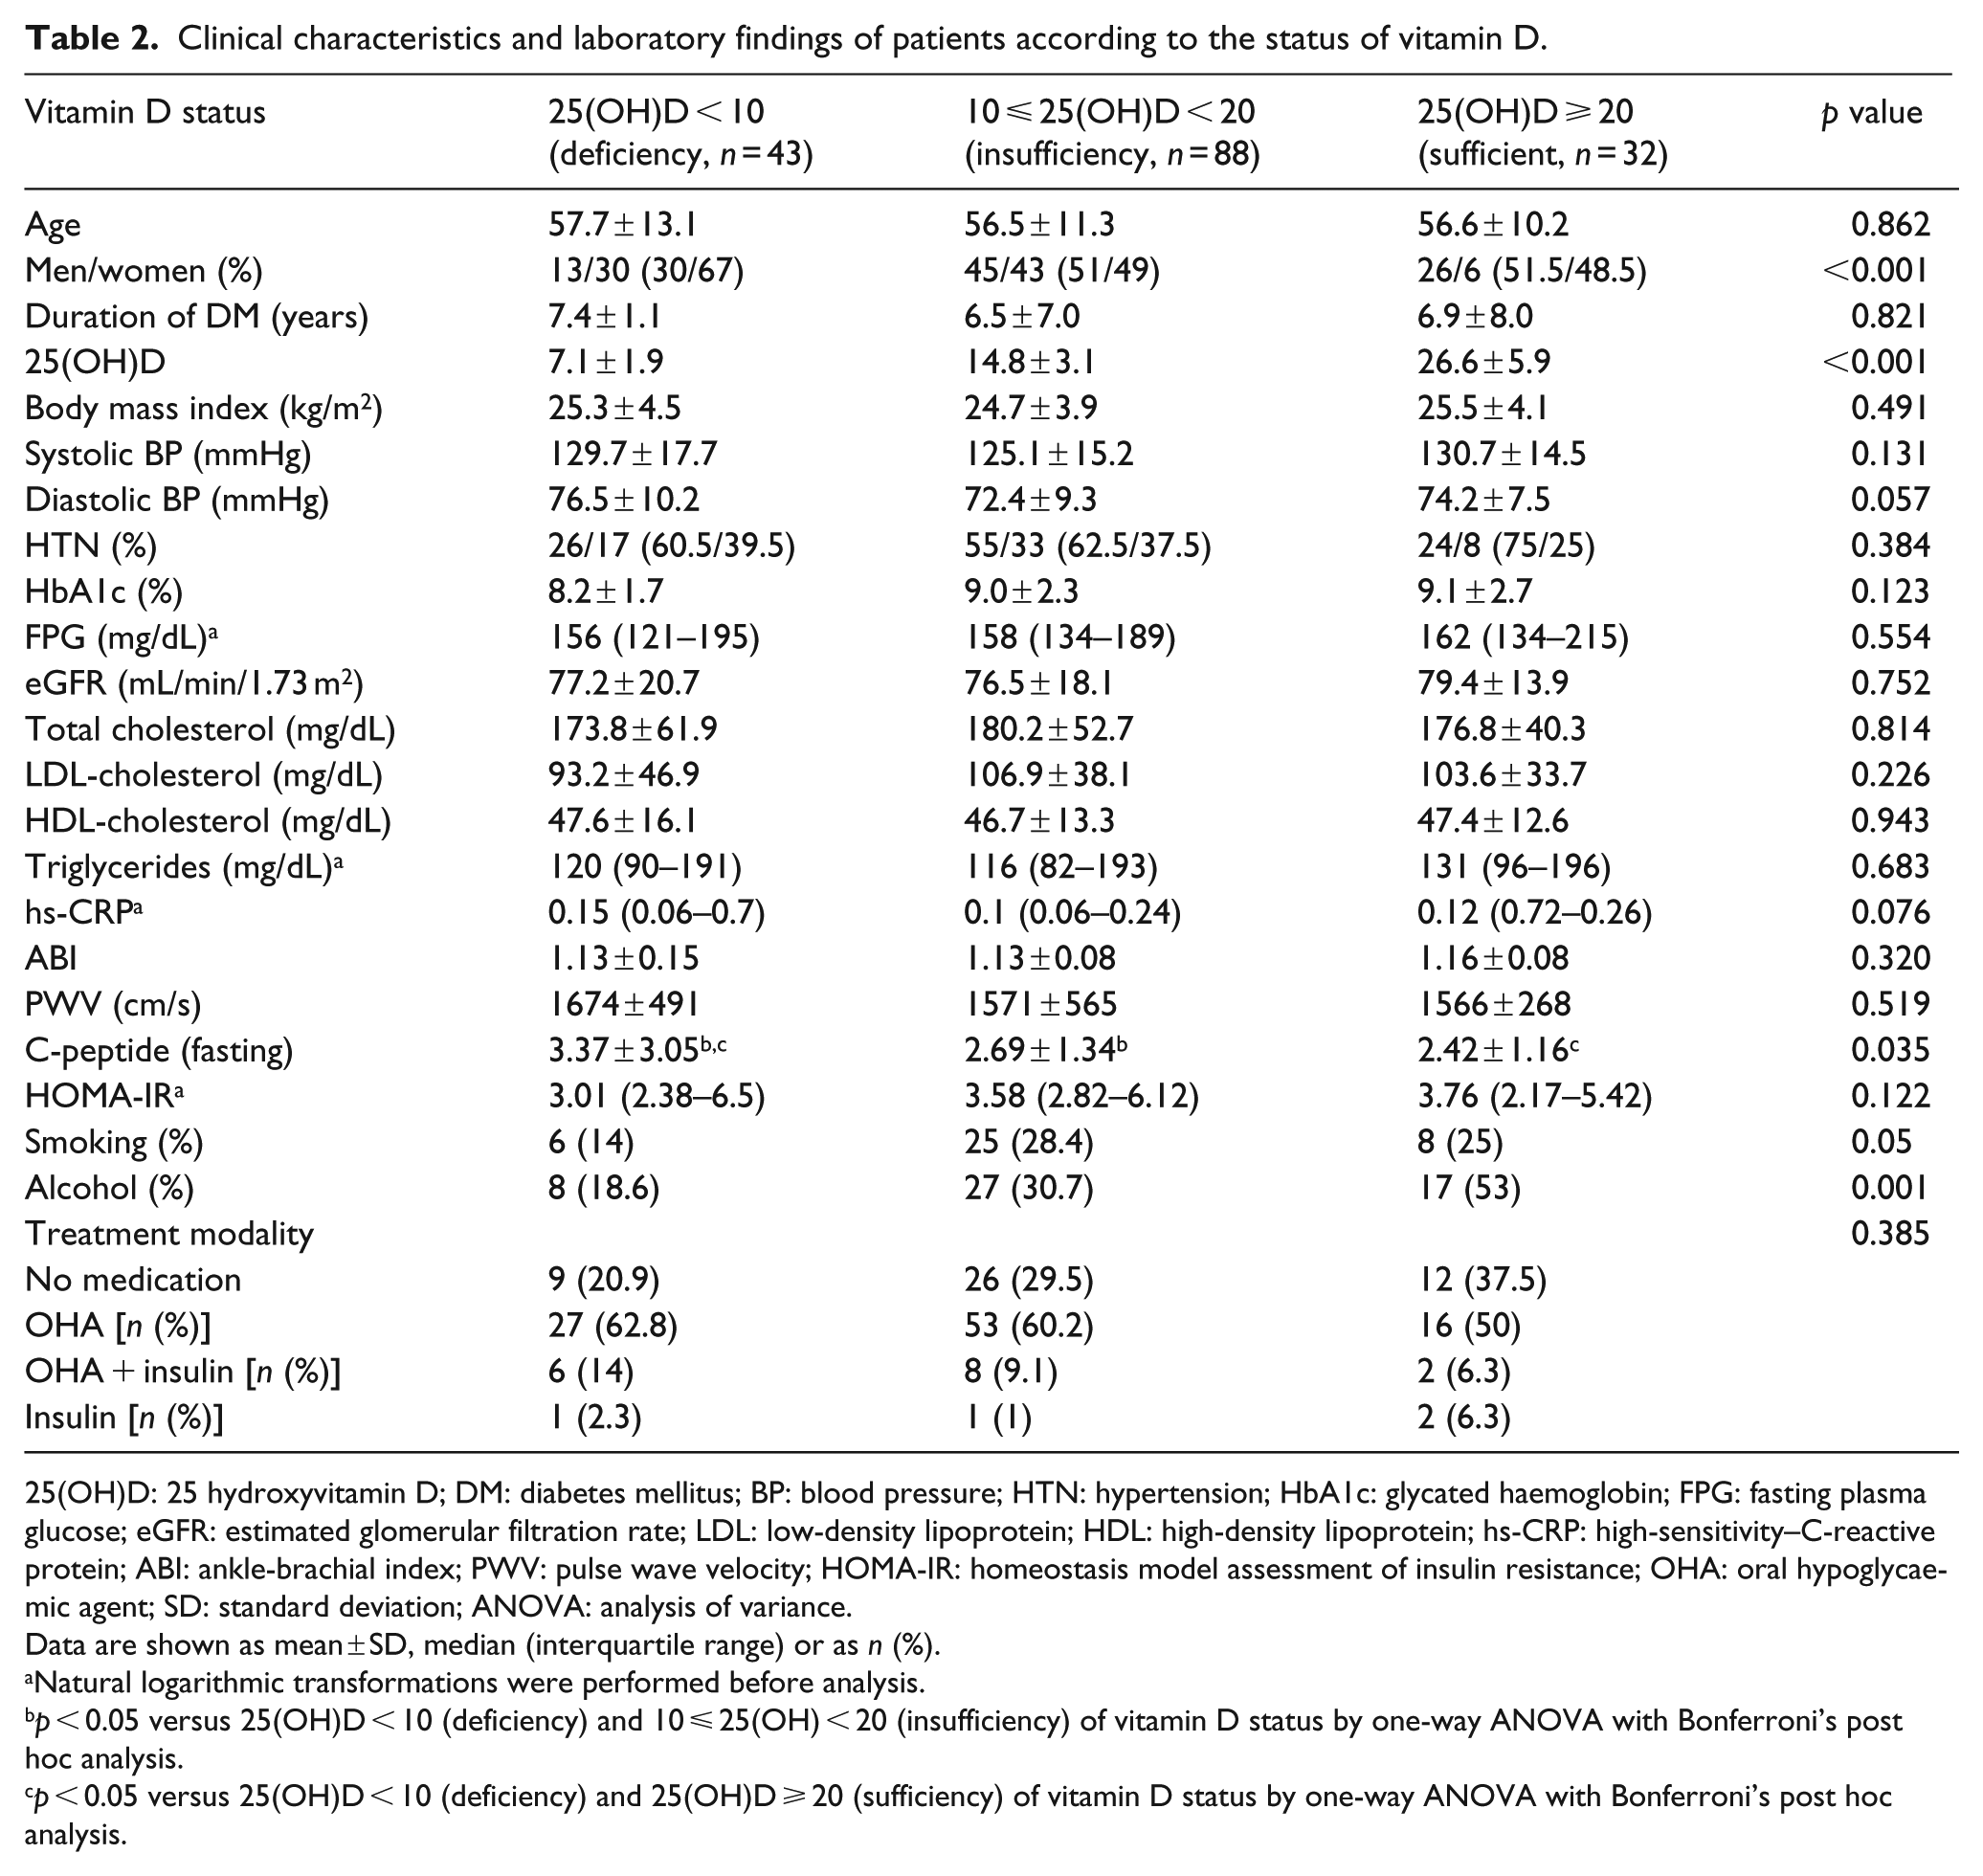
25(OH)D: 25 hydroxyvitamin D; DM: diabetes mellitus; BP: blood pressure; HTN: hypertension; HbA1c: glycated haemoglobin; FPG: fasting plasma glucose; eGFR: estimated glomerular filtration rate; LDL: low-density lipoprotein; HDL: high-density lipoprotein; hs-CRP: high-sensitivity–C-reactive protein; ABI: ankle-brachial index; PWV: pulse wave velocity; HOMA-IR: homeostasis model assessment of insulin resistance; OHA: oral hypoglycaemic agent; SD: standard deviation; ANOVA: analysis of variance.
Data are shown as mean ± SD, median (interquartile range) or as n (%).
Natural logarithmic transformations were performed before analysis.
p < 0.05 versus 25(OH)D < 10 (deficiency) and 10 ⩽ 25(OH) < 20 (insufficiency) of vitamin D status by one-way ANOVA with Bonferroni’s post hoc analysis.
p < 0.05 versus 25(OH)D < 10 (deficiency) and 25(OH)D ⩾ 20 (sufficiency) of vitamin D status by one-way ANOVA with Bonferroni’s post hoc analysis.
Comparison of clinical variables including HRV parameters according to the vitamin D status
The clinical characteristics and laboratory findings according to the vitamin D status are presented in Table 2. Vitamin D deficiency was more prevalent in women than in men (men: 30%, women: 67%). The mean levels of fasting plasma C-peptide levels were significantly decreasing according to the increase in vitamin D (3.37 vs 2.69 vs 2.42, p = 0.035). Patients with higher vitamin D levels were more likely to consume alcohol than those with lower vitamin D levels (p < 0.001). There were no significant differences in glucose, lipid profile, HOMA-IR levels, ABI and PWV between the three groups.
Regarding HRV parameters, Table 3 shows the comparisons of the mean levels of time and the frequency domain according to the vitamin D status. The SDNN and RMSSD in the supine position were significantly lower in patients with the lowest vitamin D levels compared to those in patients with higher vitamin D levels (p = 0.048 and p = 0.03, respectively). In addition, LF/HF ratio in upright position was significantly higher in the group with the lowest vitamin D level compared to that in other groups (p = 0.04).
Heart rate variability parameters by time and frequency domains of patients according to the vitamin D status.
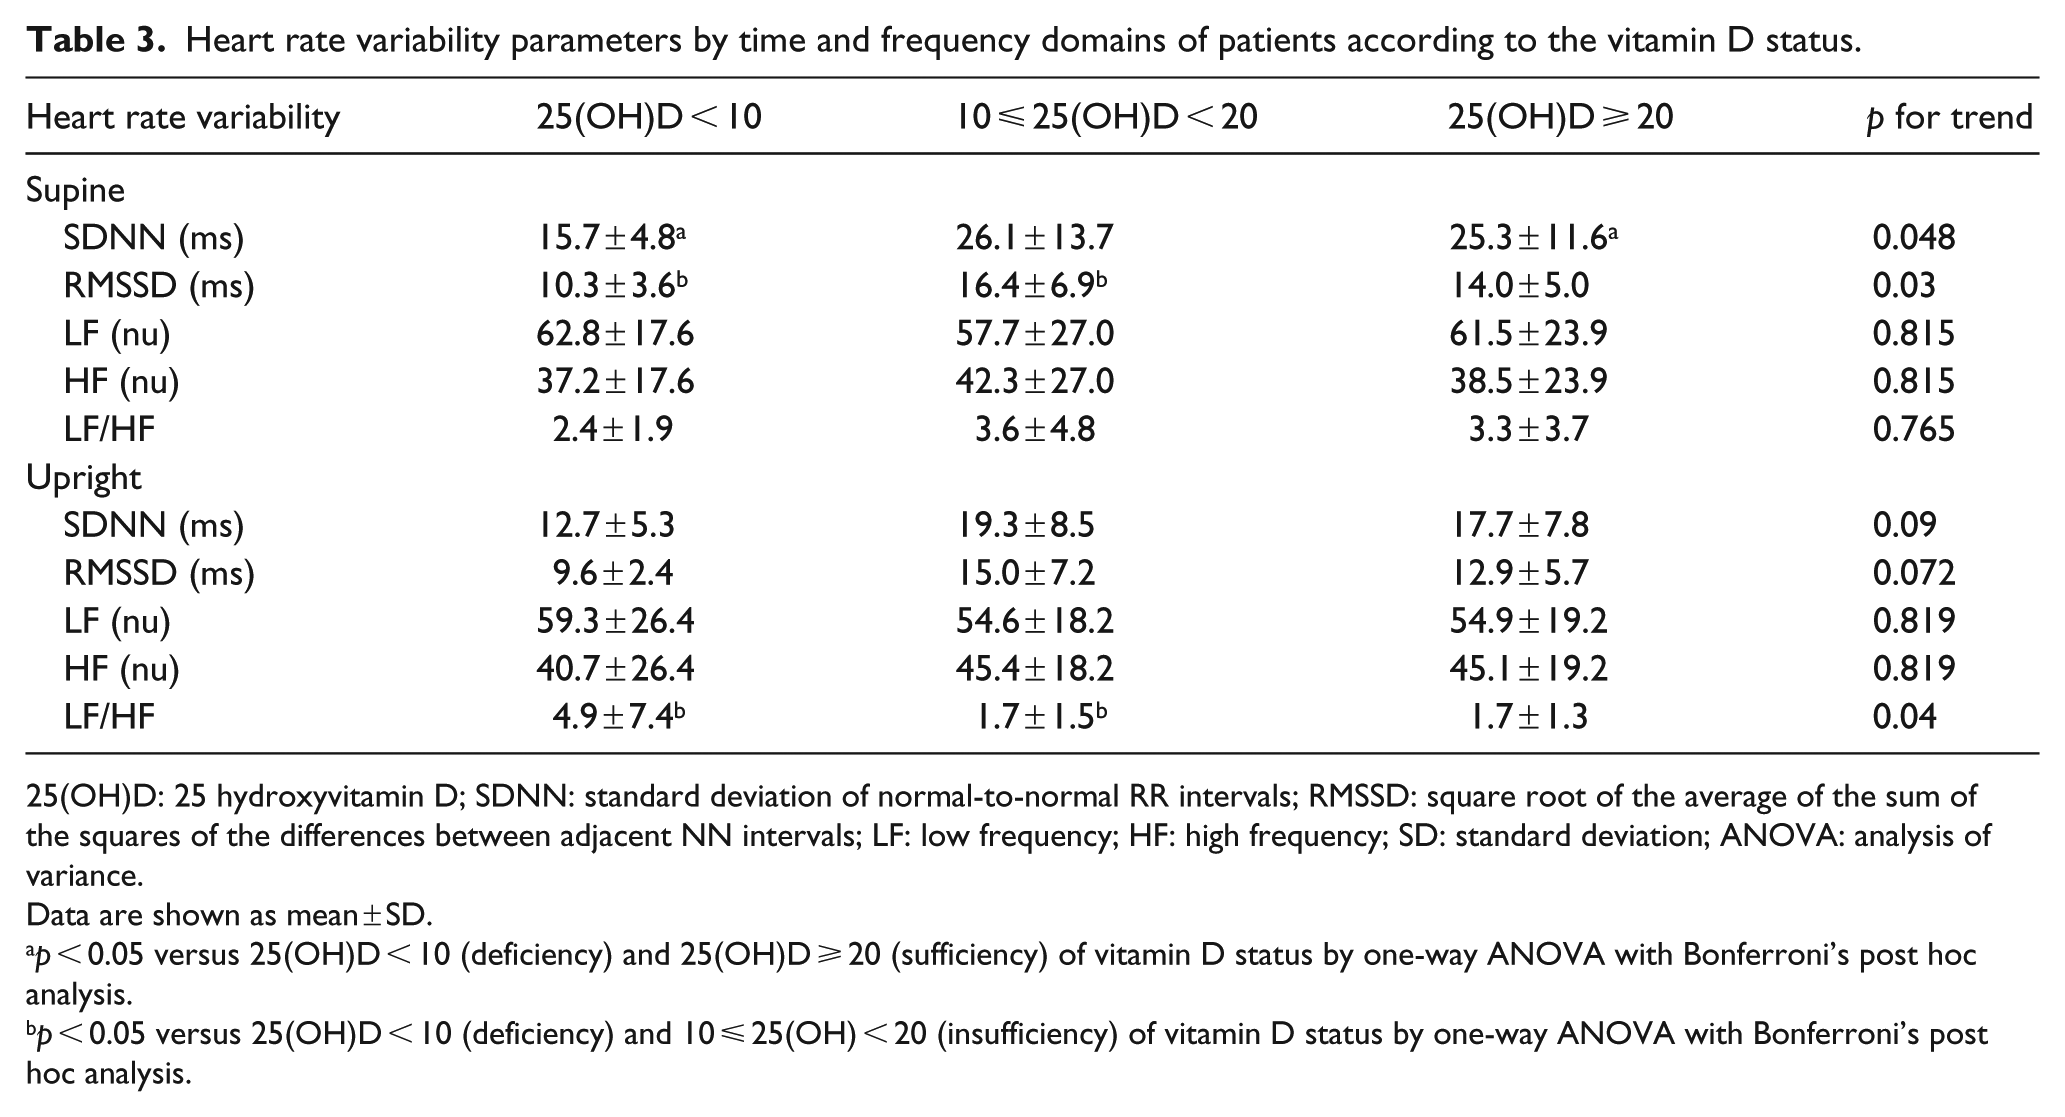
25(OH)D: 25 hydroxyvitamin D; SDNN: standard deviation of normal-to-normal RR intervals; RMSSD: square root of the average of the sum of the squares of the differences between adjacent NN intervals; LF: low frequency; HF: high frequency; SD: standard deviation; ANOVA: analysis of variance.
Data are shown as mean ± SD.
p < 0.05 versus 25(OH)D < 10 (deficiency) and 25(OH)D ⩾ 20 (sufficiency) of vitamin D status by one-way ANOVA with Bonferroni’s post hoc analysis.
p < 0.05 versus 25(OH)D < 10 (deficiency) and 10 ⩽ 25(OH) < 20 (insufficiency) of vitamin D status by one-way ANOVA with Bonferroni’s post hoc analysis.
The participants were divided into four groups according to their CAN scores, as previously described. As the CAN score increases, there is a decreasing trend of 25(OH)D level, although the change is insignificant (17.4 vs 15.4 vs 14.6 vs 13.1 ng/mL, p for trend = 0.203; Figure 1).
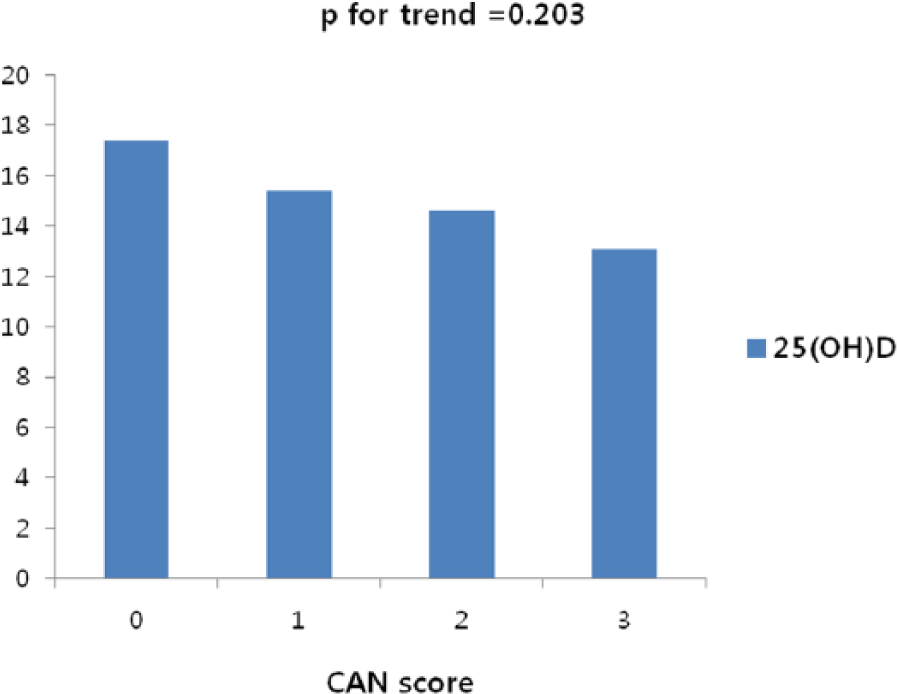
Comparisons of mean levels of 25(OH)D according to the scores of CAN.
Prevalence of CAN according to the vitamin D status
The abnormalities detected in the tests for CAN according to the vitamin D status are shown in Table 4. In total, 62 of the 163 patients (38%) were defined as having CAN. The incidence of CAN according to the vitamin D status was not significantly different (deficient vs insufficient vs sufficient group, 48.8% vs 31.8% vs 40.6%, respectively, p = 0.161). The only test among five that had significantly different prevalences across the three vitamin D groups was the HR response to the Valsalva manoeuvre (p = 0.027). The postural BP test yielded the fewest abnormal responses, while the diastolic BP change to sustained handgrip test demonstrated the most frequent abnormal responses.
Prevalence of CAN according to the vitamin D status.
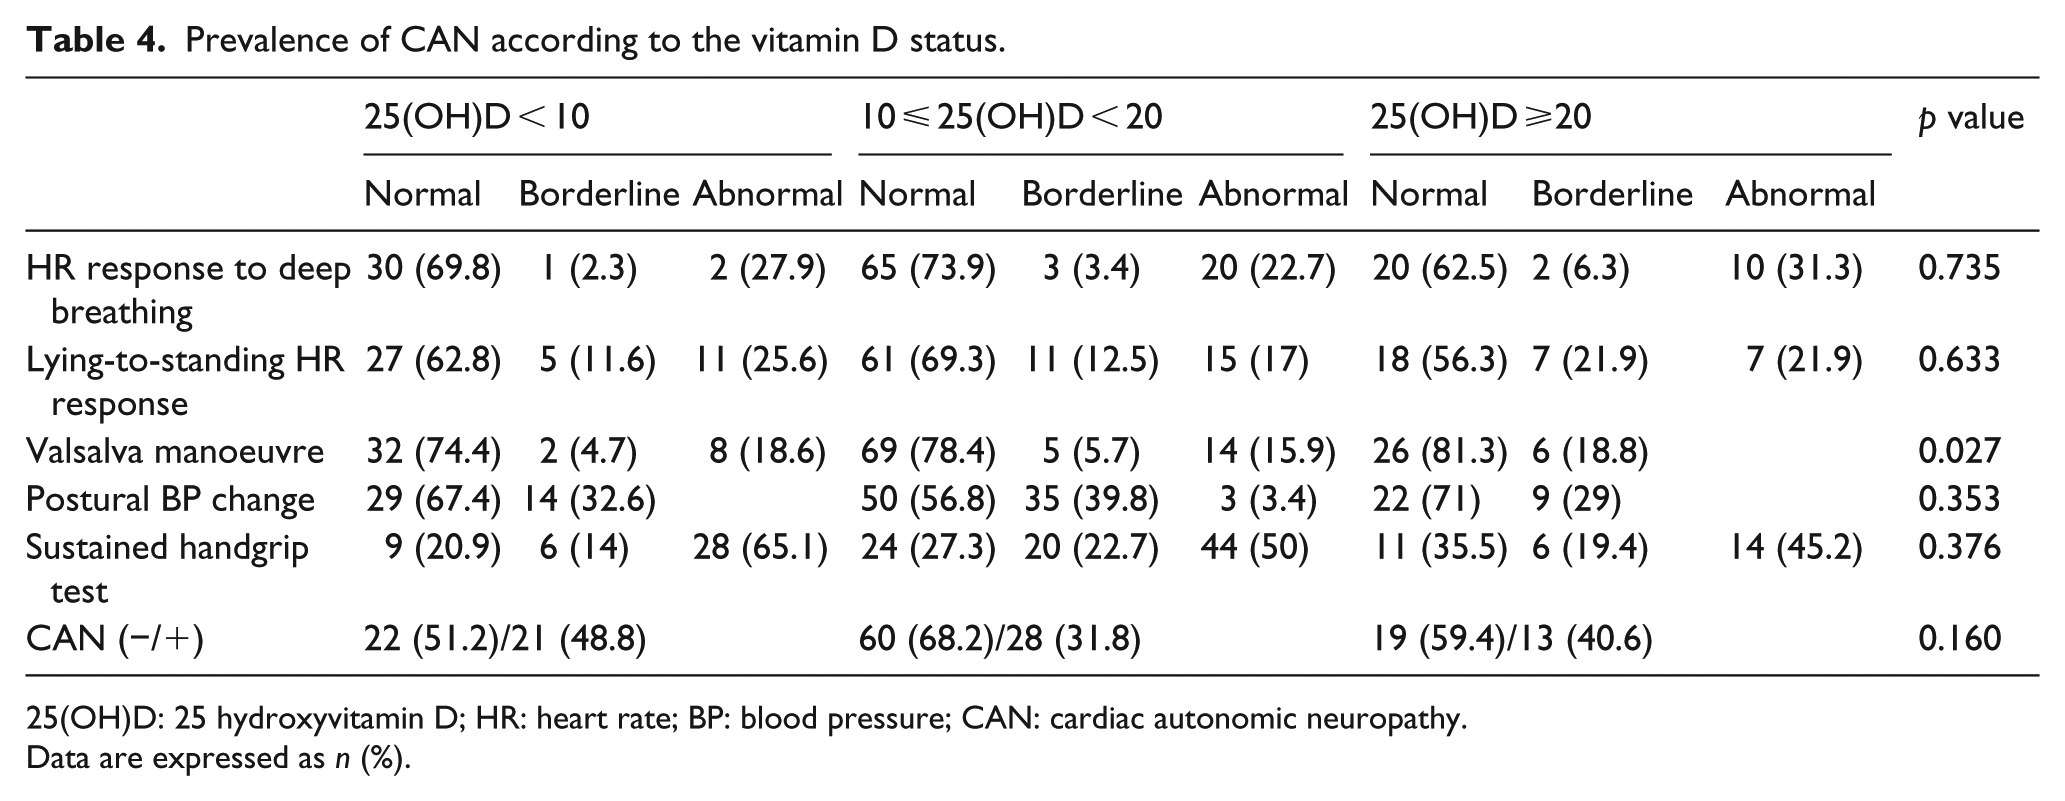
25(OH)D: 25 hydroxyvitamin D; HR: heart rate; BP: blood pressure; CAN: cardiac autonomic neuropathy.
Data are expressed as n (%).
Bivariate correlation of serum 25(OH)D levels with HRV parameters
The correlation of serum 25(OH)D levels with HRV parameters is shown in Table 5. The serum 25(OH)D levels are positively correlated with the SDNN in the supine position (r = 0.322, p = 0.023). However, the serum 25(OH)D levels were not related to any other HRV variables.
Correlation of serum 25(OH)D and HRV parameters.
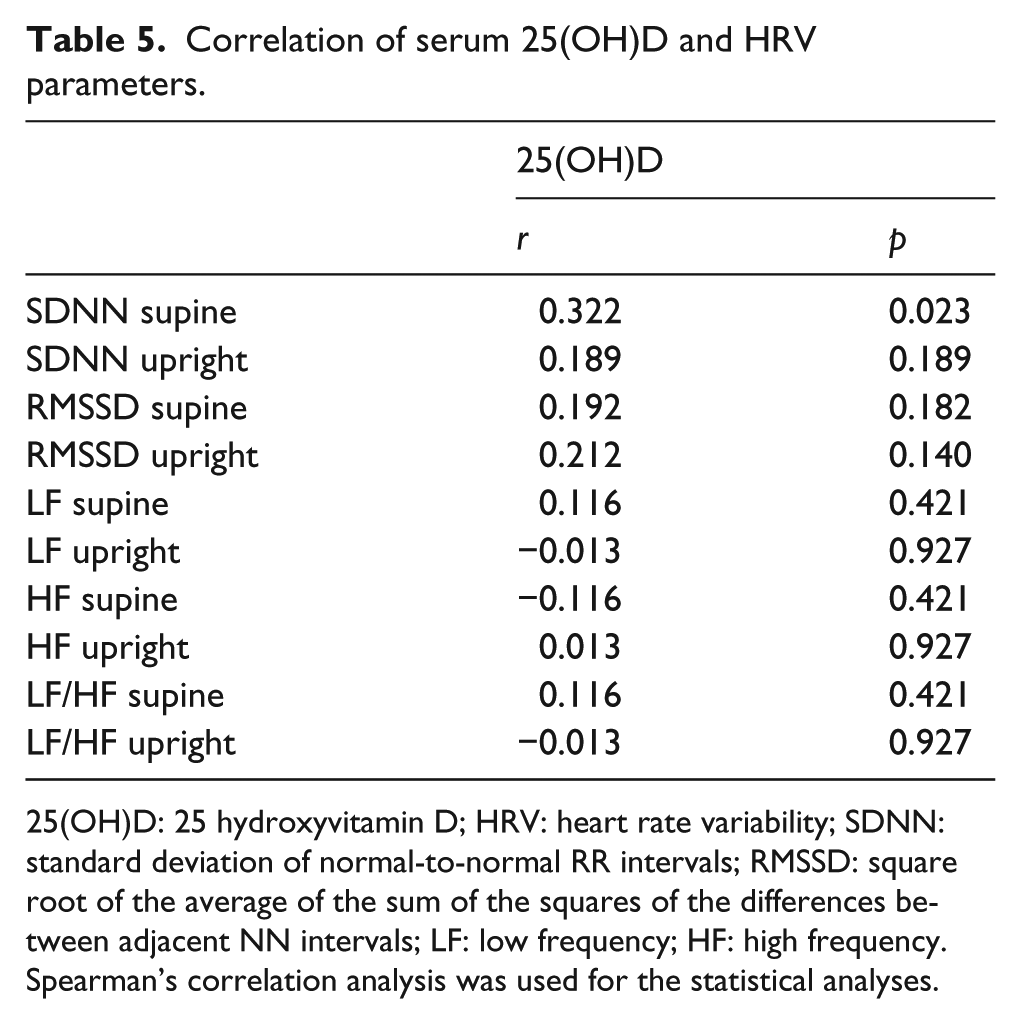
25(OH)D: 25 hydroxyvitamin D; HRV: heart rate variability; SDNN: standard deviation of normal-to-normal RR intervals; RMSSD: square root of the average of the sum of the squares of the differences between adjacent NN intervals; LF: low frequency; HF: high frequency.
Spearman’s correlation analysis was used for the statistical analyses.
Multiple logistic regression analysis for the relationship of 25(OH)D with the presence of CAN
In order to examine the relationship between serum 25(OH)D and the presence of CAN, a multivariate logistic regression analysis was performed (Table 6). The multivariate analysis revealed that the duration of diabetes was the only factor that was significantly associated with the presence of CAN. The relative risks for the presence of CAN were 0.45 and 0.72 for the 10 ⩽ 25(OH)D <20 and 25(OH)D ⩾ 20, respectively, when compared with 25(OH)D < 10 group. The group with 10 ⩽ 25(OH)D < 20 had borderline significantly lower CAN risk than the group with 25(OH)D < 10 (OR = 0.45 (0.23–1.00), p = 0.051).
Multivariate logistic regression analysis with presence or absence of CAN as the dependent variable.
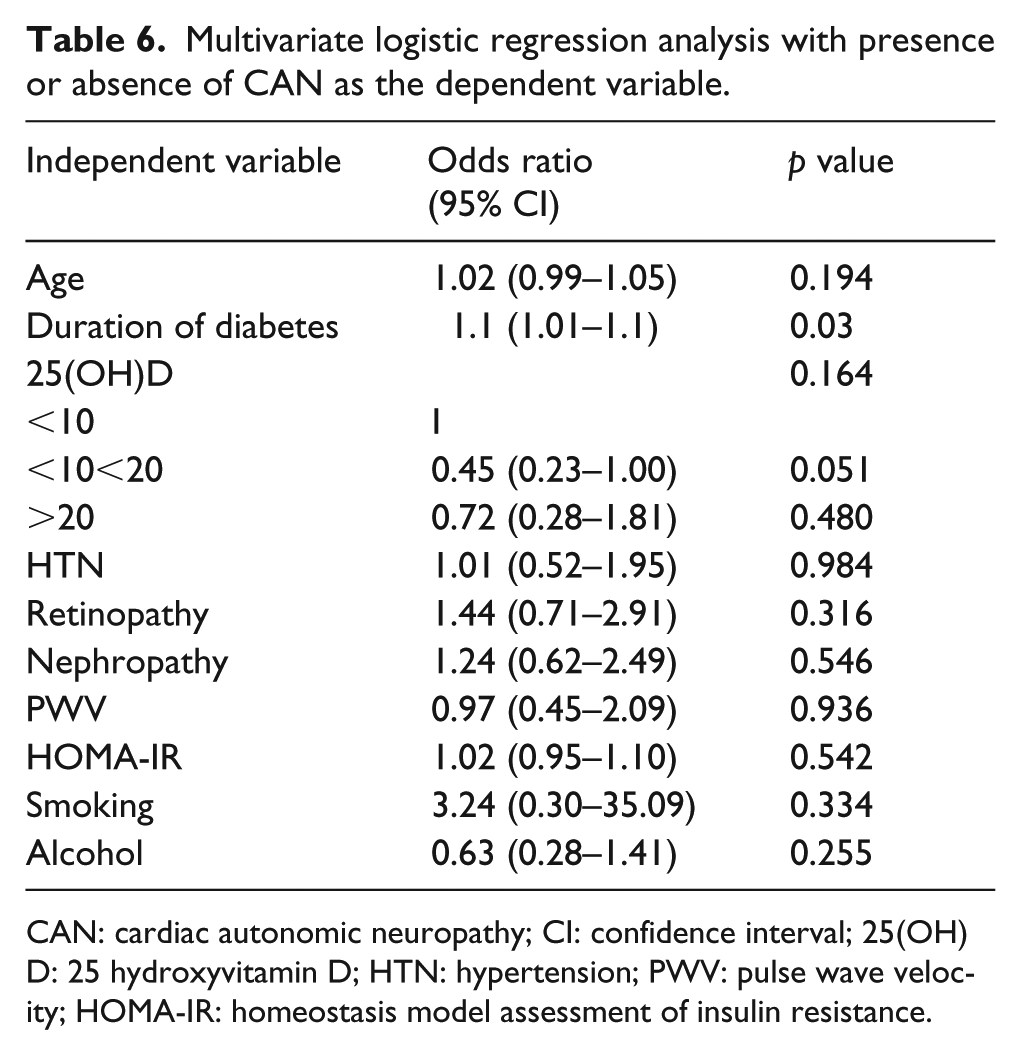
CAN: cardiac autonomic neuropathy; CI: confidence interval; 25(OH)D: 25 hydroxyvitamin D; HTN: hypertension; PWV: pulse wave velocity; HOMA-IR: homeostasis model assessment of insulin resistance.
Discussion
In this study, patients with 25(OH)D deficiency had significantly lower SDNN and RMSSD values and greater LF/HF ratio as compared to those without vitamin D deficiency. In addition, serum 25(OH)D levels were positively correlated with SDNN. To the best of our knowledge, this is the first study that evaluates the association between CAN and vitamin D status in patients with T2DM using both Ewing’s test and HRV parameters.
In addition to its well-recognized classical role in musculoskeletal health, vitamin D is associated with a number of non-skeletal diseases including cancer, autoimmune disease, diabetes and CVD. Vitamin D deficiency has been recognized as a pandemic disease with many health consequences. Vitamin D deficiency is very common worldwide, including in South Korea.7,8,27 The prevalence of vitamin D deficiency is higher in patients with T2DM than in those without DM. 9 In this study, the mean concentration of 25(OH)D and the proportion of patients with 25(OH)D levels <20 ng/mL were 15.1 ng/mL and 80.4% (male: 69%, female: 92.4%), respectively. These findings are in accordance with those from other studies. Tahrani et al. 28 evaluated the prevalence of hypovitaminosis D in South Asian patients with T2DM (170 with T2DM and 40 without). Overall, 80% of subjects had serum 25(OH)D <20 ng/mL; however, hypovitaminosis D was still significantly more common in patients with T2DM than in those without T2DM (83% vs 70%). Another Korean study by Lee et al. 29 also reported that the mean concentration of 25(OH)D and the prevalence of 25(OH)D <20 ng/mL were 11.3 ng/mL and 85.9% in 305 T2DM patients, respectively. In addition, we found that vitamin D deficiency is more prevalent in females than in males, which is consistent to prior findings.27,29
CVD is the leading cause of morbidity and mortality in patients with T2DM. Therefore, it is important not only to detect CVD early in its course but also to reduce the risk factors and vascular complications of T2DM. CAN is one of the most common complications that has a major impact on CVD, and morbidity and mortality in diabetic patients.14,15 Autonomic imbalance, characterized by a hyperactive sympathetic system and a hypoactive parasympathetic system, is associated with CVD in diabetes. 16 HRV that reflects cardiac autonomic imbalances has been used to identify patients at high risk for cardiac events and mortality.17,30 Previous research has shown that a low HRV is a CVD predictor and is associated with risk factors for heart failure and sudden cardiac death.18,31,32 Although previous studies showed that patients with low vitamin D levels are at increased risk of CVD and sudden arrhythmic death, there is little clinical evidence for the effect of vitamin D deficiency on cardiac autonomic functions.3,33
We assessed CAN using five non-invasive tests according to Ewing’s protocol, and the time domain and frequency domain of HRV. 21 The overall CAN in this study was 38%, which is consistent with findings from other studies.17,34 The incidence of CAN according to the vitamin D status was not significantly different, but there was a trend of decreasing 25(OH)D levels with increasing CAN scores.
In this study, we evaluated the relationship of HRV parameters and the 25(OH)D level. With regard to the time domain parameters of HRV, SDNN is the most representative parameter of HRV. Therefore, a low SDNN represents a low HRV, which primarily indicates a reduction in dynamic complexity.35,36 In addition, RMSSD is specific for the parasympathetic modulation. There is a high risk of cardiac disease development when there is a decrease in RMSSD accompanied by a low SDNN. 37 Our data showed that the SDNN and RMSSD measured in the supine position were significantly lower in patients with vitamin D deficiency than in patients with higher vitamin D levels. In addition, the serum 25(OH)D levels were positively correlated with SDNN in the supine position. These results suggest that the low vitamin D levels may be associated with low HRV and PNS dysfunction in patients with T2DM.
With regard to the frequency domain measures of HRV, the LF band reflects SNS activity, while the HF band reflects PNS activity. The reduced PNS activity is believed to account for reduced HRV. The LF/HF ratio reflects overall autonomic nervous system (ANS) balance. Higher LF/HF ratios are suggestive of SNS dominance, while lower ratios reflect PNS dominance. We found that the LF/HF ratio in upright position was significantly higher in the vitamin D deficient group than in the other groups. This result also suggests that low vitamin D levels are related to an overall ANS imbalance in T2DM.
Multivariate analysis revealed that there is a higher relative risk of CAN in groups with lower vitamin D levels than in groups with higher vitamin D levels. However, the only significant finding with regard to this trend is that the group with 10 < 25(OH)D < 20 had borderline significantly lower CAN risk than the group with vitamin D < 10.
There is very limited data regarding the relationship between vitamin D status and cardiac autonomic dysfunction in T2DM. Until now, only a few studies had addressed the relationship between vitamin D deficiency and HRV or CAN in apparently healthy populations or in high-risk CVD populations such as those with chronic renal failure or heart failure.38 –40
There are only three prior studies that have addressed vitamin D deficiency in apparently healthy subjects. A cross-sectional study by Tak et al. 41 analysed serum 25(OH)D and HRV indices using 5-min RR interval recordings in 176 healthy subjects. In agreement with our study, they found that 25(OH)D was positively correlated to SDNN. They also reported that 25(OH)D levels < 15 ng/mL were associated with decreased SDNN (<30 m/s). Although the mean subject age was similar between our study and Tak et al.’s study (56.8 vs 55.3 years), the mean 25(OH)D level was lower in our study (15.1 vs 21.2 ng/mL, respectively). This discrepancy may have been a result of different patient characteristics (general population vs diabetic patients). Another study evaluated the cardiac autonomic functions using HR recovery index and HRV in 24 healthy vitamin D deficient subjects and in 50 healthy vitamin D sufficient control participants. 42 Their study results are in agreement with those from our study. They found that SDNN, RMSSD and HF were significantly decreased in patients with vitamin D deficiency; however, LF and LF/HF were significantly higher in the vitamin D deficient group. In addition, the 25(OH)D level was positively correlated with RMSSD and HF, while it was negatively correlated with LF and LF/HF. Previously published studies have used the time domain and frequency domain methods of HRV without the five Ewing’s standard cardiovascular reflex tests to assess cardiac autonomic function.
In this study, we observed that the patients with higher vitamin D levels were more likely to consume alcohol than those with lower vitamin D levels. Also, the mean levels of fasting plasma C-peptide levels were significantly decreasing according to the increasing in vitamin D. These findings are consistent with those of a study by Wu et al. 43 They evaluated dietary calcium intake and plasma 25(OH)D levels in relation to fasting plasma C-peptide concentrations in two large cross-sectional studies involving non-diabetic men and women. The group found that men with high levels of 25(OH)D were more likely to drink alcohol than those with lower vitamin D levels. In our study, men not only had higher vitamin D levels but also consumed more alcohol than women. They also reported that individuals with the highest calcium intake and plasma 25(OH)D concentrations had significantly lower fasting C-peptide concentrations (35% in men and 12% in women) than those at the opposite extreme. However, we found no significant differences in glucose, lipid profile or HOMA-IR levels between the three vitamin D groups.
One strength of this study is that both Ewing’s method and several parameters of time and frequency domains were used for the evaluation of HRV. This is also the first study that evaluates the association between CAN using both Ewing’s test and HRV parameters and vitamin D status in patients with T2DM.
However, there are several limitations in our study. First, we cannot determine any causative relationship between vitamin D status and CAN including HRV due to cross-sectional nature of the study. Second, our study included a small sample size of subjects. A larger patient sample is needed to confirm our results. However, the majority of related studies in the literature included fewer than 100–200 participants. Another limitation of this study is that the serum parathyroid hormone (PTH) level, an important determinant of vitamin D, was not measured. Instead, patients with parathyroid disease were excluded at the onset of the study. Our study would be more reliable with strict adjustment of potential confounding factors such as physical activity, which can influence vitamin D levels. One additional limitation is that we assessed cardiac autonomic function using Ewing’s methods and HRV, produced automatically from ECG recordings using a commercially available machine system. This method only assesses HRV in the short-term. However, it is also widely available, non-invasive and simple to use.
In conclusion, we found that vitamin D deficiency was significantly correlated with impaired cardiac autonomic functions assessed by parameters of HRV in patients with T2DM. This was the first study in T2DM patients that evaluated vitamin D status and CAN, making our results meaningful. Nevertheless, there was only borderline significant association between vitamin D concentration and presence of CAN. Therefore, future prospective studies with larger number of patients are required to establish a direct relationship between vitamin D concentrations and impaired cardiac autonomic function in patients with T2DM.
Footnotes
Declaration of conflicting interests
The authors declare that there is no conflict of interest.
Funding
This study was supported by Soonchunhyang University.