
Abstract
Background:
We investigated the relationship between serum creatinine (SCr) and estimated glomerular filtration rate (eGFR), evaluated by different formulae, and all-cause mortality (ACM) in type 2 diabetes mellitus (T2DM) outpatients.
Methods:
This observational cohort study considered 1365 T2DM outpatients, who had been followed up for a period of up to 11 years. eGFR was estimated using several equations.
Results:
Seventy subjects (5.1%) died after a follow-up of 9.8 ± 3 years. Univariate analysis showed that diagnosis of nephropathy (odds ratio (OR): 2.554, 95% confidence interval (CI): 1.616–4.038, p < 0.001) and microvascular complications (OR: 2.281, 95% CI: 1.449–3.593, p < 0.001) were associated with ACM. Receiving operating characteristic (ROC) curves showed that the areas under the curve for ACM were similar using the different eGFR equations. eGFR values were predictors of ACM, and the hazard ratios (HRs) of the different equations for eGFR estimation were similar.
Conclusion:
In our cohort of T2DM outpatients, different eGFR equations perform similarly in predicting ACM, whereas SCr did not.
Keywords
Introduction
Type 2 diabetes mellitus (T2DM) increases the risk of chronic kidney disease (CKD), even if the relationship between these two conditions is still a matter of debate. In the 1999–2006 National Health and Nutrition Examination Survey (NHANES), the prevalence of CKD in patients with diagnosed, undiagnosed diabetes mellitus (DM), pre-DM and non-DM was 39.6%, 41.7%, 17.7% and 10.6%, respectively. Among patients with CKD, 39.1% were found to have undiagnosed DM or pre-DM. 1 On the other hand, pre-DM was not independently related to renal dysfunction after adjustment for major clinical characteristics. 2 It should be considered that only 1.8% of primary care DM diagnoses met American Diabetes Association (ADA) criteria. 3 Approximately 20%−30% of patients with DM have diabetic nephropathy as a complication, 4 and in Italy, DM is the cause of end-stage renal disease in 20% of incident dialysis subjects. 5 CKD is a well-established risk factor for cardiovascular (CV) and all-cause mortality (ACM) in patients with or without DM, 6 and classification of CKD should be taken into account in order to correctly prescribe oral anti-diabetic drugs. 7
In a previous study, we suggested that evaluation of estimated glomerular filtration rate (eGFR) with different equations may differently classify CKD stages in T2DM patients. 8 Data about the impact of eGFR with different equations on ACM in T2DM are scarce. Therefore, we conducted a prospective, longitudinal, observational study in order to investigate the possible relationship between renal function, evaluated both with serum creatinine (SCr) and different eGFR formulae, and ACM in a cohort of T2DM consecutive outpatients.
Patients and methods
This prospective, longitudinal, observational study, in agreement with the terms of the Declaration of Helsinki as revised in 2000, included a cohort of Caucasian T2DM outpatients consecutively observed at the referral centre of the University Hospital of Ferrara between January 1996 and December 2006. Exclusion criteria were missing data and being on renal replacement therapy (RRT). At the first enrolment visit, height and weight were measured, and body mass index (BMI) was calculated as weight (kg)/height (m2). Blood samples for serum determination of creatinine, glucose, glycated haemoglobin (Variant II HbA2/HbA1c Dual Program), total cholesterol, high-density lipoprotein cholesterol (HDL-C) and triglycerides (Cobas c, Roche Diagnostics, Mannheim, Germany) were drawn in the morning after 12 h fasting. Low-density lipoprotein cholesterol (LDL-C) was calculated by the Friedewald equation. SCr level assays were performed with the Jaffe method on a Hitachi Modular (Roche Diagnostics, Mannheim, Germany). Also subjects with pre-existing diagnosis of nephropathy, microalbuminuria and macroalbuminuria were included. The variables were analysed as categorical ones (i.e. presence/absence). Office blood pressure (BP) was measured with a mercury sphygmomanometer under standardized conditions (between 9 and 11 a.m., after 10 min rest in the sitting position, with no meal, alcohol or caffeine ingestion in the two preceding hours). Averages from at least three measurements, taken during three different visits performed at the beginning of the study, were calculated. Moreover, age, sex, data about the presence of micro or macroalbuminuria, dyslipidaemia and the presence of history of smoking habit, hypertension, coronary artery disease (CHD), peripheral arterial disease (PVD), cerebrovascular disease (CeVD), peripheral neuropathy and diabetic foot were recorded, along with the use of anti-hypertensive and lipid-lowering drugs.
For each patient, renal function was evaluated by eGFR using the following equations.
Modification of diet in renal disease (MDRD)186 formula: 9 GFRMDRD186 = 186 × (SCr)−1.154 × [age (years)−0.203 × (0.742 if female) × (1.212 if African-American)];
MDRD175 formula: 10 GFRMDRD175 = 175 × (SCr)−1.154 × [age (years)−0.203 × (0.742 if female) × (1.212 if African-American)];
Mayo Clinic Quadratic formula: 11 GFRMAYO = exp[1.911 + 5.249/SCr − 2.114/SCr2 − 0.00686 × age (years) − 0.205 (if female)];
Chronic Kidney Disease Epidemiology Collaboration (CKD-EPI) formula:
12
If female and if SCr ≤ 0.7 mg/dL: GFRCKD-EPI = 144 × SCr/0.7−0.329 × 0.993age If female and if SCr > 0.7 mg/dL: GFRCKD-EPI = 144 × SCr/0.7−1.209 × 0.993age If male and if SCr ≤ 0.9 mg/dL: GFRCKD-EPI = 141 × SCr/0.9−0.411 × 0.993age If male and if SCr > 0.9 mg/dL: GFRCKD-EPI = 141 × SCr/0.9−1.209 × 0.993age
Cockcroft–Gault formula: 13 GFRC-G = [140 − age (years)] × body weight (kg)/72 × SCr (mg/dL)] (×0.85 if female).
Schaeffner’s equation: 14 GFRBIS1 = 3736 × [SCr−0.87] × [age−0.95] × 0.82 (if female).
Duration of follow-up was 9.8 ± 3 years, and ACM was the primary end-point. The data on deaths during the follow-up period were drawn from the database of the Emilia-Romagna region of Italy.
Statistical analysis
Data were expressed as mean ± standard deviation (SD) or as percentage. The primary outcome was ACM. Survivors and deceased were compared using the chi-square test for estimating the occurrence of categorical variables and t-test and Mann–Whitney for parametric and non-parametric continuous variables, respectively. In order to analyse the prediction of ACM due to impaired renal function, receiving operating characteristic (ROC) curve analysis was performed. Cox regression analysis for hazard ratio (HR) calculation was also performed in order to determine the independent prognostic factors for ACM. Age, anthropometric parameters, biochemical variables, eGFR evaluated with different formulae, presence or absence of microalbuminuria, macroalbuminuria, microvascular and macrovascular complications were the independent variables. All p-values were two tailed, with statistical significance defined as p < 0.05. SPSS for Windows was used as a statistical system (SPSS, Version 13; SPSS Inc., Chicago, IL, USA).
Results
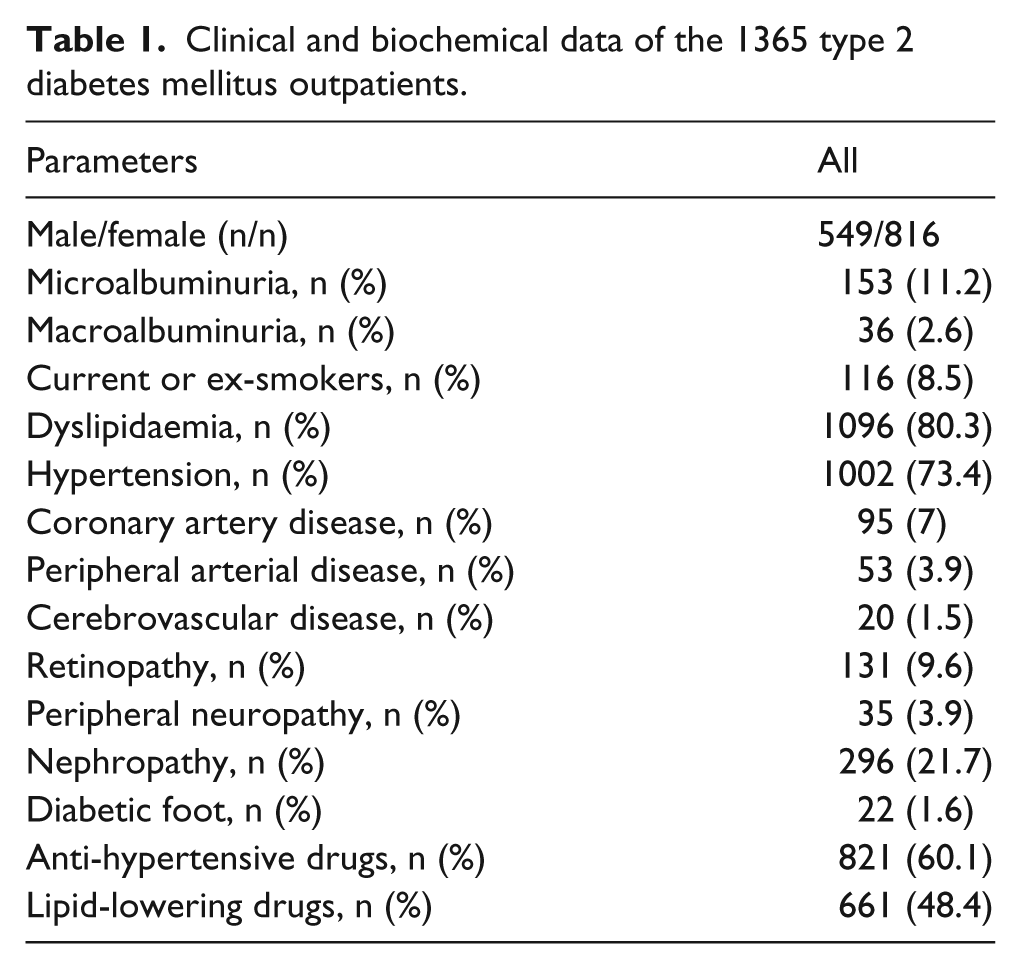
The clinical and biochemical data of the 1365 patients enrolled, as recorded at the start of the study, are shown in Table 1. The mean age of the population was 58 ± 10 years, 296 subjects (21.7%) had diagnosis of nephropathy, 153 (11.2%) had microalbuminuria, 36 (2.6%) had macroalbuminuria, 161 (11.8%) had macrovascular complications, 416 (30.5%) had microvascular complications and 70 (5.1%) died during the follow-up. The majority of deaths were due to CV diseases (85%). Biochemical, clinical data, SCr and eGFR derived with different formulae of the whole population, survivors and deceased are shown in Table 2. Deceased patients had higher mean age, lower BP and lower eGFR than survivors, while prevalence of micro- or macroalbuminuria, smoking history, hypertension, CHD, PVD, CeVD, retinopathy, peripheral neuropathy and diabetic foot had similar prevalence in the two groups; 37.8% of the survivors and 24.3% of the deceased patients were on statins (p = 0.022). On the other hand, univariate analysis showed that diagnosis of nephropathy (OR: 2.554, 95% CI: 1.616–4.038, p < 0.001) and microvascular complications (OR: 2.281, 95% CI: 1.449–3.593, p < 0.001) were associated with death, being the two complications more prevalent in deceased than in survivors (41.4% vs 20.6%, p < 0.001 and 50% vs 29.4%, p < 0.001, respectively). Kaplan–Meier survival curve of subjects with and without diagnosis of nephropathy at the beginning of follow-up is shown in Figure 1.
Clinical and biochemical data of the 1365 type 2 diabetes mellitus outpatients.
Clinical and biochemical data and renal function estimated by different equations in the whole population, survivors and deceased.
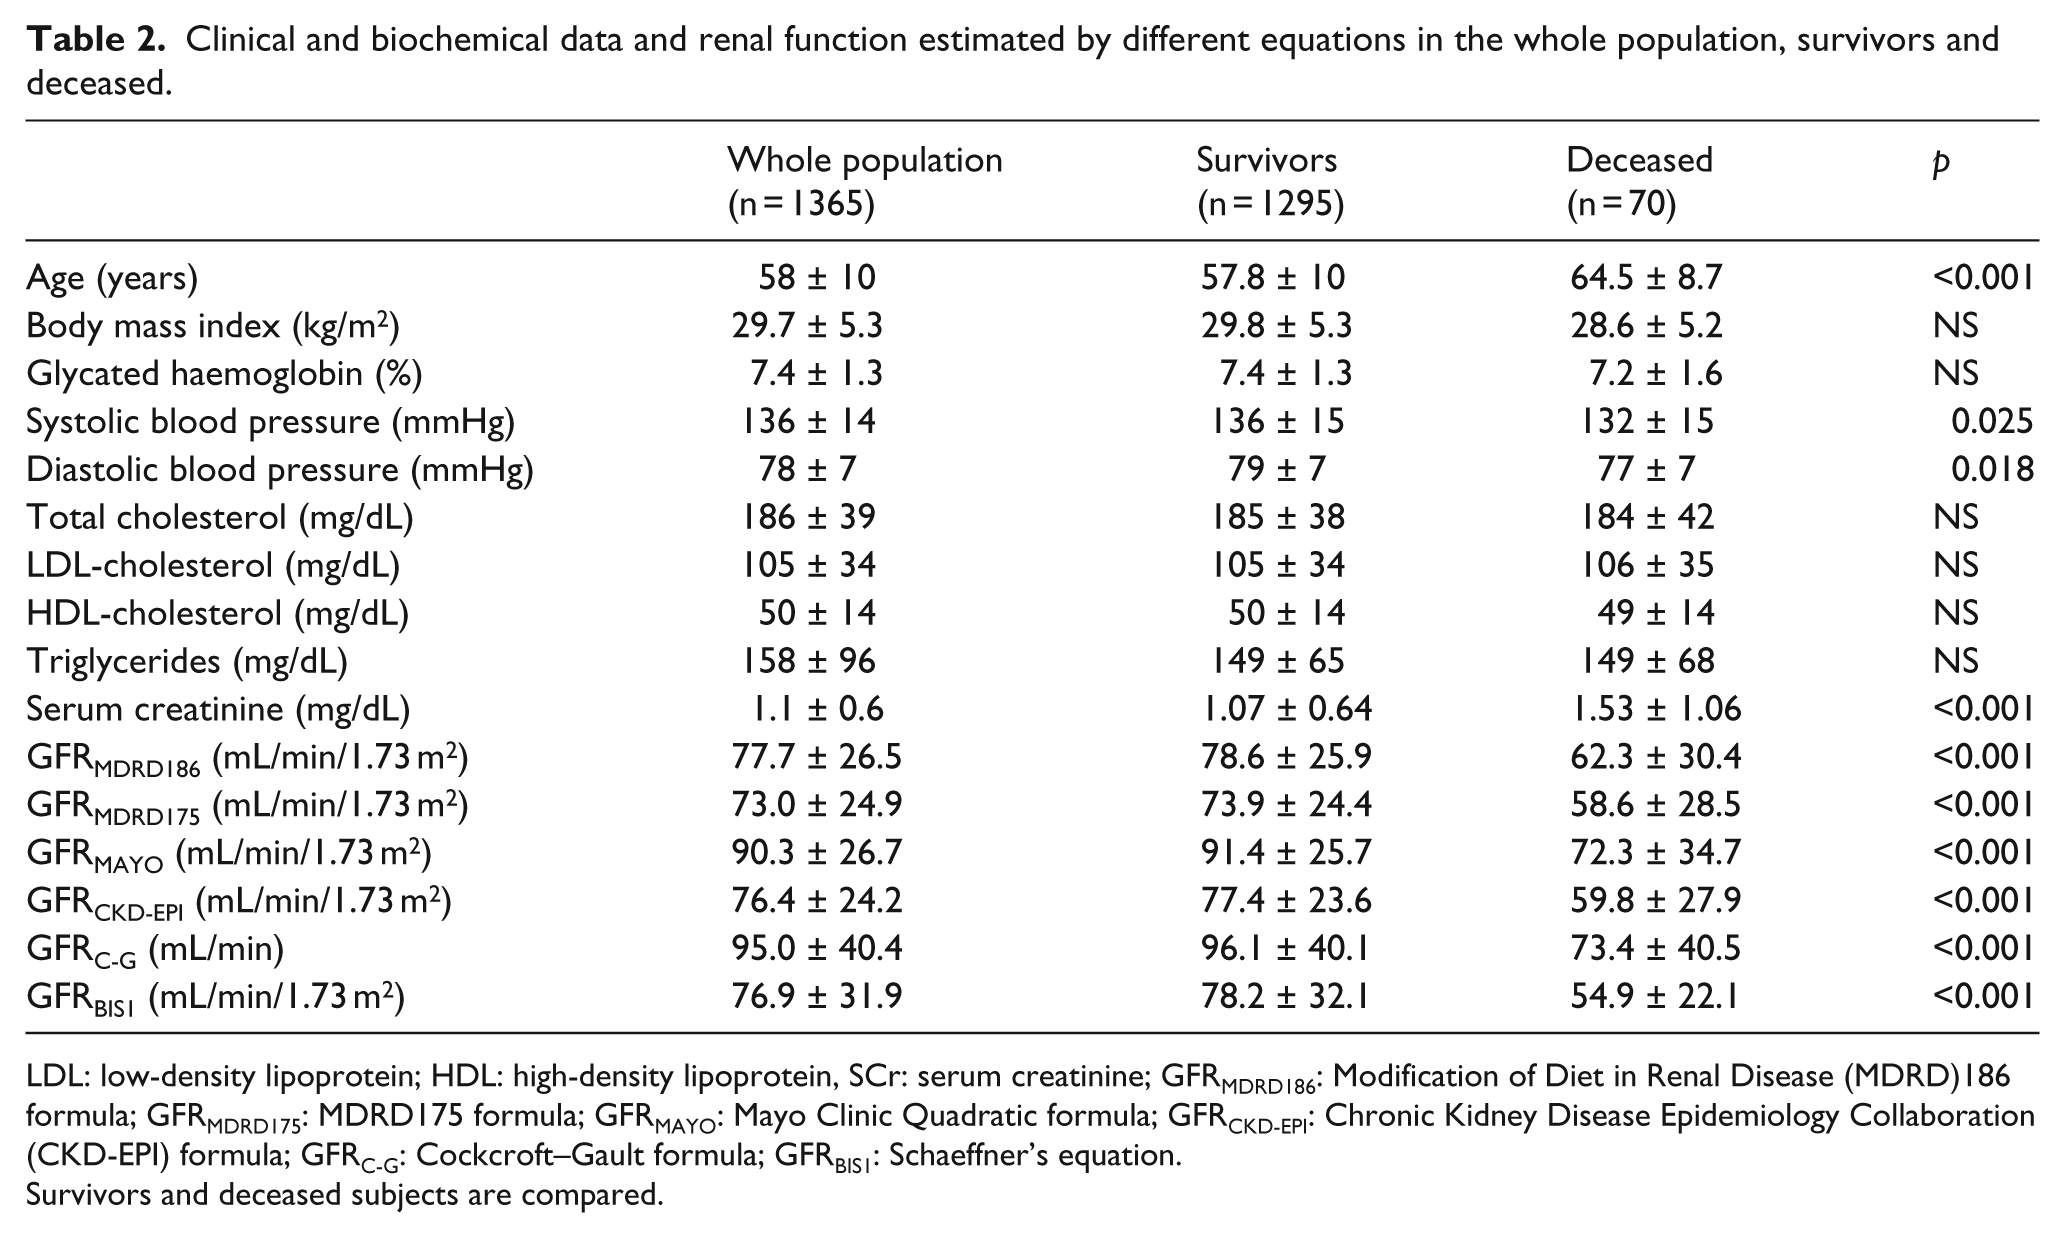
LDL: low-density lipoprotein; HDL: high-density lipoprotein, SCr: serum creatinine; GFRMDRD186: Modification of Diet in Renal Disease (MDRD)186 formula; GFRMDRD175: MDRD175 formula; GFRMAYO: Mayo Clinic Quadratic formula; GFRCKD-EPI: Chronic Kidney Disease Epidemiology Collaboration (CKD-EPI) formula; GFRC-G: Cockcroft–Gault formula; GFRBIS1: Schaeffner’s equation.
Survivors and deceased subjects are compared.
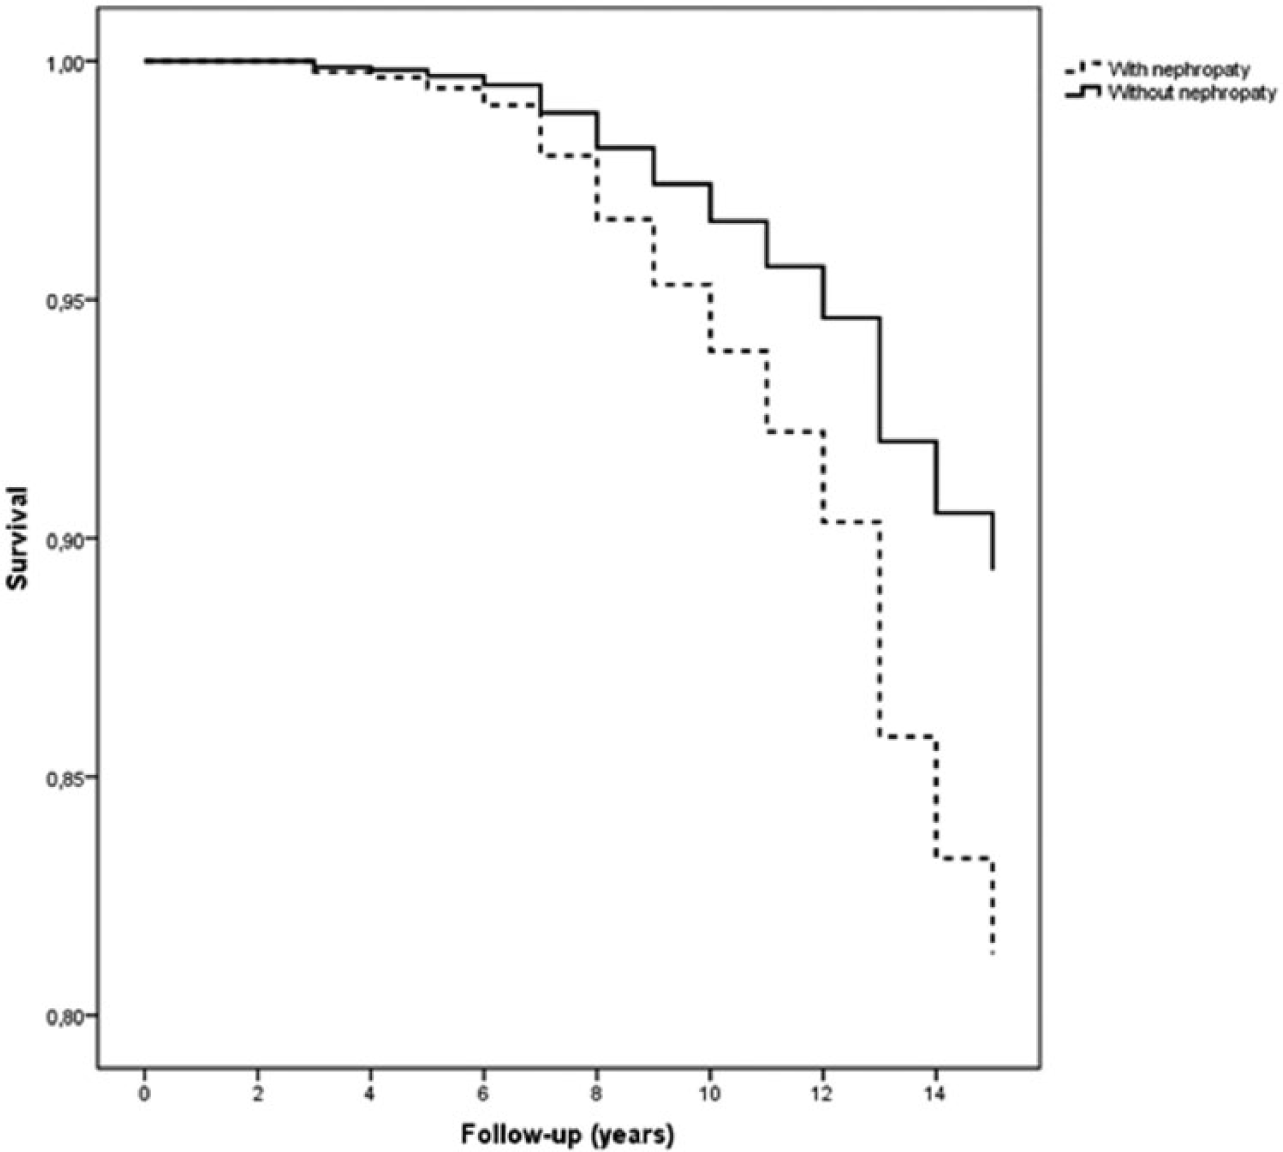
Kaplan–Meier curves of patients with and without diagnosis of nephropathy at the beginning of follow-up.
ROC analysis showed that areas under the curve (AUC) were similar using the different equations for eGFR calculation; all equation areas were superior to the SCr AUC (Figure 2). ROC curves were calculated for different time periods, 10 and 15 years, but the results were not different.
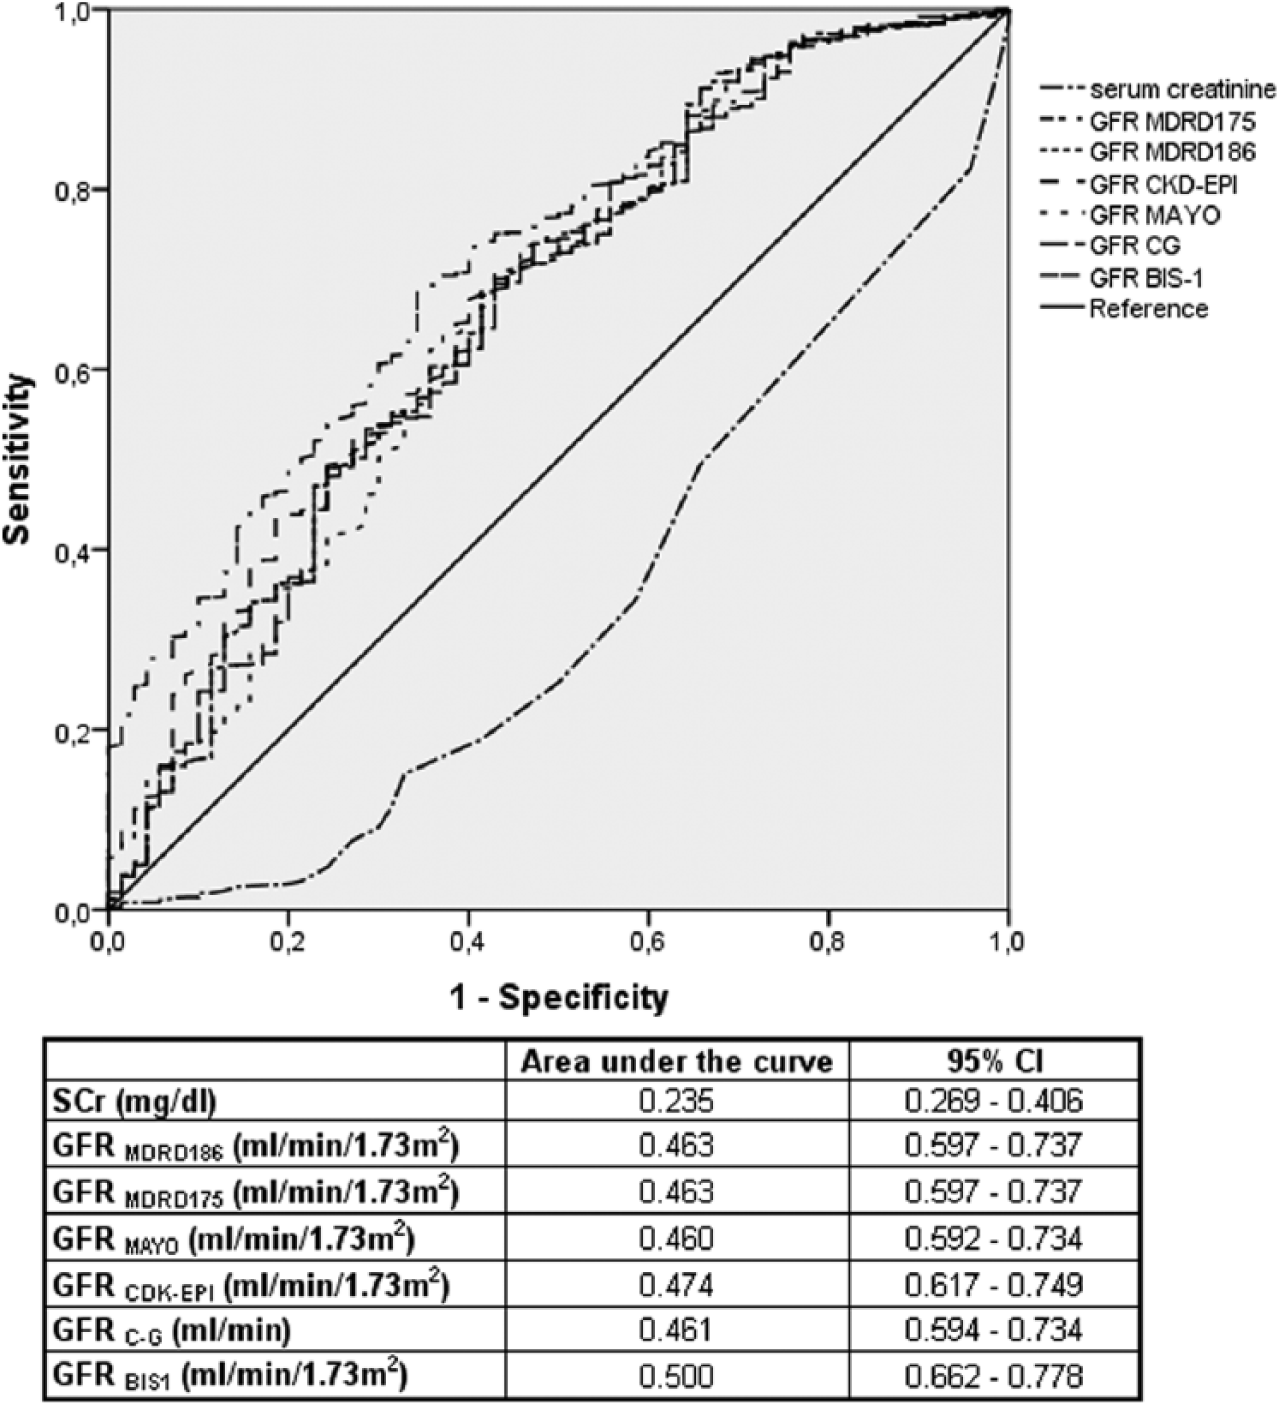
ROC curve analysing sensitivity and specificity and area under the curve for all-cause mortality of serum creatinine (SCr) and different values of GFR estimated by different formulae. GFRMDRD186: Modification of Diet in Renal Disease (MDRD) 186 formula; GFRMDRD175: MDRD 175 formula; GFRMAYO: Mayo Clinic Quadratic formula; GFRCKD-EPI: Chronic Kidney Disease Epidemiology Collaboration (CKD-EPI) formula; GFRC-G: Cockcroft–Gault formula; GFRBIS1: Schaeffner’s equation.
In order to evaluate the relationship between the different eGFR equations and ACM, we calculated HR and 95% CI by Cox regression analysis. ACM was the dependent variable, and eGFR and the other parameters were the independent ones. Age was the major risk factor for ACM (HR: 1.087, 95% CI: 1.055–1.121, p < 0.001). However, taking out age from the model in order to avoid overadjusting for age also eGFR values were predictors of ACM. The HRs of the different equations for eGFR estimation were similar (Table 3).
Results of the Cox regression analysis.
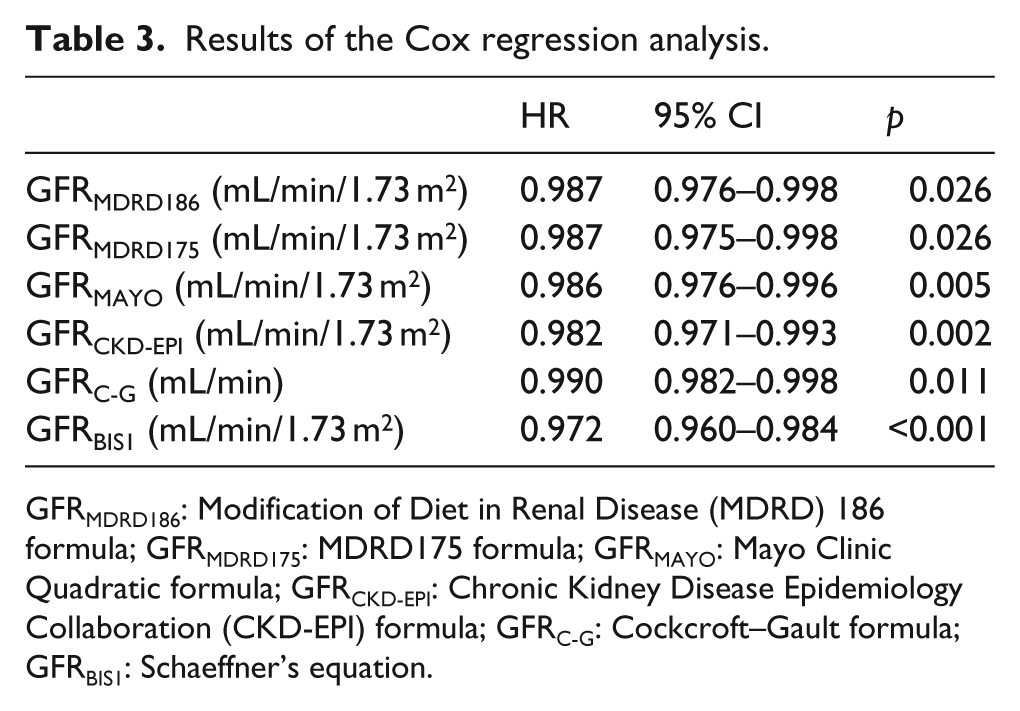
GFRMDRD186: Modification of Diet in Renal Disease (MDRD) 186 formula; GFRMDRD175: MDRD175 formula; GFRMAYO: Mayo Clinic Quadratic formula; GFRCKD-EPI: Chronic Kidney Disease Epidemiology Collaboration (CKD-EPI) formula; GFRC-G: Cockcroft–Gault formula; GFRBIS1: Schaeffner’s equation.
Discussion
The main result of this study is that eGFR correlates with ACM, whereas SCr does not. It has to be emphasized that we did not aim to precisely calculate renal function in order to classify kidney damage rather to evaluate the prognostic impact of different equations on ACM in T2DM outpatients. From a clinical point of view, the key-point of this study is that in the everyday medical practice, in T2DM outpatients, it is important to consider eGFR, while how to evaluate it appears to be not so crucial. In fact, the impact of eGFR is independent from the equation used. We suggest that combined T2DM and renal dysfunction lead to poor outcome. Again, we did not aim to evaluate the classic CV risk factors leading to widespread atherosclerotic vascular damage, responsible for both CV mortality and renal failure, but to define the clinical impact of eGFR in subjects with T2DM. In this study, we focused on renal dysfunction ‘per se’ in subjects with T2DM without considering at which CKD stage patients belonged to. To the best of our knowledge, there are a few data about eGFR, SCr and prediction of ACM. We found that in T2DM patients, a simple tool such as the eGFR is a predictor of ACM.
Interestingly, even if the equations commonly used in clinical practice are based on SCr levels, the determination of SCr alone could not predict mortality, since its levels are affected by protein intake and muscle mass. Earley et al. 15 systematically reviewed the performance of eGFR equations including formulae originally developed using standardized SCr measurements. Their study included GFRMDRD and GFRCKD-EPI; however, neither GFRMDRD nor GFRCKD-EPI equations were optimal for all populations and GFR ranges. In our study, we included both equations based on standardized SCr measurements and equations based on non-standardized SCr measurements, and we could not find any difference in the prediction of different formulae on ACM.
Evaluation of renal function is a well-established medical action in T2DM; however, determination of SCr is still widely used, although the ADA 16 suggests to evaluate eGFR by the MDRD equation. Wells et al. 17 created a mortality risk calculator for T2DM patients, and eGFR was one of the parameters needed. Although T2DM is an independent risk factor for mortality, its impact on mortality when renal function is normal is greatly reduced. 18 Renal impairment per se is an independent risk factor for in-hospital mortality due to myocardial infarction and stroke,19,20 and DM did not change mortality risk associated with renal dysfunction in subjects with CV disease. 21 It is possible that high mortality risk secondary to DM could be related to development of diabetic nephropathy, since its development is associated with fivefold higher risk of mortality. 22
As for the formulae, CKD-EPI could help in diagnosing CKD in patients with high CV risk such as those with T2DM, 12 and analysis of data from Renal Insufficiency And Cardiovascular Events (RIACE) Italian Multicentre Study highlighted that evaluating eGFR in T2DM subjects using the CKD-EPI equation, as compared with the MDRD formula, resulted in reduced CKD prevalence and provided a better definition of global CV disease burden. 23
Targher et al. 24 performed an observational longitudinal study enrolling 2823 Italian T2DM patients aiming to compare the performance of the MDRD and CKD-EPI formulae in predicting ACM and CV disease mortality during a follow-up of 6 years. Characteristics of their population were not very different from those of patients in our study. Subjects were aged 68 years; 73% were on anti-hypertensive agents, 46% on lipid-lowering agents, 57% on oral hypoglycaemic drugs and 32% on insulin therapy; and mean HbA1c values were 7.5 ± 1.5%. eGFR was 76.7 ± 23 mL/min/1.73 m2 by MDRD equation and 76.5 ± 19 mL/min/1.73 m2 by CKD-EPI formula. In total, 11% of patients died during follow-up, 152 of whom (5.4%) died of CV disease. The authors found that the CKD-EPI equation identified a greater number of all-cause deaths than the MDRD formula (124 vs 120 deaths) and concluded that in patients with T2DM, CKD-EPI formula could provide a more accurate risk prediction of ACM and CV disease mortality than the MDRD equation (AUC: 0.712 vs 0.679, p < 0.001). In our study, the AUCs were similar, and only GFR estimated by Schaeffner’s equation 14 showed a higher value. On the other hand, it should be underlined that GFRBIS1 has been conceived to estimate kidney function in subjects aged 70 years or older. However, age is a well-established risk factor for both CV mortality and ACM. On the other hand, age is a key variable in GFR calculation with any formula, and age and GFR are highly correlated. Considering age and GFR in the same model could create overadjustment; therefore, different models should be created including age or GFR as the independent variable.
Our study has limitations. First, mortality rate and total number of death were low, suggesting the possibility that either the population studied was too small or the duration of follow-up was too short. Besides, we evaluated GFR only at the first enrolment visit, and we did not record any variation during the study period. We also did not record variations in any of the considered parameters during the follow-up. Moreover, we only considered ACM without recording cardiovascular mortality ‘per se’, due to the low number of non-CV death. Based on the higher proportion of subjects treated with statins in survivors than in deceased group, a possible significant impact of cardiovascular death can only be suggested. The mean age of our population was 58 years, and the proportion of subjects with cardiovascular complication at the start of the study was quite low; on the other hand, about 22% of subjects had diabetic nephropathy and more than 10% had microalbuminuria. Yu et al. 25 conducted a cohort study to evaluate the relationship between proteinuria, GFR and mortality in subjects with T2DM. Patients with proteinuria had higher rate of mortality; however, patients with both proteinuria and GFR <60 mL/min/1.73 m2 had higher ACM than those with proteinuria only. Moreover, Barkoudah et al. 26 suggested that decreasing renal function is probably stronger than microalbuminuria in predicting death. On the other hand, it has been reported that atherosclerotic vascular damage is higher in the presence of renal dysfunction. 27
Last but not least, our study is single-centre based and included only Caucasian subjects. Therefore, our results may not be generalizable. However, in a previous investigation conducted with a similar design in older subjects admitted because of cardio-renal syndrome, we found that evaluation of GFR with whatever formula, but not SCr, could predict long-term mortality. 28 Finally, we confirmed that in subjects with metabolic derangements, treatment with statins could impact survival. 29
For the everyday clinical practice in T2DM patients, the best biomarker is GFR evaluation, independent of the formula used, and physicians should not rely on SCr only. Our results regarding the relationship between eGFR and ACM are not different from those published in a large observational population-based cohort of T2DM patients enrolled in the National Diabetes Register (NDR) in Sweden between 2003 and 2006 with a follow-up of 5.7 years. 30 Out of more than 66,000 subjects, a total of 10% of patients experienced a CV event, and 3.7% of these were fatal. Increasing levels of albuminuria and renal impairment were independently associated with increasing risk of CV events and ACM. Moreover, authors reported that in normoalbuminuric patients, a reduction in renal function was an important predictor of CV events and ACM. In this study, renal impairment, defined as eGFR < 60 mL/min/1.73 m2, was reported in 17% of population; however, eGFR was not analysed as a continuous variable as we did. In our study, patients were younger and nephropathy was diagnosed in 21.7% of cases, and these data could explain some difference in results; in fact, proteinuria was not independently associated with ACM, although micro and macroalbuminuria was analysed similarly. Moreover, in our study, the presence of microvascular complication was associated with death in the univariate analysis but not in the multivariate ones.
To the best of our knowledge, this is the first study that made an attempt to analyse the impact of different GFR equations as long-term prognostic factor in T2DM outpatients. GFR calculation and the evaluation of its reduction, with any equation, should be a critical step to better define the highest risk patients and arrange the most appropriate therapeutic strategy.
Footnotes
Acknowledgements
F.F. had the primary idea and wrote the article; A.D.G., M.M., M.P., R.T., E.M., C.P., R.V. and R.G. researched and analysed data and contributed to the discussion; and D.P.M. and R.M. contributed to the discussion and reviewed/edited the article.
Declaration of conflicting interests
F.F., A.D.G., M.M., M.P., R.T., E.M., C.P., R.V., R.G. and R.M. had no conflict of interest; D.P.M. has given talks, attended conferences and participated in advisory boards and trials sponsored by Merck, Sharp & Dohme.
Funding
This article was supported, in part, by a scientific grant (FAR – Fondo Ateneo Ricerca) from the University of Ferrara, Italy.