
Abstract
Low-density lipoprotein cholesterol (LDL-C) is a major risk factor for atherosclerotic disease. Despite its limitations, Friedewald-calculated LDL-C (F-LDL-C) remains widely used for LDL-C determination. In this observational study of 1999 adults with type 2 diabetes mellitus (T2DM), we compare the accuracy of F-LDL-C to directly measured LDL-C (M-LDL-C) and derived and validated a new [SMART2D (Singapore Study of MAcro-angiopathy and Micro-Vascular Reactivity in Type 2 Diabetes)] formula to estimate LDL-C. From 1000 randomly selected patients, M-LDL-C was compared to F-LDL-C. Using multiple linear regression to identify independent predictors for M-LDL-C, the SMART2D equation was derived and subsequently validated in the next 981 patients. F-LDL-C was 0.367 (0.216) mmol/L lower than M-LDL-C. This difference was −0.009 (0.189) for SMART2D-LDL-C. Using F-LDL-C, 27% with M-LDL-C ≥2.6 mmol/L were classified as LDL-C <2.6 mmol/L, reduced to 2.1% when using SMART2D-LDL-C. With F-LDL-C, misclassification was greater when triglycerides were ≥2.2 mmol/L, especially for the lower LDL-C cut-offs (1.8 and 2.6 mmol/L), and this was markedly improved with SMART2D-LDL-C. In conclusion, in T2DM, F-LDL-C underestimates M-LDL-C, with misclassifications that may potentially have an impact on therapeutic decisions in T2DM. The SMART2D equation improves accuracy of estimate, reducing misclassifications. Trials will be needed to ascertain the clinical significance of these findings.
Introduction
Low-density lipoprotein cholesterol (LDL-C) is a key predictor of atherosclerotic cardiovascular disease (ASCVD),1–3 used in clinical decision-making algorithms 4 and as the primary target in most clinical practice guidelines aimed at reducing cardiovascular risk.5–8
The reference method for determining LDL-C is based on beta-quantification, which combines ultracentrifugation and precipitation, and is technically more demanding and labour intensive compared to direct LDL-C measurement.9,10 Most landmark clinical trials use an indirect estimation of LDL-C using the Friedewald formula, 11 which assumes a constant relationship between very-low-density lipoprotein cholesterol (VLDL-C) and triglycerides (TGs) (up to 4.5 mmol/L).11,12 Together with its simplicity and low cost, the Friedewald formula also has good correlation with measured LDL-C (M-LDL-C) in patients with desirable TG levels.13,14 However, this formula has imitations including the need for fasting and the reduced reliability of the calculation when plasma TG exceeds 4.5 mmol/L, as the presence of chylomicrons or intermediate density lipoprotein (IDL) may result in overestimation of VLDL-C, consequently underestimating LDL-C. 15 Assessment of LDL-C by using this formula, in clinical pathologies associated with these abnormalities in lipoprotein composition, for example, in alcoholism, dysbetalipoproteinemia and type 2 diabetes mellitus (T2DM),16,17 may thus result in inaccuracies.
With accurate and convenient direct LDL-C measurements currently available 10 and clinical guidelines recommending increasingly lower LDL-C targets in patients with high risk of ASCVD, the utility of the Friedewald formula in determining LDL-C levels to guide key clinical decision-making in patients with insulin resistance and diabetes mellitus deserves re-evaluation. Inaccurately estimating LDL-C and misclassifying patients into an inappropriate risk category may potentially result in patients receiving lower than the recommended intensity of LDL-C lowering for their ASCVD risk.
This study hypothesizes that even in T2DM patients with desirable TG levels and glycaemic control, Friedewald estimation of LDL-C may underestimate M-LDL-C, leading to potential misclassification of cardiovascular risk in our unique multi-ethnic Asian population. Additionally, we explored whether underestimation of LDL-C, if present, has an impact large enough to affect therapeutic decisions and studied and validated a new equation to optimally estimate LDL-C in our T2DM patients.
Patients and methods
Study design
In this observational study, adults aged 21–90 years with T2DM (n = 1999) were recruited from August 2011 till February 2014 as part of the ongoing Singapore Study of MAcro-angiopathy and Micro-Vascular Reactivity in Type 2 Diabetes (SMART2D). 18 In brief, the SMART2D is a cross-sectional study of adults with T2DM aimed at understanding traditional and novel risk factors of long-term complications of diabetes and their association with endothelial dysfunction and vascular stiffness. In addition to anthropometric measurements and documentation of complications in the foot, eyes and kidneys, patients are assessed for endothelial function by laser Doppler flowmetry, vascular stiffness by measurement of pulse wave velocity and augmentation index by applanation tonometry (SphygmoCor®). As part of this study, all patients were seen after a 10-h overnight fast and had venous blood and urine samples collected for biochemical analyses including fasting lipid, glucose profiles and haemoglobin A1c (HbA1c). The study was approved by our institution’s domain-specific ethics review committee, and written informed consent was obtained from each participant.
To answer the aims of this study, from the 1999 patients, using SPSS version 21, we randomly selected 1000 patients to form the preliminary Derivation Cohort. From this preliminary Derivation Cohort, only patients with TGs below 4.5 mmol/L (n = 977) were included in the actual Derivation Cohort. From the remaining 999 patients in the SMART2D, 981 with TGs <4.5 formed the Validation Cohort.
Data collection
Biochemical analyses on blood and urine were carried out at our institution’s Referral Laboratory, which is accredited by the College of American Pathologists. Plasma glucose was obtained by enzymatic methods using blood collected in fluoride oxalate tubes. Random urinary spot albumin and creatinine were measured using commercial assays (IMMULITE; DPC, UK and Roche Diagnostics GmbH, Germany for urinary albumin and creatinine, respectively). Serum total cholesterol (TC), TG, high-density lipoprotein cholesterol (HDL-C) and LDL-C levels were measured using an automated analyser (Roche Cobas C501). This assay for LDL-C direct measurement, shown to give results comparable to that of the gold standard of beta-quantification, 10 has a measurement range of between 0.1 and 14.2 mmol/L, with a coefficient of variation of 1.6%. For purposes of this study, patients with TG levels ≥4.5 mmol/L were excluded (n = 41, 2.1% of sample). For those with TGs below 4.5 mmol/L, LDL-C in mmol/L was calculated using Friedewald formula [F-LDL-C = TC-HDL-C − triglyceride/2.2]. 11
Statistical analysis
All analyses were performed in SPSS version 21 (SPSS Inc., Chicago, IL, USA). Results for normally distributed continuous variables are presented as mean [1 standard deviation (SD)] and median (interquartile range), while binary variables are presented as absolute numbers or in percentage. Binary and continuous variables with normal distribution were analysed using Chi-square and Student’s t-test, respectively, while non-parametric tests were used for quantitative variables which were not normally distributed. Analysis of variance was used to compare the mean LDL-C difference according to LDL-C categories. To compare measured and calculated LDL-C levels, the difference between the two values for each patient and the LDL-mean [(measured + calculated LDL-C)/2] were derived. Bland–Altman plot was used to demonstrate the degree of agreement between the measured and calculated LDL-C levels.
To assess the degree of misclassification, the proportion of patients with calculated LDL-C <1.8 mmol/L (LDL-C target for patients with very high ASCVD risk), but with M-LDL-C ≥1.8 mmol/L, was compared using Chi-square analysis. Cohen’s kappa coefficient of >0.7 was taken as good agreement. To adjust and correct for any negative bias by Friedewald-calculated LDL-C (F-LDL-C), the following two approaches were adopted.
From the Derivation Cohort, the first approach was to add a simple correction factor (the mean difference between measured and F-LDL-C) to the F-LDL-C, to derive the adjusted-F-LDL-C.
In a second approach, to estimate LDL-C, multivariate linear regression was used to derive the relation of M-LDL-C with TC, HDL-C, TGs and HbA1c, adjusting for age and ethnicity. The final SMART2D equation (Model 1 in Table 2) to estimate LDL-C (denoted as SMART2D-LDL-C) only included the factors which were statistically significant in the full model.
The findings from both approaches were then validated using the Validation Cohort. To compare the measured-LDL-C with the different approaches used to calculate LDL-C as defined above, that is, F-LDL-C, adjusted-F-LDL-C and SMART2D-LDL-C, the difference between the two values for each patient and the mean LDL-C were derived. Bland–Altman plot was used to demonstrate the degree of agreement between the M-LDL-C and different calculations of LDL-C. Statistical significance was set at p < 0.05.
Results
Of the 1958 T2DM patients with TGs <4.5 mmol/L, the mean duration (1 SD) of diabetes was 11.4 (8.9) years, with 51% of the cohort being Chinese, Malays and Indians comprising 23% each. Statin use was present in 81% of the study population, while fibrates were used in 9.7%.
Derivation Cohort
Table 1 compares the baseline characteristics of the Derivation and Validation Cohorts. Mean M-LDL-C was 2.74 (0.83) mmol/L. F-LDL-C was lower than the LDL-C by direct measurement with mean difference of 0.367 (0.216) (Figure 1(a)). When comparing ethnicities, Chinese had significantly greater LDL-C difference than Indians when comparing measured to F-LDL-C, 0.387(0.187), and 0.321(0.216), respectively (p < 0.002).
Baseline characteristics of study population.
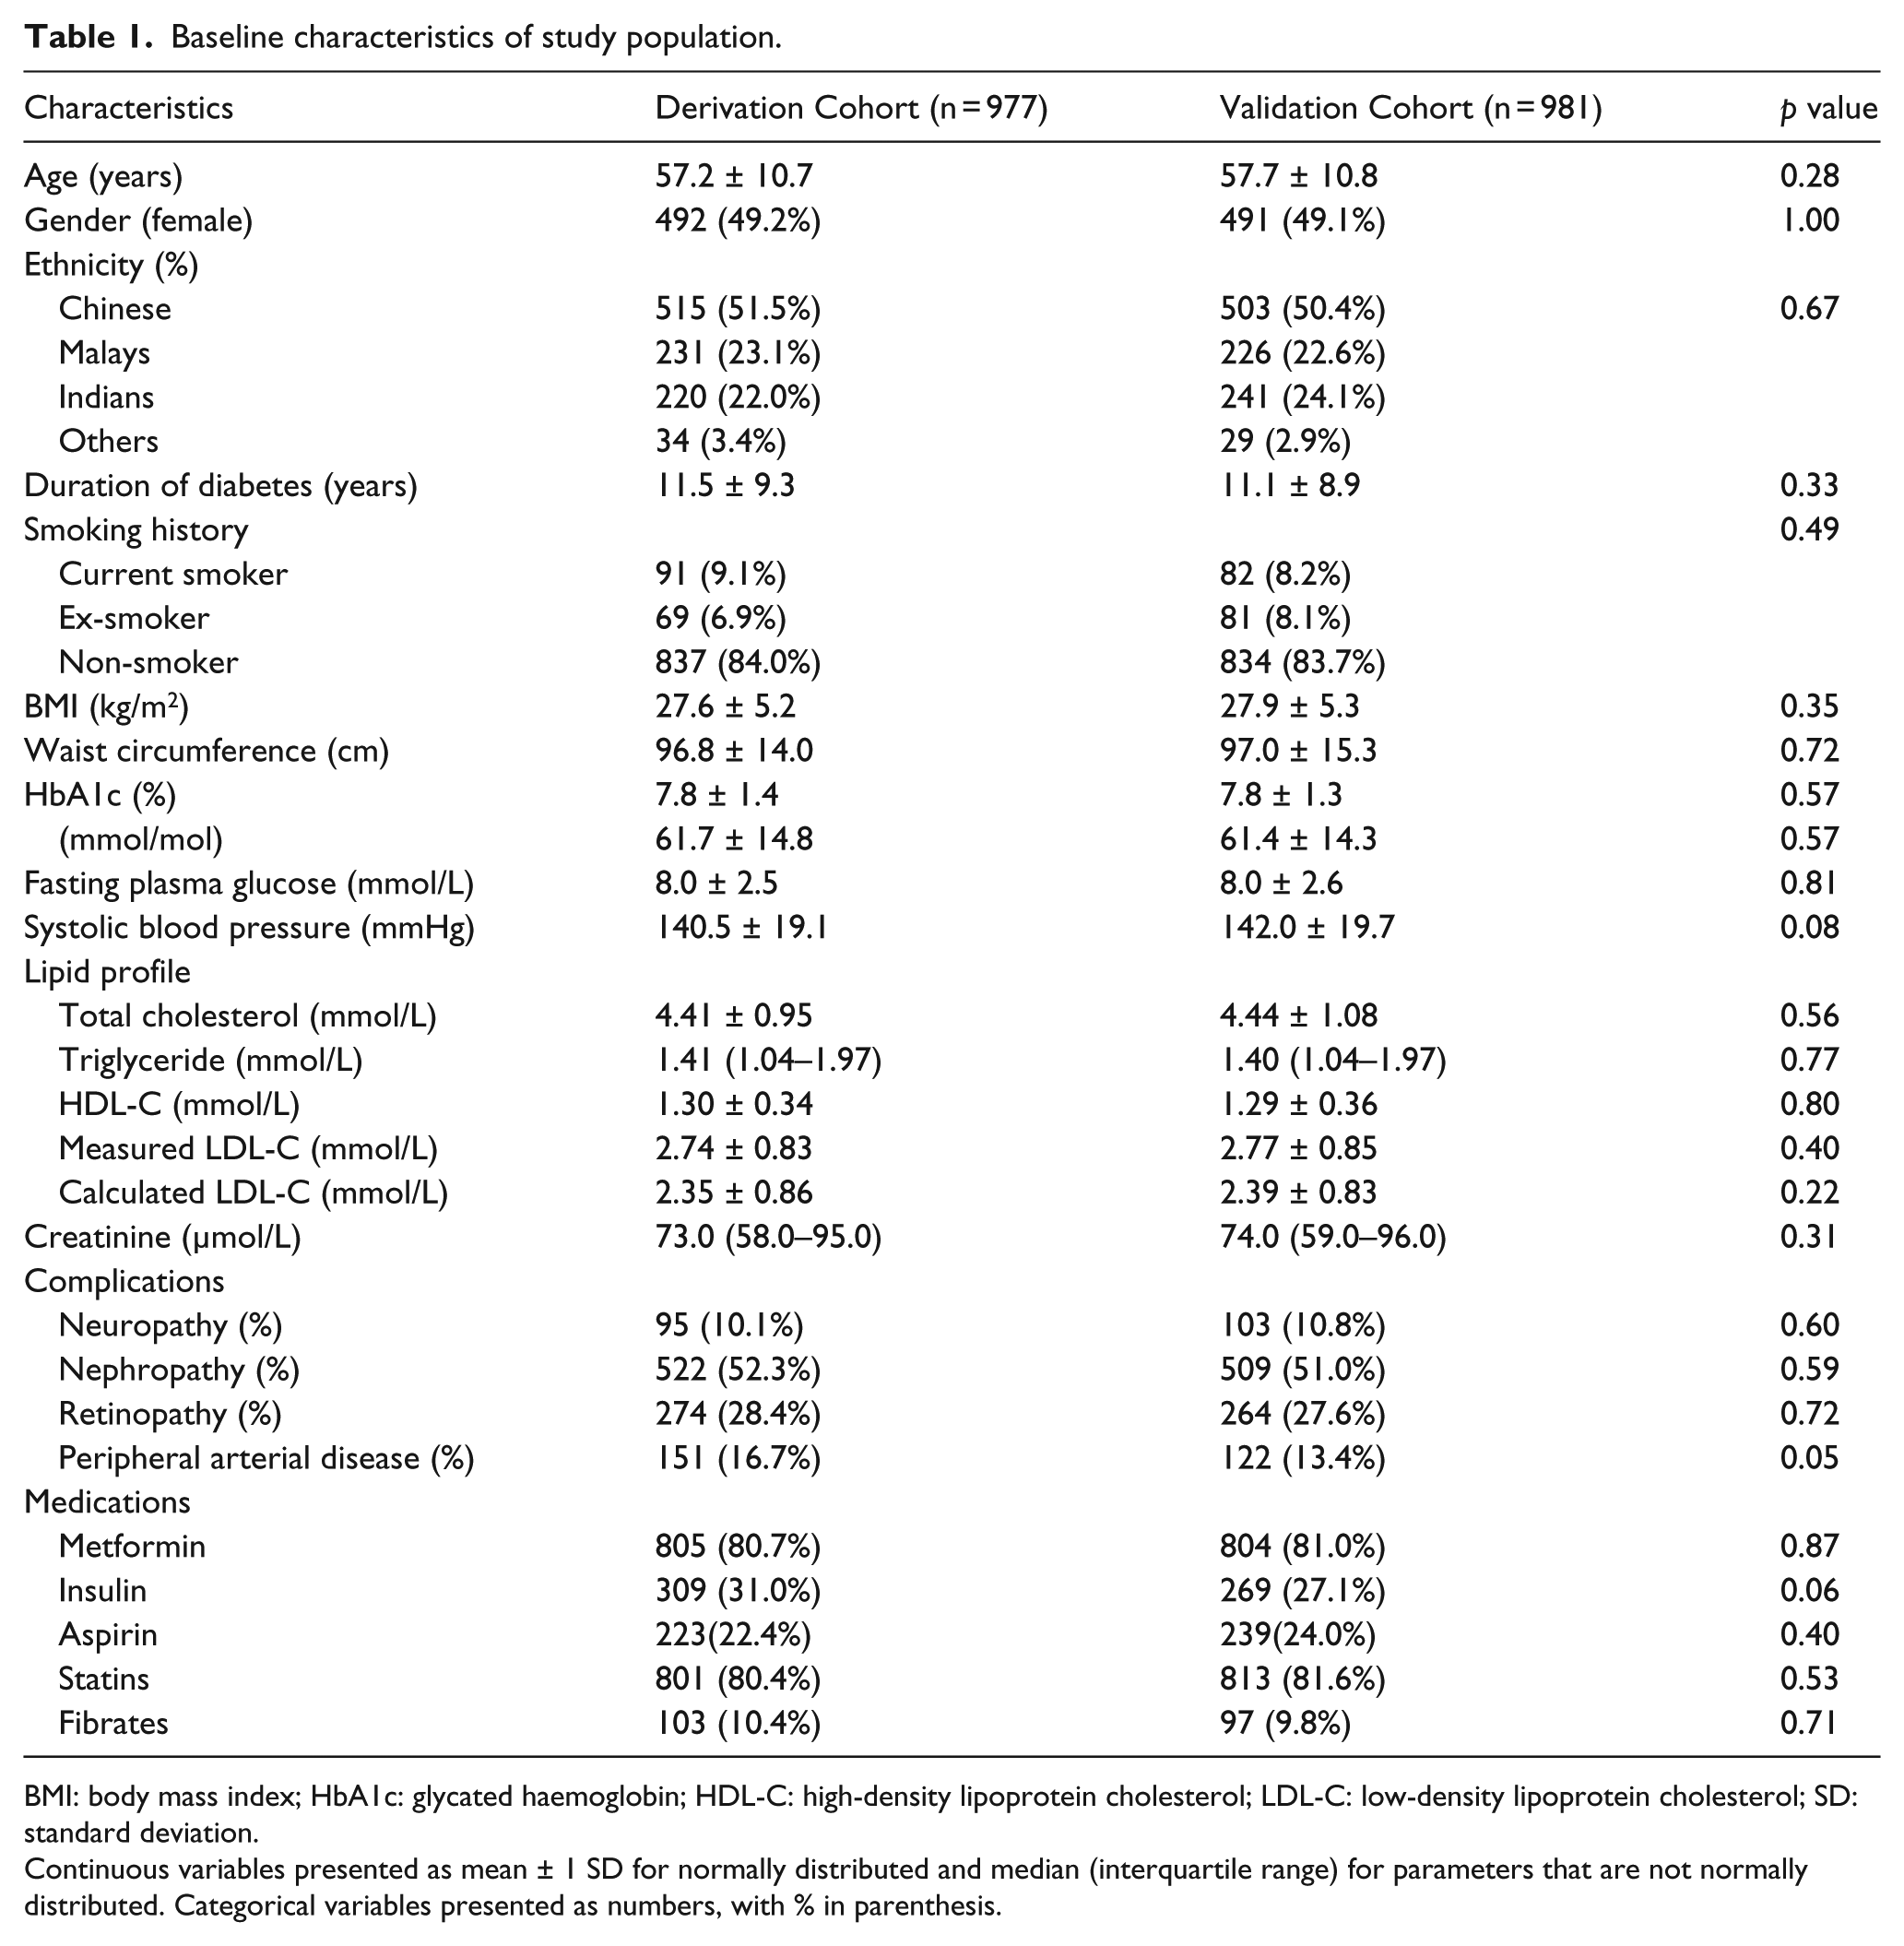
BMI: body mass index; HbA1c: glycated haemoglobin; HDL-C: high-density lipoprotein cholesterol; LDL-C: low-density lipoprotein cholesterol; SD: standard deviation.
Continuous variables presented as mean ± 1 SD for normally distributed and median (interquartile range) for parameters that are not normally distributed. Categorical variables presented as numbers, with % in parenthesis.
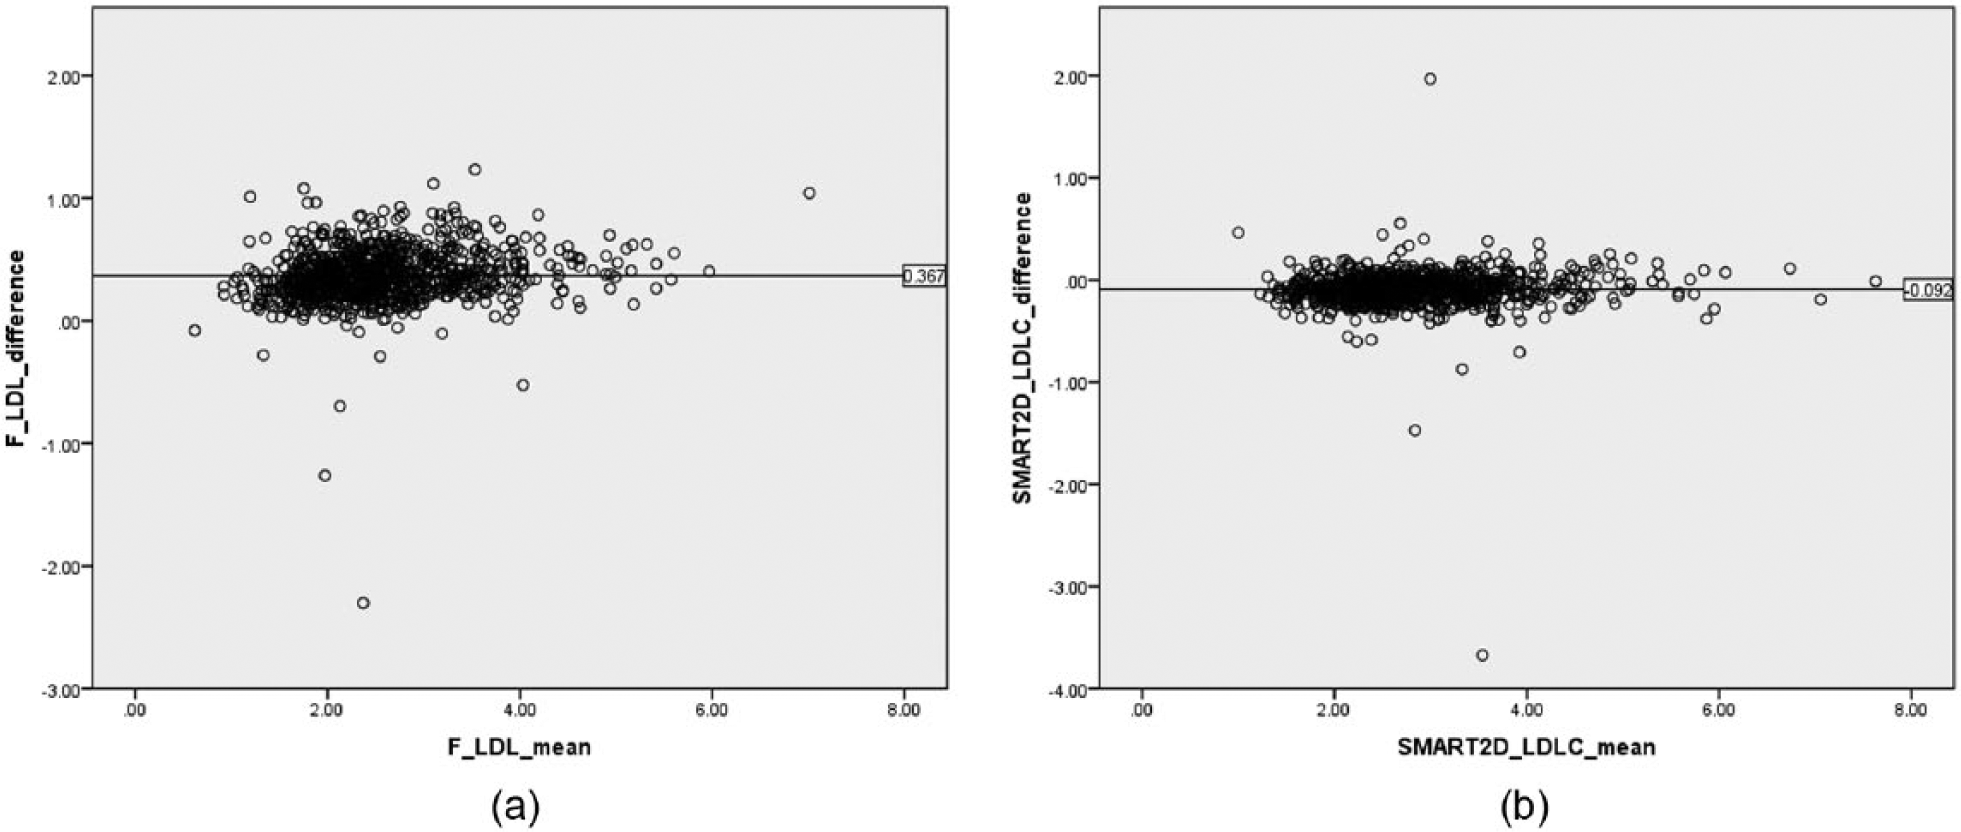
(a) Bland–Altman plot showing the mean difference between directly measured and Friedewald-calculated LDL-C values from the Derivation Cohort and (b) Bland–Altman plot showing the mean difference between directly measured and SMART2D-calculated LDL-C values from the Validation Cohort.
The correction factor of 0.367 (the mean difference in the Derivation Cohort) was added to the F-LDL-C to derive the adjusted-F-LDL-C. The mean difference between the measured and adjusted-F-LDL-C was −0.047 (0.192) when TGs <2.2 mmol/L but 0.237 (0.174) when TGs ≥2.2 (p < 0.0001).
Using multivariate linear regression (Table 2), after adjusting for age, HbA1c, and ethnicity, the SMART2D equation, SMART2D-LDL-C = 0.990 × (TC) − 0.855 × (HDL-C) − 0.245 × (TGs) − 0.093, was derived.
Regression analysis for covariates used to derive the SMART2D equation.
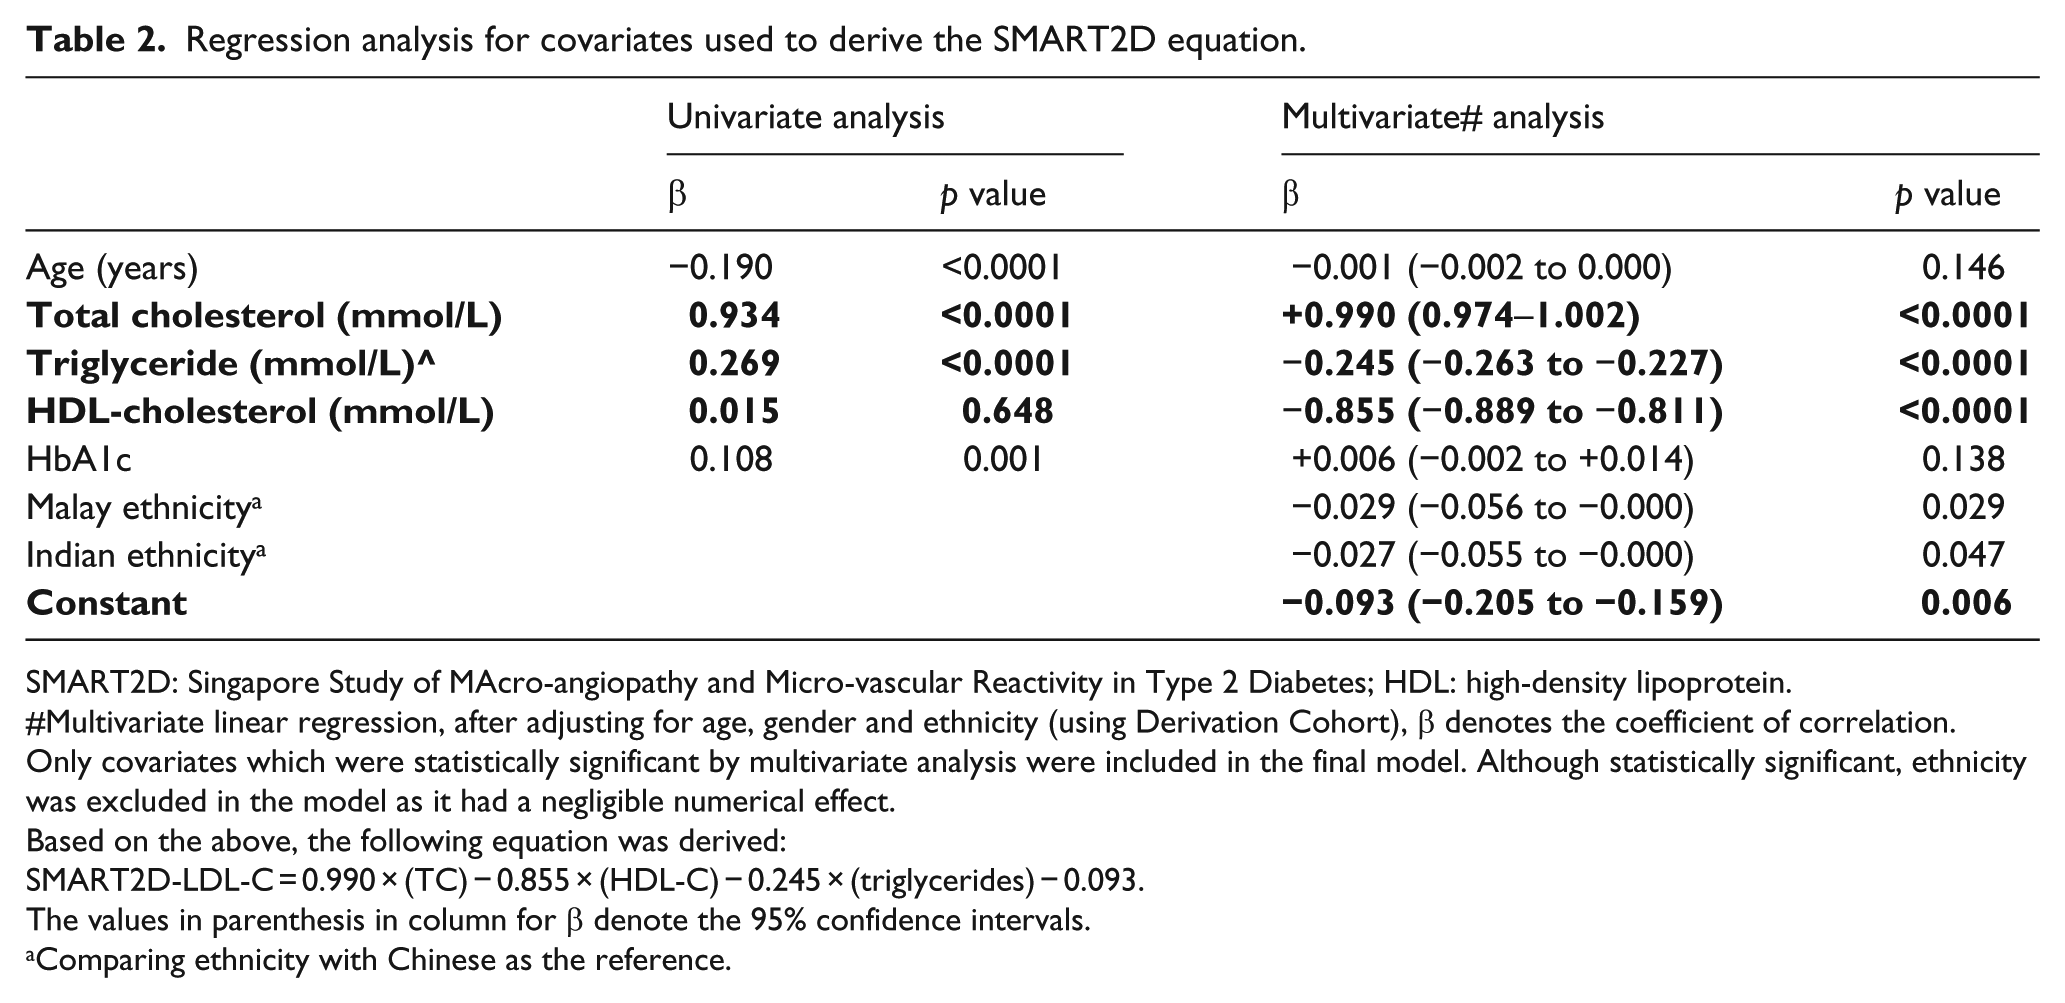
SMART2D: Singapore Study of MAcro-angiopathy and Micro-vascular Reactivity in Type 2 Diabetes; HDL: high-density lipoprotein.
Multivariate linear regression, after adjusting for age, gender and ethnicity (using Derivation Cohort), β denotes the coefficient of correlation.
Only covariates which were statistically significant by multivariate analysis were included in the final model. Although statistically significant, ethnicity was excluded in the model as it had a negligible numerical effect.
Based on the above, the following equation was derived:
SMART2D-LDL-C = 0.990 × (TC) − 0.855 × (HDL-C) − 0.245 × (triglycerides) − 0.093.
The values in parenthesis in column for β denote the 95% confidence intervals.
Comparing ethnicity with Chinese as the reference.
Validation Cohort
The characteristics of the Validation Cohort were similar to those of the Derivation Cohort (Table 1). The SMART2D-LDL-C was not significantly different from M-LDL-C (Figure 1(b)), regardless of TG levels. This is in contrast to F-LDL-C and adjusted-F-LDL-C which had significant differences, especially in those with TGs ≥2.2 mmol/L (Table 3). In those with TGs ≥2.2 mmol/L, 53.5% (46/86) who had F-LDL-C values <2.6 mmol/L had M-LDL-C values ≥2.6 mmol/L, while this was 35.0% (21/60) and 8.8% (3/34) for adjusted-F-LDL-C and SMART2D-LDL-C, respectively. All patients who had F-LDL-C ≥2.6 mmol/L had M-LDL-C ≥2.6 mmol/L, but in those with raised TGs (≥2.2 mmol/L), the false positive rate for LDL-C ≥2.6 mmol/L was 1% using adjusted-F-LDL-C and 7.1% with SMART2D-LDL-C.
Mean difference between measured LDL-C and calculated LDL-C in the Validation Cohort.
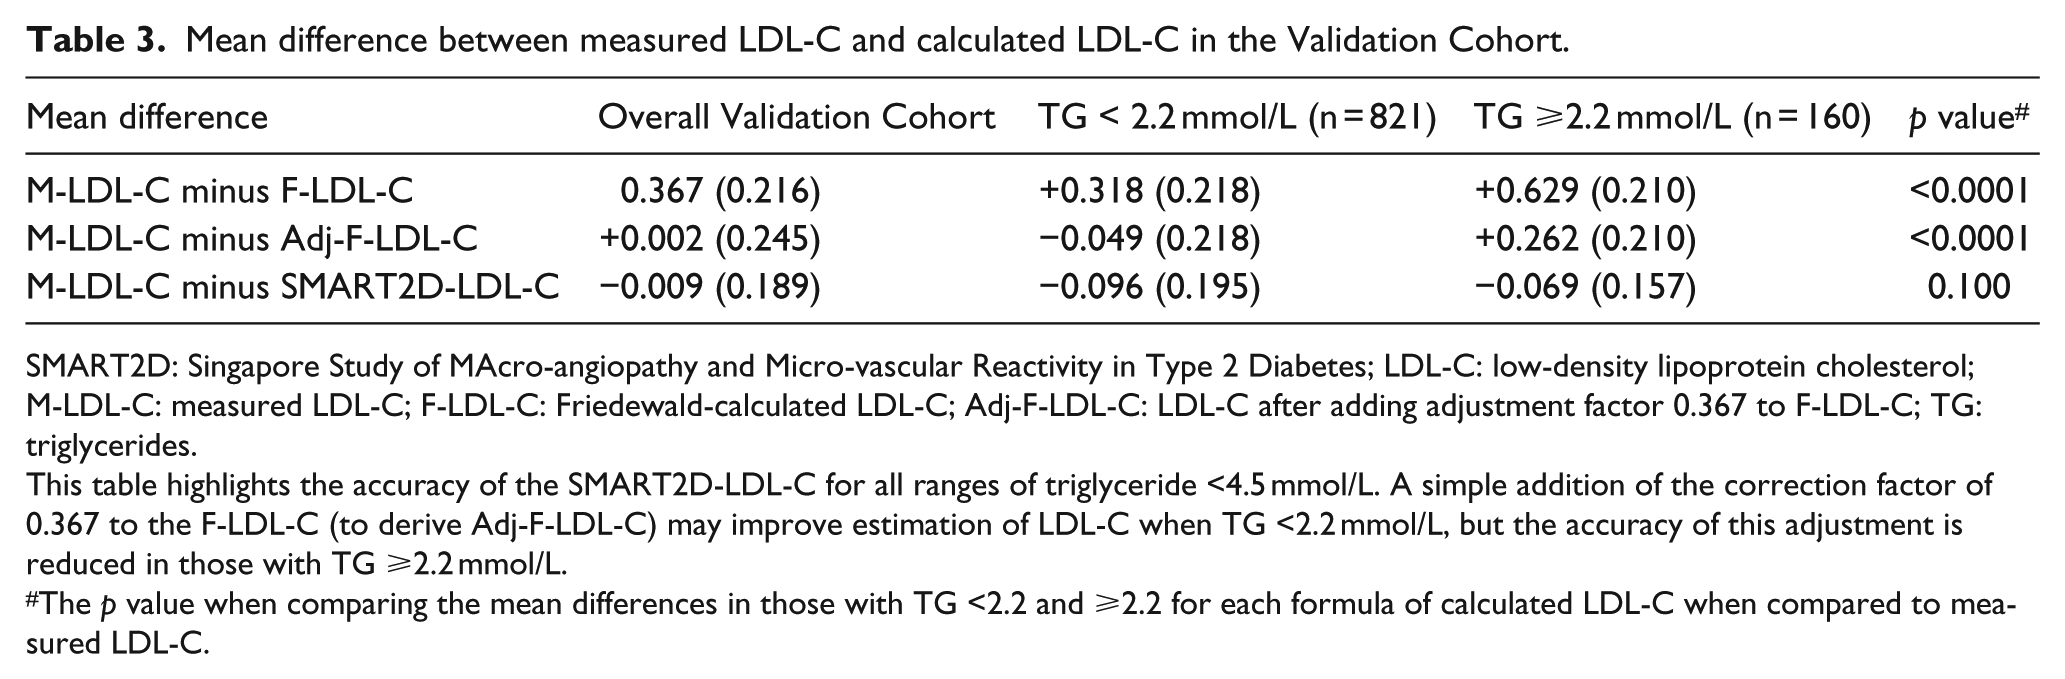
SMART2D: Singapore Study of MAcro-angiopathy and Micro-vascular Reactivity in Type 2 Diabetes; LDL-C: low-density lipoprotein cholesterol; M-LDL-C: measured LDL-C; F-LDL-C: Friedewald-calculated LDL-C; Adj-F-LDL-C: LDL-C after adding adjustment factor 0.367 to F-LDL-C; TG: triglycerides.
This table highlights the accuracy of the SMART2D-LDL-C for all ranges of triglyceride <4.5 mmol/L. A simple addition of the correction factor of 0.367 to the F-LDL-C (to derive Adj-F-LDL-C) may improve estimation of LDL-C when TG <2.2 mmol/L, but the accuracy of this adjustment is reduced in those with TG ≥2.2 mmol/L.
The p value when comparing the mean differences in those with TG <2.2 and ≥2.2 for each formula of calculated LDL-C when compared to measured LDL-C.
The clinical accuracy of calculated LDL-C using Friedewald equation and the SMART2D equation, subdivided according to LDL-C cut-off points, is shown in Tables 4 and 5, respectively. When using F-LDL-C, 61.1% (127/208) of patients who had F-LDL-C values <1.8 mmol/L had M-LDL-C values ≥1.8 mmol/L (Cohen’s kappa was 0.49), while 26.2% (167/638) who had F-LDL-C <2.6 mmol/L had M-LDL-C ≥2.6 mmol/L (Cohen’s kappa was 0.65). This degree of difference in classification was reduced by using both the SMART2D-LDL-C and the adjusted-LDL-C (Tables 5 and 6).
Concordance in calculated LDL-C and measured LDL-C categories at various LDL-C cut-off points using the Validation Cohort.
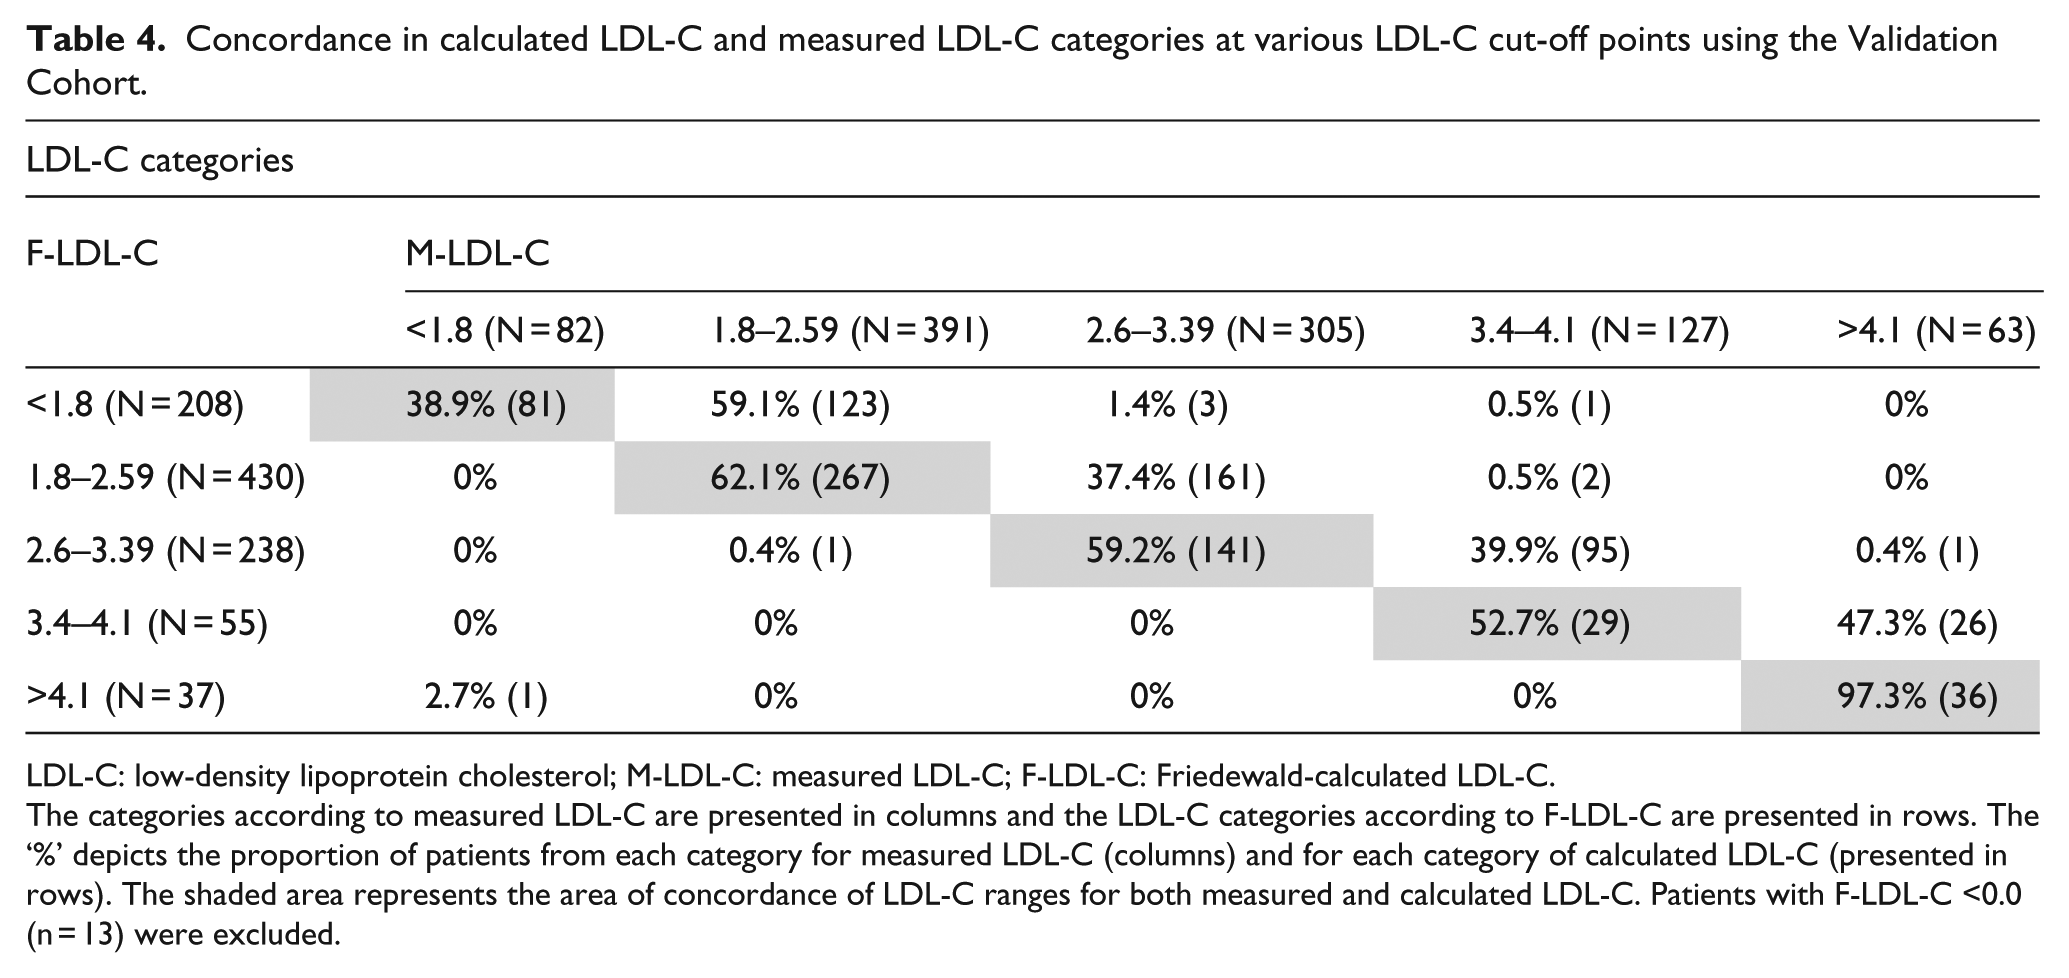
LDL-C: low-density lipoprotein cholesterol; M-LDL-C: measured LDL-C; F-LDL-C: Friedewald-calculated LDL-C.
The categories according to measured LDL-C are presented in columns and the LDL-C categories according to F-LDL-C are presented in rows. The ‘%’ depicts the proportion of patients from each category for measured LDL-C (columns) and for each category of calculated LDL-C (presented in rows). The shaded area represents the area of concordance of LDL-C ranges for both measured and calculated LDL-C. Patients with F-LDL-C <0.0 (n = 13) were excluded.
Concordance in calculated SMART2D-LDL-C and measured LDL-C categories at various LDL-C cut-off points using the Validation Cohort.
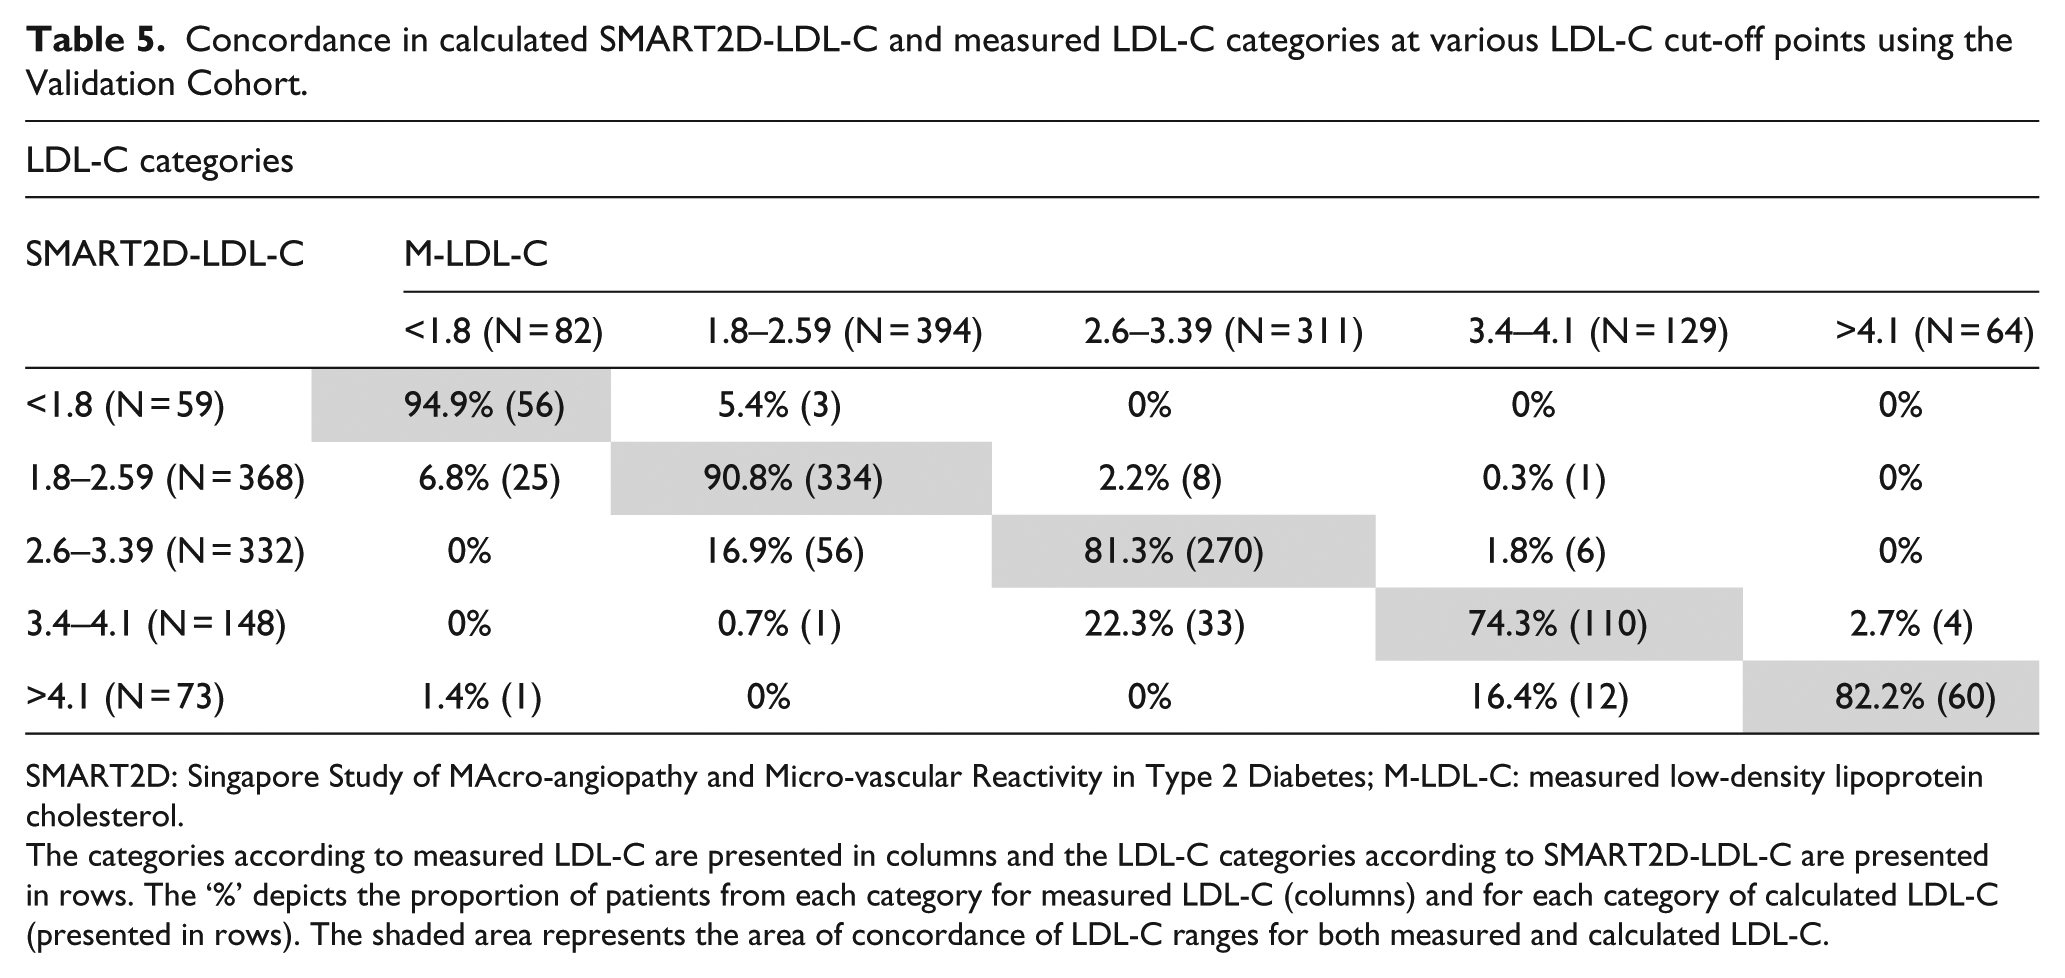
SMART2D: Singapore Study of MAcro-angiopathy and Micro-vascular Reactivity in Type 2 Diabetes; M-LDL-C: measured low-density lipoprotein cholesterol.
The categories according to measured LDL-C are presented in columns and the LDL-C categories according to SMART2D-LDL-C are presented in rows. The ‘%’ depicts the proportion of patients from each category for measured LDL-C (columns) and for each category of calculated LDL-C (presented in rows). The shaded area represents the area of concordance of LDL-C ranges for both measured and calculated LDL-C.
Proportion of patients with misclassification of LDL-C risk category defined according to measured LDL-C if calculated LDL-C was used.
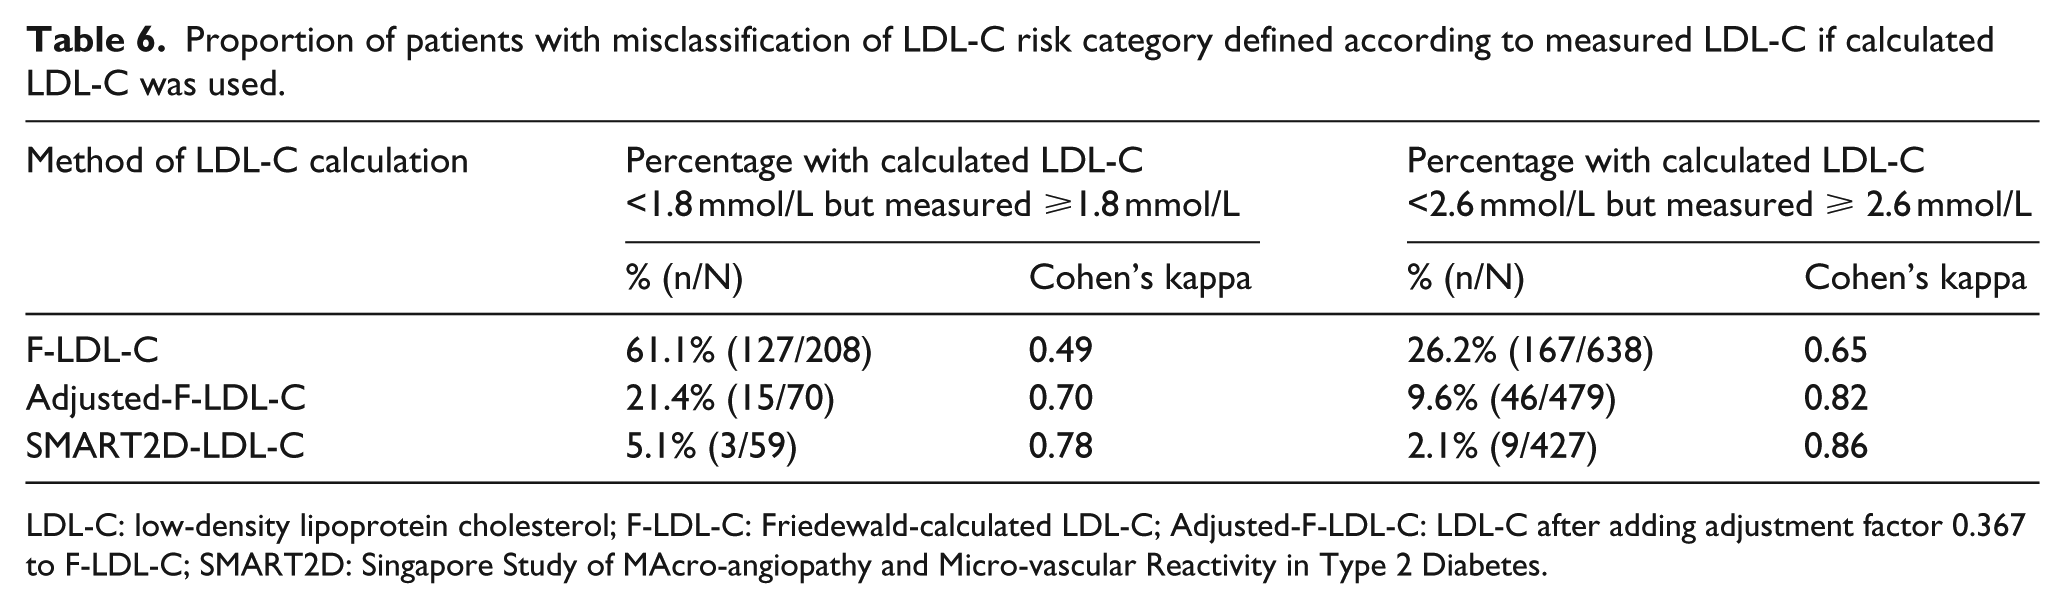
LDL-C: low-density lipoprotein cholesterol; F-LDL-C: Friedewald-calculated LDL-C; Adjusted-F-LDL-C: LDL-C after adding adjustment factor 0.367 to F-LDL-C; SMART2D: Singapore Study of MAcro-angiopathy and Micro-vascular Reactivity in Type 2 Diabetes.
Discussion
In this large cross-sectional study of adults with type 2 diabetes, we found the Friedewald equation to estimate LDL-C levels lower than the values obtained by direct LDL-C measurements. This negative bias of Friedewald-derived LDL-C was noted even at desirable TG levels. While this was present in all ethnic groups, this difference was significantly greater in Chinese as compared to Indians. As an alternative to the Friedewald equation, the SMART2D-LDL-C equation that we derived and validated has increased accuracy in LDL-C estimation and improved ASCVD risk categorization, with improved agreement with LDL-C categories defined according to direct LDL-C measurements.
The Friedewald formula, which assumes the ratio of the mass of TG to cholesterol in VLDL to be relatively constant, was originally derived from the comparison of 96 individuals with normal lipid profile, 204 with type 2 hyperlipoproteinaemia and 148 with Type IV hyperlipoproteinaemia.11,19 While diabetes status of these individuals is not mentioned, the authors highlight that erroneous estimations (due to the presence of chylomicrons, Type III hyperlipidaemia and TG levels above 4.5 mmol/L) can potentially occur in patients with diabetes. Although a good correlation exists between calculated LDL-C and M-LDL-C, the underestimation of LDL-C according to this formula has been shown in previous studies in the general population, as well as in those with diabetes mellitus.20,21 Attempts to derive and validate further equations for LDL-C calculation have not been widely adopted,22,23 and the Friedewald formula remains the recommended method in clinical practice and most National Lipid Guidelines.4,5,24 Martin et al. 25 after evaluating over 1.3 million lipid samples quantified by ultracentrifugation recently recommended an adjustable factor for the TG-to-VLDL ratio, instead of using a fixed factor of 5 (when using mg/dL), based on TG and non-HDL-cholesterol levels. This novel method derived from samples from children, adolescents and adults requires patients to be fasted in view of its reliance on TG levels. As highlighted by the authors, this method remains to be validated externally and is likely to provide considerably better concordance of estimated LDL-C to direct measurement in most ranges of TGs and LDL-C.
There have been a number of studies evaluating the precision and accuracy of direct measurement of LDL-C compared to the reference measurement procedure beta-quantification method of LDL-C measurement.9,10 These studies have shown that direct measurement of LDL-C, in spite of some degree of variability in diseased patient samples, is comparable to the reference method, with the additional benefit of being applicable in both fed and fasted states.
Similar to an Italian Cohort with T2DM, 26 in our multi-ethnic Asian study population, the negative bias of LDL-C when using the Friedewald equation is potentially clinically important especially when M-LDL-C is near the lower LDL-C cut-off used for risk categorization (Table 4). Using the 2.6 mmol/L recommended LDL-C target for high-risk patients without pre-existing ASCVD as the threshold level,7,27 nearly one in every three patients in our cohort would have been classified as having achieved LDL-C goal if using F-LDL-C, when their M-LDL-C remained above the goal. Similarly, for the 1.8 mmol/L cut-off, the recommended threshold level to compute the ASCVD risk to decide on the intensity of statin therapy in diabetes 4 as well as the recommended optional target for patients with very high risk of ASCVD, using F-LDL-C, nearly two in three patients would possibly be considered for a lower intensity of LDL-C lowering than recommended for their level of ASCVD risk according to the direct LDL-C measurement. Thus, although approximately 80% of our patient population is on statin therapy, there remains scope for optimization of dosing of lipid-modifying therapy to achieve LDL-C targets recommended for their risk categories.
Our current study adds to existing data on the potential limitations of using the Friedewald formula in clinical decision-making, particularly in patients with T2DM, who are at increased risk of ASCVD. With the SMART2D-LDL-C equation, we derived and validated an accurate alternative to the direct measurement of LDL-C that performs well, both in patients with desirable TGs and in those with TG level between 2.2 and 4.5 mmol/L. Additionally, since this equation was derived and validated from a convenient automated direct LDL-C measurement, although not validated in the fed-state in our diabetes population, this offers the potential for measurements at different clinic visits done regardless of the last meal, to be comparable. After validation is done, perhaps one recommendation of the utility of the SMART2D-LDL-C equation could be in the first lipid assessment, where fasting may be a requirement when patients’ full lipid profile, including TGs, is to be assessed. For follow-up visits, to reduce the inconveniences to patients associated with prolonged fasting, together with the potential risks of hypoglycaemia, especially in patients on insulin or insulin secretogogues, direct measurement of LDL-C could be used as it would be comparable to the earlier fasting LDL-C derived from the equation.
Apart from LDL-C, non-HDL-cholesterol (TC-HDL-C) has been identified as a convenient alternative measure of ASCVD risk, 28 as it does not require fasting and gives a measure of all potential atherogenic lipoprotein cholesterol. 29 While non-HDL-C cholesterol is an attractive option to quantify ASCVD risk, as well as a potential target candidate for vascular risk reduction, there remains no clinical trial evidence to support this practice. 4 Accurate assessment of LDL-C is essential, as it remains the primary target, as suggested in the AIM-HIGH study where patients who already achieved low LDL-C with statin therapy did not have additional reduction in ASCVD risk by the addition of a non-statin agent to reduce non-HDL-C levels. 30
A large sample size with the multi-ethnic background of these patients with T2DM is the strength of this study. Despite having deep and careful phenotyping of anthropometric measurements, biochemistry and complications of diabetes mellitus accurately captured by a group of registered nurses specifically trained for proficiency by the SMART2D investigators, there remain a few limitations in our study. Although data were collected on the lipid-modifying medications patients were on, information on the dose or duration of treatment was not available. However, as our findings are consistent throughout the ranges of LDL-C, this limitation is unlikely to affect our findings. Additionally, although beta-quantification by ultracentrifugation is the reference method, we used an automated method for direct LDL-C measurement. This method has, however, been validated and is in good agreement with the reference method and meets the strict standards of precision.31,32
In conclusion, in our patients with T2DM, LDL-C derived from Friedewald’s equation significantly underestimates directly M-LDL-C, and this is present in all ranges of M-LDL-C, and also in patients with desirable TGs and glycaemic control. The discordance between Friedewald-calculated and M-LDL-C is particularly marked when calculated LDL-C approaches LDL-C treatment targets in T2DM, namely 2.6 and 1.8 mmol/L. This results in considerable misclassification of patients with potential clinical importance and implications on therapeutic decisions. The SMART2D-LDL-C equation introduces a novel method of accurately approximating true LDL-C. Prospective studies comparing the clinical outcome of patients treated to goals estimated according to F-LDL-C or SMART2D-LDL-C or directly M-LDL-C may be needed to provide guidance on whether direct LDL-C measurement, in place of estimations by calculations, is required, at least in patients with type 2 diabetes.
Footnotes
Acknowledgements
Authors would like to acknowledge the Research Nurses from the Clinical Research Unit from our institution who helped with data collection and data entry and thank all patients who volunteered for this study. Singapore Clinical Research Institute contributed to the study protocol, database design and implementation as well as the study conduct.
Study data were collected and managed using REDCap electronic data capture tools hosted at Singapore Clinical Research Institute. REDCap (Research Electronic Data Capture) is a secure, web-based application designed to support data capture for research studies, providing (1) an intuitive interface for validated data entry, (2) audit trails for tracking data manipulation and export procedures, (3) automated export procedures for seamless data downloads to common statistical packages, and (4) procedures for importing data from external sources.
The guarantors S.T. and E.Y.C.K. accept full responsibility for the work and/or the conduct of the study, had access to the data and controlled the decision to publish.
All authors contributed to the intellectual development of this article. E.Y.C.K. and S.T. conceived and coordinated the whole work and prepared the manuscript; L.S.C., S.C.F., S.C., S.L.K.M., Y.L.Y., N.X.W., T.W.E. and S.L.B.M. participated in the planning of the study, contributed to key discussions and edited the manuscript.
Declaration of conflicting interests
All authors declare that there are no conflicts of interest related to this article.
Funding
This study was supported by a Grant from the National Medical Research Council of Singapore and NMRC/PPG/AH(KTPH)/2011.
Statement of Human and Animal Rights
All procedures followed were in accordance with the ethical standards of the responsible committee on human experimentation (institutional and national) and with the Helsinki Declaration of 1975, as revised in 2008.
Statement of informed consent
Informed consent was obtained from all patients for being included in the study.