
Abstract
Purpose:
To investigate muscular micro-perfusion by employing dynamic contrast-enhanced ultrasound (CEUS) and performing transient arterial occlusion in patients with type 2 diabetes mellitus (DM-2).
Methods:
Twenty DM-2 patients (mean age, 58 ± 8.6 years; duration of diabetes, 15.4 ± 12.1 years) and 20 healthy volunteers (mean age, 54 ± 5.4 years) participated. CEUS was applied to the calf, while 4.8 mL of SonoVue® was injected intravenously. At the thigh level, arterial occlusion (60 s) was performed. CEUS parameters (tmax, max, AUCpost and m) were evaluated and Pearson-product-moment correlation coefficients were computed.
Results:
A moderate negative correlation of HbA1c and max was established (−0.53). Max in patients with DM-2 >10 years was 79.89 ± 37.4. Max in patients with DM-2 duration <10 years was 137.62 ± 71.72 (p = 0.04). AUCpost in patients with DM-2 duration >10 years was 3924.01 ± 1630.52. AUCpost in patients with DM-2 duration <10 years was 6453.59 ± 3206.23 (p = 0.04).
Conclusion:
Patients with long history of DM-2 present with impaired muscular perfusion. CEUS and transient arterial occlusion may provide appropriate methods for semi-quantitative evaluation of muscular micro-perfusion in patients with DM-2.
Introduction
In the last few decades, the number of patients with diabetes mellitus has markedly increased, 1 thus making early diagnosis and efficient treatment options more necessary. Many patients with a long history of diabetes suffer complications, such as diabetic foot, retinopathy, neuropathy or nephropathy. A small subset of diabetic patients, however, experiences infarctions of the skeletal muscle. 2 Although the pathogenesis of diabetic muscle infarction is still unclear, it can be surmised that an impairment of local muscular perfusion occurs. Contrast-enhanced ultrasound (CEUS) has been developed to accurately visualize changes in the microcirculation of skeletal muscle.3,4 The aim of this study was to investigate whether muscular micro-perfusion assessed by CEUS and transient arterial occlusion is reduced in patients with type 2 diabetes mellitus (DM-2).
Material and methods
This study was planned as single-centre study and 20 patients with DM-2 (mean age, 58 ± 8.6 years) could be enrolled in this study. Patients were separated into a group with DM-2 >10 years (mean age, 58.2 ± 9.9 years) and a group with DM-2 <10 years (mean age, 57.4 ± 7.4 years); p > 0.05. DM-2 patients with retinopathy were also separated. Also, 20 healthy volunteers (54 ± 5.4 years) were included. Arterial stenoses of the lower limbs were excluded via echo Doppler ultrasound. Mean ankle–brachial index (ABI) of the subjects was 1.0 ± 0.1. None of the patients suffered from macroscopically visible diabetic complications, such as diabetic foot. None of the subjects met exclusion criteria for this study, such as advanced cancer or orthopaedic problems of the lower extremity. Informed written and oral consent was obtained from all subjects. This study was approved by the local review board and was performed according to the Declaration of Helsinki.
A Siemens-Acuson Sequoia 512 ultrasound device with a linear transducer 15L8w (Siemens-Acuson, Mountain View, CA) was employed. The ultrasound examinations were performed by a radiologist with 4 years of experience in the field of musculoskeletal radiology/CEUS (E.A.) together with a medical student (S.W.). A total of 4.8 mL of sulphur hexafluoride (SonoVue®) was injected continuously into a cubital vein (1 mL/min). Video clips with a length of 5 min and a frame rate of 1/s were recorded. A 1.75 cm × 5 cm sized region of interest (ROI) was positioned at a depth of 2 cm within the triceps surae muscle. The maximum CEUS signal following the end of transient arterial occlusion (max) was evaluated. The time difference between the end of occlusion and max was termed tmax. Furthermore, the maximum slope immediately after occlusion (m, slope to max) and the area under the curve after occlusion (AUCpost) were assessed. Details have been published previously.5–7 Image analysis was performed in consensus by two experienced radiologists (M.K. and M.-A.W.) each having 12 years of experience in the field of musculoskeletal radiology and CEUS. Both did not participate in CEUS data collection and thus were blinded to the clinical patient data.
An automated occlusion plethysmograph Periquant® 803 (Gutmann, Eurasburg, Germany) was used to achieve a reproducible arterial occlusion (i.e. simulation of physical exercise) by inflating a cuff (120–180 s), which was tied around the examined thigh.
Statistics
The derived CEUS parameters of the DM-2 patients and healthy volunteers were evaluated by comparing their mean values, standard deviations and ranges. Student’s t-tests were used to assess the significance of possible differences. The values of p < 0.05 were considered as statistically significant. Normal distribution was proven with the Kolmogorov–Smirnov test. Pearson-product-moment correlation coefficients were computed to assess correlations of CEUS data and clinical data, for the subject group of patients with DM-2 (coefficients > 0.5 or <−0.5 indicate a moderately positive or negative correlation, respectively). 8 Statistical analyses were performed using SAS software (SAS version 9.2; SAS Institute, Inc., Cary, NC, USA).
Results
Tables 1 to 3 (online supplement) show patient characteristics and CEUS data. Figure 1 shows a representative time–intensity curve of a patient with DM-2 and Figure 2 shows a comparable time–intensity curve of a healthy volunteer. A moderate negative correlation of HbA1c and max was established (−0.53; p = 0.02). Max, tmax, m and AUCpost did not significantly differ between patients and volunteers. Max in the patients with DM-2 duration > 10 years was 79.89 ± 37.4 versus 137.62 ± 71.72 in the patients with DM-2 duration < 10 years (p = 0.04). AUCpost in the patients with DM-2 duration > 10 years was 3924.01 ± 1630.52 versus 6453.59 ± 3206.23 in the patients with DM-2 duration < 10 years (p = 0.04). All CEUS values for DM-2 patients with retinopathy were altered compared to DM-2 patients without retinopathy: max, 81.35 ± 49.28 versus 117.88 ± 65.92; m2, 7.67 ± 6.02 versus 12.75 ± 9.44; tmax, 17.60 ± 7.92 versus 15.07 ± 6.12; and AUCpost, 4249.01 ± 2241.60 versus 5502.06 ± 2957.47.
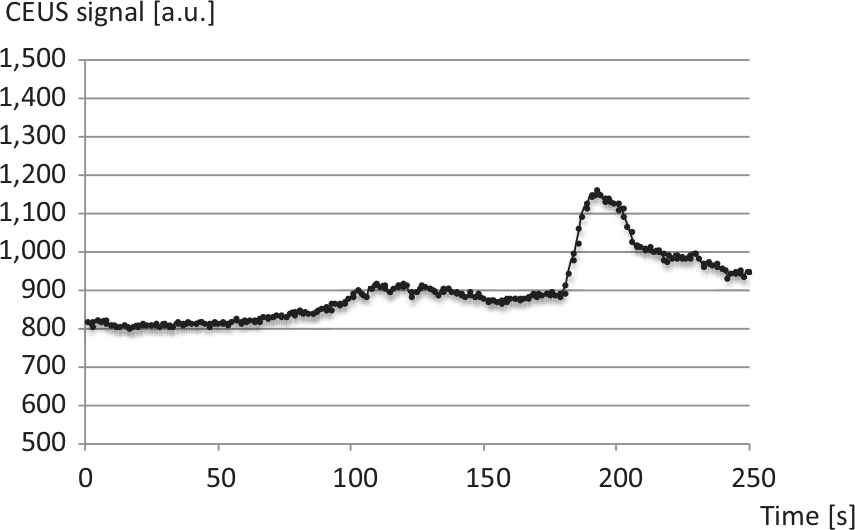
Contrast-enhanced ultrasound (CEUS) time–intensity curve of a 55-year-old male patient with type 2 diabetes mellitus (8 years duration). After 1 minute of transient arterial occlusion at the thigh level lasting for 1 min, the CEUS signal increased rapidly (180 s et seq.).
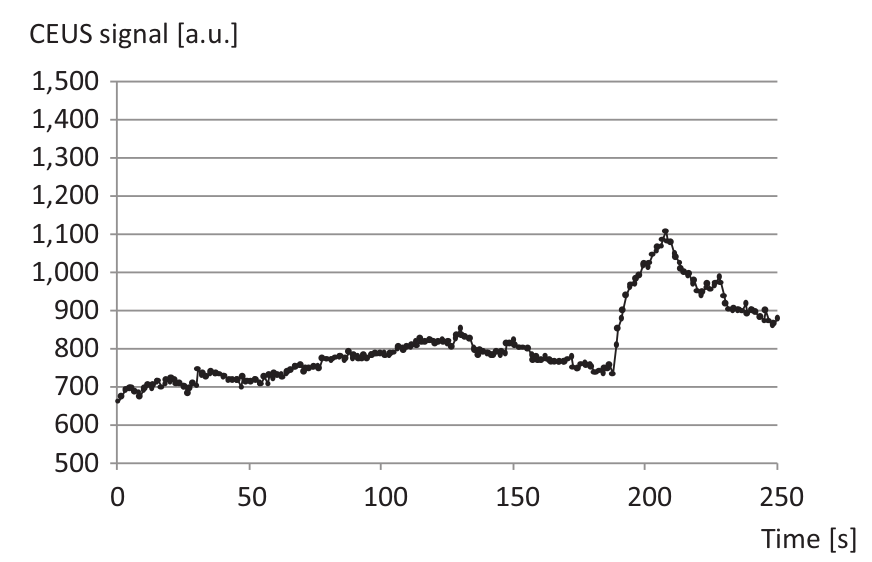
Contrast-enhanced ultrasound (CEUS) time–intensity curve of a 58-year-old healthy volunteer. The increase of CEUS signal after 1 min of transient arterial occlusion (180 s et seq.) was not more distinct in comparison to a patient with type 2 diabetes mellitus (see Figure 1).
Discussion
The influence of DM-2 on muscular micro-perfusion was evaluated with CEUS and transient arterial occlusion. A moderate negative correlation of HbA1c and max was observed. This indicates that elevated HbA1c may be directly associated with a decreased local muscle micro-perfusion. Max and AUCpost were lower in patients with >10 years duration of DM-2 compared to patients with <10 years duration of DM-2. Max, m and AUCpost were all decreased in the subject group of DM-2 patients in comparison to the healthy volunteers. However, the differences were not statistically significant. Lacking an accepted gold standard for quantifying muscular micro-perfusion, it still remains unclear whether the CEUS technique is not sensitive enough in visualizing a slightly decreased muscular perfusion in DM-2 patients or whether patients’ muscular perfusion was indeed physiologic.
One limitation of this study is its sample size. Although the findings indicate a slightly reduced muscular micro-perfusion in patients with long-lasting DM-2, further studies with greater sample size are needed to confirm the preliminary results. In future studies, one should focus on including DM-2 patients with secondary complications to uncover potential relations between impaired muscle perfusion and specific secondary microvascular diabetic complications, such as diabetic retinopathy, neuropathy or nephropathy. Additionally, in the absence of a gold standard for measuring muscular micro-perfusion, the study’s findings could not be matched to any benchmark values, which represent another limitation.
In conclusion, the study showed that patients with a long history of DM-2 present with impaired muscular perfusion. CEUS and transient arterial occlusion techniques may represent appropriate methods for the semi-quantitative evaluation of muscular micro-perfusion in patients with DM-2.
Footnotes
Acknowledgements
Martin Krix is an employee of Bracco Imaging Germany, Bracco-Altana Pharma GmbH, Clinical Research, Max-Stromeyer-Str. 116, D-78467 Konstanz, Germany.
Conflict of interest
The authors have reported no other potential conflicts of interest.
Funding
This research received no specific grant from any funding agency in the public, commercial or not-for-profit sectors.