
Abstract
We evaluate the relationship between different lipoproteins and atherogenic indices with pre-hypertension in 297 obese and 942 non-obese children with Tanner stage 1 enrolled in a multicentre, community-based cross-sectional study. Height, weight, fasting glucose and insulin levels, total cholesterol, triglycerides, high-density lipoprotein cholesterol (HDL-c), low-density lipoprotein cholesterol (LDL-c), non-HDL-c, LDL/HDL-c, triglycerides/cholesterol and total cholesterol/HDL-c ratios were measured. Mean age was 8.4 ± 1.2 years; pre-hypertension was identified in 104 (8.4%) participants, 46 (15.5%) obese and 58 (6.1%) non-obese children. The pre-hypertensive non-obese children show a high proportion of family history of hypertension (41.6 and 24.7%, p = 0.002) and elevation of insulin at a relatively low body mass index. The triglycerides:HDL-c ratio, but not other lipoproteins or atherogenic indices, was associated with pre-hypertension in obese (1.15, 95% confidence intervals 1.06–1.26) and non-obese children (1.38 95% confidence intervals 1.22–1.57). The triglycerides:HDL-c ratio is related to pre-hypertension in children; the family history of hypertension seems to be a risk factor in developing pre-hypertension.
Introduction
The National High Blood Pressure Education Program Working Group on High Blood Pressure in Children and Adolescents, on the basis of developing evidence, states that systolic blood pressure (SBP) and/or diastolic blood pressure (DBP) between the 90th and 95th percentile in childhood should be considered as pre-hypertension (pre-HTN) 1 and an indication for intervention in lifestyle. 2
Elevated blood pressure (BP) is one of the leading causes that occurs early in life, contributing to the global disease burden worldwide. 3 These observations have great public health importance because elevated BP in childhood predicts hypertension in adulthood and increases cardiovascular-disease morbidity and mortality. 4
Although the epidemic of obesity in childhood has been related to the increase of hypertension, 5 it has been reported that 5.7% of normal-weight children have pre-HTN 6 and that available data do not totally support the statement that the worldwide increase of overweight children results in the increase of BP. 7
A growing body of evidence shows that adverse lipoproteins levels in early life may induce arterial changes that contribute to atherosclerosis and cardiovascular disease in adulthood.8, 9
Dyslipidaemia, characterised by elevated total cholesterol (TC), low-density lipoprotein cholesterol (LDL-c) and triglycerides (TG) levels as well as low high-density lipoprotein cholesterol (HDL-c) concentrations are well-known cardiovascular risk factors. 10 In addition, LDL-c:HDL-c, TC:HDL-c and TG:HDL-c ratios emerge as strong metabolic predictors for cardiovascular disease. 11 Because identification of children at high risk for cardiovascular disease later in life should be among strategies for the primary prevention of cardiovascular disease, 12 in the present study, we evaluate the relationship between different lipoprotein and atherogenic indices with pre-HTN in obese and non-obese children.
Methods
With the approval of protocol by the Ethics Committees of the Faculty of Medicine of the University of San Luis Potosi and the Mexican Social Security Institute at Durango, Mexico, and after obtaining informed consent from children and their parents, a community-based, cross-sectional population study was carried out.
A total of 1549 children were interviewed; of these, 1239 (80%) children who fulfilled the inclusion criteria were enrolled in the study, 600 girls and 639 boys, with average age of 8.4±1.2 years (range 6–10 years).
The sampling strategy was based on a two-stage random sample. In the first, elementary schools from San Luis Potosi and Durango, cities in middle and northern Mexico, were randomly selected. In the second, using school attendance listing, a list of children was randomly selected and invited to participate. According the number of schools by city and the schools size, the number of schools by city and students included by schools was proportional to the required sample size. Study sites included 14 schools at San Luis Potosi and 12 schools at Durango. 13
The sample size was estimated on the basis to detect a prevalence of pre-HTN equal to or greater than 5%.
Eligible boys and girls in Tanner stage 1 were allocated into groups with pre-HTN and a control group of children without pre-HTN.
Smoking (n = 25), hypertension (n = 10) and diagnosis of acute or chronic illnesses (n = 107) were exclusion criteria; furthermore, children undergoing any kind of medical treatment (n = 17) were also excluded. Finally, 153 (9.9%) children, or their parents, did not accept the offer to participate.
Definitions
Using the tables from the National High Blood Pressure Education Program Working Group on High Blood Pressure in Children and Adolescents, pre-HTN was defined by SBP or DBP ≥90th percentile but <95th percentile for gender, age and height. 1
Because there are no paediatric reference ranges for lipids in the Mexican paediatric population, the cut-off values for abnormal serum lipid levels were defined using the guidelines of the NCEP Report of the Expert Panel on Blood Cholesterol Levels in Children and Adolescents: TC ≥2.6 mmol/L (100 mg/dL), TG ≥1.2 mmol/L (110 mg/dL), HDL-c ≤0.9 mmol/L (35 mg/dL) for both sexes and LDL-c ≥2.8 mmol/L (110 mg/dL). 14
Non-HDL c was defined as the difference between total and HDL-c.
Furthermore, we evaluated the homeostasis model assessment of insulin resistance (HOMA-IR), in children which was calculated using the formula fasting insulin (U/ml) × fasting glucose (mmol/L)/22.5 15
Based on the age- and gender-specific childhood international body mass index (BMI) charts, 16 obesity was defined by BMI equal or greater than 95th percentile for age and sex.
Family history of hypertension (FHH) was defined by the presence of hypertension in at least one parent of the enrolled children. Data were ascertained by questionnaires, measurement of BP or by verification of clinical records.
Measurements
Brachial artery BP was measured in seated children with their arms bared and supported at heart level, after they had rested for 5 min, with the use of calibrated baumanometers (Microlife AG, Heerbrugg Switzerland) and stethoscopes (3M Littman Classic II, Neuss, Germany). An appropriate sized cuff was placed on the left arm, pulse occlusion pressure was determined and the cuff was inflated to 20 mmHg above that pressure. The SBP was defined as the first appearance of sound (Korotkoff phase 1) and DBP by the disappearance of sound (Korotkoff phase 5). The technique of BP measurement and stages of elevated BP were defined by criteria scheduled in the Seventh Report of the Joint National Committee on Prevention, Detection, Evaluation, and Treatment of High Blood Pressure. 2 Data were collected as the average of two readings, each separated by at least 3 min. All measurements were performed by trained personnel.
Weight and height were measured using a fixed scale with a stadiometer (Tanita TBF-215;, Tokyo, Japan). The increment of weight and height measurements was 0.1 kg and 0.01 m. BMI was calculated as weight (kg) divided by height (m) squared.
Waist circumference (WC) was measured to the nearest cm with a flexible steel tape while the children were in a standing position; the anatomical landmarks used were midway between the lowest portion of the rib cage and the superior border of the iliac crest. Measurement of BMI and WC was performed in fasting conditions between 08.00 and 09.00 hours, with the children in a standing position wearing light clothing and without shoes. The Tanner stage was assessed by a trained clinician participating in the study.
Assays
A venous whole blood sample was collected after an overnight fast (8–10 h of fasting).
The TC, TG and LDL-c levels were measured using enzymatic methods according to the manufacturer’s protocol; the HDL-c fraction was obtained after precipitation by phosphotungstic reagent. The intra- and inter-assay coefficients of variation were 1.9% and 3.6% for TG, 4.9% and 7.1% for LDL-c and 1.5% and 3.0% for HDL-c.
Plasma glucose concentrations were determined using the glucose-oxidase method (Sigma Diagnostics, St. Louis, MO, USA), with intra- and inter-assay variation coefficients of 2.4% and 3.6%, respectively.
Insulin levels were measured by microparticle enzyme immunoassay (Abbot Axsym System; Alameda, CA, USA), with intra- and inter-assay variation coefficients of 4.0% and 6.1%.
Samples were frozen and stored at –20o C until further analysis. All measurements were performed in a Data Pro Plus random access clinical analyser (Arlington, TX, USA).
Statistical analysis
For bivariate analysis, Student’s t test (Mann–Whitney U test for skewed data) and chi-squared test were used for tested differences for numerical and categorical data, respectively.
A multivariate logistic regression analysis, which included pre-HTN (dependent variable) and lipoproteins, atherogenic indices, and those characteristics that in the bivariate statistical test showed significant differences between the groups (independent variables), was performed.
A p value <0.05, or 95% confidence intervals (95% CI), defined statistical significance. Data were analysed by using the statistical package SPSS for Windows 15.0 (IBM Corporation, Armonk, NY, USA).
Results
Pre-HTN was identified in 104 (8.4%) participants; 44 (42.3%) boys and 60 (57.7%) girls, whereas the control group consisted of 594 (52.4%) boys and 539 (47.6%) girls, p = 0.06. The proportion of children with FHH (33.6 and 24.7%, p = 0.03) was significantly higher in the group with pre-HTN than in the control group.
Table 1 shows the anthropometric and clinical characteristics of children stratified by pre-HTN. The FHH, BMI, WC, HOMA-IR, fasting insulin, HOMA-IR, TG, LDL-c, LDL-C/HDL-c, TG:HDL-c ratio and TC/HDL-c were significantly higher in the group with pre-HTN than in the control group; whereas TC, HDL-c, and non-HDL-c were significantly higher in the control group as compared with the pre-hypertensive children.
Characteristics of children with and without prehypertension.
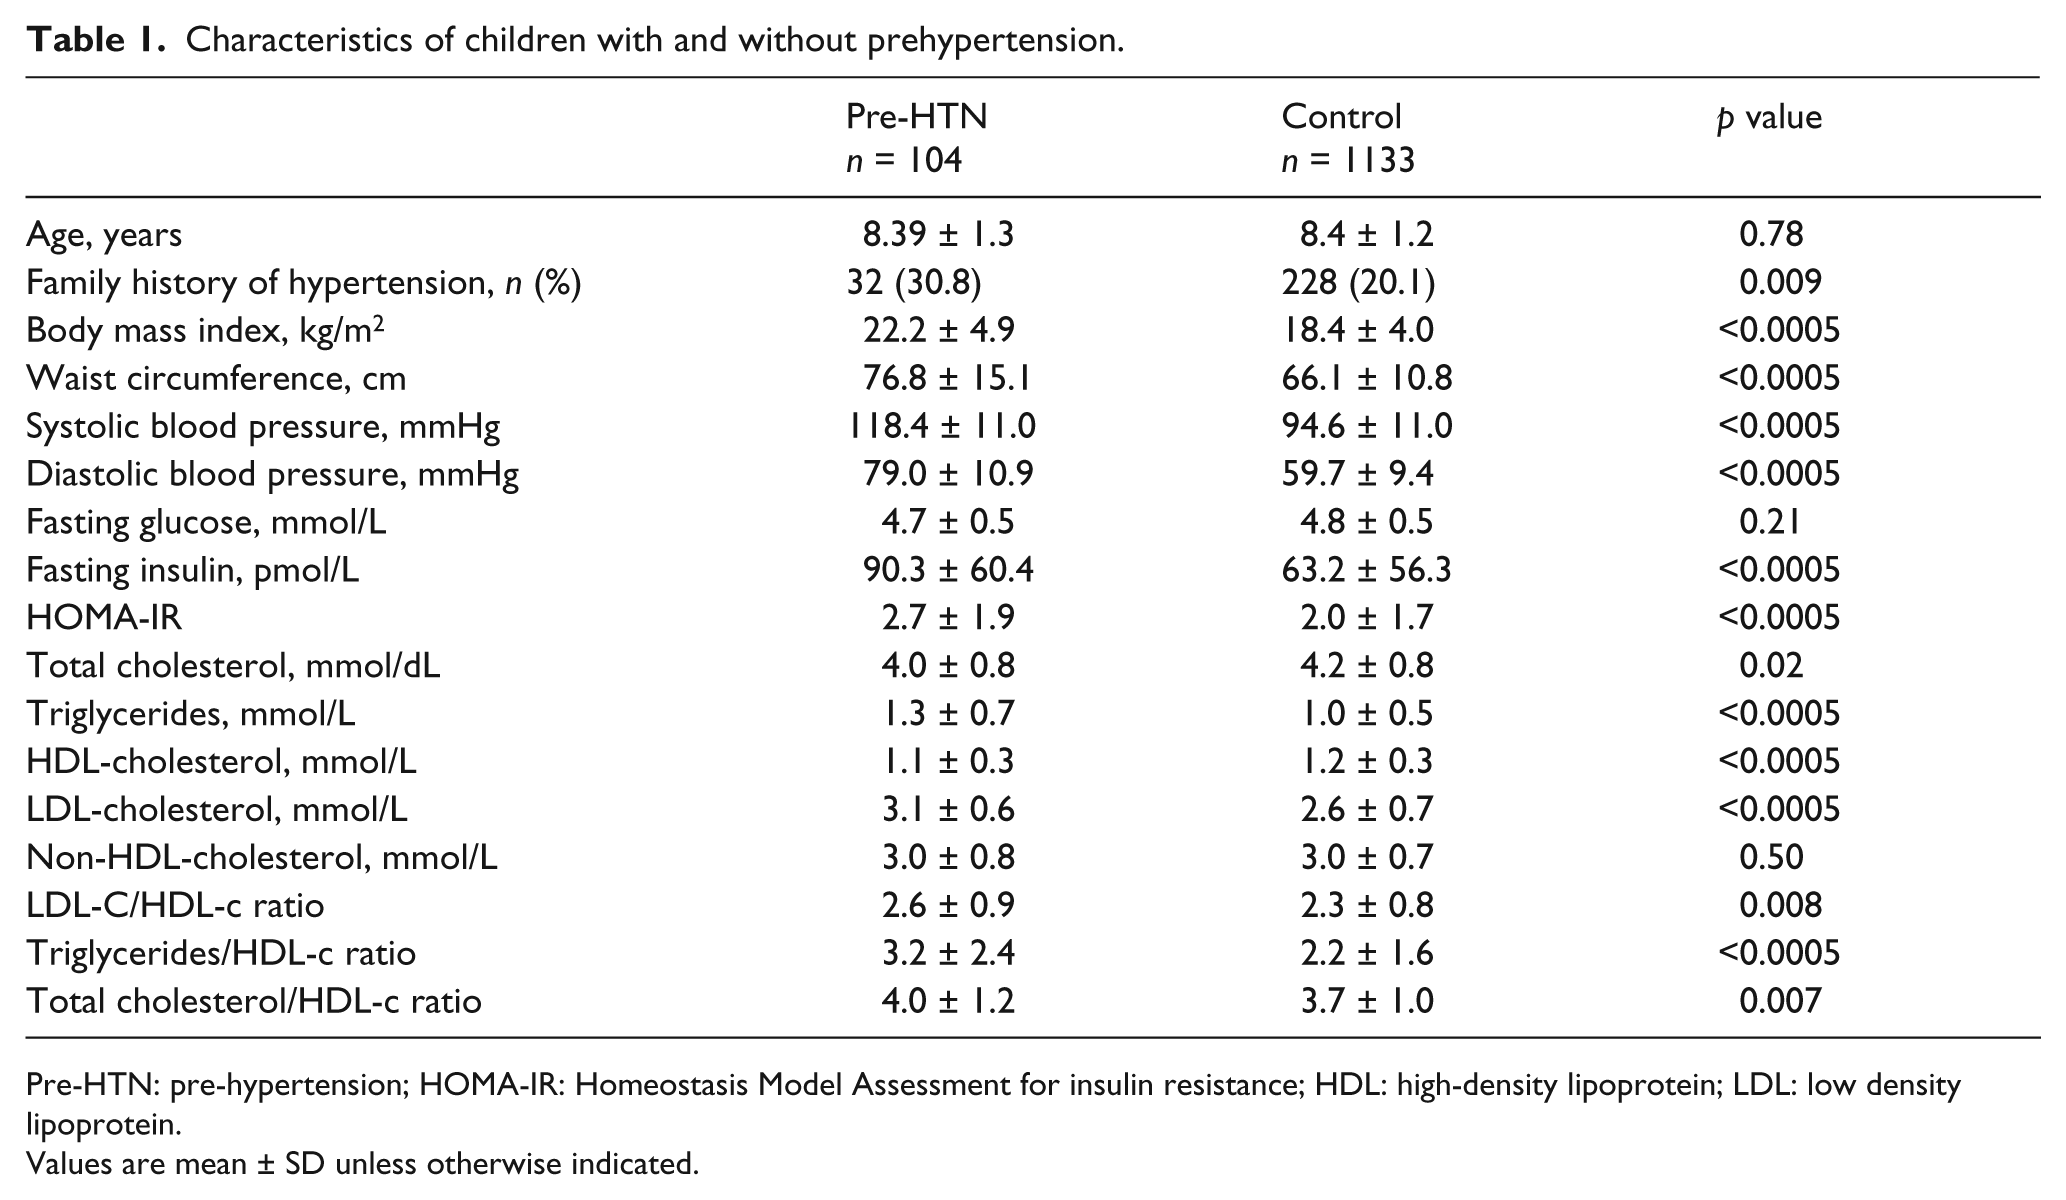
Pre-HTN: pre-hypertension; HOMA-IR: Homeostasis Model Assessment for insulin resistance; HDL: high-density lipoprotein; LDL: low density lipoprotein.
Values are mean ± SD unless otherwise indicated.
A total of 297 (24.0%) children were obese. Pre-HTN was identified in 46 (15.5%) obese and 58 (6.1%) non-obese children. The proportion of FHH was significantly higher in the non-obese children with pre-HTN as compared with obese pre-hypertensive children (41.4 and 23.9%, p = 0.04).
In both obese and non-obese groups, children with pre-HTN exhibited a higher BMI as well as lower HDL-c and TC than the healthy children in the respective control groups. Furthermore, non-obese children with pre-HTN showed a significantly higher frequency of FHH as well as higher HOMA-IR, insulin levels, TG, TC:HDL-c and TG:HDL-c ratio than the non-obese healthy children in the control group (Table 2).
Characteristics of children with and without obesity and pre-hypertension (pre-HTN).
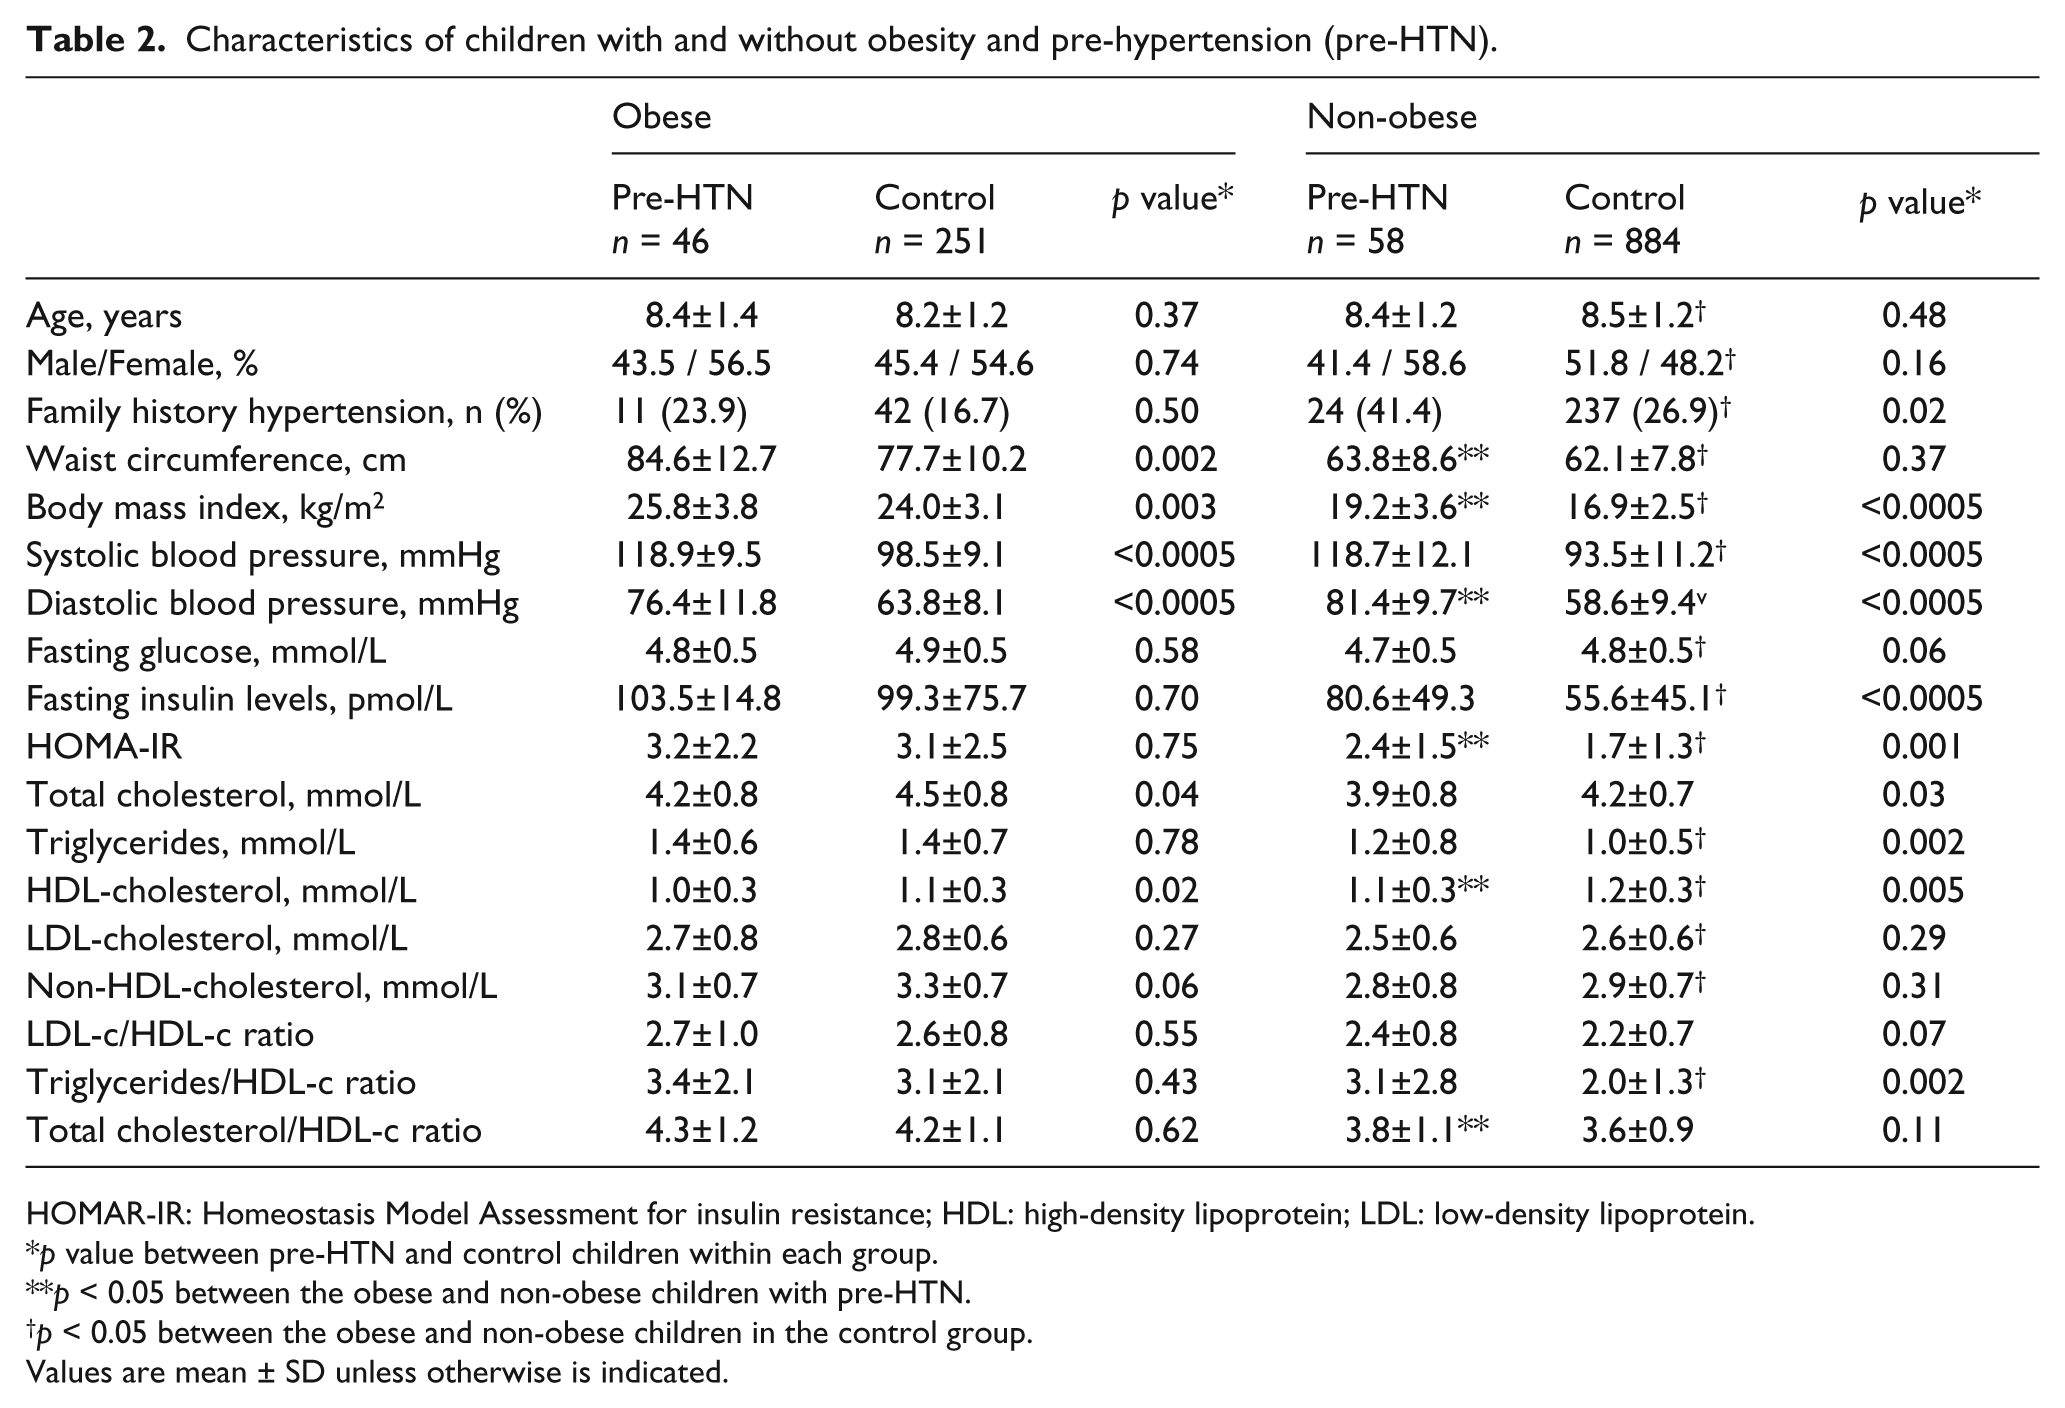
HOMAR-IR: Homeostasis Model Assessment for insulin resistance; HDL: high-density lipoprotein; LDL: low-density lipoprotein.
p value between pre-HTN and control children within each group.
p < 0.05 between the obese and non-obese children with pre-HTN.
p < 0.05 between the obese and non-obese children in the control group.
Values are mean ± SD unless otherwise is indicated.
Although there are significant statistical differences for BMI in the different age strata, insulin levels in the obese and non-obese children with pre-HTN are similar, with the exception of obese children aged 10 years who exhibited higher BMI and insulin levels as compared with non-obese children. Figure 1 shows the distribution of BMI and insulin levels in the hypertensive children with and without obesity; as was expected there was a positive trend between BMI and insulin levels for both obese and non-obese children. In all age strata, there were non-obese children with elevated insulin levels (upper left quadrant, delimited by the solid lines). Following the line that indicates obesity (95th percentile) to the left until the value indicating the 75th percentile of BMI (dotted line), it is possible to identify the level of BMI in which the insulin level starts rising (Figure 1).
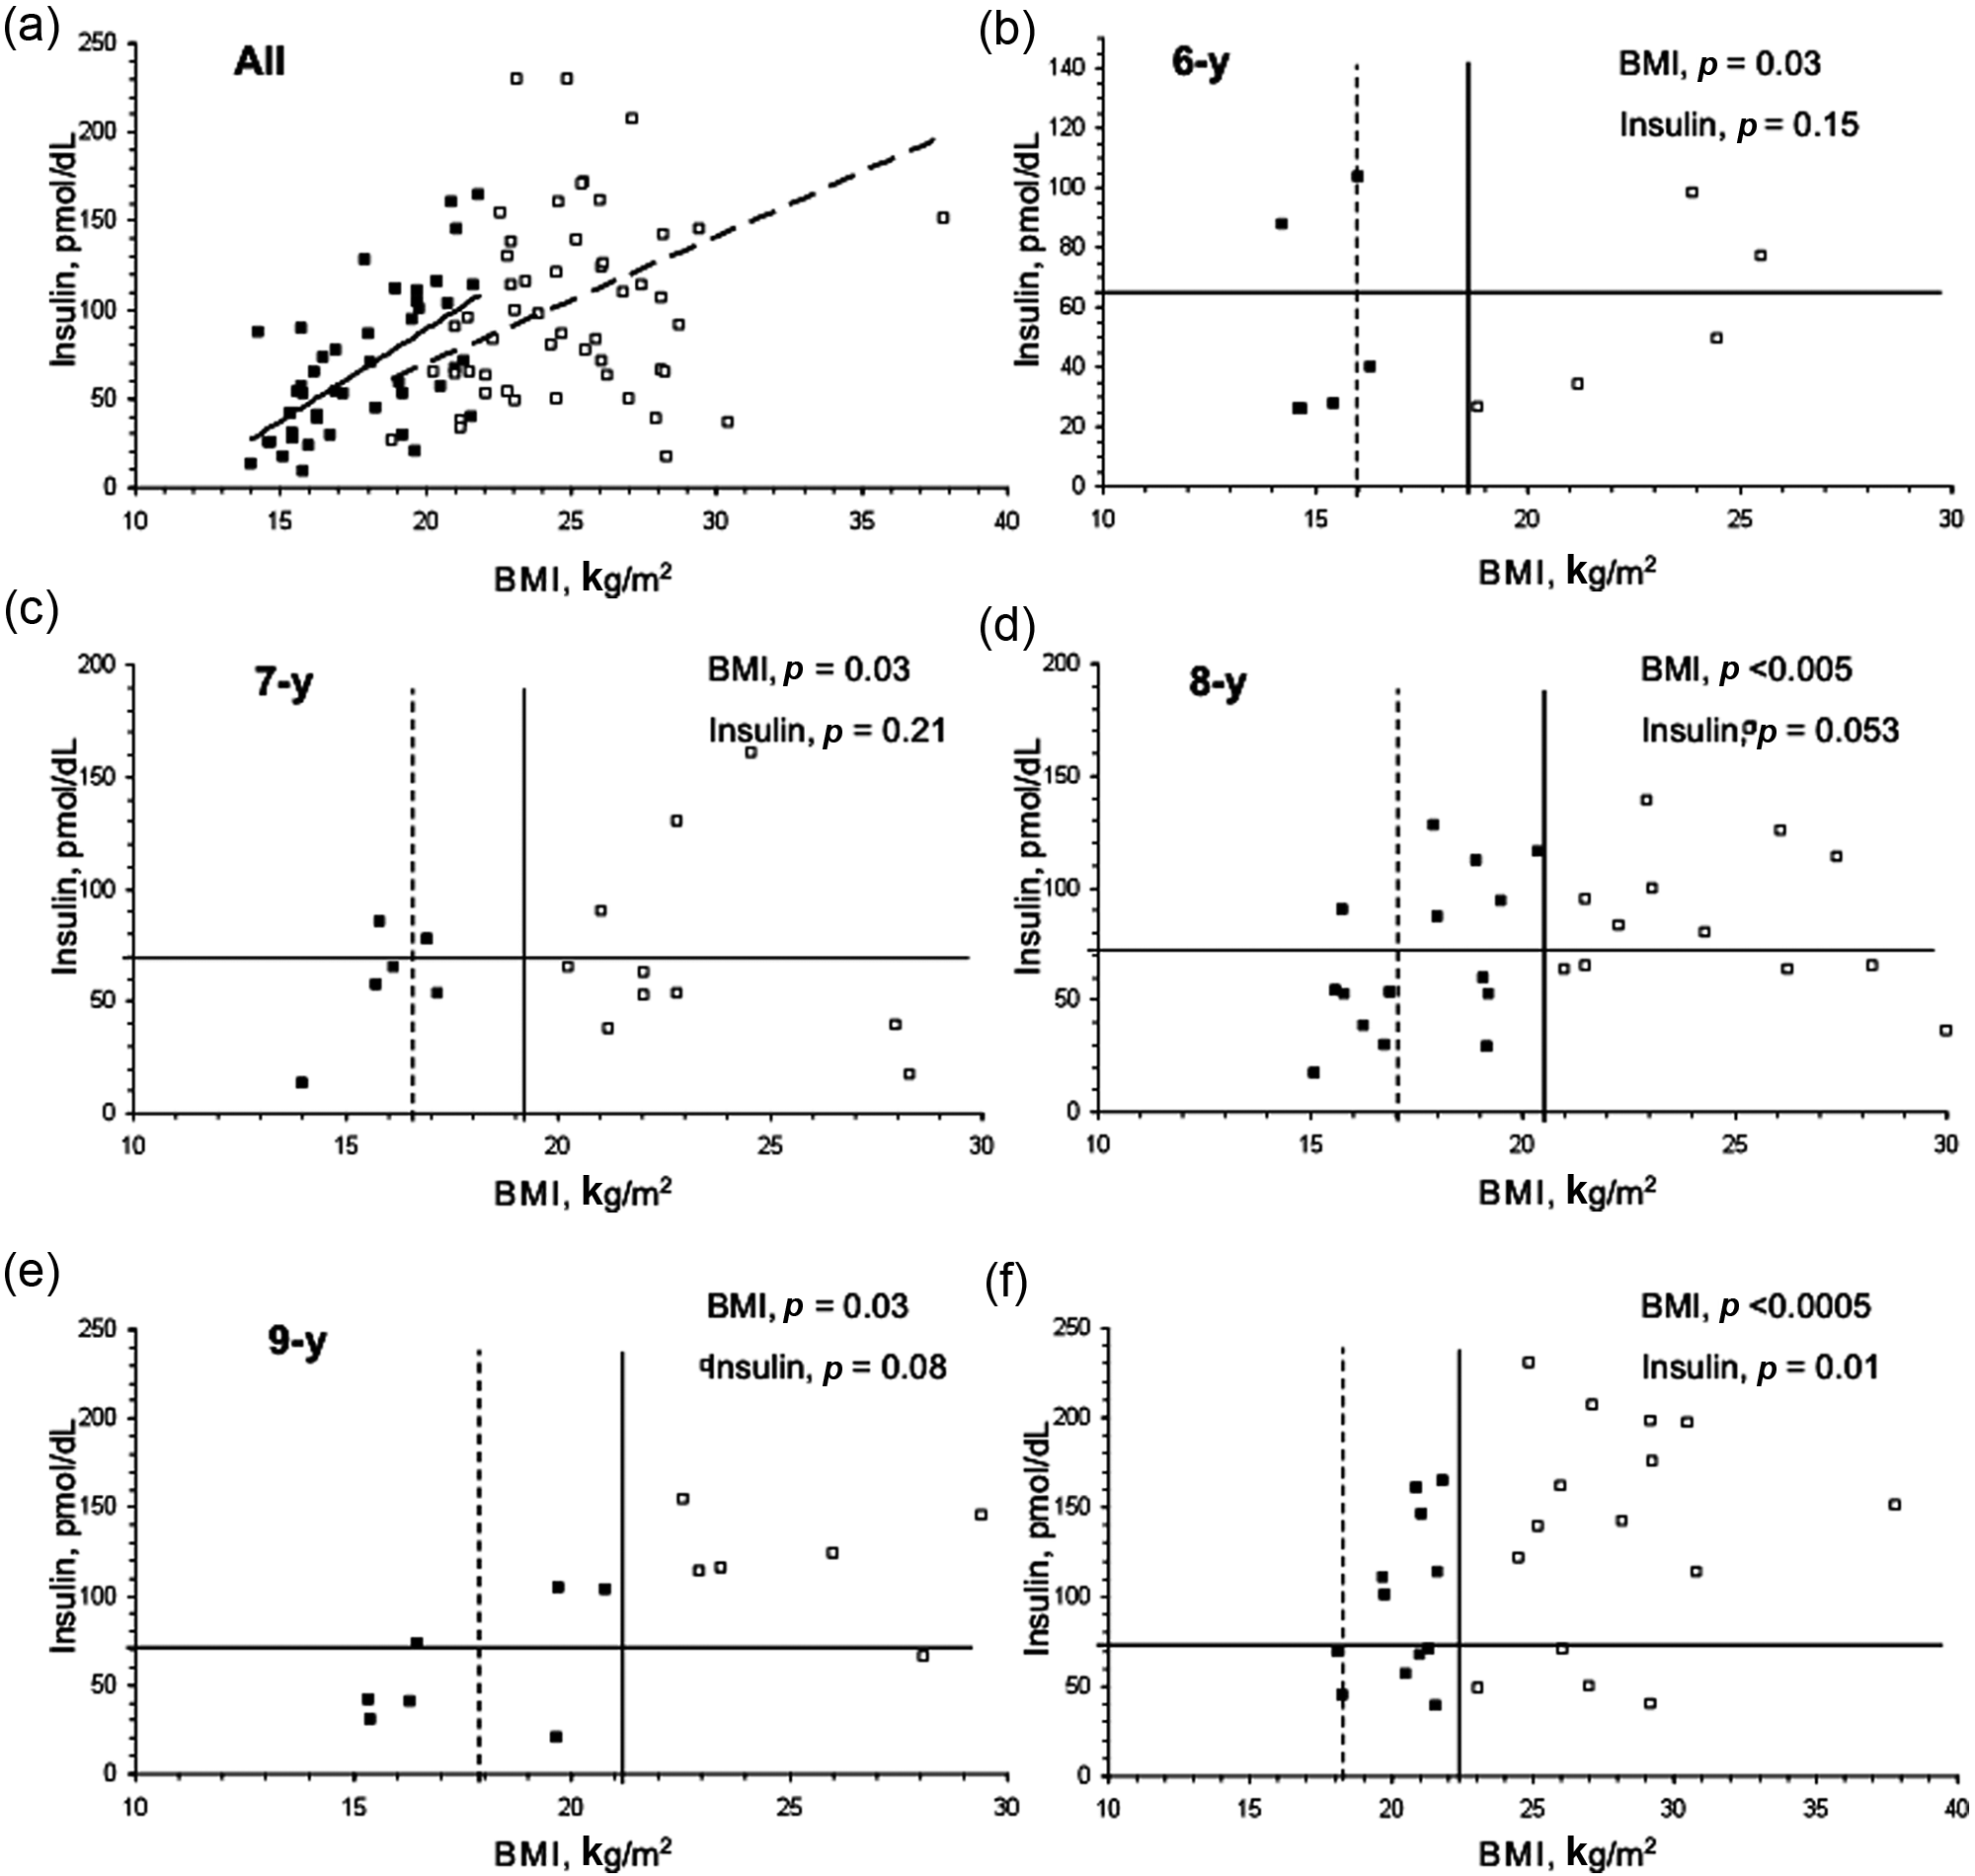
Distribution of body mass index (BMI) and insulin levels in pre-hypertensive children with and without obesity. The chart displays all pre-hypertensive populations and shows a positive trend between BMI and insulin levels for both obese and non-obese children. In all age strata, there were non-obese children with elevated insulin levels (upper left quadrant, defined by solid lines). Following the line that indicates obesity to the left, until reaching the value that indicates the 75th percentile of BMI, it is possible to identify the level of BMI in which the insulin level starts rising. The insulin starts to rise at 75th percentile of BMI. In the charts that indicate distribution of BMI and insulin levels by age strata, the vertical straight line indicates the 95th percentile of BMI. The horizontal straight line indicates the average plus 2 SD of insulin levels measured in an independent group of children from the same communities as the target population in this study.28 Black square: non-obese, pre-hypertensive children; white square: obese, pre-hypertensive children.
The odds ratios (ORs) that compute the relationship between the risk factors (independent variables) and pre-HTN (dependent variable) showed that, in both obese and non-obese children, the TG/HDL-c is related to pre-HTN, Furthermore, in the non-obese children, the elevated TG levels, TG:HDL-c ratio and TC:HDL-c ratios as well as the low HDL-c levels are also associated with pre-HTN (Table 3).
Odds ratio (OR) that computes the relationship between the risk factors (independent variables) and pre-hypertension (dependent variable) in the children stratified by obesity.
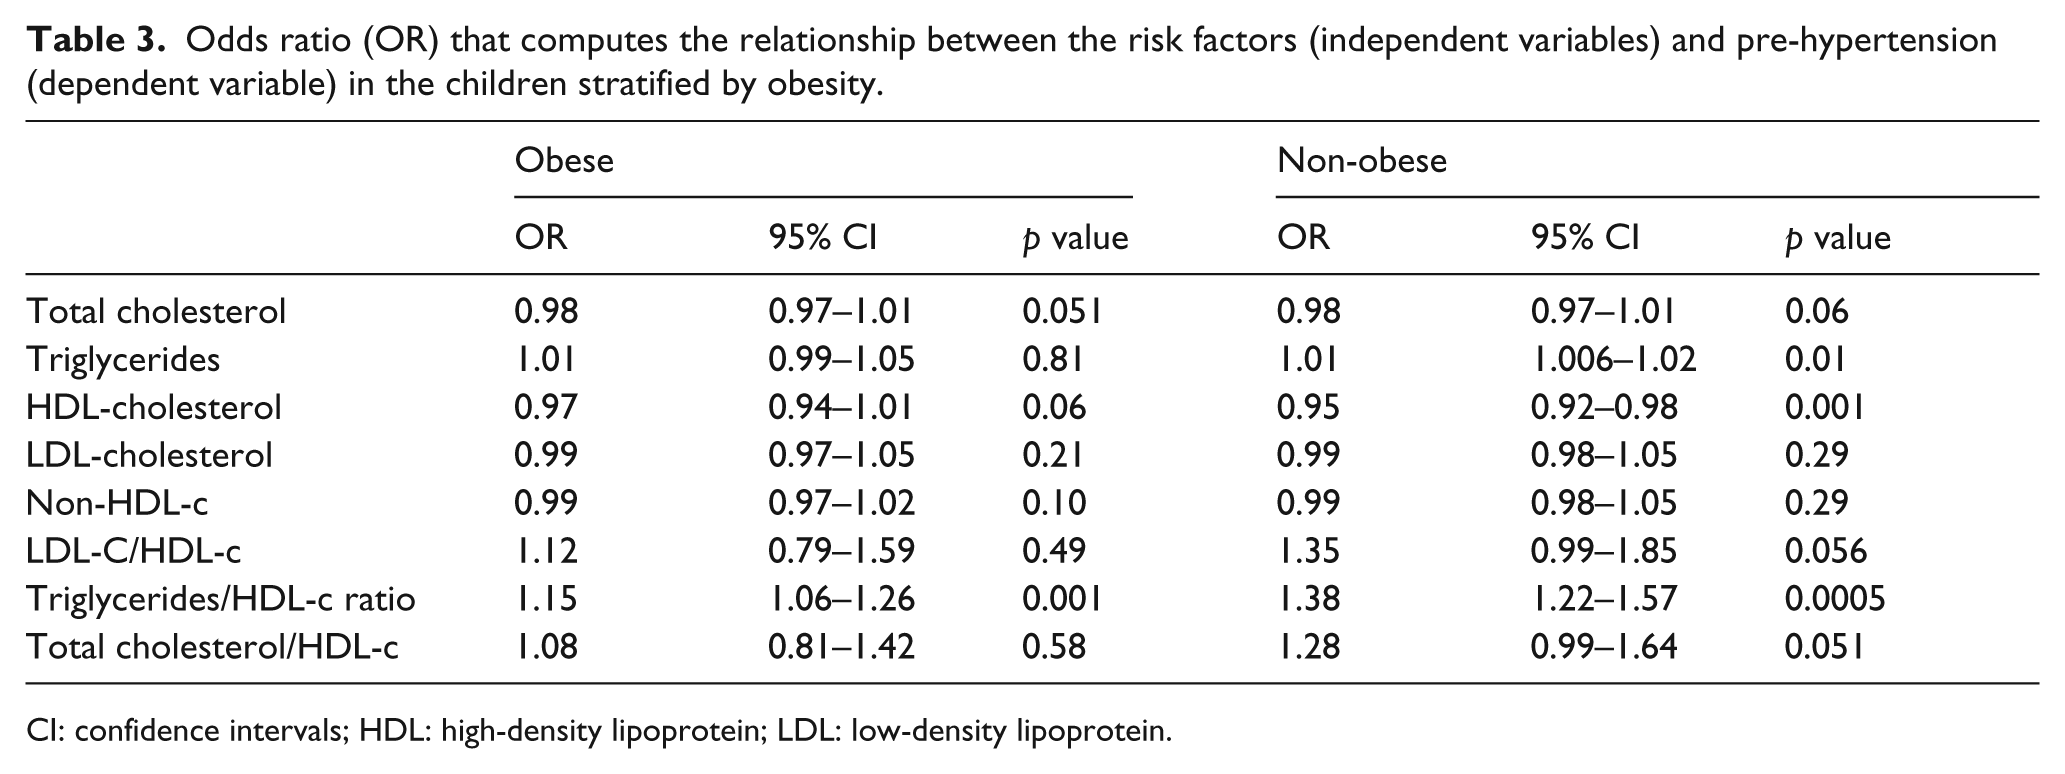
CI: confidence intervals; HDL: high-density lipoprotein; LDL: low-density lipoprotein
The odds ratios (ORs) that compute the relationship between the risk factors (independent variables) and pre-HTN (dependent variable) showed that, in both obese and non-obese children, the TG/HDL-c is related to pre-HTN, Furthermore, in the non-obese children, the elevated TG levels, TG:HDL-c ratio and TC:HDL-c ratios as well as the low HDL-c levels are also associated with pre-HTN (Table 3).
In order to control the confounders (independent variables associated with pre-HTN but that are not lipoproteins), an additional regression model conducted in the non-obese children (adjusted for FHH, insulin levels and HOMA-IR) showed that the TG:HDL-c ratio (OR 1.26; 95% CI 1.11–1.42), but not other lipoproteins (TG (OR 1.14; 95% CI 0.8–1.6) and HDL-c (OR 1.12, 95% CI 0.71–1.41) levels nor TG:HDL-c (OR 0.98, 95% CI 0.81–1.48) and TC:HDL-c (OR 1.09, 95% CI 0.97–1.17) ratios)), remained significantly associated with pre-HTN.
Discussion
Our results show that the TG:HDL-c ratio is associated with pre-HTN in obese and non-obese children; an association that is independent of FHH, insulin levels and HOMA-IR. Furthermore, our results strongly suggest that the FHH and the decrease of insulin sensitivity is a predictor for pre-HTN among non-obese children.
In the present study, the prevalence of pre-HTN (8.4%) was similar to that reported by Rosa et al. 17 in young people from public and private schools in Rio de Janeiro, Brazil (8.6%) and slightly lower than that reported by Genovesi et al. 18 in children from Northern Italy (6.0%). Furthermore, our results also show that pre-HTN is markedly higher in obese children (16.7%) as compared with non-obese children (5.2%); findings in agreement with the reports by Salvadori et al. 7 (18.2% and 5.7%) and, partially, by Di Bonito et al. 19 (17.7% and 1.5%), discrepancies that could be related to ethnicity. Furthermore, it has been reported that obesity is the main risk factor related to the increase of atherogenic lipoproteins and development of atherosclerosis and cardiovascular disease in children 20 and that obesity, as a measure of BMI or WC, is strongly associated with the risk of developing pre-HTN.17–19,21–23 In agreement with these finding, our results, showed an elevated prevalence of pre-HTN in obese children.
In addition to obesity, it has been shown that metabolic disorders in lipid metabolism (such as elevated LDL-c, TG and a TG:HDL-c ratio, as well as low HDL-c levels) are frequently found in offspring of hypertensive subjects, contributing to increasing BP in children.9, 24
In our study, non-obese children show a high proportion of FHH and a significant association between elevated TG:HDL-c ratios with pre-HTN. These finding strongly suggest a positive association between heredity and metabolic alterations that predispose to cardiovascular disease. Because lipid metabolism alterations are risk factors for cardiovascular disease, and non-obese children with FHH could be more susceptible to pre-HTN, it should be recommended to include in the policies for screening pre-HTN those children who, irrespective of obesity, are at high risk for cardiovascular disease according to positive FHH.
The impact of atherogenic indices and lipoproteins in arterial wall thickness and stiffness has been previously evaluated among children and adolescents, showing that elevated TC, TG, non-HDL-c, LDL-c and low HDL-c levels predict subclinical atherosclerosis in adulthood.23,25,26 Furthermore, as part of the Bogalusa Heart Study, it has been shown that pre-HTN has adverse profiles on risk factors and indices of subclinical cardiovascular disease, findings that underscore the need for aggressive management of the cardiovascular risk in youth. 22 Nonetheless, in regarding the relationship between lipoprotein and pre-HTN in children, studies are scarce.
About the role of a decrease of insulin sensitivity on development of pre-HTN, the results are controversial, with some studies showing a significant association17,19,22 but others showing no association; 21 discrepancies that could be related to ethnicity and age of the target populations. In our study, insulin levels show an increase with rise in BMI, starting at 75th percentile of BMI; so, it is possible that non-obese children reached high insulin levels that predispose them to atherogenic lipid profile and elevation of BP. Furthermore, taking into account that in the non-obese children the proportion of FHH was significantly higher as compared with obese children, our results suggest that FHH may be a risk factor, as important as obesity, in developing pre-HTN. These findings strongly suggest that overweight children could also be at high risk for metabolic and cardiovascular disease, particularly in the presence of FHH.
Because our objective was to evaluate the association of lipoprotein and atherogenic indices with pre-HTN, in the non-obese group the multivariate logistic regression analysis was adjusted for FHH, insulin levels and HOMA-IR index that were, for the purpose of the present study, confounder variables. After adjustment, the TG:HDL-c ratio remained significantly associated with pre-HTN; thus, the TG:HDL-c ratio, but not other lipoproteins or atherogenic indices, is associated with pre-HTN in obese and non-obese children, suggesting that this marker, irrespective of obesity, is a suitable test for predicting pre-HTN in children.
Given that the process of atherosclerotic cardiovascular disease could begin early in childhood and that atherogenic indices have additive effects that contribute to the increase of atherosclerosis and arterial wall thickness,8, 27 the screening for atherogenic risk in childhood could be among strategies for the primary prevention of cardiovascular disease in adulthood.
Several limitations of this study deserve to be mentioned. First, because there are no specific cut-off points for lipid profile in Mexican children, we used the reference ranges for lipids from the report of the Expert Panel on Blood Cholesterol Levels in Children and Adolescents guidelines of NCEP; further research with the specific methodological design to establish the cut-off points by age and sex in Mexican children and adolescents is mandatory. Second, because our study is based on a cross-sectional design, causation could be not inferred with certainty; whether TG/HDL-c index is a predictor of pre-HTN or merely an associated epiphenomenon cannot be ensured. Third, we did not measure customary diet and physical activity, which are important risk factors associated with increased BP; however, given the sampling strategy and sample size it is expected that diet disorders and lack of physical activity are similarly distributed in the groups in the study. Third, although prevalence of pre-HTN was similar to that reported in other ethnic groups,17,18 because pre-HTN was defined based on the average of two readings of BP, it is possible that there was a selection bias in the allocation of participants into groups in the study; given the sample size it was not possible to use 24-h BP ambulatory measurement, as the gold standard test for diagnosing pre-HTN. Finally, because only Mexican children inhabitants of urban areas were enrolled, our results cannot be extrapolated to other ethnic groups. Further studies that include children from different ethnicity are needed in order to confirm our finding.
The strengths of our study include the sample size of children from different Mexican communities and that, in order to minimise the well-known pubertal effects on BP, only children with Tanner stage 1, within a small age range, were included.
In summary, data from this community-based sample of Mexican children suggest that, irrespective of obesity and other well-known risk factors, the TG:HDL-c ratio is related to pre-HTN in children. Furthermore, our results suggest that insulin starts to rise at 75th percentile of BMI in children with pre-HTN and that FHH seems to be a risk factor, as important as obesity, in developing pre-HTN.
Footnotes
Funding
This work was supported by grants from Fundación IMSS, A.C.
Conflicts of interest
None declared.