
Abstract
Keywords
Introduction
For a long time, it has been known that atherosclerosis begins early, including in utero, and manifests itself with some pathological processes before it becomes clinically evident. 1 Recognition of the development of atherosclerosis before it becomes a clinical disease is essential in identifying individuals at risk and deciding on whom to apply intensive treatment regimens. 2 However, the carotid artery is commonly used to measure preclinical atherosclerosis due to its availability; the thoracic aorta is affected by atherosclerosis earlier. 3 Patients who undergo transoesophageal echocardiography for suspected structural heart disease such as atrial septal defect, ventricular septal defect, and thrombus in the left atrial appendage can be screened for markers of macroscopic disease and preclinical atherosclerosis of the thoracic aorta.
It is known that diabetes and metabolic syndrome, which are characterized by insulin resistance, accelerate the formation of all cardiovascular diseases, including coronary artery disease. 4 Numerous laboratory and anthropometric measurements have been proposed to measure insulin resistance. 5 The triglyceride-glucose (TyG) index has recently been used to measure insulin resistance. The triglyceride-glucose index is derived from blood levels of fasting glucose and triglycerides. It is calculated by taking the natural logarithm of half of the product of glucose and triglyceride levels. High availability and easy measurement make this index very useful in clinical practice. Regardless of glucose tolerance or obesity, the TyG index correlated with insulin resistance and validated against the gold standard euglycemic-hyperinsulinemic clamp test. 6 As a good marker of insulin resistance, the TyG index is associated with an increased risk of diabetes mellitus, 7 stroke, 8 coronary artery disease9,10 in healthy individuals. It is beneficial for estimating the risk of adverse prognosis of symptomatic and asymptomatic coronary artery disease and acute myocardial infarction.11,12 In addition, there is evidence that the TyG index is also correlated with asymptomatic carotid artery atherosclerosis. 13 We aimed to examine the relationship between the TyG index and the thoracic aorta’s intima-media thickness (IMT) in patients who underwent transoesophageal echocardiography for suspected structural heart disease such as atrioventricular septal defect, patent foramen ovale, and valvular heart diseases.
Methods
One hundred twenty-two patients who had undergone TOE between January 2021 and June 2021 for suspected structural heart disease such as atrial septal defect, ventricular septal defect, and thrombus in the left atrial appendage were enrolled in the study. Patients with hypertension, diabetes mellitus, coronary artery disease, peripheral artery disease, stroke, and chronic renal failure (eGFR< 30ml/min) were excluded from the study. Patients taking statins, fibrates, ezetimibe, PCSK9 inhibitors, antidiabetics, steroids, and other drugs that impact lipid characteristics or insulin sensitivity were also excluded from the study. Blood samples were drawn after 12 hours of fasting before the TOE procedure. Triglyceride-glucose index was calculated using the formula; TyG = ln [(Glucose (mg/dl) Triglycerides(mg/dl)/2]. The estimated glomerular filtration rate was calculated using the new 2021 Chronic Kidney Disease Epidemiology Collaboration (CKD-EPI) creatinine equation. 14 Major risk factors for cardiovascular disease were recorded for each participant. All variables reported in this study were specified before the data collection. The local ethics committee of the University of Health Sciences, Adana Training and Research Hospital approved the study design (meeting no: 87, issue no:1538). All participants carefully read and approved the informed consent. The study was conducted according to the Helsinki Declaration.
Statistics
SPSS 22.0 software (SPSS Inc. Chicago, IL) was used for statistical analysis. The Shapiro–Wilk test was used to analyze the normality of continuous variables. Continuous variables with a normal distribution were expressed as the mean, and standard deviation, while non-normally distributed variables were expressed as the median (minimum-maximum). Student’s t-test and Mann–Whitney U tests compared normally and non-normally distributed continuous variables between two groups. For bivariate analysis, Pearson and Spearman correlation coefficients were reported. Binary logistic regression analysis was used to determine the variables independently associated with IMT. The variables significantly associated with IMT were included in the regression model. We applied the receiver operating characteristic for testing the goodness of fit of our binary logistic regression analysis. A p-value less than 0.05 was considered statistically significant.
Transthoracic and transoesophageal echocardiography
Transthoracic echocardiography and TOE were performed using a commercially available system (Vivid 7R, GE Medical Systems, Horten, Norway). Following a 12-hour fasting interval, all patients underwent TOE with a 5Mhz multiplane transoesophageal transducer. After oropharyngeal anesthesia with lidocaine spray, subjects were put in left decubitus with the left arm under their heads. The transducer was inserted through the mouth into the esophagus and gastric cavity to observe the cardiac and aortic structures. TOE was performed by an expert cardiologist who was blinded to other laboratory tests. All patients tolerated TOE well, and there were no complications. An expert observer independently interpreted all the recorded images. The thoracic aortic IMT was defined as the distance from the leading edge of the lumen-intima interface to the leading edge of the media–adventitia interface of the far wall. Intima-media thickness was measured manually in the thoracic aorta in six segments: ascending aorta, arcus aorta, and from distal arch to abdominal aorta was separated into four independent portions, each 5 cm long. The highest value for the IMT among the six segments was recorded. 15
Results
Comparison of IMT groups.
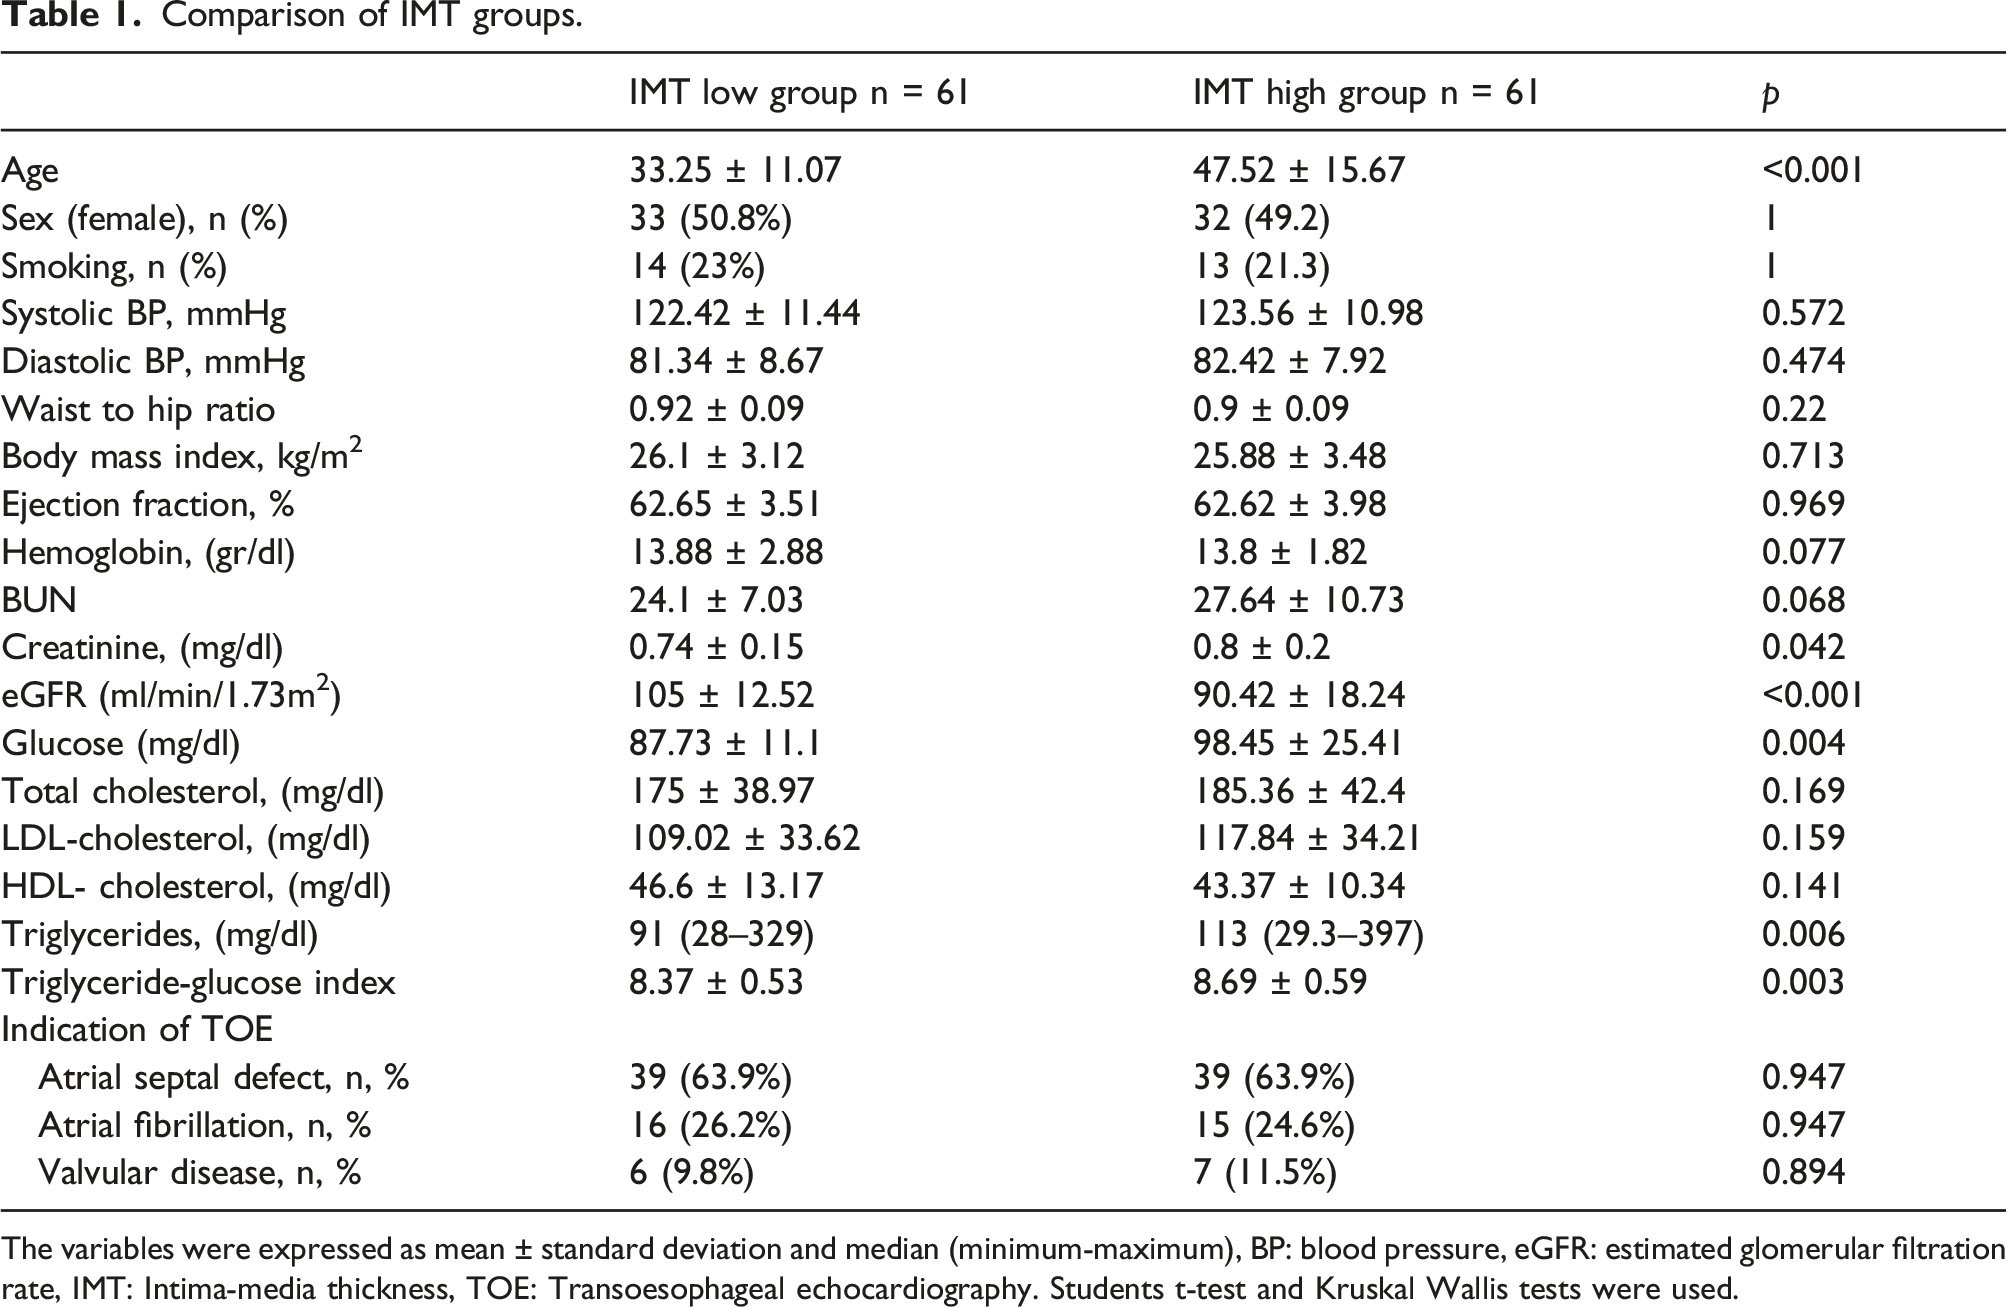
The variables were expressed as mean ± standard deviation and median (minimum-maximum), BP: blood pressure, eGFR: estimated glomerular filtration rate, IMT: Intima-media thickness, TOE: Transoesophageal echocardiography. Students t-test and Kruskal Wallis tests were used.
Age, creatinine, glucose, triglyceride, and TyG index were higher in the high IMT group. Sex, smoking status, cholesterol levels, and TOE indications were similar among the groups (Table 1). The difference in TyG index between the two groups is illustrated in Figure 1.
Correlations of Intima-media thickness.
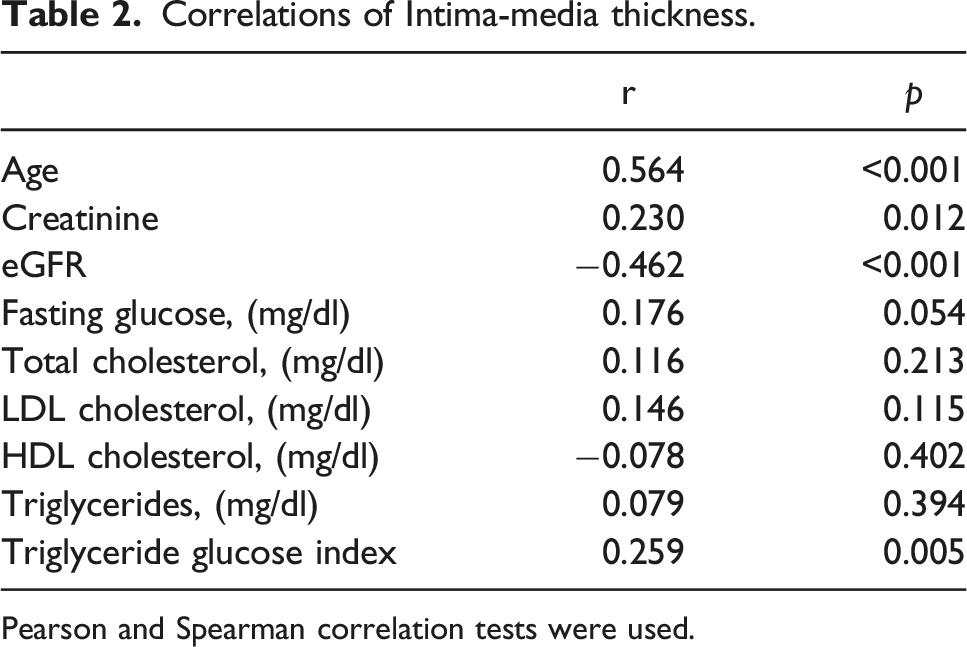
Pearson and Spearman correlation tests were used.
Binary logistic regression analysis for having high Intima-media thickness.
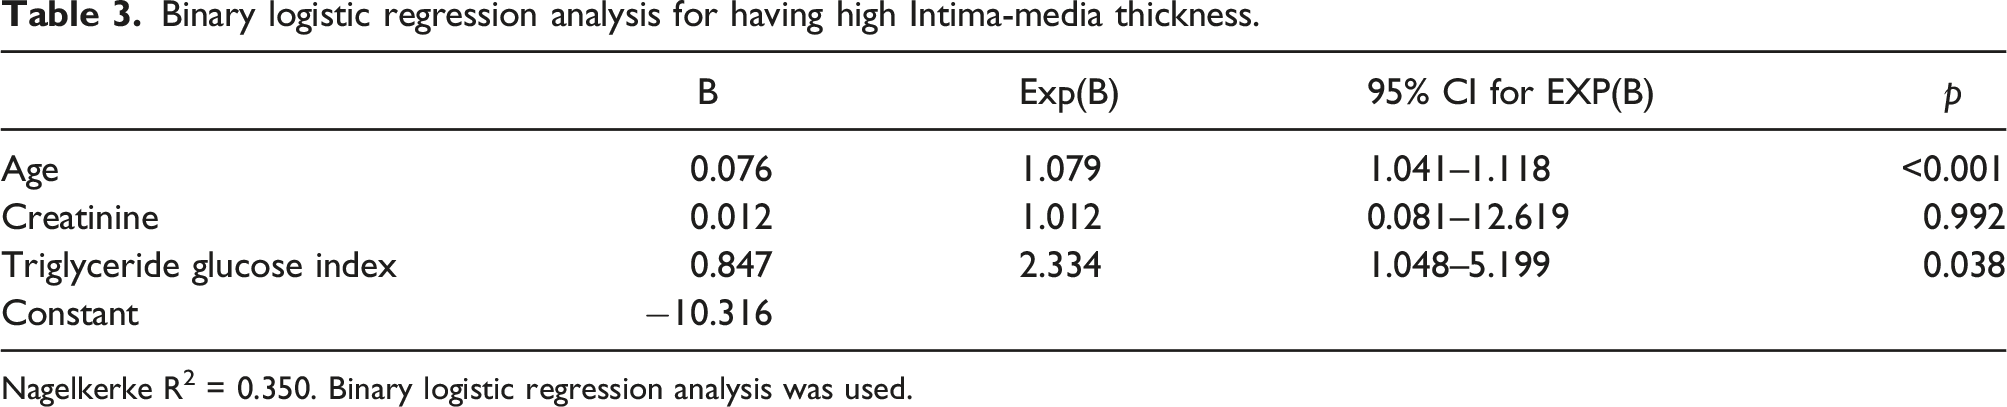
Nagelkerke R2 = 0.350. Binary logistic regression analysis was used.
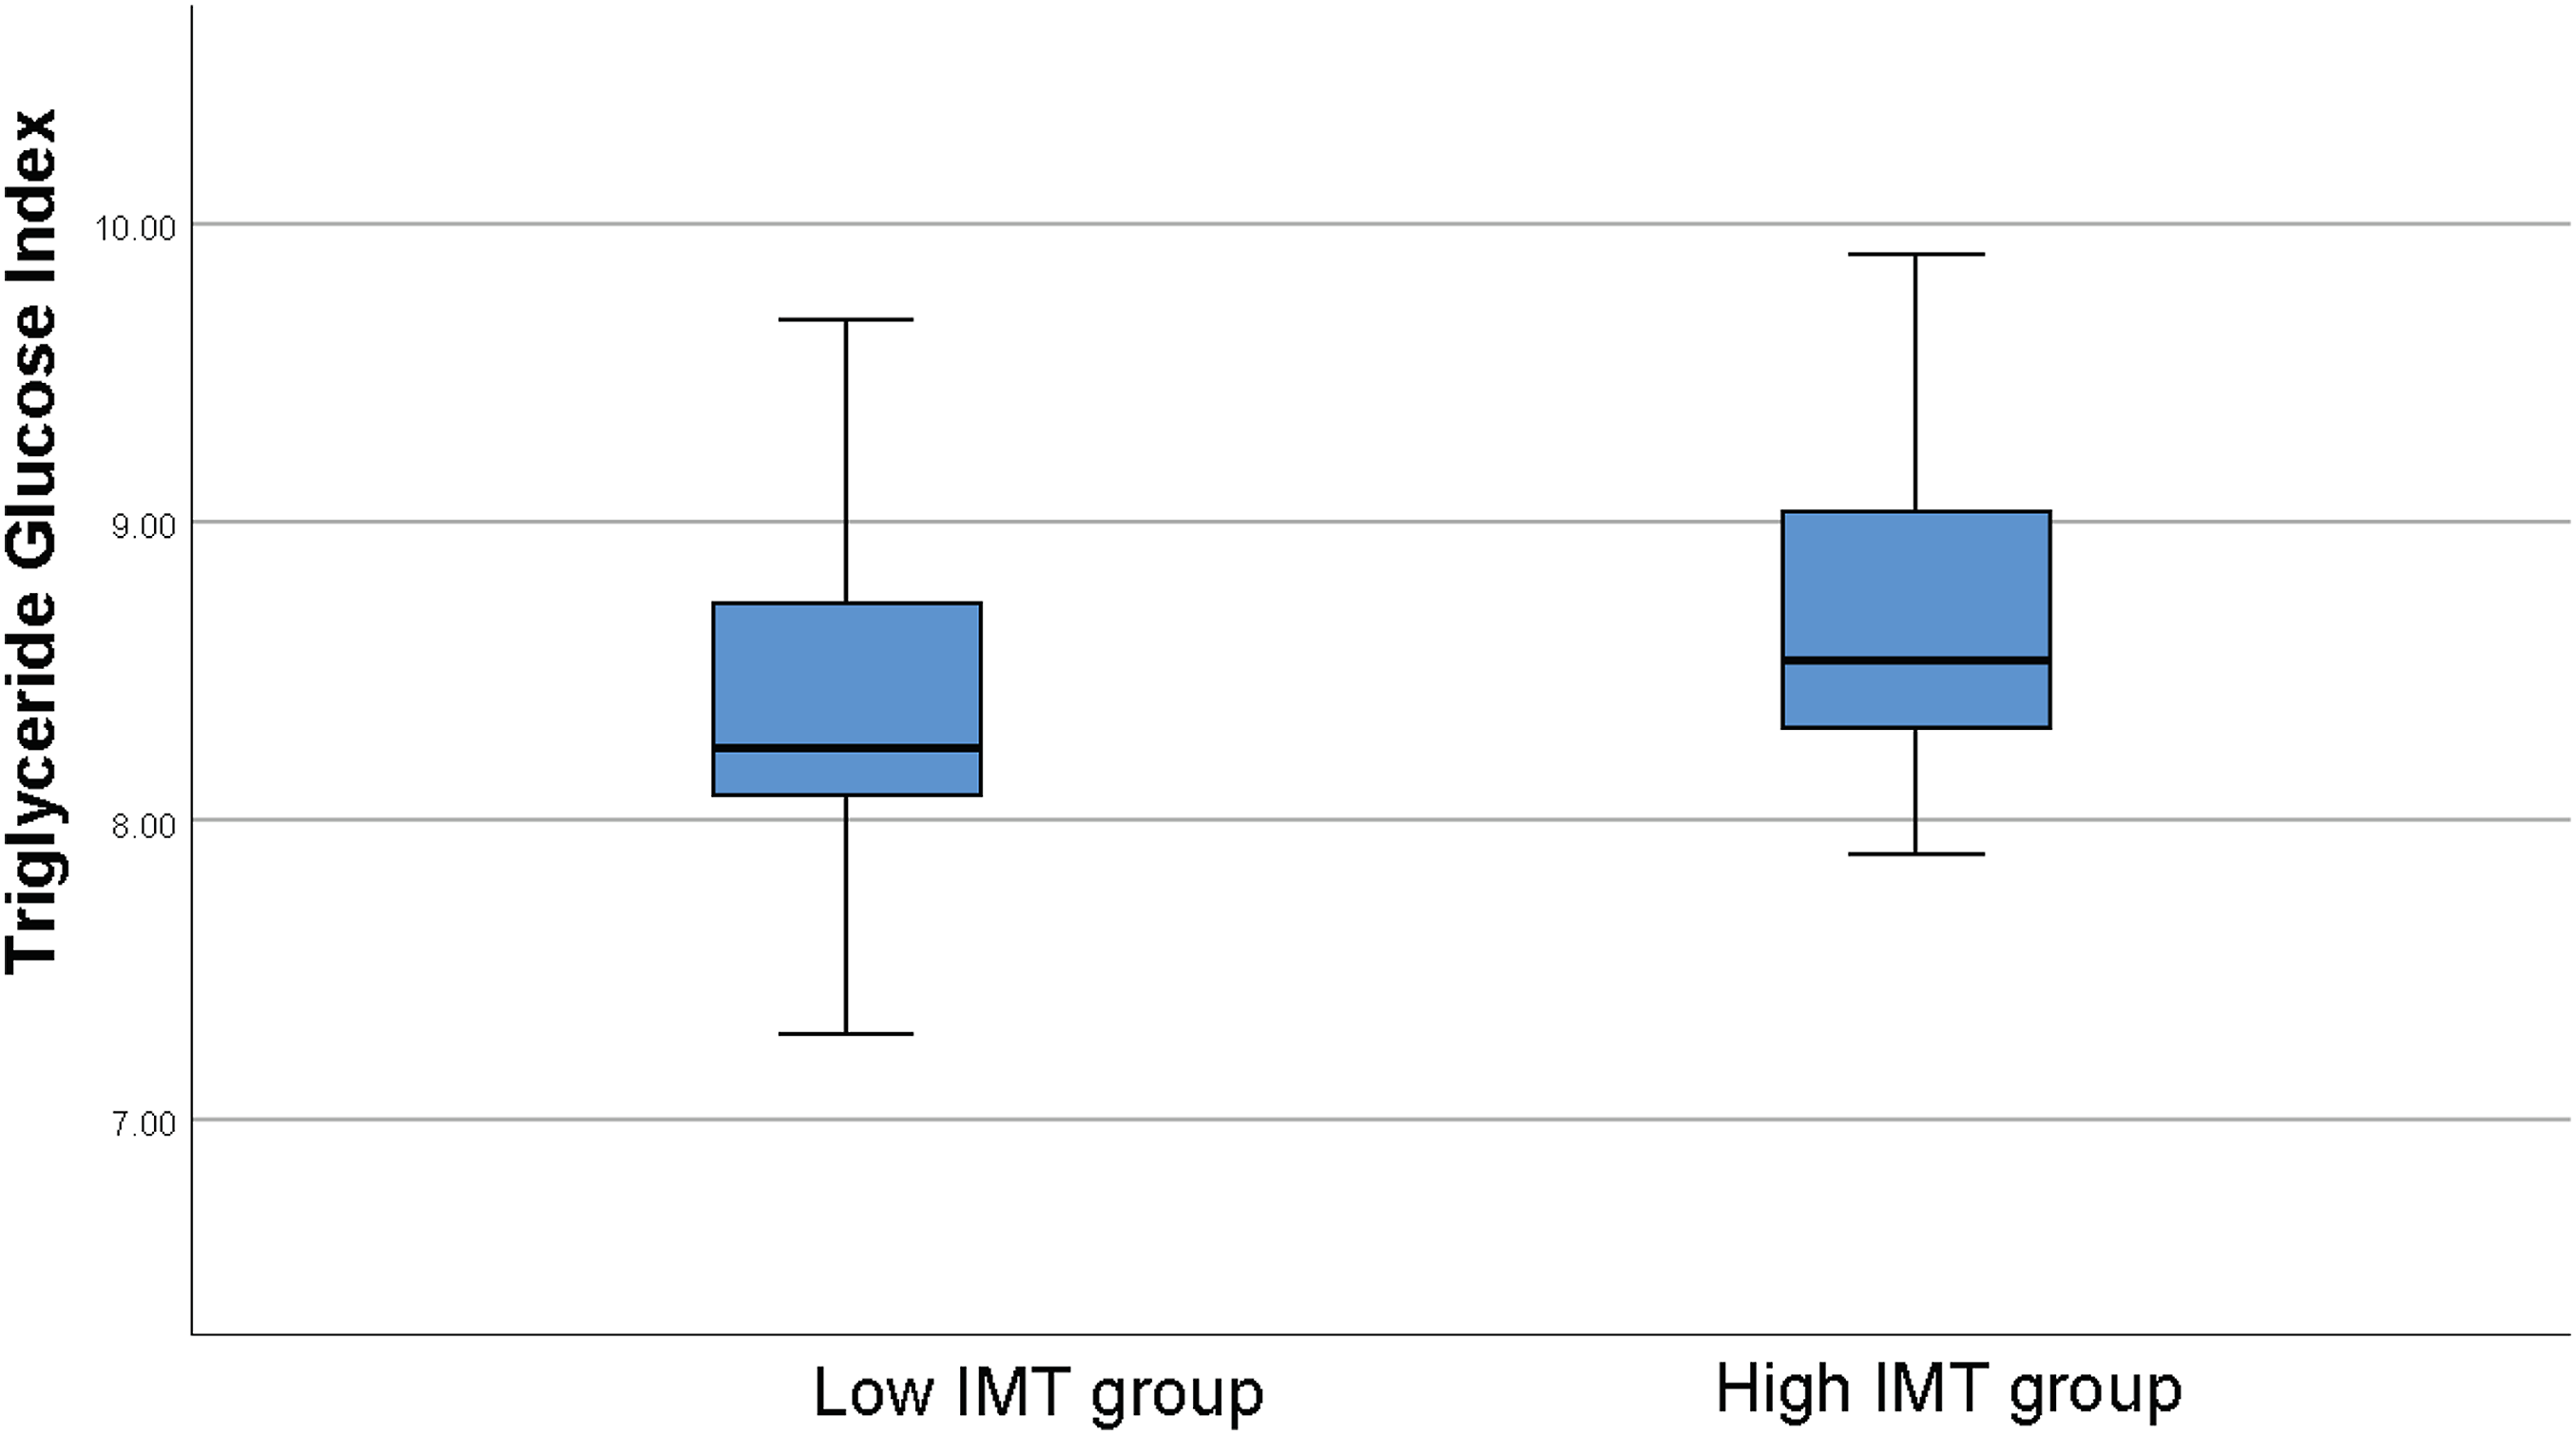
Boxplot diagram depicting the difference between low and high intima-media thickness groups in the triglyceride glucose index (8.37 ± 0.53 vs 8.69 ± 0.59, p = .003).
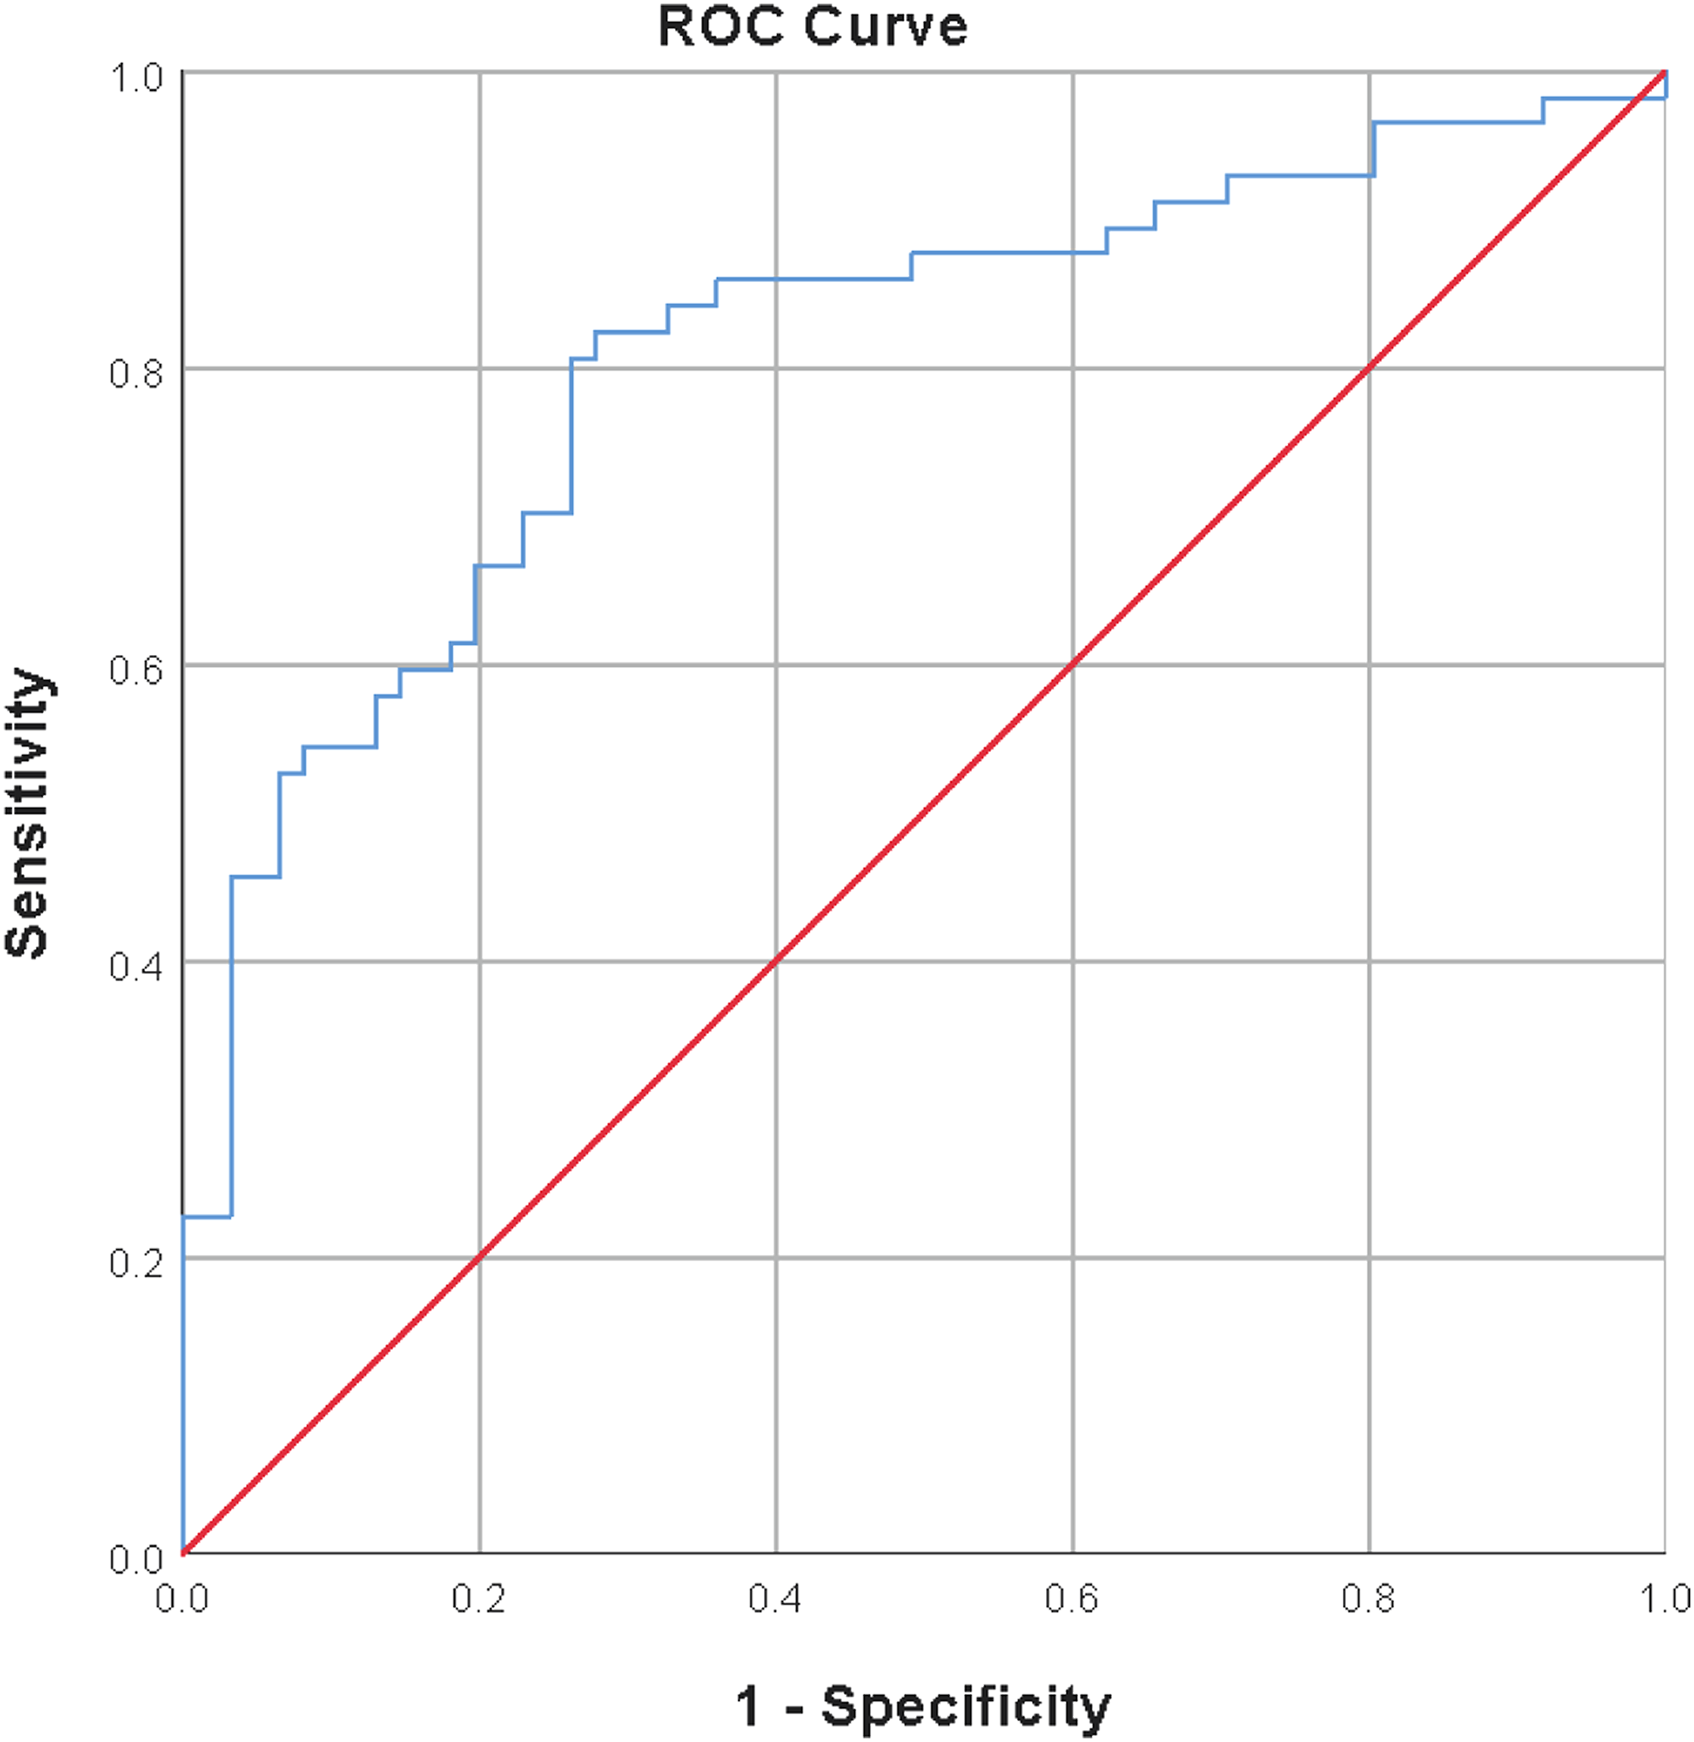
Receiver operating characteristics curve for the goodness of fit of the proposed model for having high intima-media thickness; logit(p) = −10.316+0.076*age+0.847*TyG index (AUC: 0.808 95%CI: 0.728–0.888, p < .001).
Discussion
We showed that the TyG index is independently related to aortic IMT, a marker of subclinical atherosclerosis in individuals without any previous atherosclerotic cardiovascular disease or diabetes. Several investigations have linked the TyG index to atherosclerotic cardiovascular disease risk factors such as type 2 diabetes,7,16 hypertension, 17 and metabolic syndrome. 18 Other cardiovascular disease surrogate measures related to the TyG index include coronary artery calcium score, 19 IMT of carotid arteries, and arterial stiffness. 20 To our knowledge, our study is the first to show an independent relationship between the TyG index and the thoracic aorta IMT. The Triglyceride-glucose index is directly proportional to the blood glucose and triglyceride levels, and both appear to increase in individuals with insulin resistance. The causal relationship between insulin resistance and atherosclerosis is well established in the literature.
Examining the association between blood glucose and triglyceride levels separately with atherosclerosis can reveal the relationship between the TyG index and atherosclerosis. At the beginning of insulin resistance, increased lipolysis of stored triglycerides in adipose tissue and increased production of fatty acids in the liver increase triglyceride levels before elevating plasma glucose levels. Therefore, fasting glucose remains in the normoglycemic range. 21 Several meta-analyses with many patients have shown that fasting plasma glucose levels, already within the normoglycemic range (<100 mg/dL), are associated with the risk of developing coronary heart disease in subjects without diabetes mellitus. 22 The risk of coronary disease increased linearly with blood glucose levels, independent of other established cardiovascular disease risk factors, and the increased risk of diabetes 23 did not mediate it. Fasting glucose concentration is associated with coronary artery risk in people without diabetes, with an increased risk of 6% for every 1 mmol/L increment (18 mg/dL) in fasting plasma glucose, according to a meta-analysis of 26 prospective studies involving over 300,000 people. 24
Another finding in insulin resistance is elevated triglyceride levels, whose relationship with cardiovascular risk and mortality is disputed. 25 It is difficult to isolate hypertriglyceridemia’s effect on the cardiovascular disease because it is frequently associated with other atherogenic lipid diseases, such as decreased HDL cholesterol and higher LDL cholesterol levels. However, in some studies, the relationship between triglyceride levels and cardiovascular disease became nonsignificant after adjusting for other lipid disorders and major variables; most studies found a direct association of triglyceride levels with increased risk and worse outcomes. Elevation of plasma free fatty acids activates the proinflammatory NFκB pathway, resulting in increased hepatic expression of several proinflammatory cytokines, including TNF-α, IL1-β, IL6, and matrix metalloproteinases, 26 these inflammatory changes which play a significant role in the development of atherosclerosis. 27 It has been shown that daily administration of 2 g of icosapent ethyl reduces the frequency of cardiovascular death and ischemic events in patients who have recently used statins for coronary artery disease and still have high triglyceride levels (135–499 mg/dl).
Since plaque thickness rather than morphology is thought to be a more objective and reliable indicator of atherosclerotic disease, most grading systems use the maximum plaque thickness of the most diseased segment. However, there are a few grading systems of aortic atheroma based on IMT; no standard or widely accepted IMT cut-off is available for classification. 15 We used the median value of 1.42 mm as a cut-off to indicate high IMT. In literature, IMT higher than 1.5 mm was associated with an increased risk of coronary artery disease and stroke. 28 Although our definition of having a high IMT may seem arbitrary, the median IMT value of the patients in our study is very close to the value known to increase the risk of coronary artery disease and stroke (1.42 vs. 1.5), provides a rational basis for our definition. Since atherosclerosis begins in the thoracic aorta earlier than in the carotid arteries,3,29 our study has the advantage of delineating the relationship between TyG and subclinical atherosclerosis better than studies performed on the carotid arteries.
Lifestyle modifications or drug therapies are recommended for primary prevention by calculating the fatal and non-fatal cardiovascular disease risk using scoring systems (SCORE2 and SCORE2-OP) based on age, sex, blood pressure, smoking status, and non-HDL cholesterol levels. 2 In addition, some non-invasive tests like coronary artery calcium score,30,31 and carotid ultrasound help to reclassify individuals into a higher or lower risk category. Based on our findings, we may suggest that the TyG index can also be used for adding information on the calculated SCORE risk
Although it is well known that smoking is associated with increased IMT, 32 no relationship was found between smoking and IMT in our study. This may be because the cumulative effect of smoking was not evident due to the relatively low smoking rate and the low mean age in our study group. The relationship could be significant with increasing the number of subjects or evaluating smoking as package years, and this situation can be considered one of the limitations of our study.
Most of the subjects included in our study are young individuals (mean age 40.38 ± 15.29 years) with low cardiovascular risk. They represent a narrow area of the cardiovascular risk spectrum compared to the general population. In addition, the cross-sectional structure of our study makes it difficult to reveal the cause-effect relationship, and these are major limitations of our research.
Conclusion
We showed that the TyG index predicts having a higher IMT independently of other major risk factors for atherosclerosis in subjects without known atherosclerotic cardiovascular disease and diabetes. Based on this finding, the TyG index may be useful for identifying individuals at high risk of developing cardiovascular diseases.
Footnotes
Declaration of conflicting interests
The author(s) declared no potential conflicts of interest with respect to the research, authorship, and/or publication of this article.
Funding
The author(s) received no financial support for the research, authorship, and/or publication of this article.