
Abstract
Introduction
Coronary microcirculation abnormalities in diabetes mellitus have been reported in various clinical and experimental studies. These include morphological 1 and functional abnormalities on non-invasive or invasive imaging.2–5 Myocardial contrast echocardiography (MCE) utilises compressible membrane-stabilised microbubbles containing gas, which behaves similarly to red blood cells, rendering them an excellent tracer for blood flow measurements. Destruction of microbubbles and observation of the gradual refill into the myocardium is the foundation for the evaluation of myocardial perfusion using real-time MCE. 6 Furthermore, MCE has been developed to quantitatively measure myocardial perfusion by analysis of refill/replenishment curves. 7 MCE-derived myocardial blood flow (MBF) has been reported to correlate well with intracoronary Doppler flow wire measurements and invasive coronary flow reserve measurements in humans.8,9 In addition, MCE-derived absolute MBF (ml/min/g) and its reserve measurements have been validated against positron emission tomography (PET) 10 and coronary angiography. 11
There are limited data on the use of MCE in the evaluation of myocardial perfusion in patients with diabetes. In a recent study utilising MCE in a diabetic animal model, the researchers reported lower myocardial perfusion reserve in the diabetic group compared to controls. 12 Only two studies have evaluated MCE in diabetic patients; in both studies, lower semiquantitative MBF and reserve were reported in patients with diabetes.13,14 However, MCE-derived absolute MBF (ml/min/g) and reserve have not been explored in patients with diabetes mellitus (DM). In the current study, we report on the prevalence of perfusion defects in patients with type 2 diabetes and compare the diagnostic accuracy of real-time MCE for the detection of abnormal myocardial perfusion in patients with and without type 2 diabetes among those referred for clinically indicated adenosine stress single-photon emission computed tomography (SPECT).
Methods
Study population
We prospectively studied 79 patients (25 with type 2 diabetes) referred to the Mayo Clinic, Rochester, USA for clinically indicated adenosine SPECT. The diabetic subjects had haemoglobin A1c of 7.3±1.6% (range 5.4–10.9%), fasting plasma glucose 151.6±61.2 mg/dl (range 80–289 mg/dl), duration of diabetes 8±5.1 years (range 2–25 years). Twelve patients were receiving oral hypoglycaemic therapy, 12 were on insulin treatment and one was on diet control. Exclusion criteria included age <18 years, moderate to severe valvular heart disease, congenital heart disease, or contraindications to contrast agent or adenosine. The study was approved by the Mayo Clinic Internal Review Board.
Imaging protocol
Rest and stress MCE were performed simultaneously with the SPECT test during same day. Ultrasonography (SONOS 7500 or iE33, Philips Healthcare, Andover, MA, USA) was used. Apical -4, -3, -2 chambers and short axis views were acquired using the power modulation contrast setting at a mechanical index (MI) of ≤0.2, frame rate of approximately 20 Hz and focus adjusted at mitral valve level. Depletion–replenishment imaging was used with a transient, high-MI (1.2) imaging ‘flash’ (for approximately 15 frames) to clear myocardial microbubbles, then replenishment was observed over 15 cycles. Images were stored digitally for offline analysis. One vial of Definity® (Lantheus Medical Imaging; North Billerica, MA, USA) diluted with 0.9% saline (30 cc) was infused continuously at 250 ml/h. Contrast infusion started 1 minute before MCE acquisition at rest and was kept constant throughout the study. Stress MCE was acquired after 3 minutes of adenosine and completed within 1 minute after discontinuation of adenosine. For the rest SPECT test, technetium-99 m (Tc-99m) sestamibi was injected and imaging was initiated 30 minutes later. For stress SPECT, adenosine (Adenoscan®, Astellas Pharma US, Inc., Deerfield, IL, USA) was infused over 6 minutes at 140 μg/kg/min and Tc-99m sestamibi was injected at 3.05±0.4 minutes of adenosine infusion, and stress images were acquired within 15–60 minutes.
Image interpretation
SPECT images were interpreted by independent clinicians blinded to MCE data. Digitised MCE images were analysed offline by two observers (SSA and MB) blinded to clinical and SPECT results. Both analyses utilised the American Heart Association/American Society of Echocardiography 17-segment model. Wall motion was evaluated using previously established criteria 15 and rest and stress wall motion score indexes (WMSIs) were calculated. Biplane Simpson’s quantitation of ejection fraction (EF) from digitised images was also performed.
Contrast myocardial perfusion defect was defined as visual regional hypoperfusion at 5 seconds post ‘flash’ during rest and 2 seconds during stress. Segments were considered interpretable by MCE only if entirely visualised from epicardium to endocardium. Myocardial contrast enhancement and SPECT regional tracer uptake were visually graded as: absent, markedly reduced, moderately reduced, mildly reduced, and normal. Comparing rest and stress images, perfusion was visually graded as normal or abnormal. Abnormal perfusion was further classified as reversible defect (seen at stress only), fixed defect (seen at rest and post stress) or mixed defect (combination of both).
Quantitative MCE analysis was performed offline by a single observer (SSA) blinded to clinical and SPECT data. Images were evaluated from end-systolic frames using QLAB, version 5.0 (Philips Healthcare, Andover, MA, USA). Segmental regions of interest (ROI) were placed at end-systolic frames. With regard to the replenishment curve parameters, (A, dB) represents the plateau acoustic intensity reflecting microvascular cross-sectional area or myocardial blood volume, (β, s−1) represents the rate of rise of acoustic intensity increase reflecting microbubble velocity; thus, the product A×β (dB.s−1) is a semiquantitative estimate of MBF. 7 Absolute MBF in ml/min/g was calculated using the model described by Vogel et al. 10 as follows: additional ROIs (of the same size as myocardial ROIs) were manually tracked in the adjacent left ventricular (LV) cavity, and ALV was obtained from the averaging of adjacent LV signal intensities of all end-systolic frames except the ones during and the first after the flash. The relative blood volume pool (rBV, ml/ml) was calculated from (rBV= A/ALV). Myocardial blood volume (β, s−1) was then converted to β (min−1). Absolute MBF (ml/min/g) was calculated from rBV and β was divided by myocardial tissue density (1.05 g/ml). Reserve values were calculated as the ratio of hyperaemia to baseline.
Statistics
Continuous data were reported as mean ± standard deviation. Frequencies were used to report categorical variables and were compared using the chi-square test or Fisher’s exact test accordingly. MCE feasibility was evaluated by reporting the percentage of analysable myocardial segments. The paired t-test or Wilcoxon signed-rank test were used to compare quantitative MCE variables within patient’s data. The independent t-test was used for comparison of between patients’ data. Receiver operating characteristic (ROC) curves were used to determine the best cut-off values of quantitative MCE parameters for predicting abnormal perfusion by SPECT in patients with diabetes, and the area under the curve (AUC) was calculated for each parameter. Diagnostic accuracy of MCE compared to SPECT included reporting sensitivity, specificity, accuracy and positive and negative predictive values (PPVs and NPVs, respectively). Interobserver variability for qualitative MCE perfusion analysis was assessed in 30 patients by two independent observers (SSA, SLM), while for quantitative MCE analysis SSA and AD were blinded to clinical and SPECT data. Intraobserver variability for qualitative and quantitative MCE was assessed in the same patients by an observer (S.S.A) four months apart. Variability for qualitative MCE was reported using kappa and its standard error (SE), whereas the coefficient of correlation (r) was used for quantitative MCE. In all analyses the significant level was set at two-tailed p<0.05. All analyses were performed using JMP version 7.0 (SAS Campus Drive, Cary, NC, USA).
Results
Clinical data
Baseline clinical characteristics of the study groups are summarised in Table 1. Patients with diabetes had a larger body mass index (BMI) and a greater prevalence of prior myocardial infarction (MI). Adenosine administration resulted in a significant increase in heart rate by a mean difference ±SE of 12.4±1.4 bpm (p<0.001) and an increase in rate-pressure product of 1286.7 ±218 bpm × mmHg (p<0.001). Although haemodynamic recordings did not differ significantly between groups, patients with diabetes trended towards a lower peak-stress double product and higher peak-stress WMSI versus subjects without diabetes (10342±2027 versus 11287±2380; p=0.08) and (1.20±0.34 versus 1.17±0.37; p=0.69), respectively. Overall, there was a statistically significant difference between stress and rest EF (mean difference ±SE of 9.5±2.8%; p<0.001), and between stress and rest WMSI (mean difference ±SE 0.09±0.02; p<0.001).
Clinical characteristics of the study population (N=79)
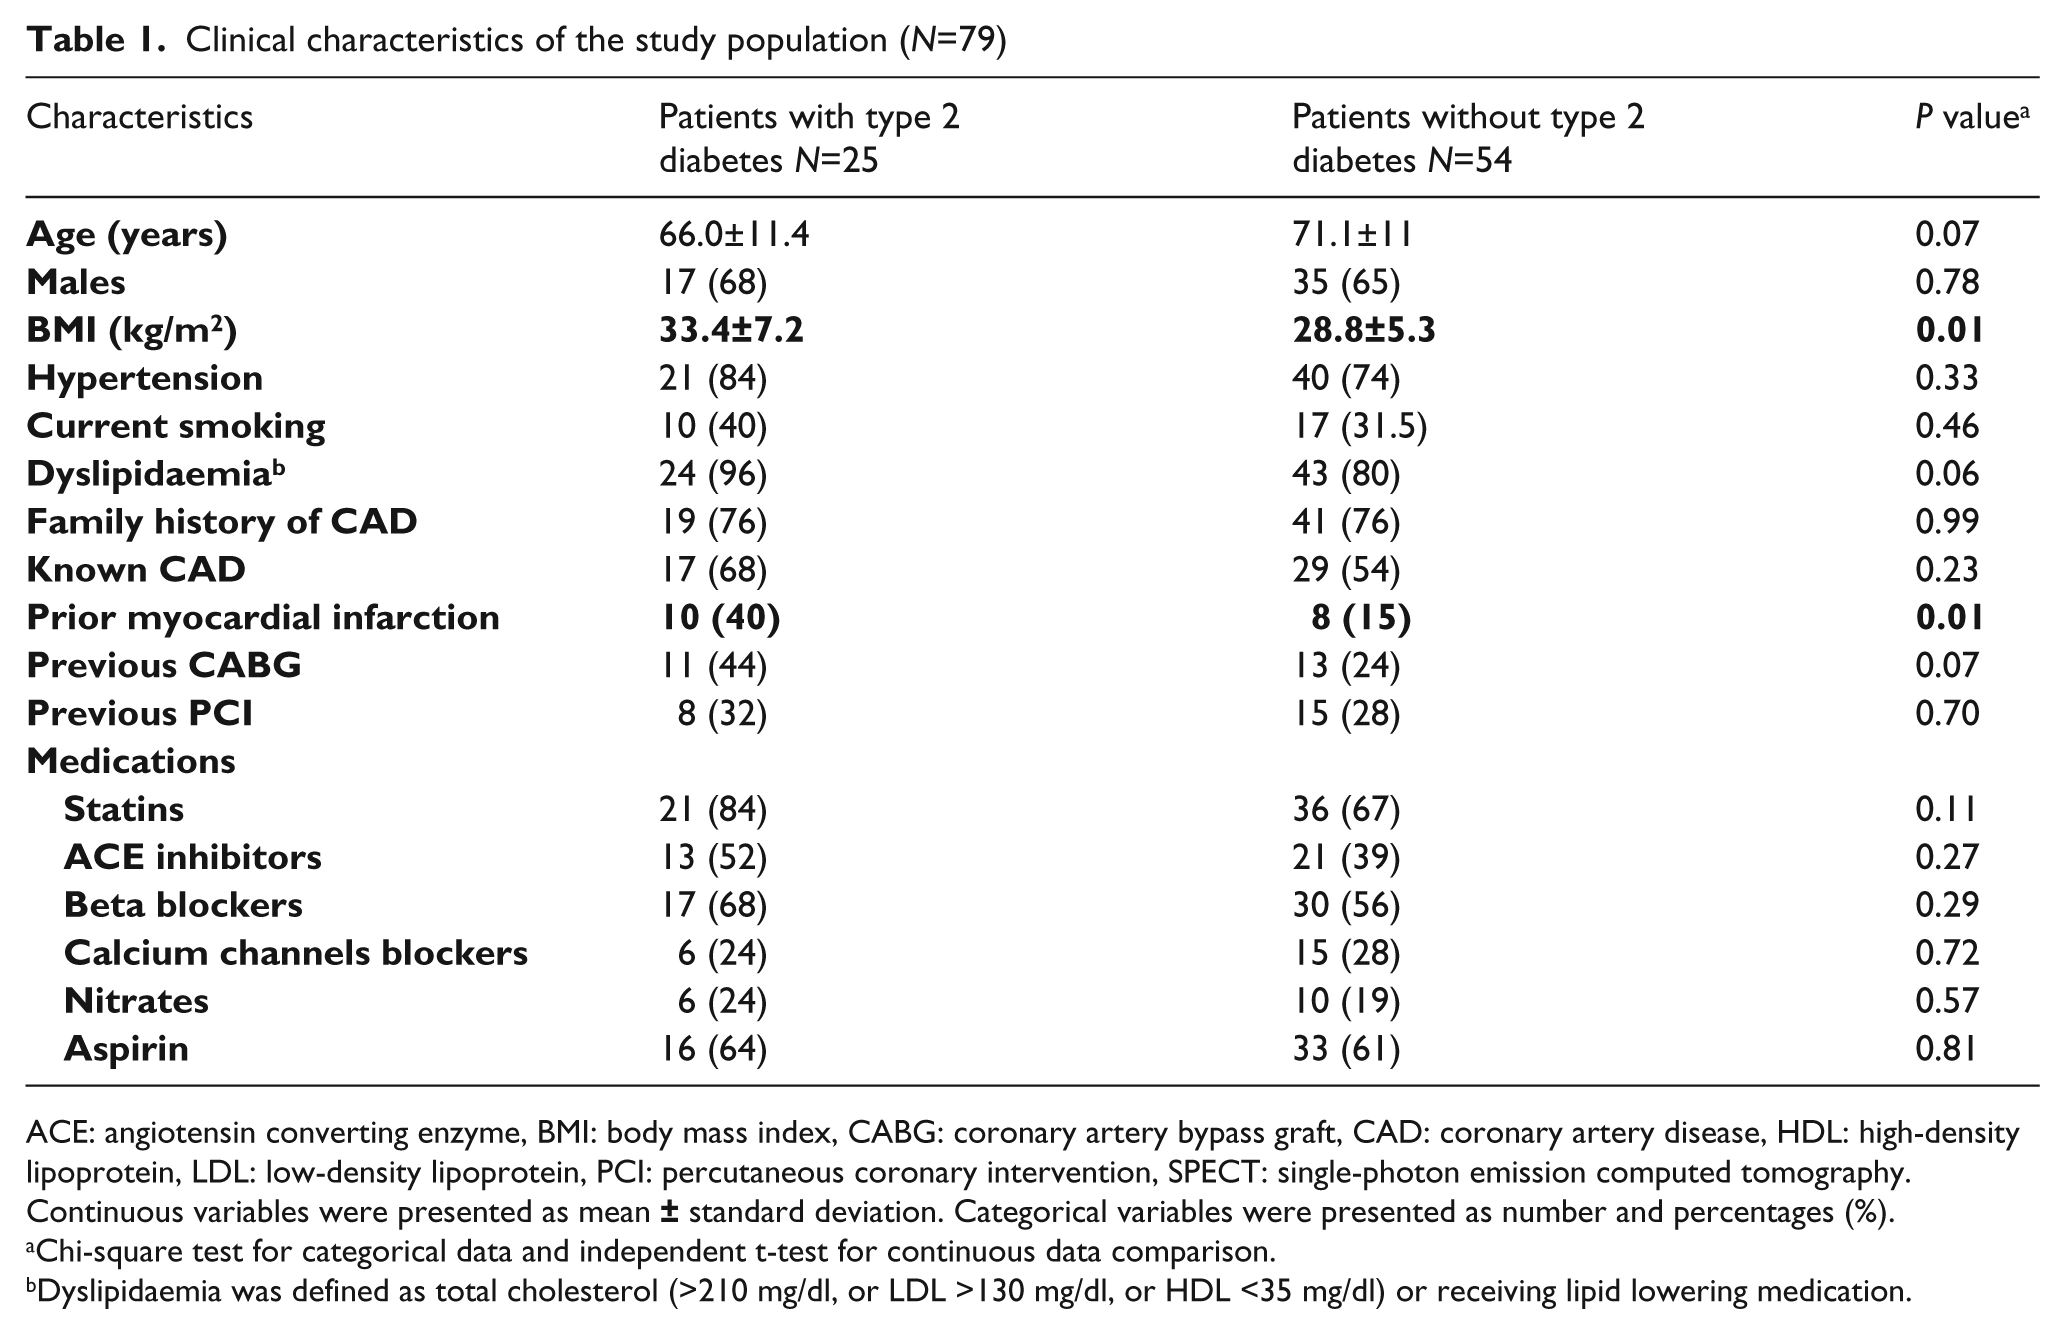
ACE: angiotensin converting enzyme, BMI: body mass index, CABG: coronary artery bypass graft, CAD: coronary artery disease, HDL: high-density lipoprotein, LDL: low-density lipoprotein, PCI: percutaneous coronary intervention, SPECT: single-photon emission computed tomography.
Continuous variables were presented as mean
Chi-square test for categorical data and independent t-test for continuous data comparison.
Dyslipidaemia was defined as total cholesterol (>210 mg/dl, or LDL >130 mg/dl, or HDL <35 mg/dl) or receiving lipid lowering medication.
Visual MCE compared with SPECT
In 79 patients who underwent successful SPECT and MCE, SPECT was abnormal in 38 (48%) patients [15 of 25 (60%) in patients with diabetes and 23 of 54 (42%) in patients without diabetes, p=0.01] while visual MCE was abnormal in 40 (51%) patients [15 of 25 (60%) in DM patients and 25 of 54 (46%) in non-DM patients, p=0.04]. In patients with diabetes, perfusion defects by SPECT were characterised as reversible in 7 (28%), fixed in 3 (12%), and mixed in 5 (20%), while MCE perfusion defects were characterised as reversible in 10 (40%), fixed in 1 (4%), and mixed in 4 (16%).
MCE and SPECT overall concordance for normal versus abnormal perfusion was found in 67 of 79 (85%) cases [kappa (SE) of 0.696 (0.08)]. In patients with diabetes, MCE agreed with SPECT on normal versus abnormal perfusion in 23 of 25 cases with Kappa (SE) of 0.833 (0.11), and in 44 of 54 cases with Kappa (SE) of 0.626 (0.11) in patients without diabetes.
Compared with SPECT, visual MCE analysis had 87% sensitivity [95% confidence interval (CI), 77–93%], 83% specificity (95% CI, 74–89%), 85% accuracy (95% CI, 77–93), a PPV of 83% (74–89%), and a NPV of 87% (78–93%). The diagnostic accuracy measures (95% CI) of visual MCE in patients with diabetes versus that in patients without diabetes were comparable [sensitivity 93% (79–98%) versus 83% (68–92%); specificity 90% (69–97%) versus 81% (70–87%); accuracy 92% (81–99%) versus 81% (71–91%); PPV 93% (79–98%) versus 76% (63–84%), and NPV 90% (69–97%) versus 86% (75–94%)]. After stratifying patients based on diabetic status and SPECT perfusion results (abnormal perfusion = reversible, fixed or mixed defect diagnosis), diabetic patients with abnormal SPECT had a higher proportion of abnormal MCE compared to non-diabetic patients (Figure 1).
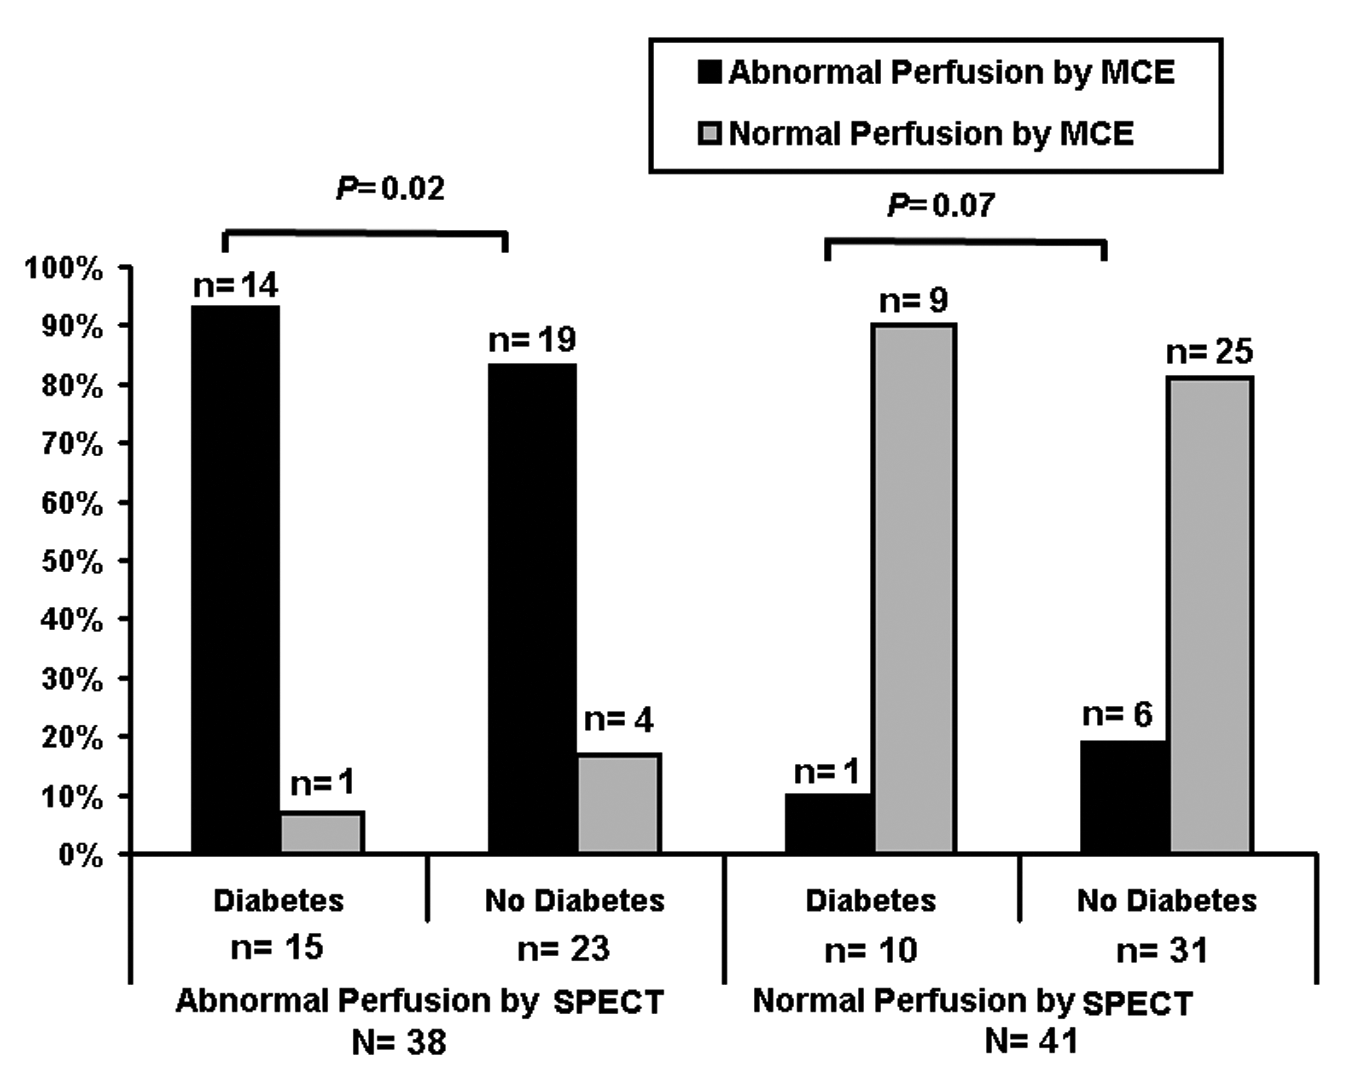
Visual myocardial contrast echocardiography in patients with and without type 2 diabetes stratified by normal or abnormal perfusion reported on single-photon emission computed tomography.
To test the effect of prior history of MI and BMI on perfusion defects detected by either SPECT or MCE, a stratified analysis was performed for each parameter comparing diabetic versus non-diabetic patients. After stratifying for included patients based on the prior history of MI, those with diabetes had a higher percentage of abnormal perfusion by SPECT and MCE compared to non-diabetic patients, however, this did not reach statistical significance [53% versus 46% (p=0.668) and 57% versus 42% (p=0.799), respectively]. After stratifying included patients based on a BMI >30 kg/m2, diabetic patients with a BMI >30 kg/m2 had a higher percentage of abnormal perfusion by SPECT and MCE compared to non-diabetic patients, however, this did not reach statistical significance [58% versus 42% (p=0.077) and 55% versus 45% (p=0.140), respectively].
Quantitative MCE
Quantitative MCE was feasible in all 79 patients. Segmental quantitative MCE was feasible for analysis in 1060 (79%) segments at rest and 1075 (80%) segments at stress, and in 975 (73%) for reserve measurements. There was no statistical difference in the feasibility of quantitative MCE analysis between the two groups (282 in patients with diabetes versus 693 in patients without diabetes, p=0.13). Inability to perform quantitative MCE analysis was related to failed curve fitting or lack of complete transmural visualisation of the myocardium.
Overall there was a statistically significant increase between baseline and hyperaemia in quantitative perfusion parameters, rBV (ml/ml), β (min−1) and MBF (ml/min/g), for both patients with and without diabetes (Table 2). Patients with diabetes had significantly impaired peak-stress and reserve measurements of β and MBF (but not rBV) compared to patients without diabetes.
Segmental quantitative myocardial perfusion parameters at baseline, hyperaemia and reserve in patients with or without diabetes
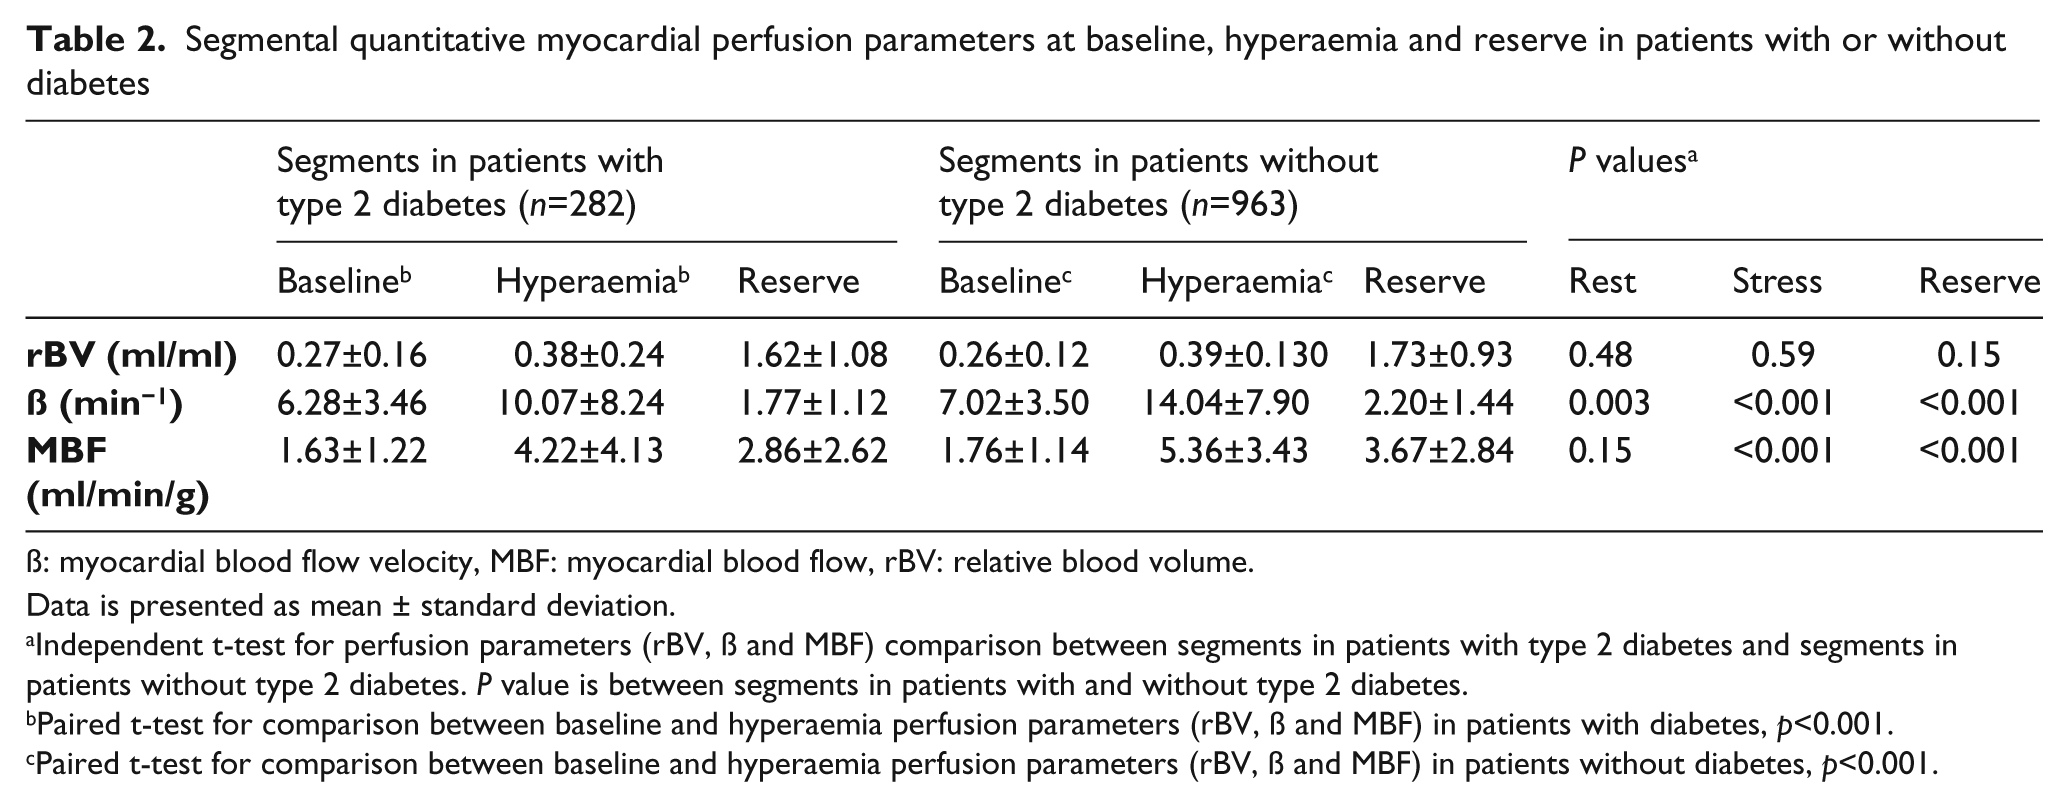
ß: myocardial blood flow velocity, MBF: myocardial blood flow, rBV: relative blood volume.
Data is presented as mean ± standard deviation.
Independent t-test for perfusion parameters (rBV, ß and MBF) comparison between segments in patients with type 2 diabetes and segments in patients without type 2 diabetes. P value is between segments in patients with and without type 2 diabetes.
Paired t-test for comparison between baseline and hyperaemia perfusion parameters (rBV, ß and MBF) in patients with diabetes, p<0.001.
Paired t-test for comparison between baseline and hyperaemia perfusion parameters (rBV, ß and MBF) in patients without diabetes, p<0.001.
Quantitative MCE perfusion parameters compared with SPECT
In the 975 myocardial segments in which reserve measurements were feasible, myocardial perfusion by SPECT was abnormal in 130 (13%) segments [53 (19%) in patients with diabetes and 77 (11%) in patients without diabetes]. In patients with diabetes who had normally perfused segments by SPECT, significantly lower baseline, peak hyperaemia and reserve measurements of β and MBF were noted compared to patients without diabetes who had normally perfused segments by SPECT (Table 3). Similar results were observed in patients with diabetes who had abnormally perfused segments by SPECT compared to abnormally perfused segments in patients without diabetes.
Segmental quantitative myocardial perfusion parameters compared to single-photon emission computed tomography in patients with diabetes versus patients without diabetes for baseline, hyperemia and reserve measurements
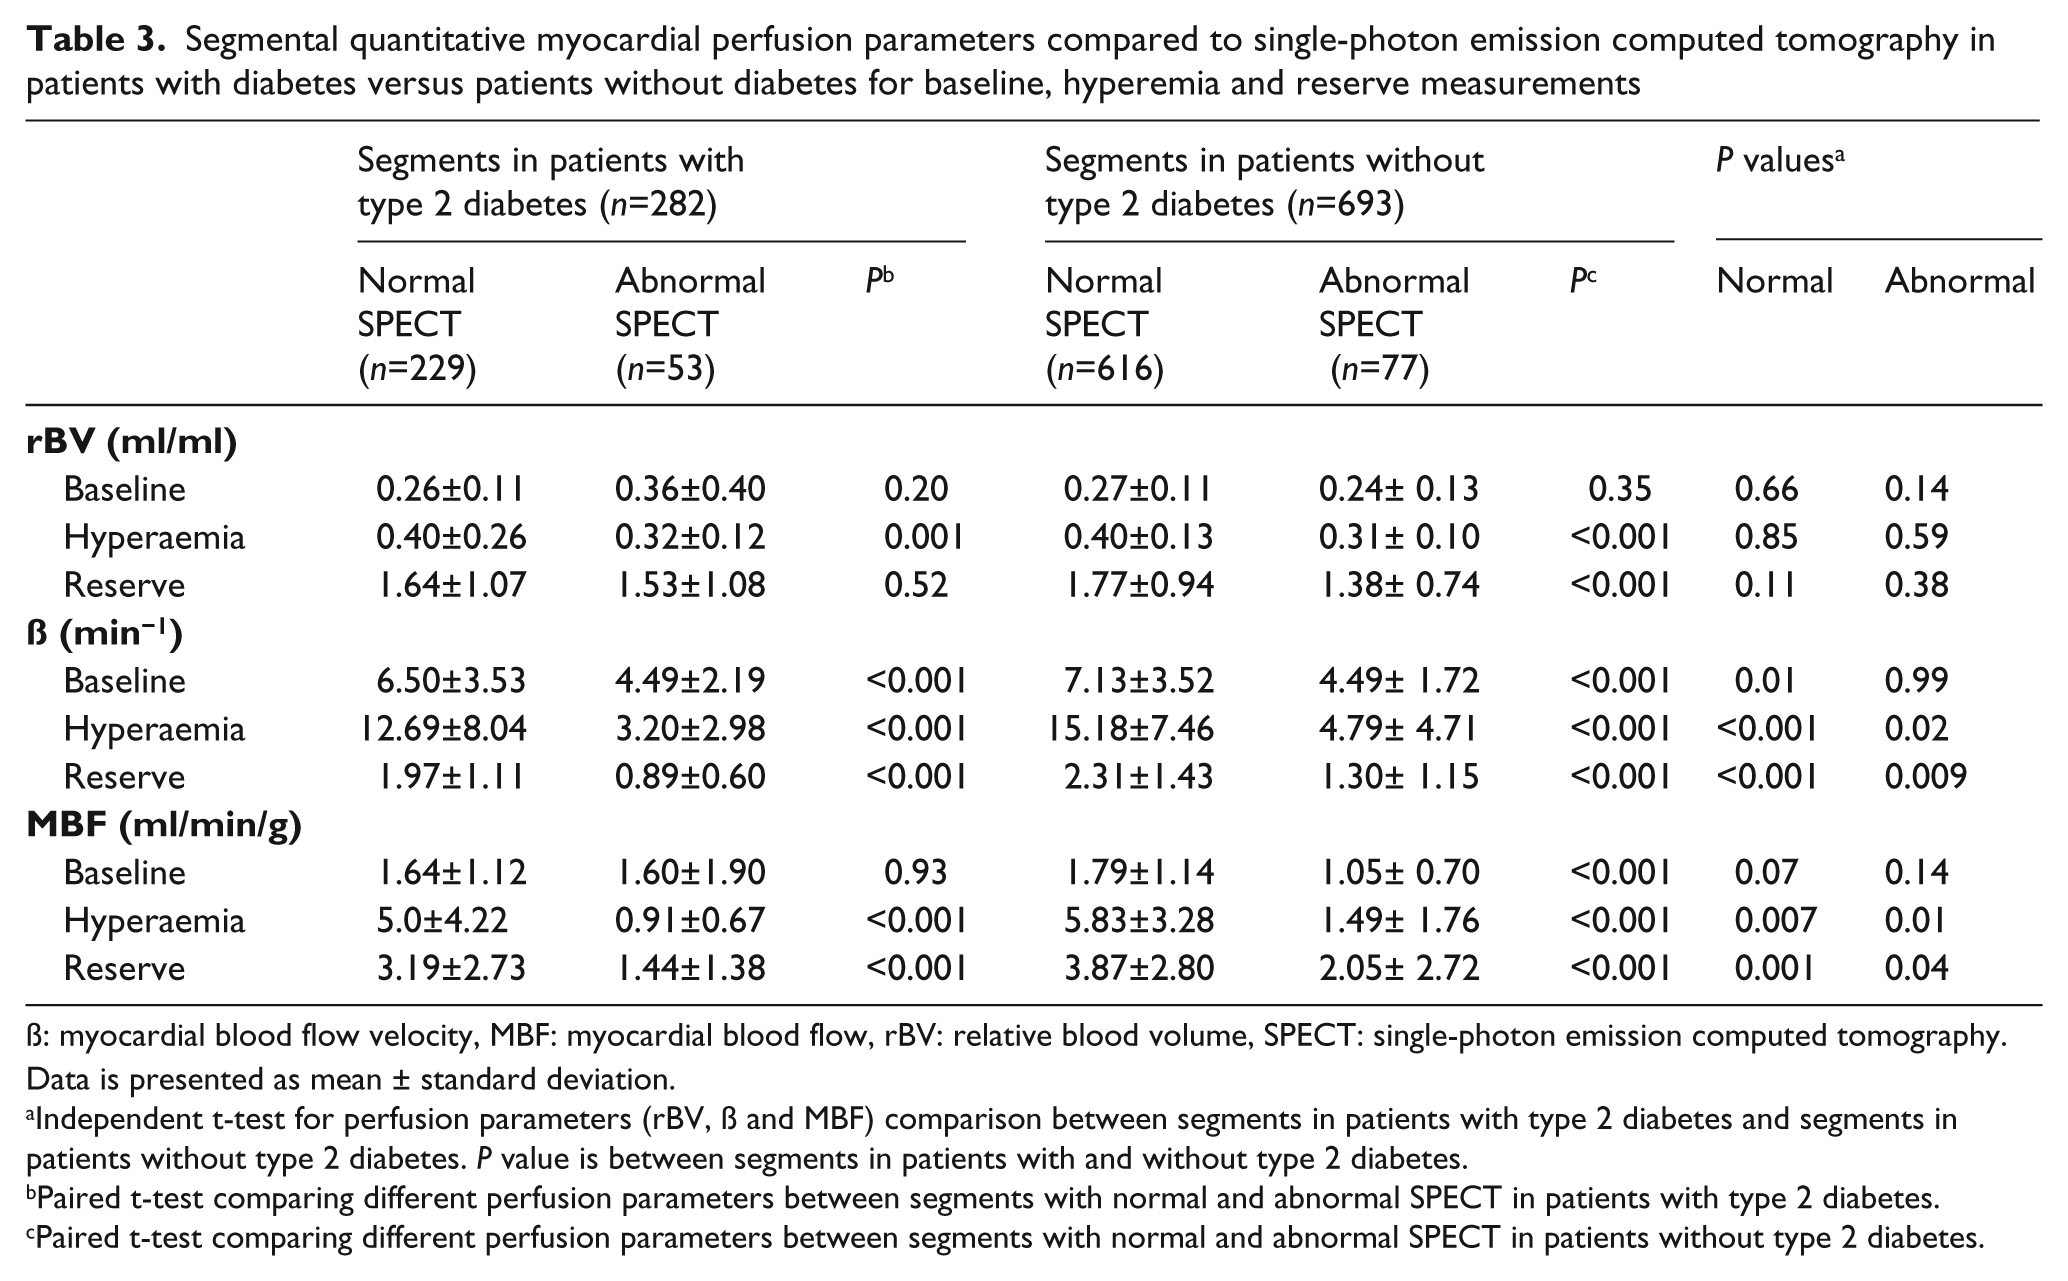
ß: myocardial blood flow velocity, MBF: myocardial blood flow, rBV: relative blood volume, SPECT: single-photon emission computed tomography.
Data is presented as mean ± standard deviation.
Independent t-test for perfusion parameters (rBV, ß and MBF) comparison between segments in patients with type 2 diabetes and segments in patients without type 2 diabetes. P value is between segments in patients with and without type 2 diabetes.
Paired t-test comparing different perfusion parameters between segments with normal and abnormal SPECT in patients with type 2 diabetes.
Paired t-test comparing different perfusion parameters between segments with normal and abnormal SPECT in patients without type 2 diabetes.
ROC curves
A ROC curve was constructed for reserve perfusion parameters in patients with diabetes. ROC curve analysis utilising reserve β and MBF but not rBV measurements provided an accurate method for the detection of abnormal myocardial perfusion by SPECT (Figure 2). Reserve β cut-off 1.6 provided sensitivity 81% (95% CI, 70–89; 43 of 53 segments), specificity 66% (95% CI, 64–68; 152 of 229 segments), and accuracy 69% (95% CI, 63–74; 195 of 282 segments); whereas reserve MBF cut-off 1.9 provided sensitivity 79% (95% CI, 68–88; 42 of 53 segments), specificity 63% (95% CI, 61–65; 145 of 229 segments), and accuracy 66% (95% CI, 60–72; 187 of 282 segments).
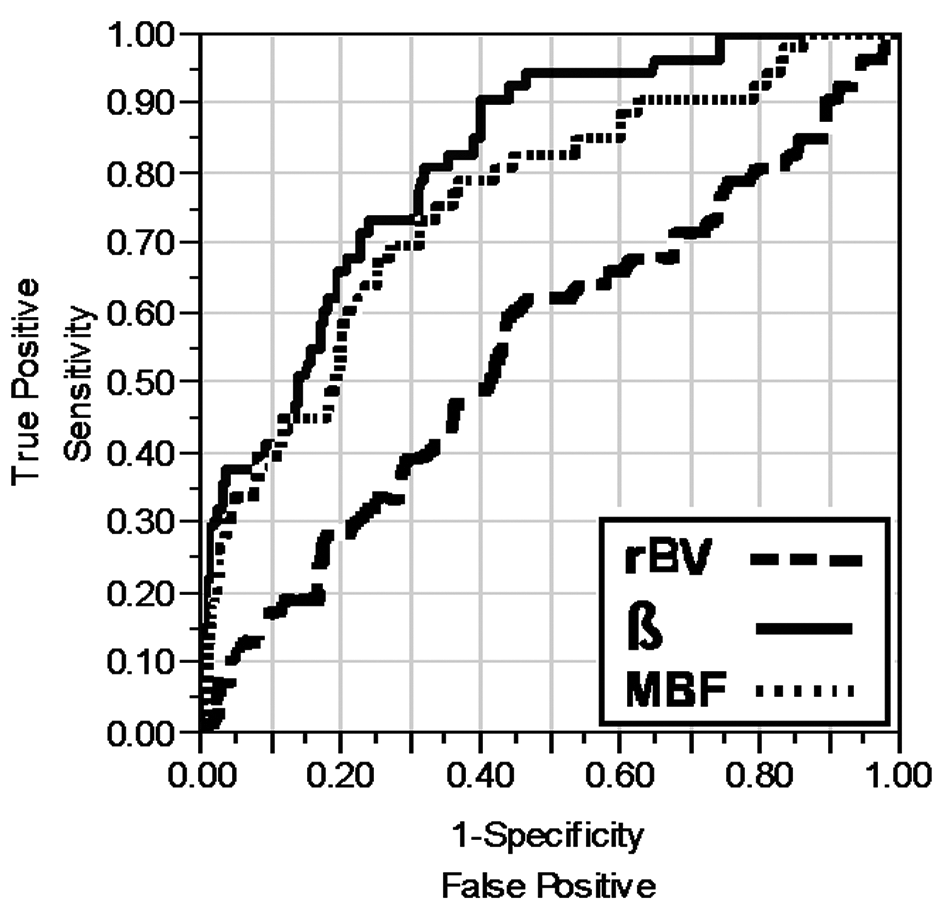
Receiver operating characteristic (ROC) curve. The area under the curve (AUC) is shown for reserve perfusion parameters for the detection of abnormal perfusion in myocardial segments by single-photon emission computed tomography (SPECT). The three parameters are relative myocardial blood volume (rBV), myocardial blood flow velocity (β), and myocardial blood flow (MBF). AUC values for the three parameters are: rBV, 0.554; β, 0.817; and MBF, 0.760.
Intra- and interobserver variability
For visual MCE analysis, the total agreement was 88%, kappa (SE) of 0.839 (0.11) for intraobserver variability and 81%, kappa (SE) of 0.611 (0.78) for interobserver variability. For intraobserver variability, the mean differences ± SE and r for rBV reserve, β reserve, and MBF reserve were, respectively, 5.85±0.81 (r=0.371, p<0.001), 1.34±0.04 (r=0.623, p<0.001), and 5.96±0.17 (r=0.544, p<0.001), while for interobserver variability they were, 4.26±0.61 (r=0.308, p<0.001), 0.57±0.05 (r=0.528, p<0.001), and 1.72±0.06 (r=0.528, p<0.001), respectively.
Discussion
The present study demonstrated that visual and quantitative real-time MCE techniques are feasible and accurate modalities for detecting myocardial perfusion abnormalities during adenosine stress. The detection of perfusion defects was possible using MCE in patients with diabetes with good agreement with SPECT and comparable accuracy to non-diabetic patients. Patients with diabetes were more likely to have perfusion defects compared to those without diabetes and this finding was still true after stratification of the results by the presence of abnormal perfusion on SPECT (reversible, fixed or mixed defects). In addition, patients with diabetes had impaired MCE-derived quantitative myocardial perfusion parameters compared to patients without diabetes.
Multiple factors contribute to diabetic myocardial disease including metabolic effects of increased free fatty acids oxidation, 16 myocardial damage and diastolic dysfunction from the effect of protein glycation, 17 autonomic dysfunction or cardiac neuropathy, 18 and finally, and most importantly, the potential contributions from myocardial microvascular disease. Changes in myocardial microvasculature in diabetic patients have been demonstrated by histopathological studies 19 and by invasive studies which have shown maximal coronary blood flow reserve and impaired endothelial-dependent epicardial coronary vasodilatation.2,20,21 Furthermore, non-invasive functional studies involving PET have shown significant impairment of MBF during dipyridamole stress in patients with diabetes. 4
In this study, we used a method to determine MCE-derived MBF in absolute units of blood volume per time in relation to myocardial mass (ml/min/g) which has been recently developed by Vogel and colleagues. 10 Absolute MBF has been validated against PET and quantitative coronary angiography in various patient populations10,11,22–24 and has also been shown to be a reproducible method.11,22 Using an animal model of diabetes, Cosyns and colleagues reported lower perfusion rates with diabetes compared to controls. 12 In addition, the histopathological findings demonstrated reduced density of myocardial capillaries in the group of diabetic rats. In agreement with the current study, Moir and colleagues reported impaired semiquantitative MCE-derived MBF reserve in patients with diabetes who had no evidence of coronary heart disease (CAD) on quantitative coronary angiography. 14 Hansen and colleagues reported impaired resting semiquantitative MCE-derived MBF. 13 In contrast, we did not identify a significant difference at rest; this can be explained by the different control groups which included healthy volunteers compared to patients referred for SPECT testing in the current study.
In patients with diabetes, we have shown that reserve β and MBF measurements allowed for the identification of abnormal perfusion defects. In addition, quantitative MCE parameters were impaired in patients with diabetes who had no perfusion abnormality on SPECT compared to patients with no diabetes. Although the cut-offs used in this study were similar to those used by Vogel and colleagues (β reserve cut-off 1.76 and absolute MBF reserve cut-off 1.94), we had a lower sensitivity and specificity than that reported by Vogel and colleagues. 11 This may be explained by the difference in protocol design and population studied, as well as the reference test used (SPECT versus coronary angiography).
Our study is limited by the absence of angiography to establish a diagnosis of epicardial CAD. Nevertheless, SPECT is an accurate method for the detection of perfusion defects and is considered the standard method for the evaluation of myocardial perfusion, although a negative SPECT test does not rule out CAD. Another limitation is the inclusion of patients with higher probability of CAD and ischaemia that were already referred for a stress SPECT testing who might not be representative of patients with diabetes seen in everyday practice.
We also acknowledge that MCE quantification of reserve parameters was not feasible in 27% of segments. This lower feasibility has been reported at the segmental level as a result of either failure of replenishment curve fitting or imaging artefacts and dropouts (frequently observed in the basal-mid anterior wall segments).The study strengths included the use of quantitative MCE which provides for a more objective evaluation of perfusion.
Conclusions
This is the first report that includes a systematic comparison of quantitative derived absolute MBF (ml/min/g) and visual real-time MCE with simultaneous adenosine Tc-99m–SPECT in diabetic and non-diabetic populations. In conclusion, patients with diabetes are more likely to have perfusion defects compared to patients without diabetes. We have also demonstrated that patients with diabetes and normal perfusion on SPECT have evidence of impaired myocardial perfusion by qualitative and quantitative MCE.
Future applications
Technology allowing for the early detection and intervention of vascular complications of type 2 DM has been evolving in both the clinical care and research arenas. With the advent of MCE comes the importance of early detection (screening) for microvascular complications in subjects with type 2 DM prior to clinical symptoms becoming apparent. In addition, quantitative measures by MCE used to assess microvascular function may be useful for monitoring therapeutic interventions in DM subjects.
Footnotes
Dr Sharon L. Mulvagh has received research grants from Lantheus Medical Imaging and Astellas Pharma US, Inc. All other authors have nothing to declare.
This study was supported by research funding from Astellas Pharma Inc. Adenosine (Adenoscan) was provided by Astellas Pharma Inc. (Deerfield, IL). Contrast agent (Definity) was provided as part of research grant by Lantheus Medical Imaging (North Billerica, MA).