
Abstract
After losing the 2020 presidential election, Donald Trump publicly asserted that the election was rigged due to voter fraud, and many voters also endorsed this conspiracy theory. This article examines American voters’ belief in election fraud during the 2022 midterm elections, with a particular focus on (1) the propensity of Democrats versus Republicans to believe in voter fraud and (2) the potential for voters to hide their endorsement of such conspiracy theory. For these purposes, we conducted a post-election online public opinion survey in which we asked respondents’ beliefs in voter fraud using both a direct question and a preregistered list experiment. Analysis of the survey data revealed that Republican respondents were far more likely than their Democratic counterparts to believe that election fraud influenced the election outcomes. We also found that the percentage of respondents believing in election fraud was significantly higher when estimated using the direct question method than when using the list experiment, which at least suggests that voters do not conceal their beliefs regarding election fraud out of social desirability concerns. We discuss the implications of this research for the broader literature on American political behavior and public opinion about conspiracy theories.
Introduction
A distinctive feature of the 2020 US presidential election was that one of the major candidates, Donald Trump, publicly denied the legitimacy of the election, asserting that the election was rigged due to intentional voter fraud by the Democrats. The majority of Republican voters also believed that voter fraud influenced the result of the election and considered Trump as the actual winner; according to a public opinion poll conducted by the Pew Research Center in January 2021, over 65% of the Republican respondents answered that Trump definitely or probably won the election, whereas only about 3% of their Democratic counterparts thought so. 1
In fact, belief in election fraud conspiracy theories among the American mass public is not new; scholars have empirically demonstrated that a substantial number of citizens consider that voter fraud was involved in the outcome of elections well before 2020 (e.g. Edelson et al., 2017; Enders et al., 2021; Udani and Kimball, 2017). Scholars have argued that individuals on the losing side are more likely to endorse such conspiracy theories (Miller et al., 2016; Sinclair et al., 2018; Smallpage et al., 2017) and that partisans are more likely to believe in conspiracy theories in which their political rivals are the alleged masterminds (Enders et al., 2022). 2
In this respect, the 2022 midterm elections offer an interesting case. While the Democratic Party retained its majority in the Senate, the Grand Old Party (GOP) gained seats and flipped the majority status in the House. Assuming that conspiracy theories are for political losers, it is reasonable to expect that Democrats and Republicans believe in election fraud at comparable rates, as each party suffered losses in either of the two chambers. On the contrary, it is also possible that Republicans would be more likely to endorse the election fraud conspiracy theory, given that the GOP obtained fewer legislative seats than anticipated. Prior to the election day, the Republican Party was forecasted to win both chambers, with a winning margin of approximately 25 in the House. 3 However, the GOP fell short of predictions in both chambers. Thus, we can also hypothesize that such a gap in expectation would lead to greater endorsement of voter fraud conspiracy theory among Republican voters.
Another related issue is whether individuals conceal their belief in conspiracy theories such as election fraud. Although previous studies of public belief in voter fraud have used survey items that directly ask whether respondents endorse such a conspiracy theory, Lantian et al. (2018) show that individuals generally view conspiracy theories as socially undesirable, suggesting that people may be inclined to conceal their belief in such rumors. However, while scholars have been interested in how to measure conspiracy theory beliefs using public opinion surveys (Clifford et al., 2019; Enders and Smallpage, 2018), only a small number of studies have examined whether people hide their belief in conspiracy theories in general or election fraud in particular. Smallpage et al. (2022) conducted survey experiments using the item count technique to demonstrate that people tend to underreport their belief in conspiracy theories due to concerns about social desirability across seven countries. While Smallpage et al.’s research offers strong (due to its research design) and generalizable (due to its cross-country comparison) evidence on this point, a recent study by Graham and Yair (2023) shows, through a series of survey experiments conducted after the US 2020 presidential election, that individuals who endorse Trump’s assertion that voter fraud affected the election result sincerely believe in the argument. Such mixed evidence from previous studies also leads to conflicting expectations as to whether US voters hide their belief that voter fraud was involved in the 2022 midterm elections; while we might expect individuals to underreport their endorsement of election fraud in light of studies focusing on the socially undesirable nature of conspiracy theories in general, we might also expect that people do not necessarily hide their beliefs in voter fraud, assuming that the pattern found by Graham and Yair (2023) continued in 2022.
The aim of this article is to empirically investigate these two puzzles. To this end, this article conducted an online public opinion survey with US voters after the 2022 US midterm elections, where both a direct question and a list experiment (LE) were used to probe whether respondents believed in election fraud. Analysis of the experimental data revealed that Republican respondents were far more likely to believe in election fraud than their Democratic counterparts. Moreover, we found no evidence of underreporting of their belief in voter fraud; in fact, the percentage of individuals who believed in the existence of election fraud was higher when estimated using the direct question data than when estimated using the LE data. The results of this article, based on the case of the 2022 midterm elections, provide insights into, and thus contribute to, the literature on American political behavior and public opinion on conspiracy theories by providing empirical evidence on who endorses the voter fraud conspiracy theory and whether individuals hide their belief in such rumors.
Data and Methods
The survey was conducted on 6–14 December 2022. 4 A total of 1839 individuals who were recruited from Dynata’s nonprobability respondent pool and passed simple attention checks completed the survey. To make our sample representative of the US electorate as a whole, we set quotas for gender (male or female), age (18–29, 30–39, 40–49, 50–59, or 60 and older), and census region (Northeast, Midwest, South, or West) based on the American Community Survey 2016–2020 five-year data. 5
In asking about belief in voter fraud in the 2022 midterm elections, we randomly divided respondents into three groups. 6 The first group of respondents (n = 613) was directly asked whether they agreed or disagreed that election fraud was involved in the outcome of the midterm elections. 7
To examine the degree to which respondents underreport their beliefs in election fraud due to social desirability concerns, the remaining respondents answered the question in a LE.
8
We use this approach because previous studies show that LEs effectively reduce biases in direct questions and enable more precise estimations of respondents’ opinions and behaviors about sensitive topics, where respondents might underreport or over-report their true feelings due to social desirability concerns (Blair and Imai, 2012; Gosen, 2014). A random half of those respondents were assigned to the control condition (n = 611), where they were asked to answer how many of the following statements applied to them: I have been bitten by a shark. I own a non-expired US passport. I did some online shopping in the past month.
To avoid the floor and ceiling effects, the list consists of statements that we expect to apply to approximately 0%, 50%, and 100% of the respondents, respectively (Glynn, 2013).
The remaining respondents were assigned to the treatment condition (n = 606), where the list consisted of the above three statements in addition to the following one about election fraud: I consider election fraud likely involved the outcome of the election held this November.
9
By comparing the response between the control and the treatment conditions, we can obtain an estimate of belief in voter fraud without concerns about social desirability bias.
We employ the regression technique proposed by Imai (2011) and Blair and Imai (2012) to analyze the data. Specifically, we use two indicator variables representing Democratic and Republican respondents as the key independent variables. 10 Following the standard practice in American political behavior, we regard Independents who lean toward either the Democratic or Republican party as partisans.
Results
To facilitate the interpretation of the analysis results, we computed the predicted probabilities of a belief in election fraud. Figure 1 illustrates the average predicted probabilities for all respondents (left column) and for those who identified as Democrats (middle column) and Republicans (right column). Solid dots in the figure represent the point estimates, with circles representing those based on the direct questioning (DQ) and triangles representing those based on the LE estimated using the least squares (LM). 11 The thin vertical bars represent the corresponding 95% confidence intervals. The thick bars are the 83.4% confidence intervals so that we can visually evaluate whether the estimates are statistically distinguishable (α = 0.05) from each other based on the overlap of the confidence intervals (Knol et al., 2011).
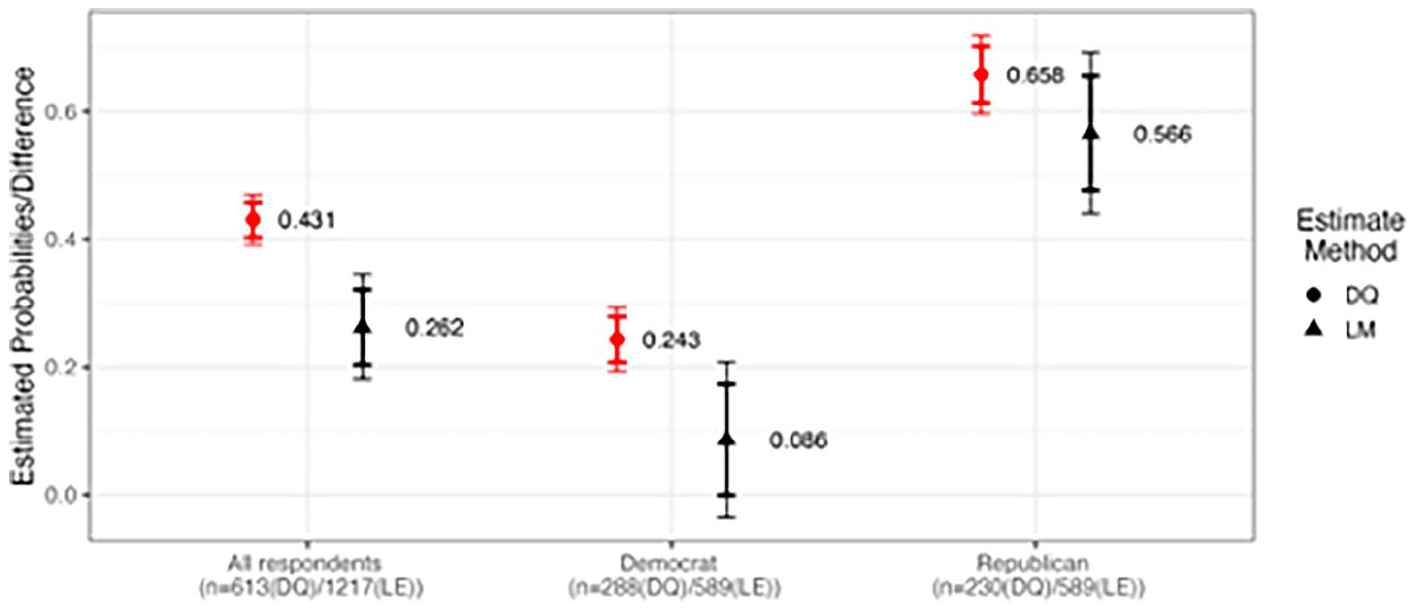
Estimated Proportions of Respondents Believing in Election Fraud.
Two things stand out from the figure. First, regardless of how we measured respondents’ belief in voter fraud, Republicans were far more likely than their Democratic counterparts to believe that election fraud was involved in the outcome of the 2022 midterm elections; about 57% (LE) or 66% (DQ) of Republican respondents were estimated to believe in election fraud, whereas only about 8.6% (LE) or 24% (DQ) of Democrats believed that voter fraud affected the election results. The finding that Republicans were substantially more likely to endorse voter fraud conspiracy theory in 2022 is consistent with the pattern found in other public opinion surveys, such as those conducted by the Bright Line Watch and the Yankelovich Center for Social Science Research, suggesting the external validity of our study. 12
Second, the proportions of individuals believing in election fraud were higher when estimated using the DQ than using the LE data. The estimates based on the DQ were larger than those based on the LE both for all respondents and for the partisan subsets, and the differences were statistically significant for all respondents and for the Democratic respondents (p < 0.05).
Discussion
These findings offer several important insights into the broader literature on American political behavior and public opinion about conspiracy theories. First, the fact that Republicans were far more likely to believe in election rigging suggests that the expectation gap between the pre-election forecasts and the actual election results influenced perceptions of election fraud. As addressed in the introduction, because the GOP gained fewer legislative seats than expected, we conjecture that Republicans were more likely to believe that voter fraud swayed the outcome of the 2022 midterm elections. Although this study cannot verify the validity of this mechanism or empirically investigate the alternative possibilities (e.g. conservatives inherently more prone to conspiracy theory) due to the lack of relevant data, our findings underscore the importance of considering voters’ interpretation of election results, beyond just the election outcomes themselves, when studying public endorsement of voter fraud conspiracy theory.
Second, and more importantly, the fact that our survey respondents did not underreport their belief in voter fraud—in fact, they seem to have over-reported it—indicates the continuation of the trend reported by Graham and Yair (2023). This pattern is contrary to that reported by Smallpage et al. (2022), a notable study on this topic, which found that conspiracy theories are considered socially undesirable and that people try to hide their endorsement of them. We speculate that this is because the conspiracy theory on election fraud is no longer a concern in terms of social desirability among US voters today. This may be attributable to numerous politicians, including Trump, openly endorsing the voter fraud conspiracy theory, such that citizens who believe in voter fraud no longer feel the need to hide their beliefs. Researchers studying public opinion on conspiracy theories should take such changes in social norms into account, because, even if conspiracy theories in general are considered as socially undesirable, certain types of conspiracy theories may become socially acceptable due to shifts in social norms.
Even if the voter fraud conspiracy theory is not the target of social desirability, it is still puzzling that respondents who believed in election fraud were estimated to be higher in the DQ than in the LE. Although this study cannot empirically determine why we observe such a pattern, we conjecture that it is not because voters find it socially desirable to report belief in voter fraud but because of the measurement issues of the DQ. Here, we take up two possibilities. 13 The first is the acquiescence-response bias. Hill and Roberts (2023) show that the DQ tends to overestimate the percentages of individuals endorsing conspiracy theories because of the tendency for survey respondents to agree with any given statement regardless of their true opinion (also see Clifford et al., 2019 on this point). The second possibility is that the presentation of the election fraud conspiracy theory itself may have led respondents to believe in the rumor. Clifford and Sullivan (2023) demonstrate in their panel survey analysis that the use of the DQ format in proving conspiracy theories increased the likelihood that respondents would endorse the corresponding rumors in the later survey wave. Given that previous studies have used the DQ to probe public endorsement of voter fraud conspiracy theories without paying much attention not only to biases due to social desirability concerns but also to biases inherent in the DQ format, future research should put more effort into resolving issues on the survey measurement.
We conclude the article by pointing out two limitations of this study. First, our use of an online survey with a convenience sample may have affected the results. Because it is difficult to reach marginalized individuals such as offline or illiterate respondents with online opt-in samples, the sample selection could have biased the results of this article. Future research should examine whether the same patterns emerge with probability samples and with different survey modes.
Second, because our focus was on comparing Democratic and Republican voters, we did not examine the within-party heterogeneity in belief in the election fraud conspiracy theory. This is particularly relevant for the GOP, as candidates supported by Trump, the most prominent figure to claim voter fraud in 2020, performed poorly in the midterm elections. 14 A recent study of COVID-19-related misinformation suggests that Trump supporters are more likely to endorse conspiracy theories, as people tend to follow the opinions of the elites they support (Uscinski et al., 2020). Although this study cannot examine heterogeneity among partisans, future research should focus more on this point.
Supplemental Material
sj-docx-1-psw-10.1177_14789299241270462 – Supplemental material for Partisanship, Social Desirability, and Belief in Election Fraud: Evidence from the 2022 US Midterm Elections
Supplemental material, sj-docx-1-psw-10.1177_14789299241270462 for Partisanship, Social Desirability, and Belief in Election Fraud: Evidence from the 2022 US Midterm Elections by Masaki Hata and Ikuma Ogura in Political Studies Review
Footnotes
Declaration of conflicting interests
The author(s) declared no potential conflicts of interest with respect to the research, authorship, and/or publication of this article.
Funding
The author(s) disclosed receipt of the following financial support for the research, authorship, and/or publication of this article: This work was supported by the Japan Society for the Promotion of Science Grant-in-aid KAKENHI (Grant Numbers 22H00598 and 22K20108) and the Co-creation of academic knowledge program.
Supplementary Information
Additional supplementary information may be found with the online version of this article.
Contents
A. Survey Question Wording B. Information on the Preregistration B.1. Preregistration Document B.2. Difference from the Preregistration C. Covariate Balance Checks D. Robustness Test of the Main Analysis Figure D.1. Results of Estimation Including Covariates E. Estimation Results Using Maximum Likelihood (ML) and Nonlinear Least Squares (NLS) Methods Figure E.1. Results of Estimation Using LE, ML, and NLS F. Comparison with a Probability-Based Public Opinion Survey Recently Conducted in the US Table E.1. Comparison of Original Data and WVS Sampling
Notes
Author Biographies
References
Supplementary Material
Please find the following supplemental material available below.
For Open Access articles published under a Creative Commons License, all supplemental material carries the same license as the article it is associated with.
For non-Open Access articles published, all supplemental material carries a non-exclusive license, and permission requests for re-use of supplemental material or any part of supplemental material shall be sent directly to the copyright owner as specified in the copyright notice associated with the article.