
Abstract
The Brexit cleavage continued to define politics in the 2019 general election. This posed a challenge for parties and voters on each side of the debate: how to coordinate in favour of their side in each seat. In this note, I examine the extent to which party (electoral pacts) and voter (tactical voting) coordination affected the outcome of the 2019 general election. On the voter side, I find that tactical voting was only slightly more prevalent than in previous election cycles. On the party side, I find that neither the Unite to Remain pact nor the Brexit Party’s withdrawal of candidates against incumbent Conservatives noticeably affected the results. Holding the structure of preferences in 2019 constant, Labour would probably have won a handful of additional seats in England and Wales (three on average but only one clear gain) by joining the Unite to Remain pact. The effect of the pact is limited because Labour successfully won over many Remain supporters from the other parties during the campaign. This meant that voters of the other Remain parties were only modestly more likely to prefer Labour over the Conservatives by the end of the campaign, and the pool of minor party voters was generally small in Labour’s target seats. The Liberal Democrats would have received around eight additional seats if Labour had joined the pact (again holding preferences constant).
The majoritarian electoral system in the UK has long created incentives for voters to tactically support a viable party in their local constituency rather than voting for the party they actually prefer. Studies of British voters have shown a modest but consistent proportion of the electorate reporting that they vote tactically (Alvarez et al., 2006; Evans et al., 1998; Fisher, 2006; Herrmann et al., 2016; Lanoue and Bowler, 1992), with similar numbers arising from studies looking at discrepancies between party preferences and actual vote choice.
The role of tactical choices was particularly relevant in the context of the 2019 UK general election, where the issue of the EU referendum was very important to voters, but multiple parties claimed to best represent either side of the division. It was therefore entirely possible for parties on one side of the referendum debate to receive more votes than the other side, but receive far fewer seats due to their votes being split between more parties. Indeed, this ultimately happened, with pro-European parties receiving 52% of votes but only 42% of seats.
This coordination problem can be addressed either through the choices of individual voters (tactical voting) or through the actions of the parties and their representatives (electoral pacts).
In this note I assess how much tactical voting took place and how much difference the two electoral pacts (Unite to Remain and the Brexit Party’s decision to stand down in Conservative-held seats) made to the result. I additionally assess how much difference it might have made for Labour to join the Unite to Remain pact.
I find little evidence that either of the pacts had a material impact on the result. The Unite to Remain pact mostly involved parties stepping down in constituencies where they had very little vote share to provide. I find that there are no constituencies where a Unite to Remain candidate won by a smaller margin than the combined 2017 shares of the parties that stood down. In the case of the Brexit Party, its supporters had defected to the Conservative Party at such high rates by the time of the election, that its pattern of standing candidates did not contribute much additional support to the Conservatives in seats where they were at risk of losing.
If Labour had joined the Unite to Remain pact, it would most likely have contributed around eight extra seats to the Liberal Democrats, with Labour gaining perhaps one to five additional seats. The limited effect for Labour is primarily because – by the end of campaign – the remaining Liberal Democrat, Green and Plaid Cymru (LD/GRN/PC) supporters were nearly as likely to prefer the Conservative Party to Labour as the other way around in the most marginal seats. Consequently, a pact would primarily have increased the share of both major parties in these seats. This marks a change from the start of the campaign, where Labour would have benefited considerably more from such a pact. However, by the end of the campaign many of these voters switched to Labour (for tactical and non-tactical reasons) even without a formal arrangement.
The overall levels of tactical voting appear similar to 2015 and 2017 after accounting for responses that can be attributed to parties not standing. While the volatile political situation could have created difficulties for voters to coordinate tactically, this ultimately did not pose a major challenge. On the Leave side, the Conservative Party dominated sufficiently that there was little coordination needed. On the pro-EU side, the parties were generally in the position of defending seats, which made the tactical choice for pro-EU voters clear (voting for the incumbent). However, the data do suggest that knowledge of the tactical situation beyond the winner is limited among British voters, so there is still substantial scope for coordination failures in British voting.
The analysis in this article focuses primarily on England and Wales, but also analyses the scope for a Liberal Democrat–Labour alliance in Scotland, finding that it might plausibly deliver a single extra seat to each party.
Overall, the evidence suggests that there was no easy way for the pro-EU parties or voters to improve the result through better coordination.
Factors Affecting the Success of Tactical Voting and Electoral Pacts
For voters to strategically choose another party, they have to be (1) willing to consider that other party and (2) know which party is the strategic choice.
Overlapping Preferences
I measure whether voters are willing to consider other parties on their side using the British Election Study questions asking respondents how likely it is that they would ever vote for each party (van der Eijk et al., 2006). If respondents give a party a score of 6 or higher, I count them as a potential supporter of that party. I look at the scope for tactical voting by looking at the percentage of each party’s vote intenders that would consider voting for each other party using data from the British Election Study Internet Panel (BESIP) pre-election wave.
In the pre-election wave, there was substantial willingness among voters to consider other parties in England and Wales. For voters who were intending to vote for the Conservatives, 40% give a high score to the Brexit Party. Similarly, 39% of Labour intenders were willing to consider the Liberal Democrats and 48% were willing to consider the Greens. This also ran in the other direction: Brexit Party voters were very willing to consider the Conservatives, and Green and Liberal Democrat voters were willing to consider Labour. While figures around 40% mean that there was high scope for tactical voting, it also means that the majority of each party’s intenders did not give high scores to other parties on their own side of the referendum debate.
Knowledge of the Tactical Situation
A second key requirement for tactical voting is knowing the tactical situation within a constituency. The most relevant information is which parties are first and second in the constituency. To topple an incumbent with tactical voting, voters have to coordinate around the most viable challenger. This therefore requires knowing the first and second party. However, for tactical voting to protect an incumbent, the voters generally only need to know the top party. This means that deeper tactical knowledge is required for the side that is winning new seats because voters on that side need to know the second placed party. For a side that is losing seats the voters only need to know the incumbent.
This assessment is not necessarily straightforward, because the answer depends on what other voters will do in each constituency. Just because a party was the best-placed challenger in the previous election does not mean that it is the best-placed challenger in the current election.
Voters could reasonably focus on past results, current polls, the media, or many other sources to assess which party has the best chance in each area. To look at what sources voters used, BESIP respondents were asked to place each party on a 0–100 scale according to how likely the party was to win in their constituency. Respondents were then asked a follow-up question about their reasons for believing the tactical situation to be that way. Figure 1 shows the top reasons (from a pre-defined list) given by respondents. The top response is the 2017 election result, followed by local election results. 1
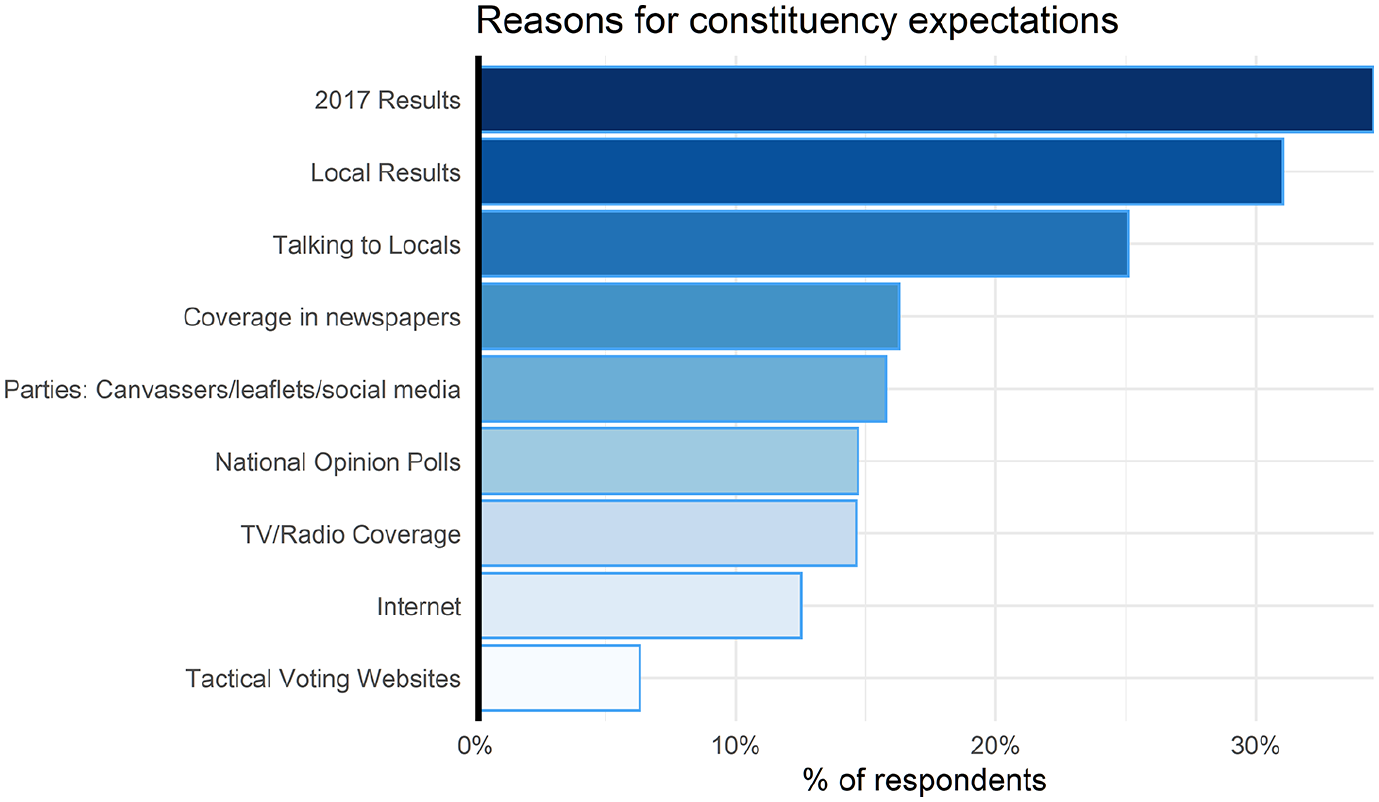
Information Sources for Expectations of Winners (2019 BESIP Campaign Wave in England and Wales).
Since the most common reason respondents give for their expectations is the previous election’s results, we tested whether respondents had this required knowledge. We asked respondents which party won their constituency in 2017 and which party came second. Figure 2 shows voters are generally pretty good at naming the winner in their constituency, with 75% of them being able to name the winner. However, they are nowhere near as good at naming the party that came second, with only 36% getting the correct answer. This makes it very difficult for challengers to coordinate around the best party to take on the incumbent because most voters do not know who the best challenger is.
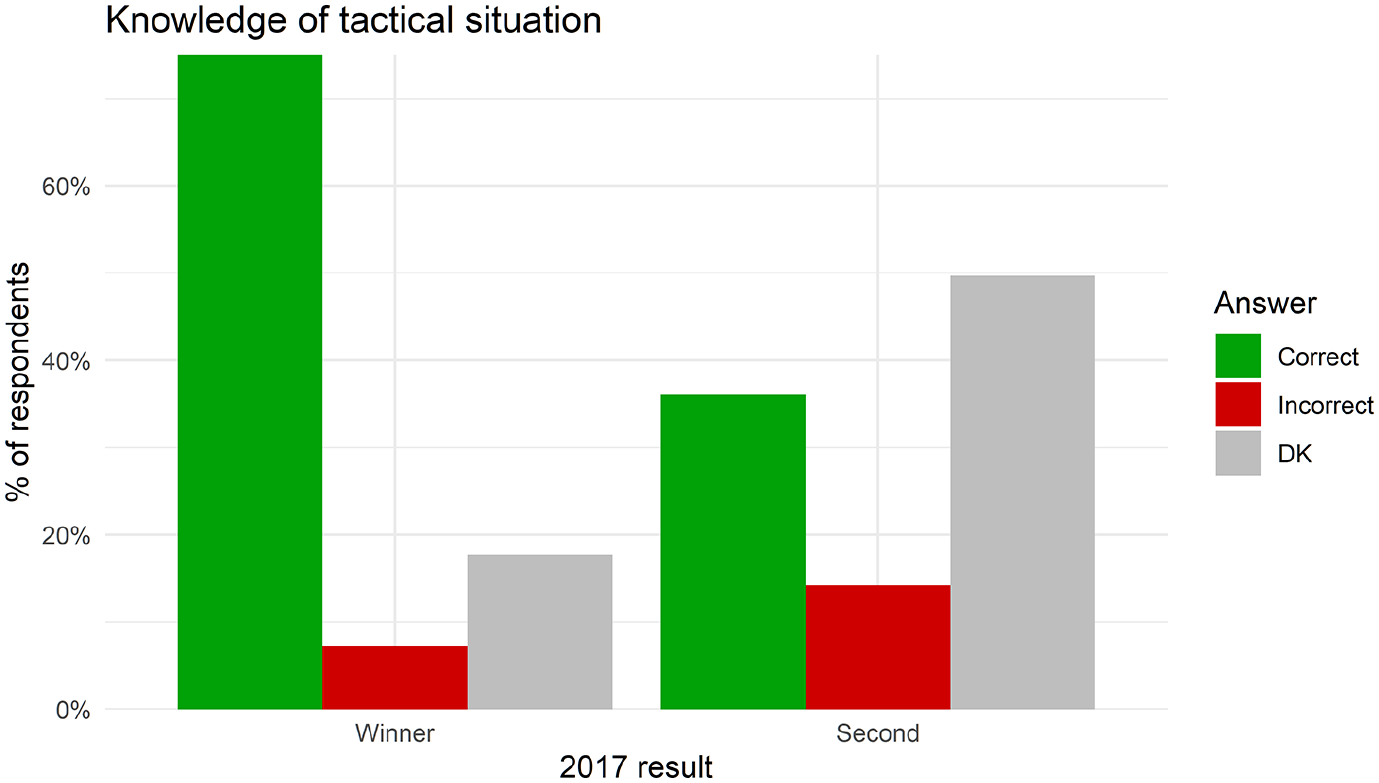
2019 BESIP Campaign Wave Respondents Able to Correctly Name the 2017 Winner and Second Place Party (England and Wales).
While knowledge of the second-placed party is low overall, it is most crucial that voters know the tactical situation in marginal seats. Figure 3 shows how knowledge of the top two parties varies according to the winning party’s margin of victory in 2017. Knowledge of the winning party does not vary substantially by marginality: around three-quarters of voters are consistently able to name the winner regardless of how close the result was. However, the knowledge of the second-placed party is much higher in marginal seats, where around half of voters are can name the correct party, compared with fewer than a quarter in the safest seats. Nonetheless, this level of knowledge poses a substantial barrier to coordination for parties hoping to challenge an incumbent.
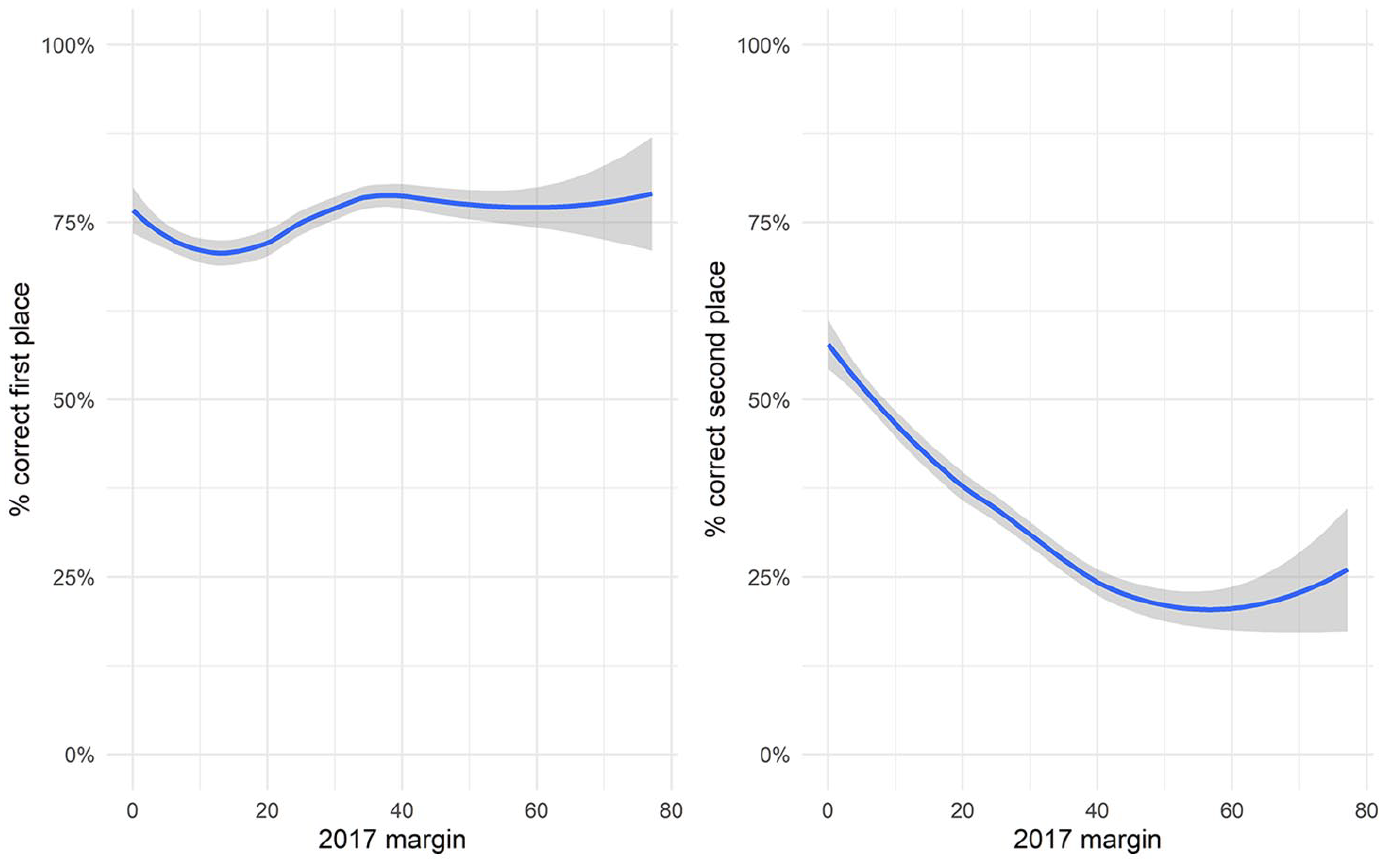
2019 BESIP Campaign Wave Respondents Able to Correctly Name the 2017 Winner and Second Place Party by 2017 Marginality (England and Wales).
Although the complete knowledge of the tactical situation was not high among BESIP respondents, this ultimately did not matter much to the 2019 result in England and Wales. On the Leave side, the Conservatives won a large share (75%) of voters compared with the Brexit Party (4%), so there was not much opportunity for tactical voting. On the Remain side, the parties ended up being in the position of defending seats from the Conservatives rather than taking seats. This meant that voters on the Remain side only had to know the incumbent (which most voters are able to identify correctly) rather than the most viable challenger.
How much Tactical Voting Took Place?
There are a number of different ways to measure the level of tactical voting. One method is with the British Election Study question asking for the reason the respondent voted the way they did. This method has been widely used in previous studies of tactical voting in the UK (Evans et al., 1998; Fisher, 2006; Fisher and Curtice, 2006; Heath and Evans, 1994), although there has been an ongoing debate about whether some voters who do not explicitly mention tactical reasons can still be identified as voting tactically through supplemental information about their preferences (Niemi et al., 1993).
The primary answer for tactical voting is: ‘I really preferred another party but it had no chance of winning in this constituency’. In addition, I added any open-ended responses containing the string fragments ‘strat’ or ‘tact’, as respondents sometimes report this separately. Using this item, self-reported tactical voting in England and Wales was 11% in 2019, up from 8% in 2017 and 8% in 2015 in the BESIP surveys. However, the 2019 figure is somewhat misleading because some voters gave the tactical voting response about parties that stood down in their constituency due to one of the two pacts. When I recode these respondents, only 10% self-report tactical voting. This is only marginally higher than the figures for 2015 and 2017. Overall, there is not a great deal of evidence that tactical voting was substantially higher in 2019 than in previous elections.
There was considerably higher self-reported tactical voting among those respondents who switched during the campaign. Forty-four percent of those respondents who switched from the Liberal Democrats to Labour over the course of the campaign reported that they voted tactically. This is higher than the 21% of Liberal Democrat–Labour switchers who reported their choice was tactical in 2017 but only slightly higher than the rate of tactical voting among Liberal Democrat–Labour switchers in 2015 (40%). However, this still suggests that the majority of switching to Labour that took place in the campaign was not driven by tactical considerations.
Self-reported tactical voting was much more common among Remain voters (16%) than Leave voters (7%) in 2019. This was a new development, as Leavers and Remainers were equally likely to report tactical voting in 2015 (both 8%) and 2017 (also 8% for both groups). This is reflected in high levels of self-reported of tactical voting for 2019 Labour (17%) and Liberal Democrat voters (18%), compared with the Conservatives (5%). Somewhat confusingly, 22% of Brexit Party voters also said they were voting tactically, with the vast majority of those (83%) reporting that they really preferred the Conservatives but did not believe they could win.
To get a sense of the effect that this switching (both tactical and otherwise) had on seat outcomes, I plot the net switching for each party in Figure 4 by each party’s distance from contention (English and Welsh seats only). Figure 4 shows that the effects of vote switching during the campaign were substantial on the vote margins of the parties.
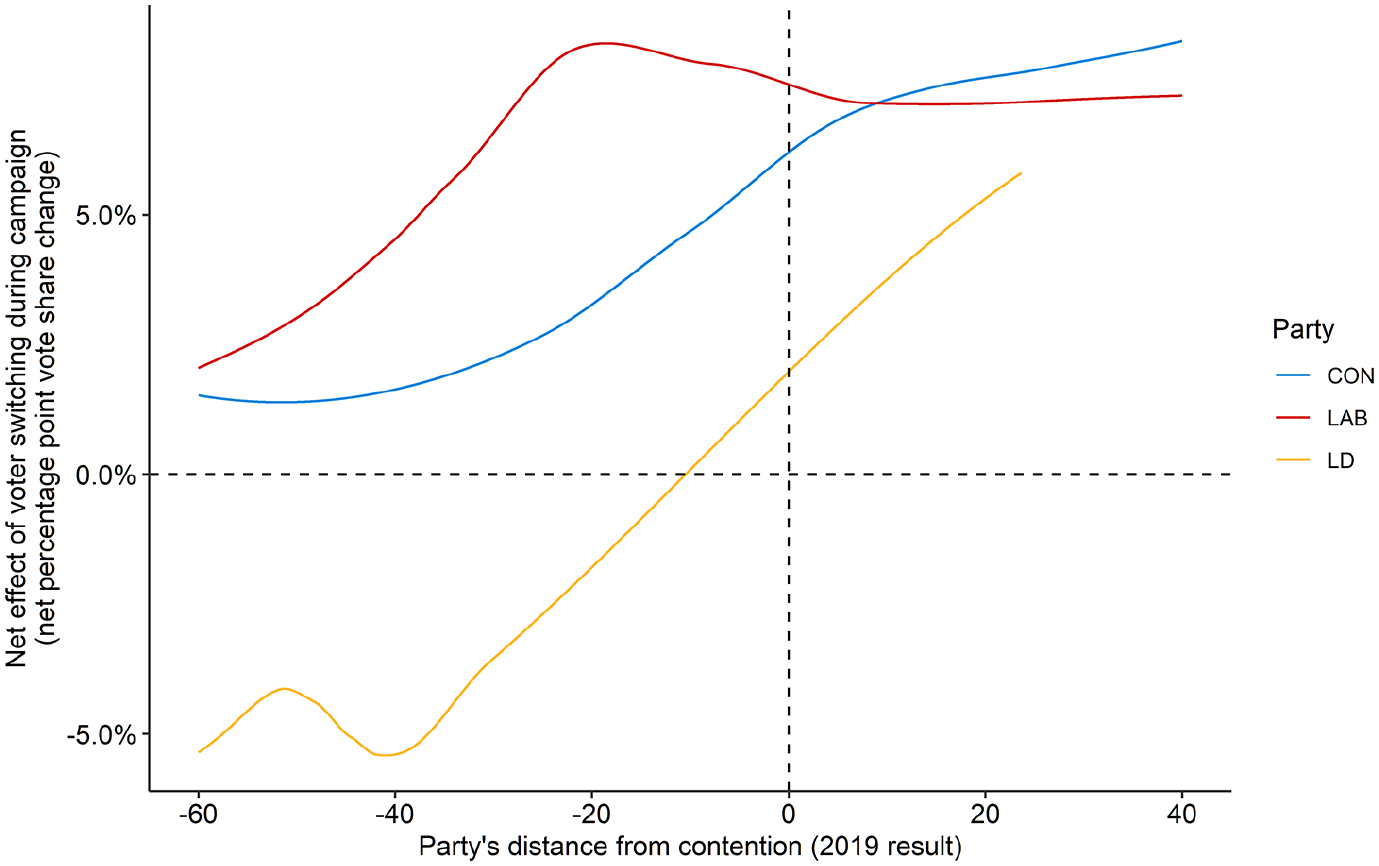
Net Vote Gains from Pre-Election to Post-Election Switching by BESIP Respondents by Each Party’s Distance from Contention in 2019. Gains and Losses Fitted using Loess Smoothers on Wave 17 and Wave 19 BESIP Respondents in England and Wales.
Net switching to Labour during the campaign was not strongly related to Labour’s distance from contention. In fact, Labour’s net gains in the campaign peaked in seats where they lost by 19 percentage points. This suggests that Labour’s improved performance during the campaign came from a general squeeze on the other Remain parties rather than a specifically tactical squeeze. Because Labour actually is the best-placed Remain party in most seats, the switch towards Labour was most often the tactically correct decision for the Remain side, even if the evidence above suggests many voters were not actually aware of the tactical situation in their own seat.
The Conservatives benefited the most from net switching in marginal seats and their own safe seats, with little net effect of campaign switching in seats where they were far from contention.
There is much more evidence of a tactical squeeze for the Liberal Democrats. The Liberal Democrats lost net vote share due to campaign switching in seats where they ended up more than 10 percentage points behind the winner but gained in seats where they won or only narrowly lost, although these gains were modest on average (the gains from campaign switching are never more than 6 percentage points).
It is difficult to attribute exact seat counts to tactical voting, because of the large number of undecided voters in earlier periods, and the local variation in tactical success that these averages mask. However, it is clear from this analysis that campaign switching substantially increased the efficiency of the Liberal Democrat vote (they had net losses nationally but net gains in their most promising seat targets), while lifting the Conservative and Labour vote shares in most areas.
How much Difference Did Electoral Pacts Make to the Outcome?
The Unite to Remain pact covered 60 constituencies in England and Wales, where the LD/GRN/PC agreed to step down their candidates in favour of the best-placed option. The Unite to Remain candidate won in only nine of these seats. In five of these cases, none of the other pact members ran a candidate in 2017. None of the remaining four seats was won by a smaller margin than the share that the other pact members received in 2017. The closest the pact came to making a difference was Plaid Cymru’s Carmarthen East and Dinefwr, which they won by 4.4 percentage points where the Liberal Democrats had received 2.2% of the vote in 2017. The number of pre-election Unite to Remain intenders is too small to analyse separately in the pact seats; however, the analysis in Figure 5 shows that supporters of the parties in the pact were willing to consider voting for the other parties, although not by an overwhelming margin.
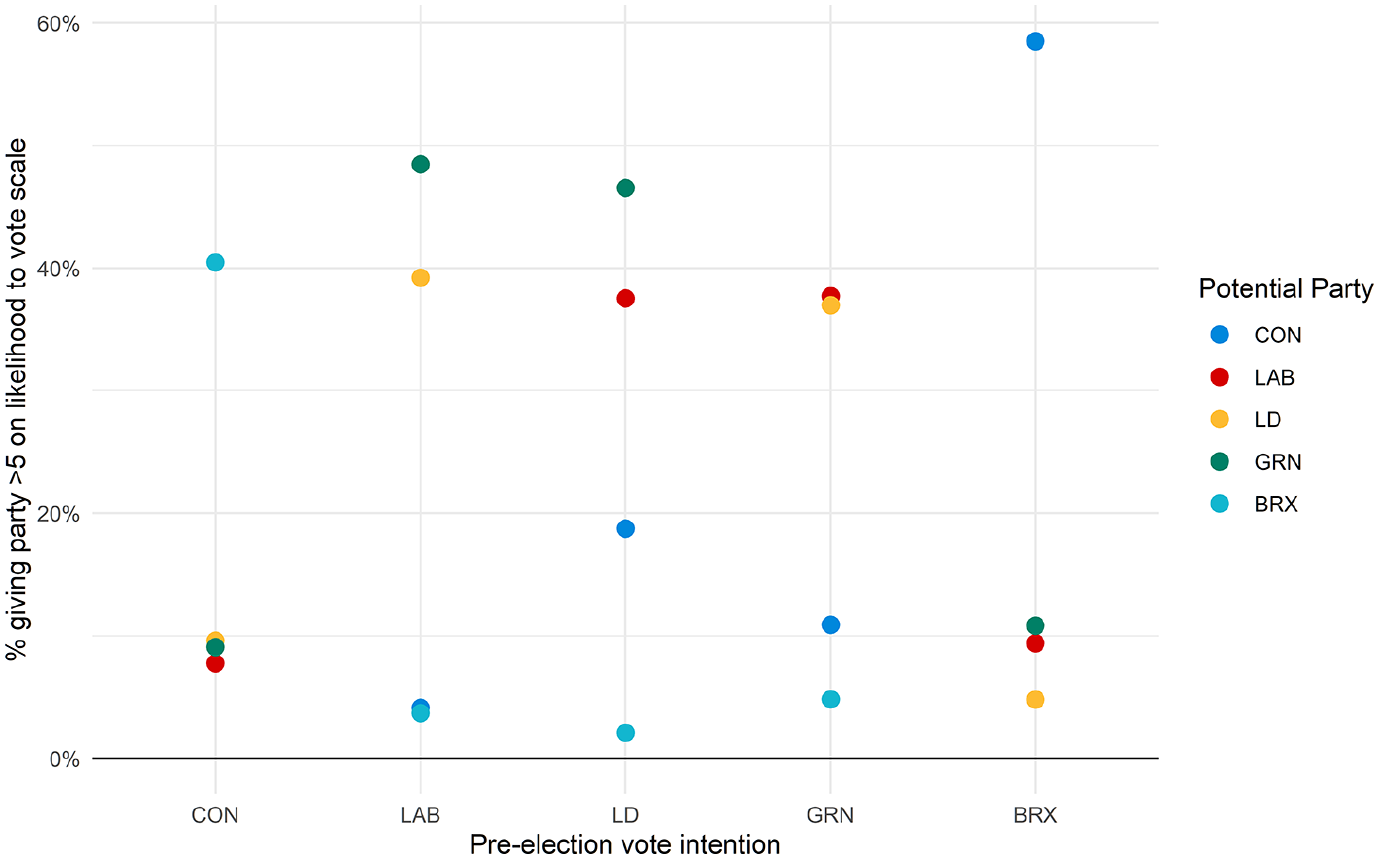
Pre-Election Willingness to Consider Other Parties (English and Welsh BESIP Respondents in Pre-Election Wave 17).
While the Leave parties did not agree to a formal pact, the Brexit Party unilaterally chose not to stand candidates against incumbent Conservative MPs. It is somewhat hard to assess how much difference this made because respondents who had intended to vote for the Brexit Party defected at high rates across the board (68% ultimately voted for the Conservatives). Figure 6 shows the average Conservative-Labour lead by constituency among respondents who had intended to vote for the Brexit Party in the BESIP pre-election wave according to the 2017 Conservative margin of victory/distance from winning. Since the Brexit Party uniformly stood down against Conservative incumbents, this provides a discontinuity. Unfortunately, this is not causally identified for two reasons: first, the Brexit Party subsequently stood down candidates in a number of Conservative target seats and, second, the discontinuity also perfectly lines up with Conservative Party incumbency, which might be expected to have a separate causal effect. Nonetheless, the regression discontinuity design (RDD) estimate still provides a useful descriptive summary of the difference between similar seats where the Brexit Party stood or not. The RDD estimate shows a 19 percentage point effect of the Brexit Party standing down on the Conservative-Labour lead among those voters. However, this estimate is not statistically significant.
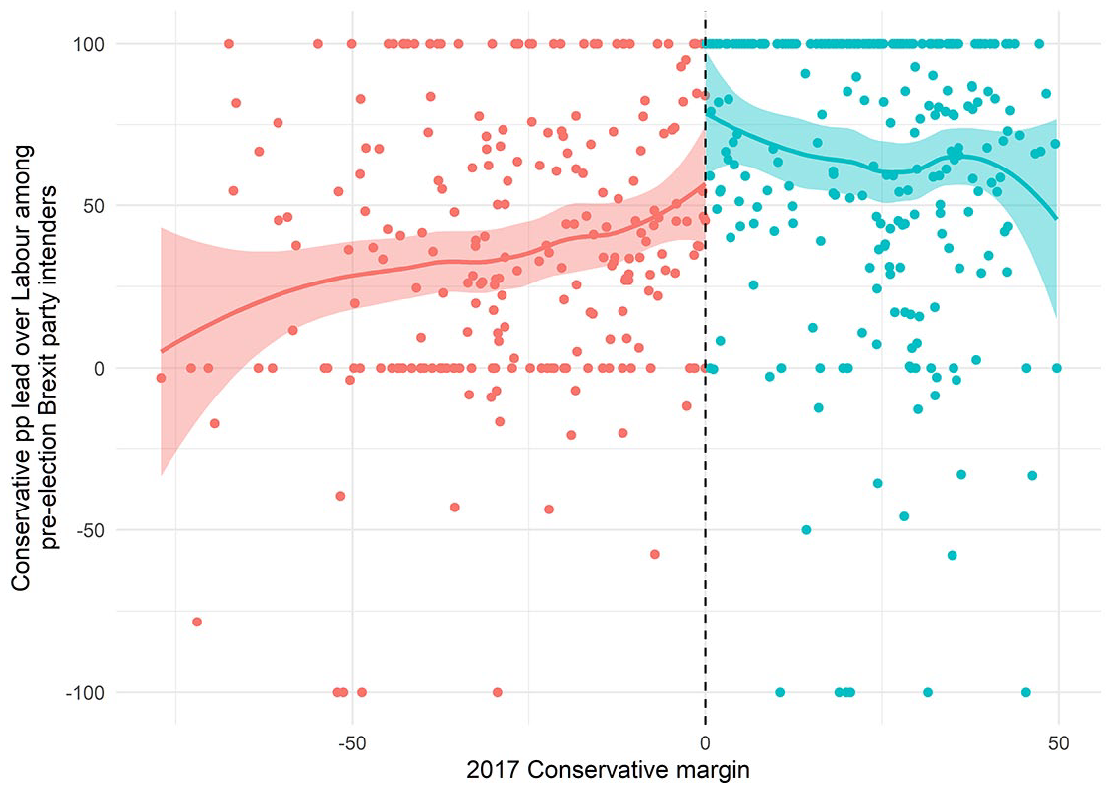
Regression Discontinuity of the Conservative-Labour Lead in Post-Election Vote Choices among Pre-Election Brexit Party Intenders.
Multiplying this 19 point effect (which again is highly uncertain) by the Brexit Party’s pre-election vote share in the BESIP data gives an average boost to the Conservatives of 1.4 percentage points (with very high levels of uncertainty). Because the Conservatives generally improved their position in 2019, this does not have much effect on seat outcomes (since Conservative-held seats generally got safer even without Brexit Party leader Nigel Farage’s assistance). Ironically, the places where the Brexit Party’s decision may have helped are in Remain-leaning seats that swung away from the Conservatives in 2019. The data suggest that Wimbledon, where the Conservatives only beat the Liberal Democrats by 1.2 percentage points, is a possible seat where this could have made a difference. 2
Although the data is noisy, the evidence, on balance, is that the Brexit Party pact had little or no impact given the high rate at which their voters defected to the Conservatives anyway, and the fact that Conservative incumbents mostly improved their standing.
Would a Remain Pact Including Labour Have Benefited Labour and the Anti-Brexit Side?
While the existing Unite to Remain pact seems unlikely to have changed the 2019 result, many commentators suggested (mostly prior to the election) that a Remain alliance including Labour could win the election (Guardian, 2019; Williams, 2019). Prior to the 2019 election, John Curtice (2019) pointed to the substantial potential for a Remain pact including Labour (up to 50 seats).
To test this proposition, I simulate the effects of Labour, the Liberal Democrats, Greens, and Plaid Cymru agreeing to only have the best-placed party field a candidate across English and Welsh seats. To estimate the best-case scenario for such a pact, I use the actual 2019 results to estimate which party was best placed in each constituency. In practice, there were substantially differing claims about which party was best placed in each constituency during the campaign, so this simulation represents an upper bound on the effectiveness of a Remain pact given the existing preference structure.
For respondents who voted for a party that would no longer have stood in their constituency, I estimate which remaining party they would be most likely to vote for using 0–10 like scores for each party from the campaign wave of BESIP. If the voter gave a zero to all other parties, 3 I assume that they would have chosen not to vote. Where two or more parties are tied for second place, I randomly assign one of the two parties as the second choice.
Labour would have been the best-placed pro-European party in 481 seats. In these seats, the second preferences of LD/GRN/PC party voters would have been moderately in favour of Labour with 51% supporting them to 37% supporting the Conservatives. This means that the net effect of a Remain alliance on Labour’s vote share in these seats would likely be positive but small. The Liberal Democrats would be the best-placed pro-European party in 87 seats. In these seats, 72% of Labour, Plaid Cymru and Green voters would have supported the Liberal Democrats. Applying these proportions to the actual 2019 vote shares in England and Wales gains Labour an average of three seats and increases the Liberal Democrats’ seats by 8. However, two additional seats are almost exactly tied, so Labour could gain as many as five seats.
However, this assumes these proportions are constant across all seats. In fact, the second preferences of LD/GRN/PC voters vary by marginality (see Figure 7). In the most marginal seats, Labour’s lead over the Conservatives in second preferences of LD/GRN/PC voters falls to 10 percentage points, reducing the expected seat gains to 2. The effectiveness of the pact would fall further still if I put a minimum threshold on the second preference-like score (currently anything above a 0 is potentially counted). The only clear seat gain on these numbers would be Kensington where the Liberal Democrats and Greens won a combined 22.5% of the vote and Labour lost by just 0.3 percentage points. Even a lead of 2 percentage points over the Conservatives among Liberal Democrat/Green voters would be sufficient to tip the seat in Labour’s favour. However, even this should be interpreted cautiously, as this analysis relies on national averages that will not perfectly apply to any individual seat.
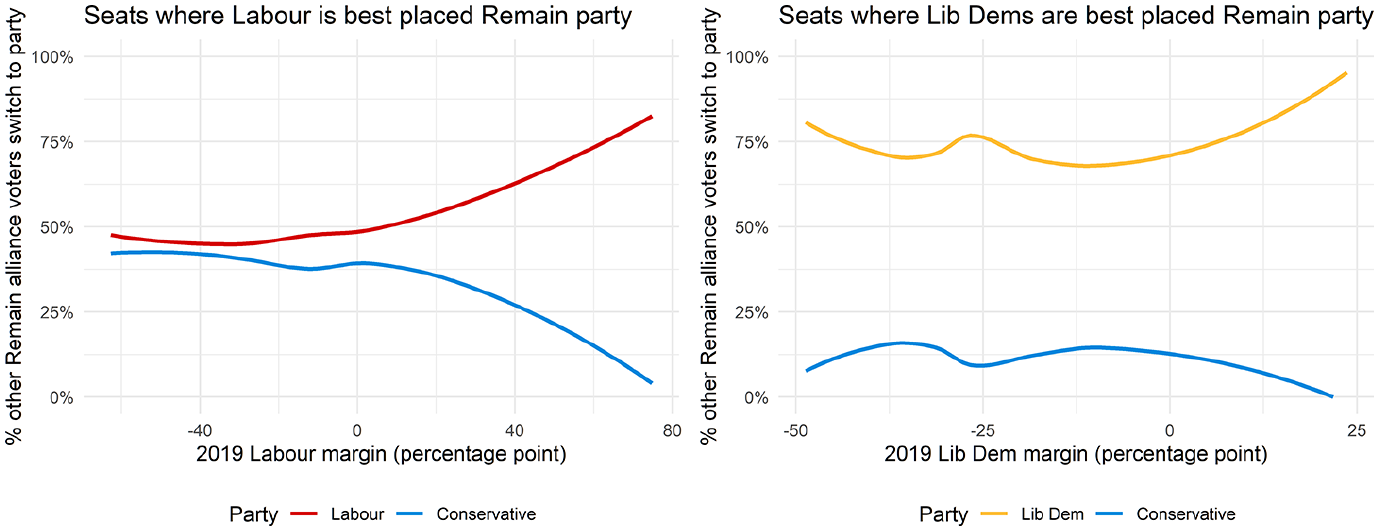
Preferences of Other Hypothetical Remain Pact Voters by Seat Marginality (England and Wales).
There is essentially no marginality effect for the Liberal Democrats (or possibly even one which favours them in closer seats), so a net gain of eight seats still seems plausible.
Overall, a Remain alliance would have put Labour marginally closer to government by reducing the Conservative seat total in England and Wales. However, this would come at the expense of giving a rival party the undisputed claim to be the most viable challenger in 87 seats, which might be tactically disadvantageous in future elections.
One temptation would be to recommend that Labour simply make a very narrow pact focussed on just a handful of very marginal seats such as Kensington. However, in a future election where Labour are a few percentage points up or down on their 2019 performance, it is unlikely that the same seats will be close enough for a pact to matter, so it would be difficult to form a narrow pact with any effect at all.
Why does this analysis give such a different picture to the more hopeful pre-election claims about the power of a Remain alliance? We can answer this by repeating the analysis for the pre-election wave of the British Election Study. When we use the pre-election vote intentions, a pact would give Labour a 36 percentage point lead over the Conservatives among voters from the pact parties. What changed during the campaign is that many (52%) LD/GRN/PC party voters who had Labour as a second preference switched to Labour even in the absence of a pact (in line with the campaign shift to Labour in Figure 4), reducing the value that such a pact would add. By contrast, only a small proportion of LD/GRN/PC voters whose pre-election second preference was Conservative switched to them (16%).
What about Scotland?
The analysis so far has been restricted to England and Wales, given the different dynamics of political competition in Scotland. In particular, it is unlikely that the Scottish Green Party or Scottish National Party (SNP) would join any alliance with the pro-Union Liberal Democrats and Labour. While a full analysis of the structure of Scottish preferences is beyond the scope of this research note, it is worth noting that the opportunities for a Liberal Democrat/Labour alliance in Scotland (probably the only politically feasible alliance) were fairly limited in 2019 even assuming ideal conditions.
In seats where Labour was better placed than the Liberal Democrats, BESIP respondents rated Labour an average of 3 out of 10 on the like scale in the post-election wave. This is higher than the scores for the Conservatives (2.5) and the SNP (2.1), but not dramatically so. Labour could perhaps hope to capture Kirkcaldy and Cowdenbeath (2.6 percentage points behind the SNP with the Liberal Democrats on 6.2%) with pact-based Liberal Democrat support. They could also technically capture East Lothian, but this seems unlikely, given that they finished 6.6 percentage points behind the SNP and the Liberal Democrats only received 7% of the vote.
In seats where the Liberal Democrats were better placed, Labour voters gave the Liberal Democrats a 4.1 out of 10 on average, although they were also positive towards the SNP (3.2) but not the Conservatives (1.3). Given this structure of support, the Liberal Democrats would probably have been able to hold onto Jo Swinson’s seat in East Dunbartonshire with just a small fraction of Labour voters (she lost by 0.3 percentage points, while Labour received 9.1% of the vote). However, the next nearest Liberal Democrat loss (Ross, Skye and Lochaber) was nowhere near contention, even if all Labour voters had switched, as the Liberal Democrats lost by 23.7 percentage points and Labour only received 6.1% of the vote.
In total, a Liberal Democrat–Labour pact in Scotland would have most likely gained each party a single additional seat from the SNP.
Conclusion
While the role of tactical voting and electoral pacts was widely discussed in 2019, the evidence suggests they were only about as important as in other recent elections. Given the high knowledge and motivation required for voters to tactically vote effectively, its effects are likely to be particularly limited when voters must respond to novel tactical situations.
The Labour Party attracted the most persuadable Remain voters during the campaign even without a formal pact. This campaign switching was not efficiently distributed, but it did benefit Labour’s position in many seats. It also meant that the remaining LD/GRN/PC voters in Labour’s target seats only modestly leant towards Labour, limiting the potential benefit of a formal pact.
In all of these analyses, it is important to note that I am analysing the structure of preferences as it actually existed in 2019. In a world where pacts were actually made, the images of the parties would likely shift. This might, for instance, mean that Labour would be seen more positively by the Liberal Democrats who did not switch to them during the campaign, or even by Remain voters more generally. However, it also might mean that Liberal Democrats competing in Conservative marginals might struggle to differentiate themselves from the Labour Party and lose votes. While this analysis provides a good starting point for thinking about the tactical situation facing the parties, party strategists would need to consider second-order effects that cannot be captured here.
This analysis does not necessarily rule out the possibility that pacts could be effective in future elections. If Labour were a sufficiently popular second choice among Remain-leaning parties’ supporters, such a pact could become advantageous, particularly if voters were confused about the tactical situation. However, the main opposition party is likely to always remain sceptical of handing over the role of opposition in a large number of seats around the country.
Footnotes
Declaration of conflicting interests
The author(s) declared no potential conflicts of interest with respect to the research, authorship and/or publication of this article.
Funding
The author(s) disclosed receipt of the following financial support for the research, authorship and/or publication of this article: This work was conducted as part of the research for the British Election Study which is funded by the Economic and Social Research Council: 2019-2023 grant (ES/S015671/1), 2016 referendum grant (ES/P001734/1), 2015 grant (ES/K005294/1) and 2014 Scottish referendum grant (ES/L005166/1).