
Abstract
How do new party systems evolve over time? This article argues that party system evolution requires the solution of coordination problems that voters face in early elections; this happens through a learning mechanism. Elections reveal information to voters, who update their beliefs about party viability and the distribution of voters’ preferences and adjust their behaviour. The institutional setting, however, strongly conditions the pace of learning. Restrictive electoral systems (single-member district) accelerate learning through the harsh penalties they impose on miscoordination, while permissive ones (proportional representation) prolong it. Testing the argument on a district-level dataset in new democracies provides ample support; voters learn to cast fewer wasted votes over time and this happens faster in single-member district systems. The findings point to a trade-off between consolidation and representation; while party system evolution is facilitated by restrictive electoral systems, the presence of distinct social groups in the political arena is better served by permissive ones.
With the expansion of democratic regimes since the end of the Second World War, millions of people were called to participate in a previously unknown procedure to them, elections. The lack of experience with elections has profound effects on voting decisions and may lead to coordination problems. Figure 1 illustrates such a coordination failure, looking at the mean wasted votes levels over five consecutive elections in new and old democracies. 1 Two things stand out: first, wasted votes are much higher in new democracies; second, while wasted votes remain stable in old democracies, they decline in new ones. Why do we observe such drastic changes in wasted votes in new democracies? What explains the significant variation in the rate of changes in wasted votes over time? This article addresses these questions, examining the evolution of new party systems through the lens of voter behaviour, proposing an institutional theory of learning.
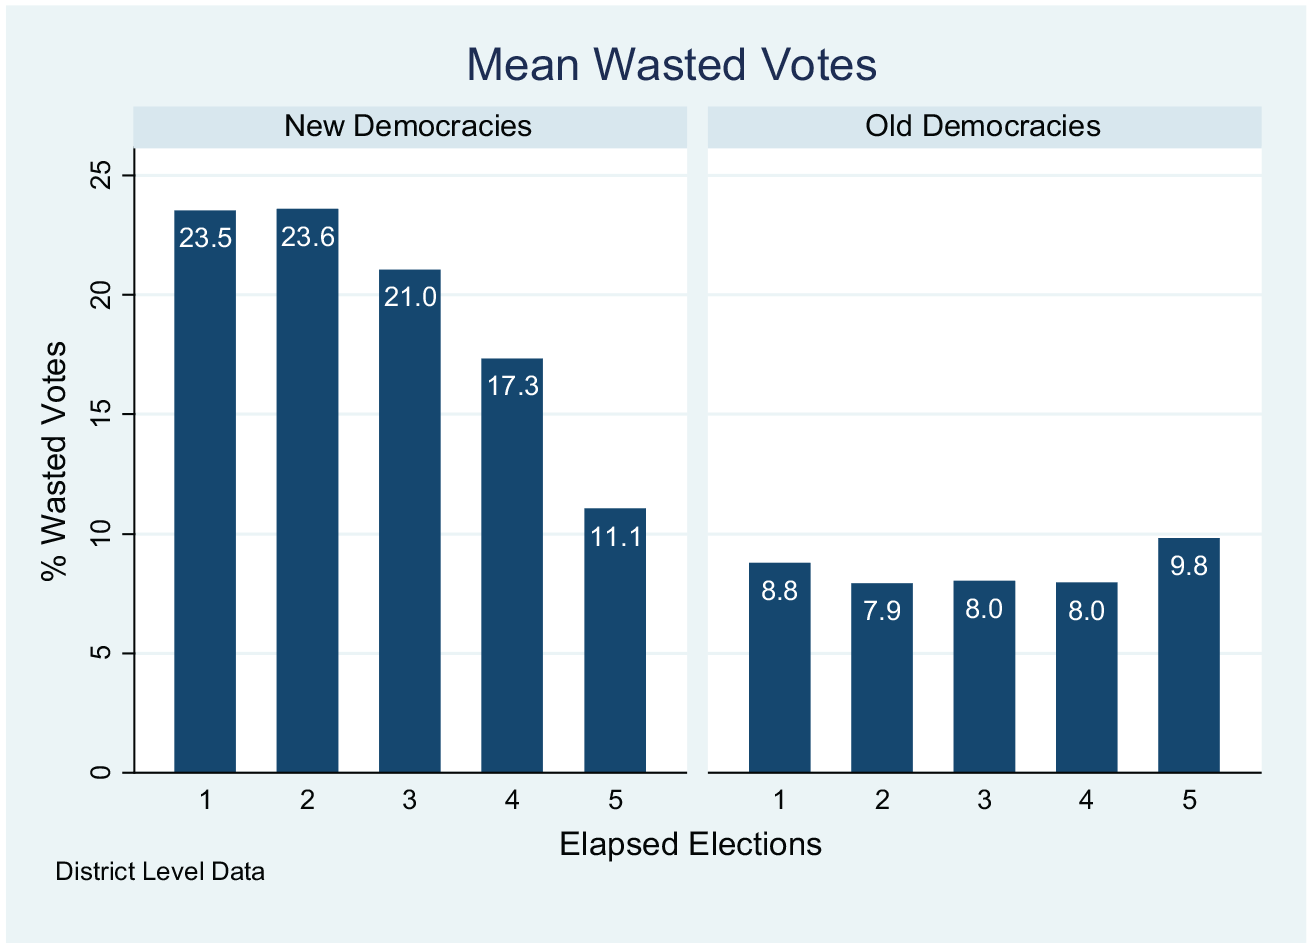
Wasted votes in transitional and established democracies.
The recent experiences with democratization in Eastern Europe and other regions of the world have shown that the consolidation of new party systems is neither automatic nor ubiquitous (Bielasiak, 2002; Birch, 2003; Mainwaring and Zoco, 2007). Among the most important factors for party system evolution is the information available to parties and voters. Significant information scarcities exist; typically, in the early elections of new democracies, voters do not know what parties stand for or how much support they have. Parties on the other hand have little information about voter preferences; on top of this, neither parties nor voters have a clear understanding of how the electoral system functions or how it conditions the strategic environment in which elections take place.
Given these information scarcities, voter behaviour is severely hindered in early elections; among other things, new party systems are characterized by extreme volatility (Bielasiak, 2002; Birch, 2003; Kuenzi and Lambright, 2001; Roberts and Wibbels, 1999), high numbers of parties (Filippov et al., 1999; Golder and Wantchekon, 2004) and frequent electoral law changes. However, while scholars have paid attention to this issue (Bernhard and Karakoç, 2011; Crisp et al., 2012; Lago and Martínez i Coma, 2012; Mishler and Rose, 2007; Raymond et al., 2016; Reich, 2004; Riera, 2013; Selb, 2012; Tavits, 2005; Tavits and Annus, 2006), we do not have a clear understanding of the duration and the causes of these characteristics.
This article proposes an account that can explain divergent paths towards party system consolidation. It argues that for party system evolution to take place, voters have to go through a learning period; several elections may be necessary to gather the necessary information and experience that allows them to optimize their strategic behaviour. Crucially, the pace of learning depends on the electoral system; restrictive ones force voters to update their behaviour faster than permissive electoral settings and facilitate party system evolution.
Using a relatively neglected dependent variable for measuring party system evolution, wasted votes, and a district-level dataset, the article finds support for argument. Voters go through a learning period in new democracies; single-member district (SMD) systems expedite this learning process, pushing new party systems towards consolidation at a faster pace. These findings have profound implications on constitutional engineering, and point to a trade-off between representation and political stability that needs to be accounted for. This article makes several important contributions: it provides causal mechanisms and insights in how party system evolution occurs; it points to voter behaviour as a key factor in that process; it highlights the impact of institutional choice in party system development in new democracies; and it draws attention to wasted votes as an important variable that can help us analyse strategic behaviour.
Coordination Problems in New Democracies
The evolution of new party systems can be conceptualized as the solution of significant coordination problems voters and parties face (Shvetsova, 2002). 2 Coordination is conditioned by the incentives imposed by the electoral system and occurs through a learning mechanism. The level of restrictiveness of the electoral system has a direct effect on the pace by which parties and voters update their behaviour; restrictive institutions push consolidation at a faster pace through the penalties they impose on coordination failures. The adjustment of behaviour rests on the information revealed through elections; voters and parties use this information to ‘learn’ how to better play the electoral game. The updating of beliefs and expectations through elections leads to changes in behaviour which help party systems evolve.
Coordination problems are due to information scarcities that plague with uncertainty the decisions of parties and voters. Both sets of actors have limited or no experience with the functioning of the electoral system. Even though the literature provides a good understanding about the effects of electoral institutions, the adoption of rules under different settings does not yield the same results. Mackenzie recognized in 1957 that ‘the only thing that can be predicted with certainty about the export of elections is that an electoral system will not work the same way in its new settings as in its old’ (quoted in Taagepera, 2002). This mismatch between expected and actual effects of electoral rules, at least in the short run, is often observed in new democracies (Andrews and Jackman, 2005).
Uncertainty involves more than the functioning of the electoral system. The ability to make accurate predictions about the preferences and behaviour of other actors is key. Parties need to form expectations about other parties’ viability, as well as the distribution of voters’ preferences. Voters need a good understanding about parties’ proposals and the preferences of other voters. However, information is typically unavailable in the early elections of new democracies; decision-making by parties and voters takes place in an information scarce environment, which leads to coordination failures.
These coordination problems are well documented and can be best exemplified by the overcrowded party entry in the political arena (Filippov et al., 1999; Golder and Wantchekon, 2004) and the dispersion of support of ideologically similar voters among many electorally unsuccessful parties (Tavits and Annus, 2006). In established party systems, overcrowding, or miscoordination, is already sorted out, and the electoral market has cleared. This process needs time in new democracies.
Learning Through Elections
These problems are not insoluble; they are ameliorated by the electoral process itself. The occurrence of elections facilitates the actors’ behaviour, by gradually reducing the uncertainty in the political system. Electoral results provide the most accurate and reliable source of information about voters’ preferences and parties’ support. Moreover, elections offer information as to the mechanics of the system. Information revealed through elections is thus a sine qua non for the evolution of new party systems as it promotes the learning of voters and parties. 3 However, several elections are necessary for parties and voters to form an accurate picture of the political system and to engage in strategic behaviour. With enough information, parties can make better decisions about positioning themselves on policy issues and running in elections, while voters form more reliable expectations about parties and their viability. 4
Information revelation goes through a looping mechanism; the actions of parties inform voters, who update their beliefs, expectations and behaviour. Voter actions in turn inform parties who alter their behaviour and so on. Both use elections as the most important piece of information in this repeated cycle; the use of alternative sources of information, like surveys, is in the initial stages of democracy limited, because they are typically inaccurate.
Party decisions to run individually or form coalitions send signals to voters about their expected viability. The support parties receive from donors or their financial strength is also relevant. Voters use this information to infer how likely parties are to succeed and how committed they are to their ideological platforms. Voter behaviour also channels information to parties. Electoral results signal which parties are contenders, separating them from non-viable ones. They also provide information about the policy concerns of voters, signalling to parties potential issues they need to position themselves on.
Information revelation through repeated elections forms the first pillar of the theoretical account and leads to the following observable implication: the more elections take place, the more stable the party system becomes. Stability is understood as any change in the party system that leads towards the normalization of political competition and is measured through wasted votes (Cox, 1997). To further support that reductions in wasted votes are associated with stability, evidence from established democracies is used to set benchmarks for comparison. Thus, the first hypothesis from this theoretical account links the number of elapsed elections with a reduction in the wasted vote levels of new democracies.
Strategic Coordination: The Importance of Electoral Systems
Information is not the only necessary ingredient for the evolution of party systems. The institutional structure is crucial in affecting the actors’ behaviour. We know that SMD systems typically lead to the creation of two-party systems, while proportional representation (PR) promotes multiparty competition (Duverger, [1954] 1963). The contrasting seat allocation procedures in PR and SMD systems mark the evolution of party systems, since they affect in dissimilar ways the behaviour of voters and parties. The discussion below focuses on the district, the level where seats are awarded and strategic considerations are relevant.
The hurdles parties have to overcome to enter the parliament affect the coordination process. The penalties imposed in SMDs (all parties but the first ‘lose’ in the district) mean that pressure is fierce. Small parties stand little chance of being successful in SMD systems, forcing them to consider survival strategies. These include merging with ideologically similar parties, forming coalitions, entering alliances and so on; failure to adapt can lead to extinction. In PR, however, the high number of seats per district pose fewer barriers to parliamentary representation. In the absence of thresholds, even tiny parties can make it into parliament, given high magnitude districts. Thus, fewer incentives for coordination exist in PR, as there is a high probability that small parties will enjoy at least partial electoral success.
With respect to voters, SMD pushes them to adjust their behaviour, if they do not want to waste their vote, and that process is fairly simple. Voters simply need an understanding of who the two frontrunners are (following Cox’s M + 1 rule; more on this below) and where they stand; with such information they can act strategically. In contrast, PR is less likely to push voters to vote strategically, and that process is more difficult. 5 Voters need accurate information about the expected vote shares of each party and to figure out which ones are likely to gain representation; such calculations are complex, even with significant electoral experience.
The consequence of the incentives permissive (PR) and restrictive (SMD) electoral systems create is that party system evolution moves at a different pace. Restrictive electoral systems accelerate learning; only fast ‘learners’ survive electoral competition as coordination failures are not left unpunished. On the contrary, the more permissive an electoral system is, the slower the learning, as parties and voters are more likely to be able to achieve their goals, at least minimally, without necessarily engaging in strategic behaviour. The observable implication is that restrictive electoral systems should experience faster party system evolution. This should manifest itself as a faster reduction of wasted votes in SMD systems.
The implications of this theoretical account should be evident at the district level. Voter behaviour is relevant in the local level, since considerations about casting a wasted vote occur first and foremost in the district, where seats are allocated. Of course, the electoral system may impose some national-level considerations, like upper tiers of allocation or thresholds, but nonetheless seats are awarded in the district. Thus, the empirical analysis for this article is conducted at the local level using a district-level dataset.
Wasted Votes
Wasted votes (WV) are used as the indicator of party system evolution, capturing voter behaviour. Voters are assumed to be rational and want their views to be represented in the parliament. Wasted votes include all votes that do not help a candidate/party enter the parliament (Cox, 1997). 6 It is a measure that has been used infrequently in the literature, mostly at the national level (Kreuzer, 2009; Lago and Martínez i Coma, 2012; Selb, 2012; Tavits and Annus, 2006). However, ideally wasted votes should be measured at the district level, where the allocation of seats takes place; this is the approach employed in this article, directly honing in on the strategic behaviour of voters. 7 To date, few articles have measured wasted votes at the district level (Crisp et al., 2012; Riera, 2013; Singer, 2013), while some work has analysed other party system variables at the district (Weyden and Meuleman, 2008).
Following Cox’s (1997) game-theoretical analysis and assuming that voters are short-term instrumentally rational, wasted votes in a district that returns M seats are those that go to candidates ranked below the Mth + 1st candidate. Votes that go to the first loser are not wasted as she stands a reasonable chance of getting elected. 8 Thus, rational voters will not be wasting their votes as long as they vote for candidates ranked within the M + 1 boundary.
Wasted votes indicate the ability of the electorate to act strategically. Repeatedly casting votes for marginal parties indicates that voters are not familiar with the workings of the electoral system. However, observing a decline in WV over time would indicate that voters are able to distinguish viable candidates and avoid luckless ones. Systematic reductions in WV help the party system move towards consolidation and resolve coordination problems.
Wasted votes are important for another reason. In the early elections of new democracies, we typically observe an excessive amount of votes going to parties that do not enter the parliament. In the Russian elections of 1995, almost 50% of the votes in the PR part of the electoral system went to parties that did not exceed the national threshold. Such coordination failures create a representation gap, by disenfranchising the voters whose preferred parties did not win seats. To some extent, this occurs in any election, including established democracies; nevertheless, having a significant share of the population without representation can lead to serious accountability problems.
Some may question short-term rationality in defining WV. Voters may have a long-term horizon, and thus casting a vote for a losing party at the present may be a winning strategy for the future. However, given that parties in new democracies tend to be volatile, have a small life expectancy and change often political personnel, it is difficult to attribute long-term incentives to voters. One should also consider the nature of founding elections in new democracies; the winners make decisions that shape a country’s future. Given the importance of such elections, it is difficult imagining a scenario under which voters would ‘trade’ a wasted vote in the present for uncertain future policy benefits.
It could still be the case, however, that what I term wasted votes is, at least in part, an act of dissatisfaction. Protest voting is a conscious act by which voters want to send a message, voting for smaller parties to punish bigger ones. However, we should be clear that protest voting and wasted votes are analytically distinct; a voter may protest without wasting her vote. If a vote is cast with the aim of protest, it is wasted only if it goes to a party not winning a seat in the parliament. One could argue that protest voting is more effective if it is directed to smaller, yet still viable, parties, which have the ability to push the government to make policy changes. Thus, a voter can express her dissatisfaction without necessarily casting a wasted vote. Hence, it is not the case that protest and wasted ones are substitutable, although some overlap may exist. Moreover, to distinguish empirically between protest and wasted votes, the presence of carefully designed surveys or exit polls would be necessary; unfortunately, these are not available here. For these reasons, analytical and empirical, I do not consider protest votes in the analysis.
Operationalization
The operationalization of WV is complex, due to the wide variety of electoral systems and the different strategic considerations they create. According to Cox’s (1997) theoretical formulation, WV are those that go to parties/candidates ranked below the M + 1st party/candidate in the district. The calculation is straightforward for single round SMD systems, but more complicated for two-round majority and PR systems.
For one round plurality systems, M + 1 is equal to two, so WV are calculated by summing votes going to the third candidate and lower. For two-round majority races, as in Hungary and Lithuania, M + 1 is equal to 3 in the first round, since the first two candidates make it into the second round. 9 WV calculations are more subtle in PR systems. Cox (1997) notes that the logic of strategic coordination applies in PR, although it might be difficult for voters to coordinate in cases where district magnitude is excessively large. 10 Still, the calculation of WV is possible and can be informative; if we observe that WV levels go down even in districts with a high number of seats, this will indicate that voters are able to act strategically.
WV in PR are calculated following the same logic as in SMD systems, but instead of parties, quotas are used. In a hypothetical district returning 10 seats, we often have less than 11 parties (M + 1) competing; this does not mean that no WV are cast. The way to calculate WV in multi-member districts is by taking the lowest-ranked party in the district that was able to fill an electoral quota and win a seat; that is the Mth seat winner. The party ranked next is the M + 1 and all lower-ranked parties constitute those that votes are wasted on.
In the presence of national thresholds, calculating WV has to be adjusted, as voters have to consider simultaneously two games: the national and the district one. Foremost, voters have to consider whether their preferred party has a chance of surpassing the national threshold; if so, they apply the logic discussed above. However, voters also have to consider whether deserting their preferred party in the district could push its vote tally below the threshold and adjust their behaviour. 11 If the party is not expected to overcome the national threshold, then regardless of its district ranking voters have to abandon it and vote for a lower-ranked one. Table 1 summarizes how wasted votes are calculated for each electoral system.
Wasted Vote Calculations for Different Electoral Systems.
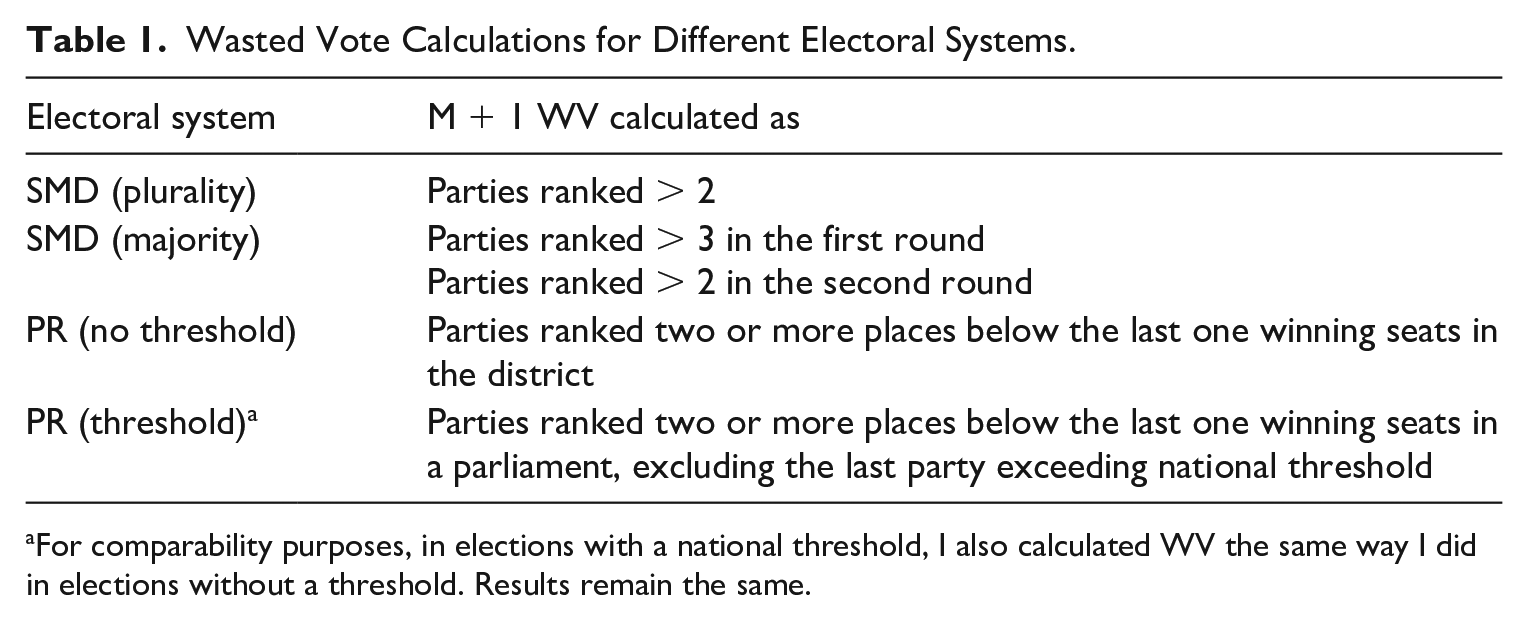
For comparability purposes, in elections with a national threshold, I also calculated WV the same way I did in elections without a threshold. Results remain the same.
Data
The data used in the analysis include district-level electoral information for 25 new democracies; seven established democracies are also used to provide a benchmark for comparing wasted vote levels once a party system reaches a relatively stable state. Data were collected on electoral results from lower house elections using official electoral results. The dataset includes electoral information on party votes, seat allocation, number of candidates competing, registered and cast votes and turnout. It includes information on almost 2200 districts per election; overall, it includes data for more than 11,000 districts, spanning five electoral periods. Moreover, the article uses a national dataset with extensive information on electoral system characteristics, regime type and several controls, building on the Cheibub and Kalandrakis (2004) institutional database. The district and national data are merged together to create a time-series cross-sectional dataset, which is analysed using multi-level analysis.
The universe of cases is all countries that transitioned to democracy since the end of World War Two. To identify transitional democracies I used the regime classification by Przeworski et al. (2000). They include cases of democratization, decolonization and democracies emerging from the breakup of countries. New democracies having held less than three elections are not included in the dataset as that would not leave enough time to observe the evolution of the party system. Moreover, cases with significant redistricting are excluded from the analysis, as changing district boundaries (or district numbers) does not allow tracing them over time. 12
All cases, including the established democracies, have data for five or more consecutive elections. The actual number of transitional countries analysed is 26; the Hungarian majority elections are broken down into two, analysing the first- and second-round elections separately. Turkey enters the dataset twice since it experienced a breakdown of democracy from 1980 to 1983. A complete list of all the countries can be found in Table 2. 13 For comparability purposes, and given the varying number of elections held in each country, the analysis is restricted to the first five elections of new democracies. Established democracies (seven in total) are not included in the empirical analysis; rather, they are used for comparability purposes (figures and graphs) to provide a benchmark for the levels of WV typically observed once a system settles down.
District-Level Dataset.
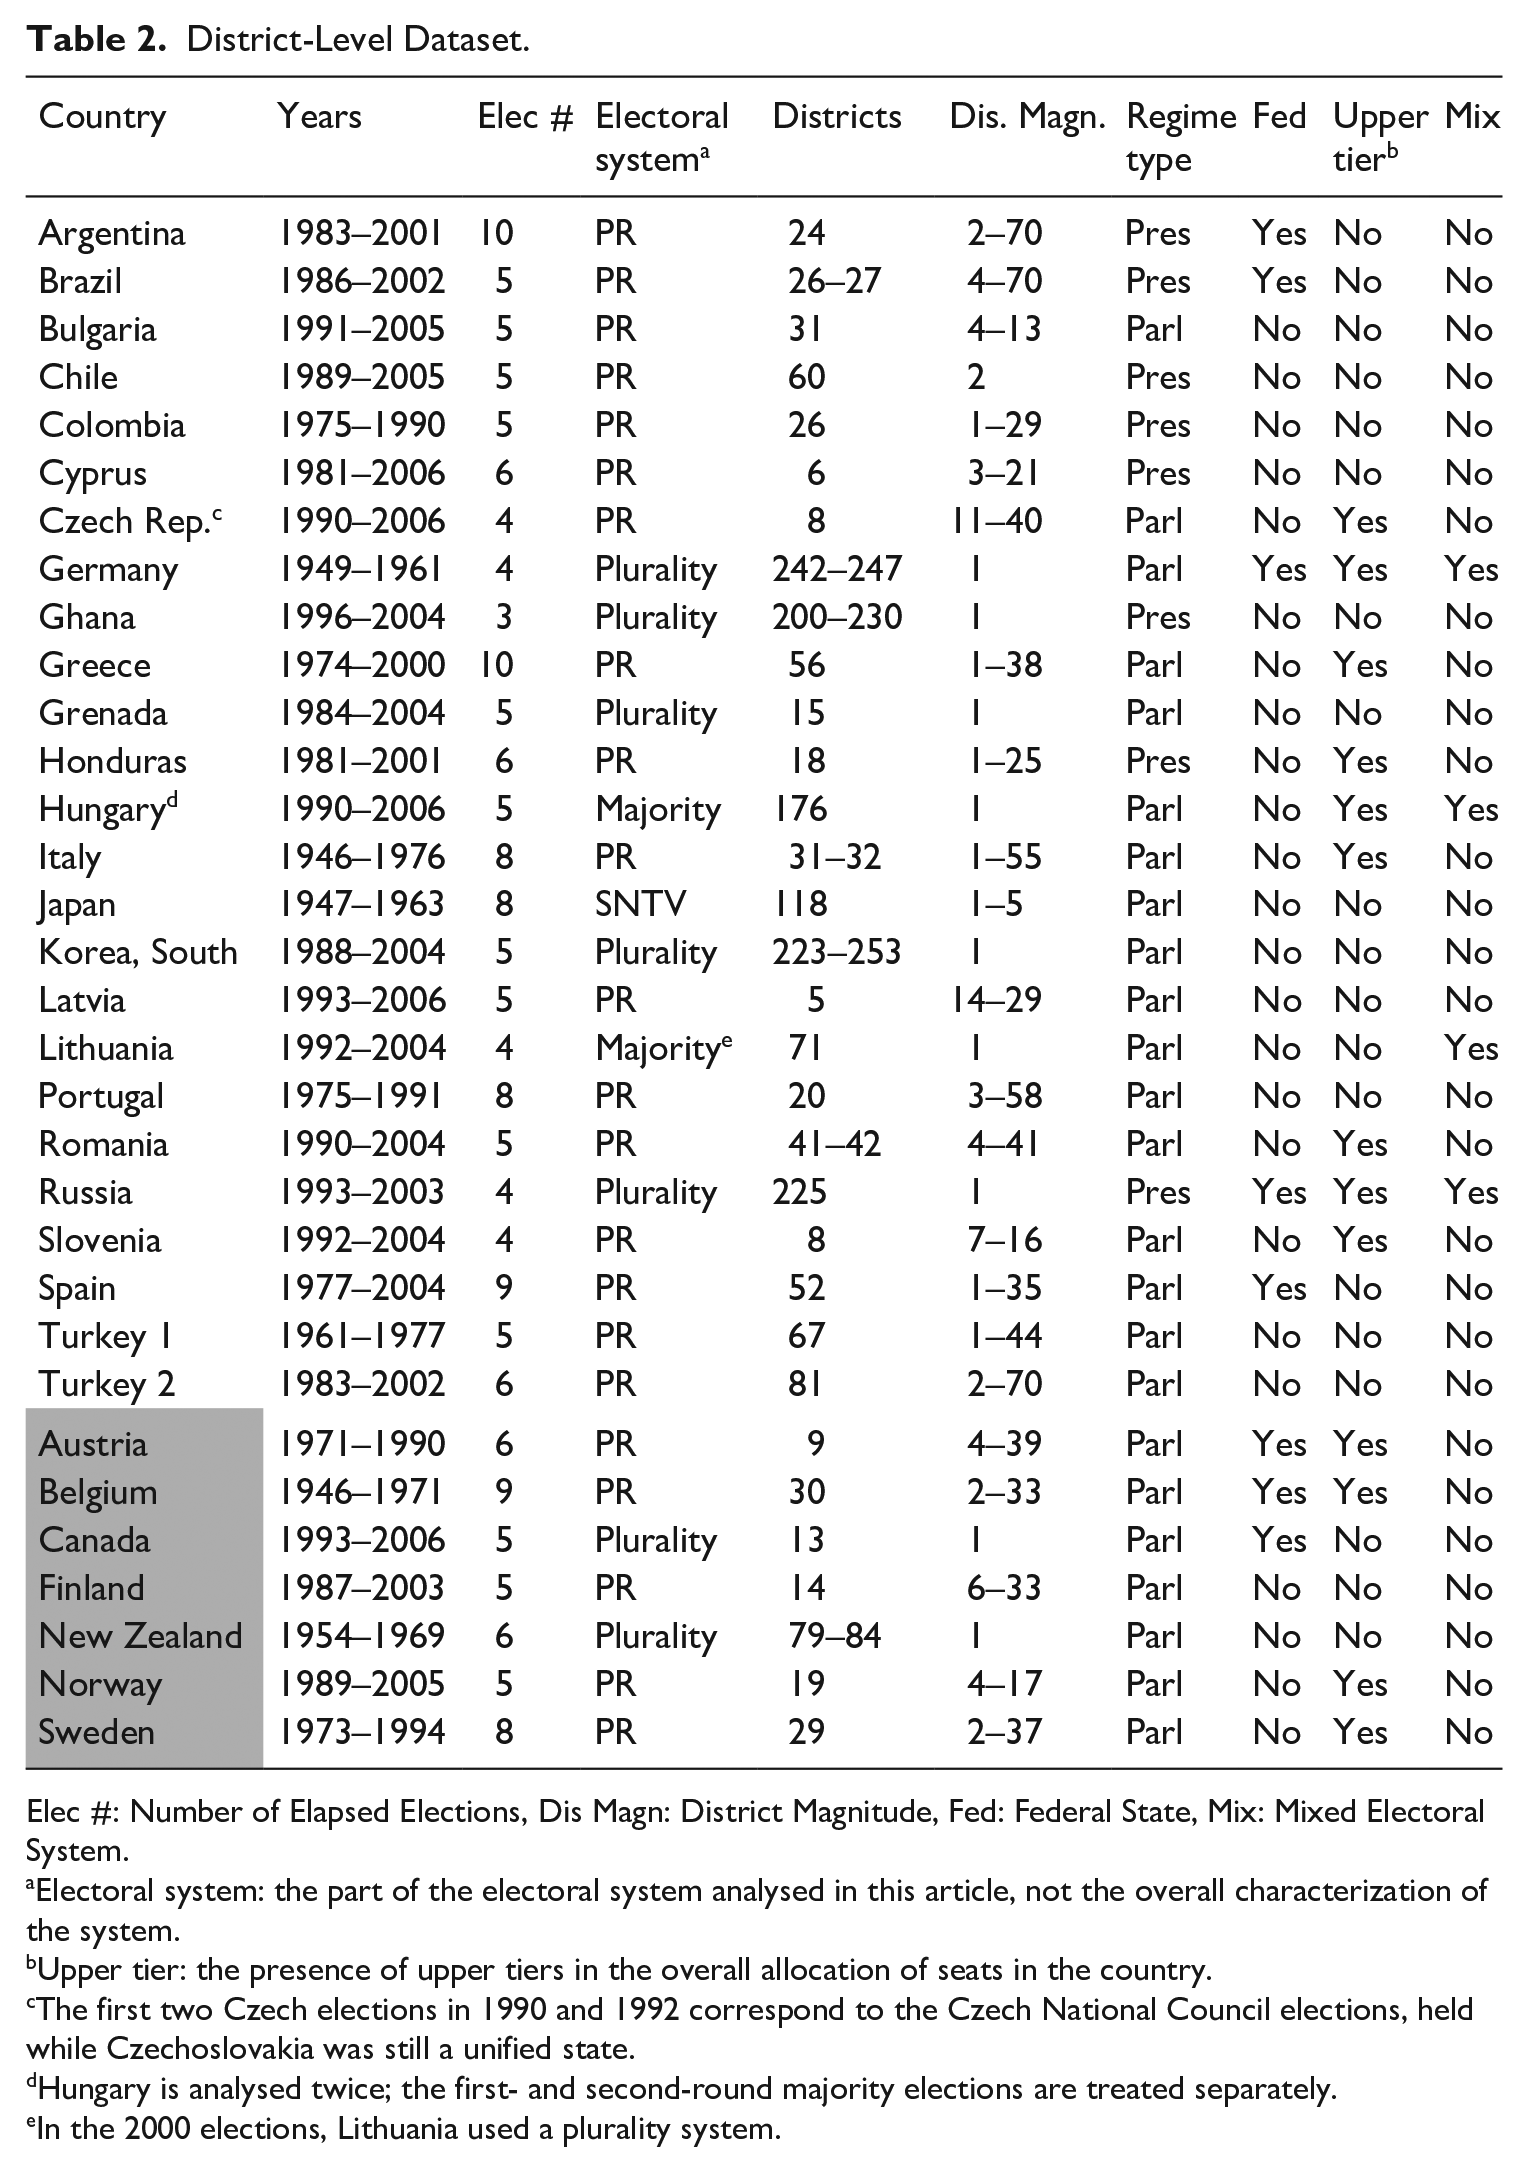
Elec #: Number of Elapsed Elections, Dis Magn: District Magnitude, Fed: Federal State, Mix: Mixed Electoral System.
Electoral system: the part of the electoral system analysed in this article, not the overall characterization of the system.
Upper tier: the presence of upper tiers in the overall allocation of seats in the country.
The first two Czech elections in 1990 and 1992 correspond to the Czech National Council elections, held while Czechoslovakia was still a unified state.
Hungary is analysed twice; the first- and second-round majority elections are treated separately.
In the 2000 elections, Lithuania used a plurality system.
Independent Variables
Two sets of independent variables are used, from the district and the national level. The main district-level variable is the number of elapsed elections since democratization. They are used as a proxy for the information revealed to voters; the more elections that have occurred, the better able voters should be to act strategically and the fewer wasted votes we should observe. Elapsed elections are coded as a continuous variable, taking the value 1 for the first election under democracy, 2 for the second and so on. To account for the possibility that the effect of elapsed elections on WV may not be linear, all specifications are rerun adding the squared number of elapsed elections. The effects are largely linear and do no change substantively and for simplicity are not presented here. 14
An important variable at the district is the natural logarithm of district magnitude. The more seats a district returns, the fewer votes are necessary for a party to gain a seat and, on average, less wasted votes should be cast. Another variable is the number of registered voters (natural logarithm), proxying the effects of population size on voter behaviour. Controlling for registration allows the examination of the relationship between population size and the coordination problems voters face. The expectation is that higher registration should increase WV, since coordination between bigger groups of voters becomes more difficult.
Finally, the number of candidates/parties running in the district is used to measure party supply. Solving the coordination problems of voters becomes harder given numerous candidacies, since voters have to distinguish which are viable. The number of candidates should thus increase WV, ceteris paribus. An alternative measure is the effective number of candidates (Laakso and Taagepera, 1979); however, it is endogenous to the electoral results, and already incorporates the strategic behaviour of voters. 15
The national-level variables used follow the party systems literature and include ethnic fractionalization as a proxy for the number of cleavages (Lipset and Rokkan, 1967; Neto and Cox, 1997). The measure by Fearon (2003) is used and the expectation is that cleavages should reduce WV by providing more structure to voter behaviour. The effective number of presidential candidates (ENPRES), the proximity of legislative and presidential elections and their interaction are also included. These variables capture the effect of presidential elections and their timing with respect to legislative ones (Cox, 1997; Filippov et al., 1999; Jones, 2004; Shugart and Carey, 1992). If presidential elections increase the number of competitors as the literature identifies, then we should expect them to also increase WV. Finally, thresholds of representation are included since they directly affect the strategic calculations of voters; we would expect them to lead to an increase in WV.
Several controls are included. The average daily circulation of newspapers (World Bank, 2014) is used as a proxy for the levels of available information to voters. Greater access to newspapers should facilitate learning and decrease WV. Moreover, the processing of available information is also important; illiteracy levels are included as a proxy (UNESCO Institute for Statistics, 2014). High illiteracy should correlate negatively with the ability to process information and use it effectively, and thus should push up WV.
To address the possible effects of the economy two variables are incorporated, GDP per capita and inflation (World Bank, 2014); expectations about their effects are ambivalent. Affluent societies are likely to have widely available information which could lead to a fast reduction of WV. However, such societies may hold post-material values which can lead them to vote for single-issue parties which are less likely to enter the parliament. The effects of inflation are also ambiguous; high inflation could lead to a punishment of the incumbent party; whether that will lead to a reduction of WV depends on what kind of parties benefit from it. If voters decide to support big opposition parties, then WV should remain largely unchanged; if they opt for smaller parties WV may actually increase.
All models include the wasted votes cast in the founding election. This variable was added to control for the potentially different trajectories that may arise from an outlying first election (Reich, 2004). A founding election with very high (low) wasted votes may bias the inferences we make about the effects of elapsed elections in a country. Controlling for wasted votes in the first elections allows more confidence in the elapsed elections estimates; results hold when the variable is excluded. 16
Finally, there is non-negligible missingness for some of the national-level controls. In order not to lose a significant part of the dataset through list-wise deletion, missing data were imputed using the AMELIA II software (Honaker et al., 2007; King et al., 2001). 17 To evaluate the quality of the imputations, two tests were performed: a comparison of the values of the observed and the imputed observations, and an overimputation of the observed values. Both tests show that the imputations performed well and the imputed data closely match those of the incomplete dataset, indicating the appropriateness of the model used.
Empirical Analysis
The multi-level dataset is conducted using a random intercepts model (Bryk and Raudenbush, 1992; Luke, 2004), where lower-level observations are the districts and upper level are the countries. For robustness, all models are rerun using random slopes, with the results showing little differences. After analysing the whole dataset, the analysis is broken down into two data subsets; SMD and PR countries, to test the expectations about the effects of electoral systems on the pace of learning. Results are presented first for the whole dataset, followed by tables for the SMD and PR analysis.
Because of the small number of higher-level clusters (26 countries), all relevant national-level variables cannot be included simultaneously, as that would severely reduce the degrees of freedom. Instead, no more than three national-level variables are included at each model estimation. This is a relative limitation stemming from the number of available countries and can only be improved with the addition of more data.
To begin with, it is worth looking at some descriptives. Table 3 lists the mean WV percentage per country and election. There is wide variation in WV levels, both across time and space. One thing that stands out is the average for wasted votes in transitional countries is twice as much as the one for established countries, at least for the first three elections, indicating that voters behave differently in the two sets of countries.
Wasted Votes: Descriptive Statistics.
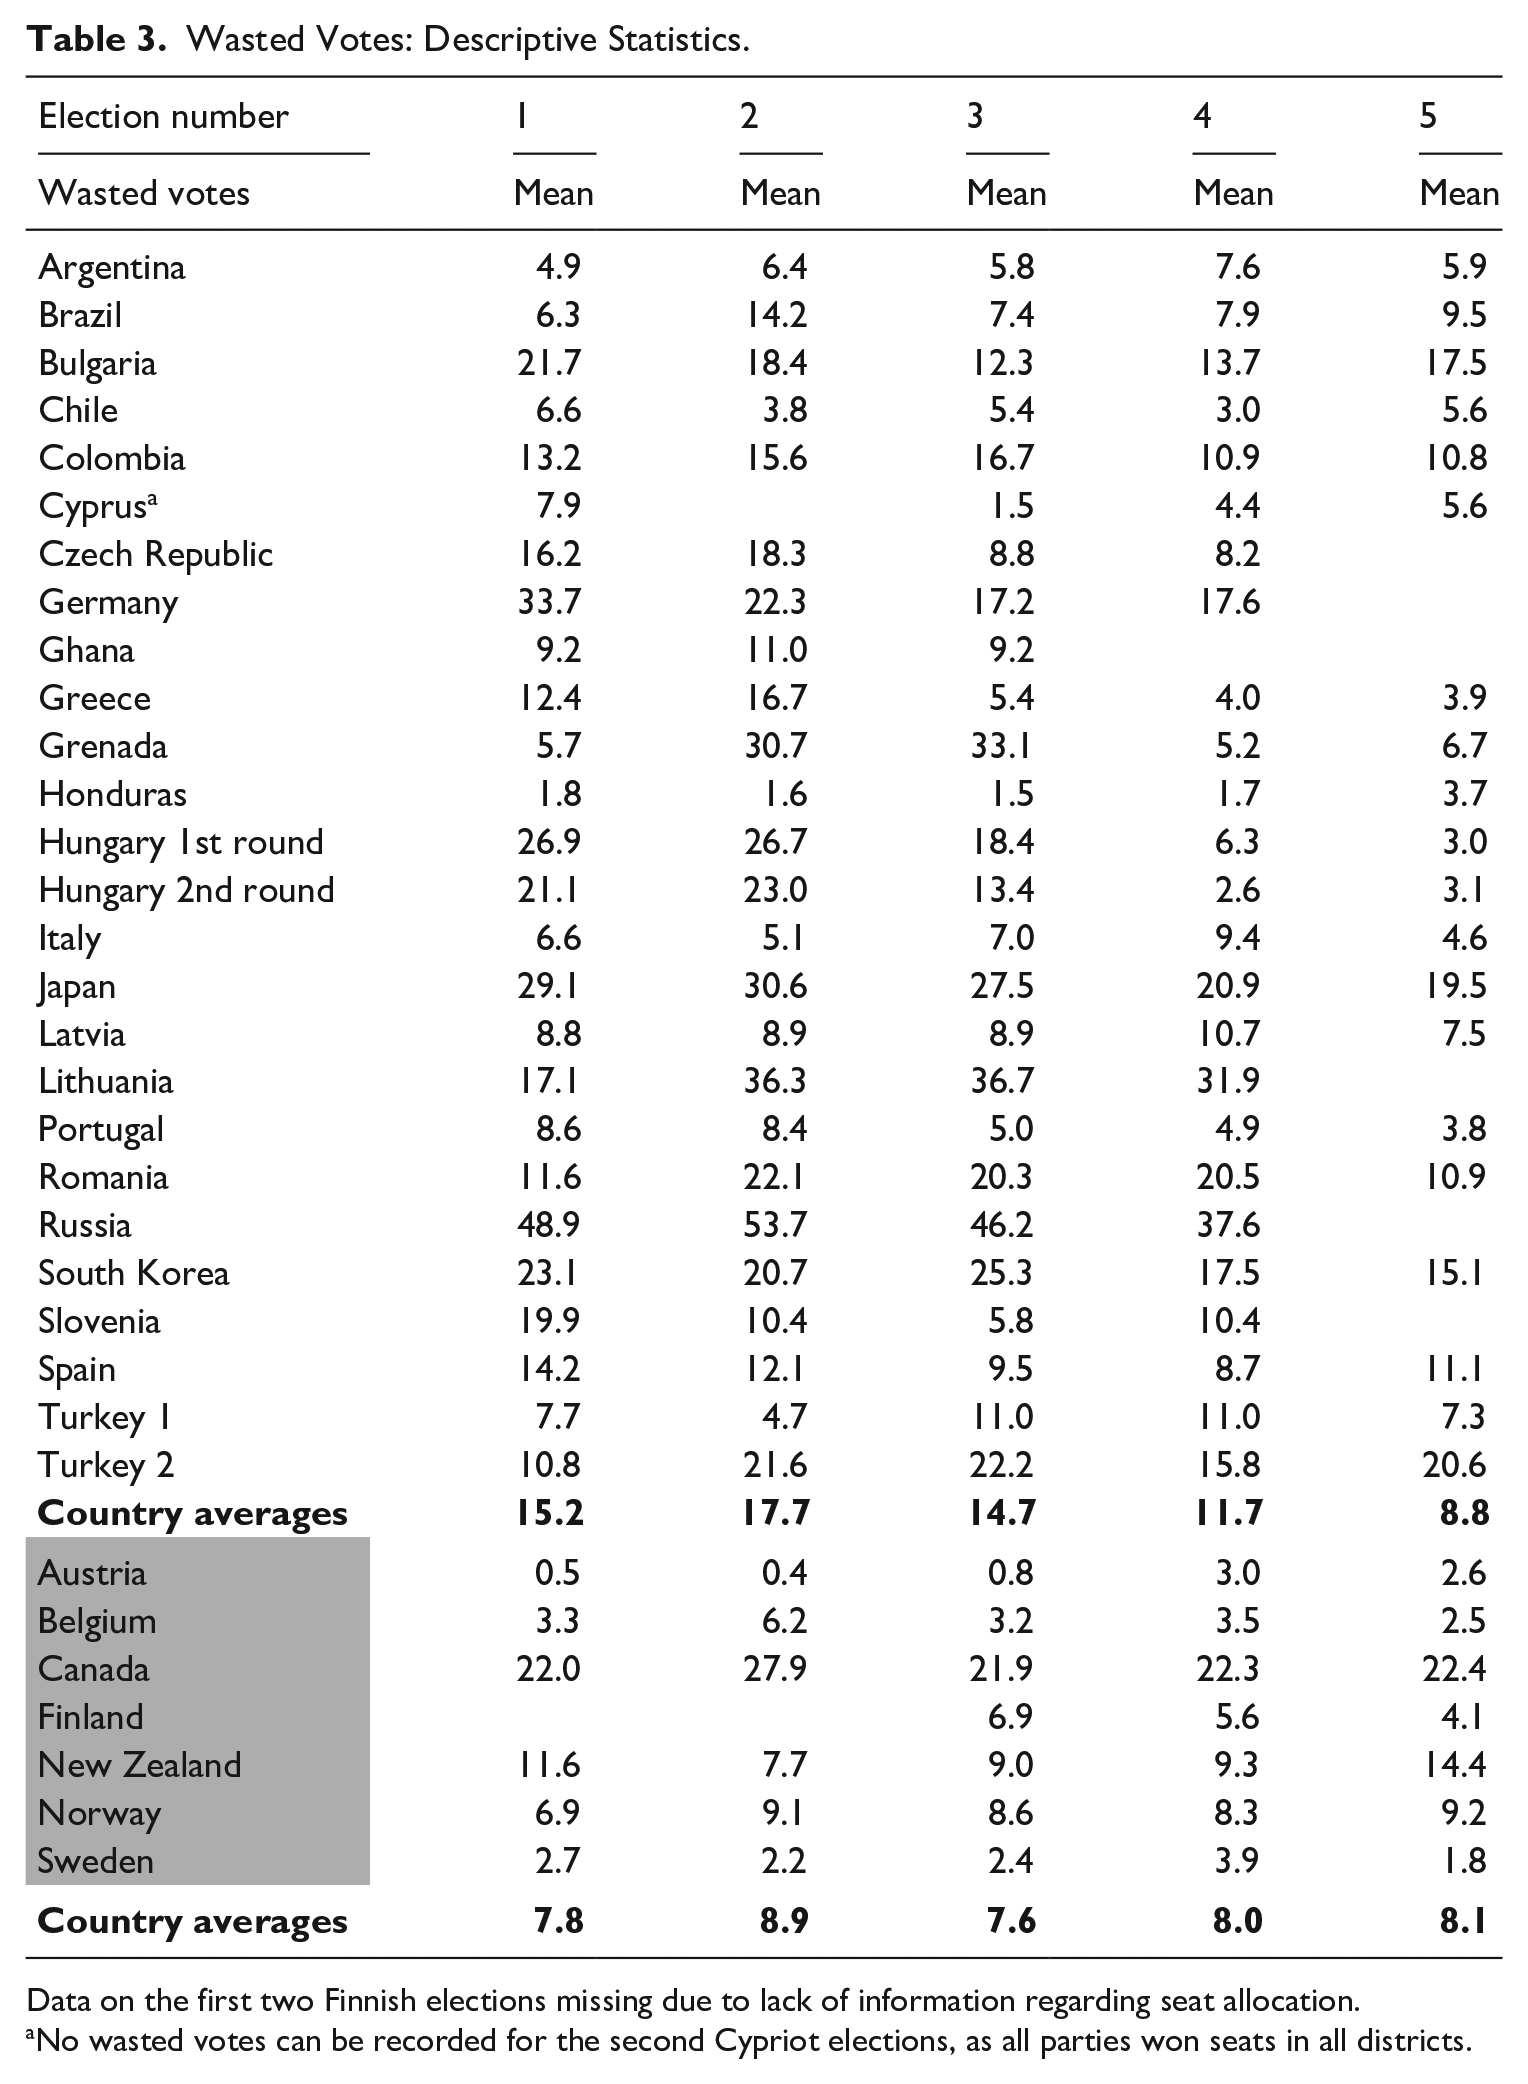
Data on the first two Finnish elections missing due to lack of information regarding seat allocation.
No wasted votes can be recorded for the second Cypriot elections, as all parties won seats in all districts.
Table 4 presents the results for the multi-level analysis in the whole dataset, while Tables 5 and 6 those for SMD and PR. Table 4 results follow theoretical expectations; the more elections take place, the fewer WV we observe. The elapsed elections coefficient indicates that on average each election results in 3% fewer wasted votes, 18 consistent with the prediction that more voters act strategically as more elections occur.
Wasted Votes (Random Intercepts), All New Democracies.
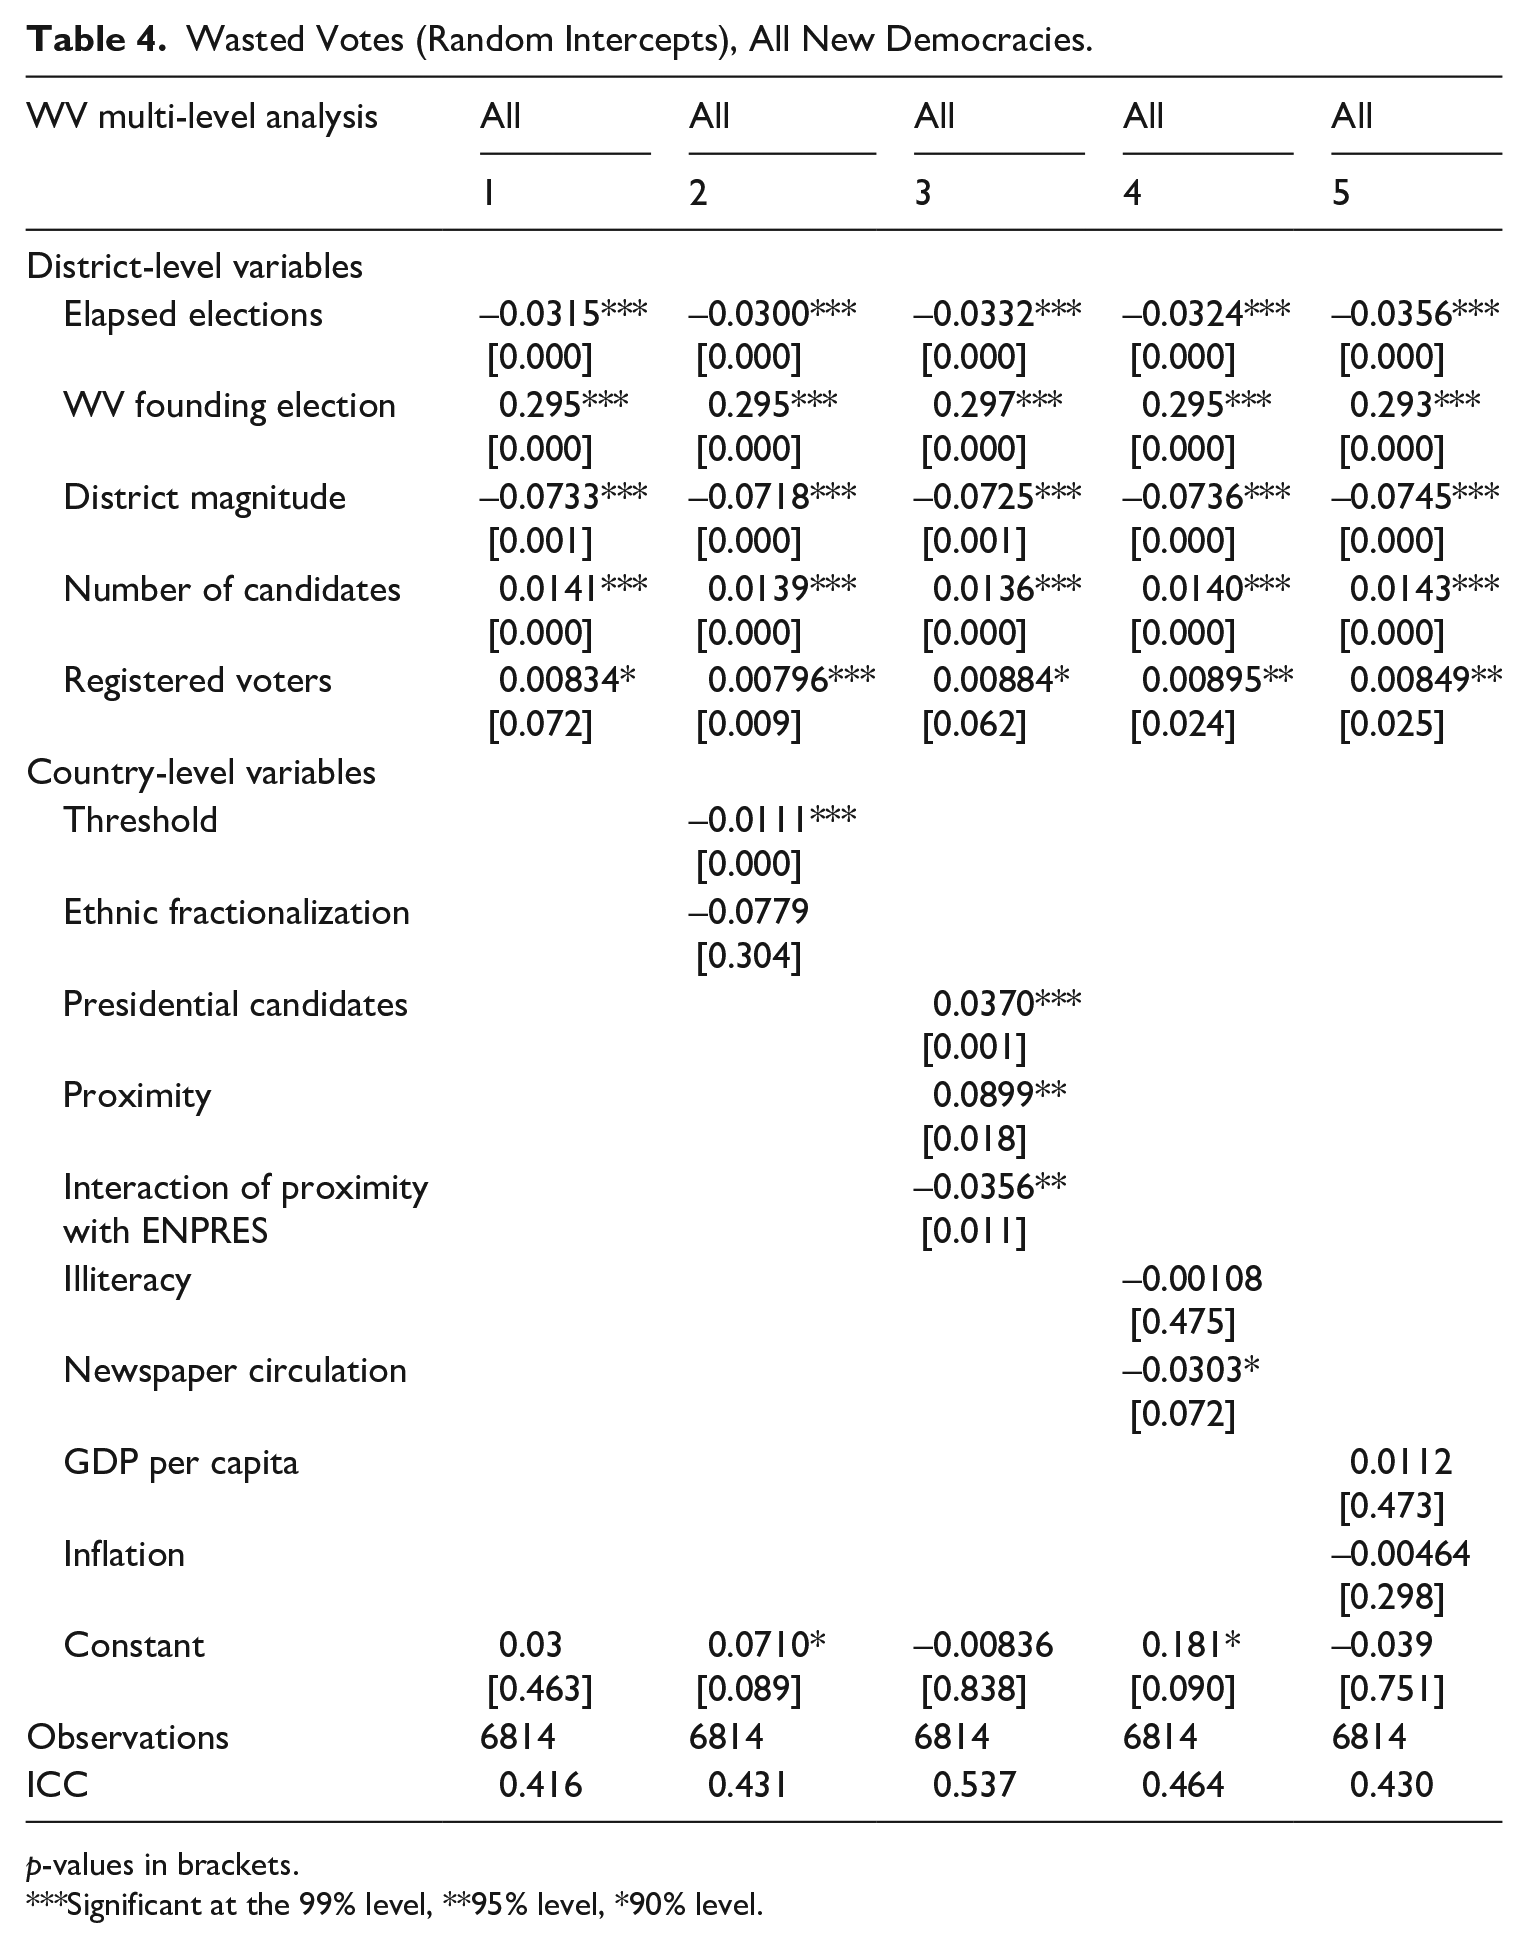
p-values in brackets.
Significant at the 99% level, **95% level, *90% level.
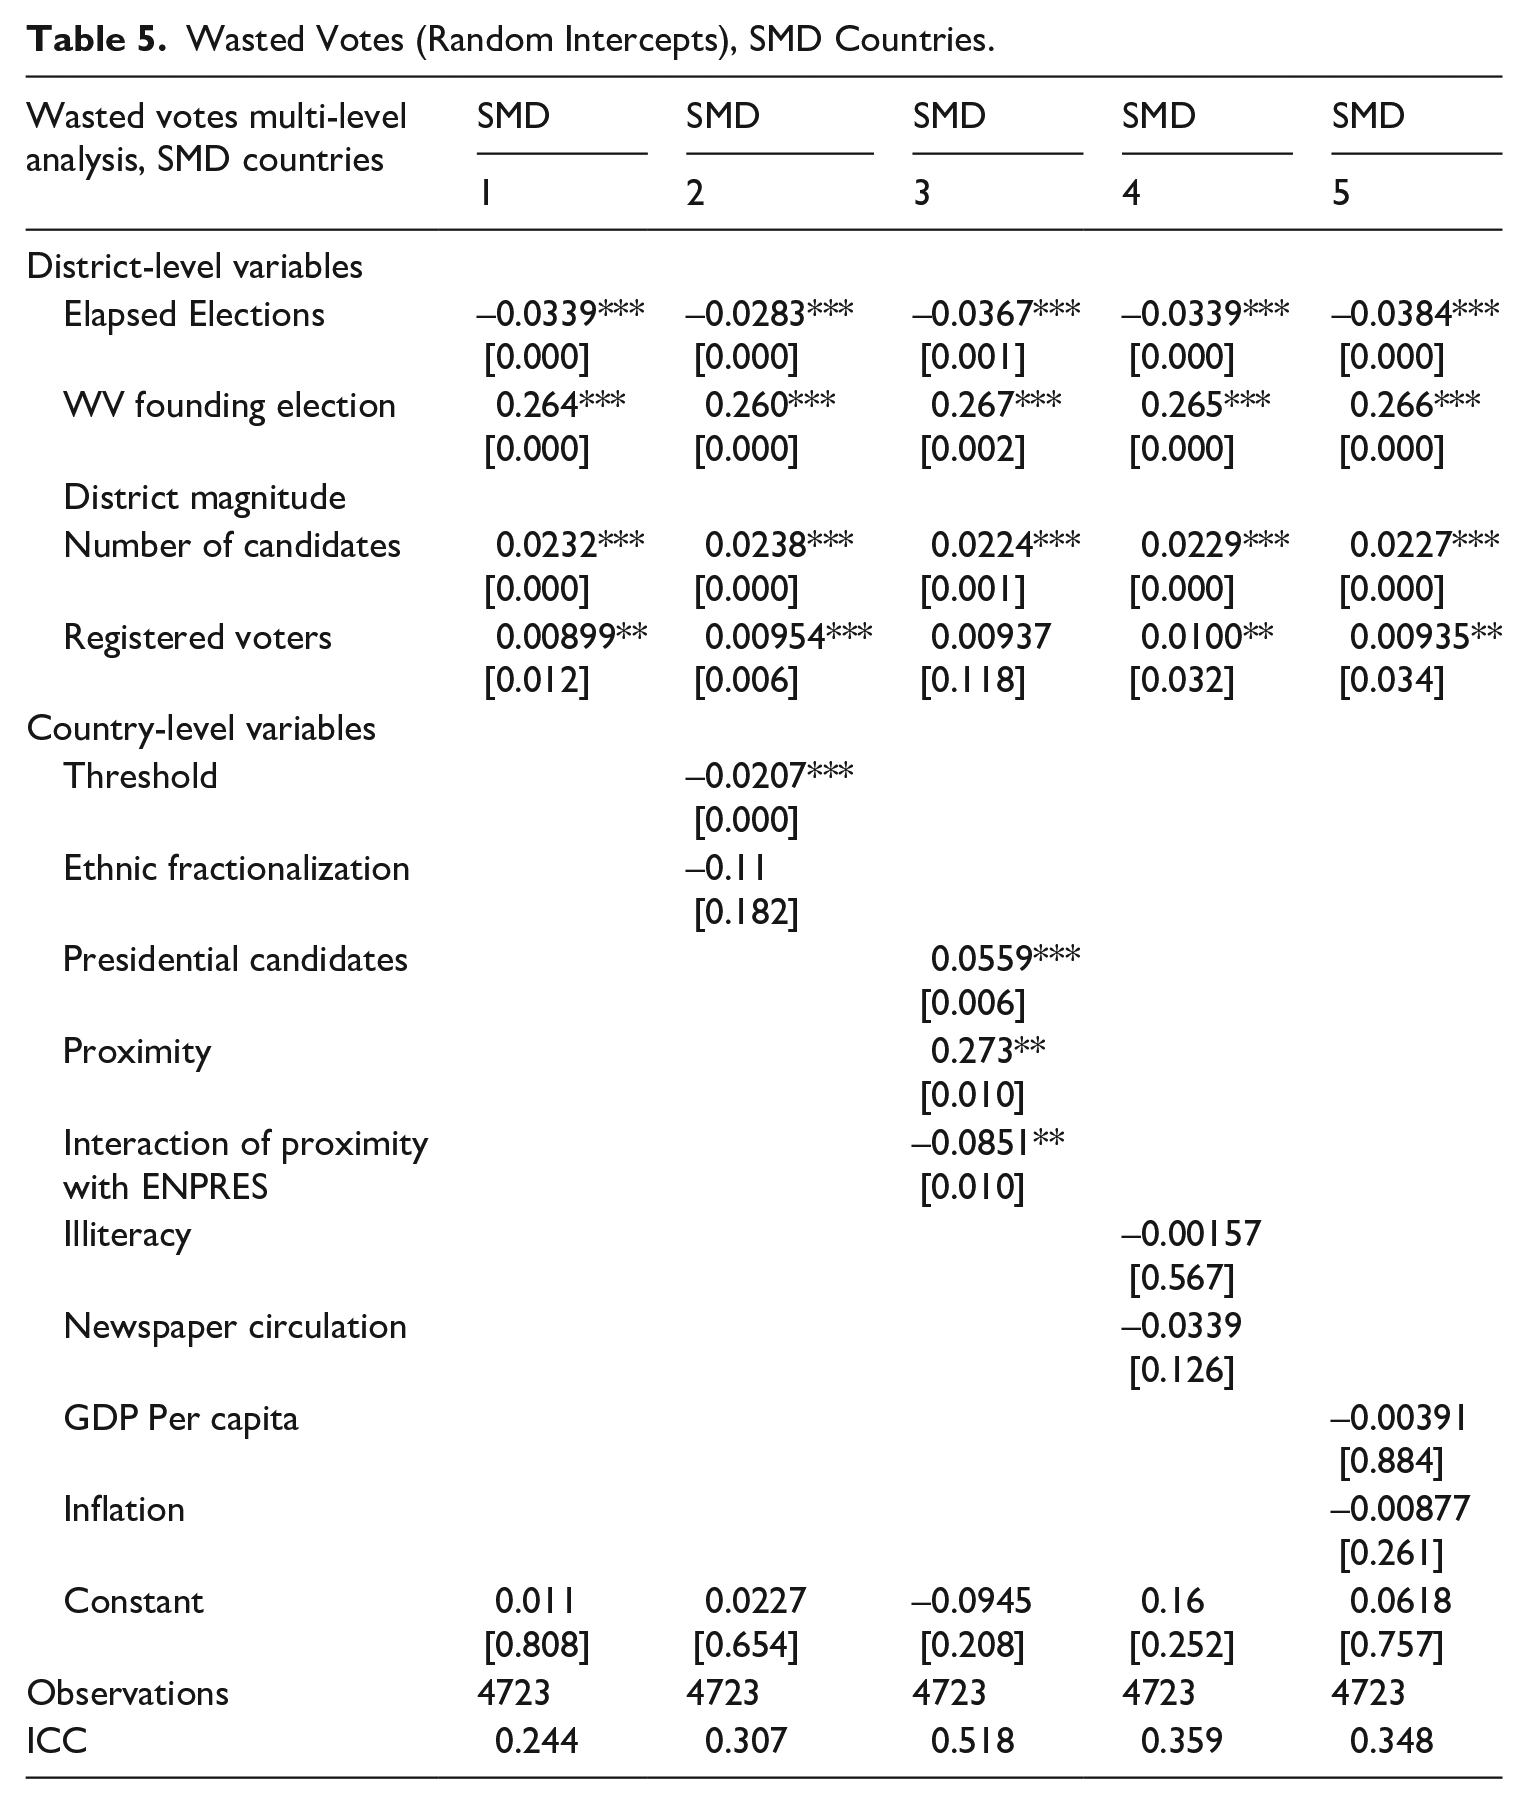
Wasted Votes (Random Intercepts), SMD Countries.
Wasted Votes (Random Intercepts), PR Countries.
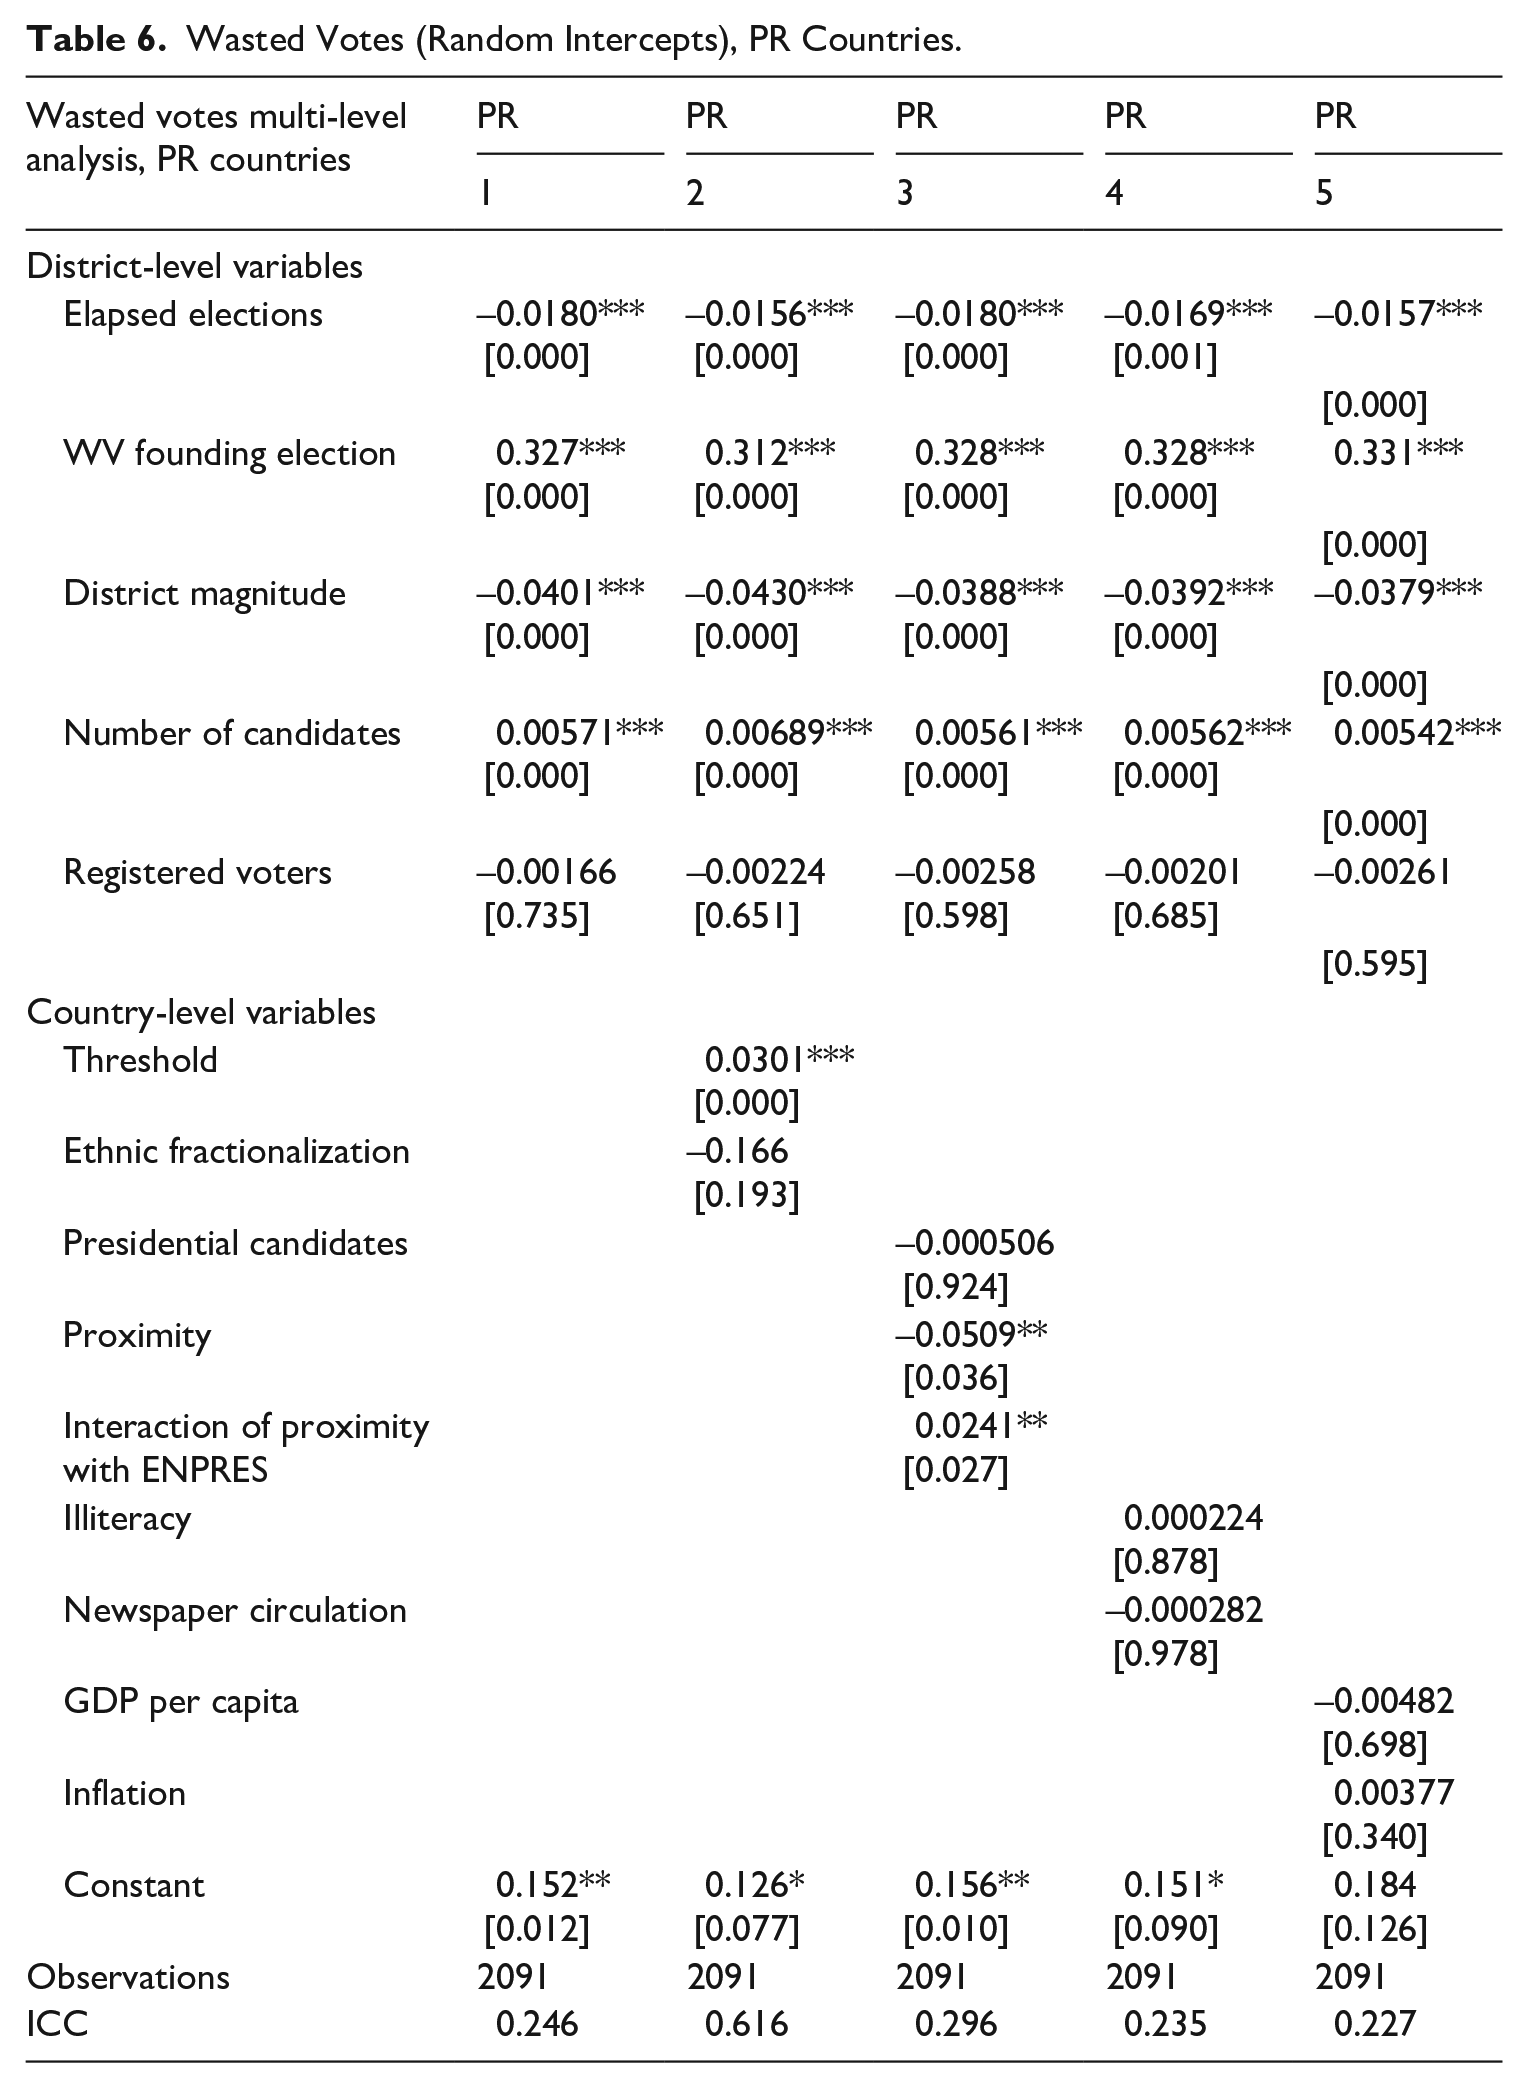
Results are confirmed when looking at SMD and PR countries, although the magnitude of the effect varies. The elapsed elections coefficient is negative and significant for both subsets; however, each election reduces WV almost twice as much in SMD countries, hinting that voters adapt to the incentives created by the electoral system.
Nevertheless, this difference cannot be taken as conclusive evidence about the different rates of learning in the two systems; we have to keep in mind that significantly fewer WV are cast by design in PR systems. Figure 2 makes that clear; while 27% of all votes cast in SMD systems are wasted in founding elections, only 14% are wasted in PR ones. There is much room for a decline of WV in SMD systems, which may explain the higher reduction rates we observe. These initial discrepancies are controlled by the wasted votes in founding elections variable, but it is still difficult to appraise the actual differences in rates of reduction. The main point to take from these regressions is that WV decline sharply in both PR and SMD systems, and that the absolute reduction is almost twice as high in SMD systems. Note that these results are robust to numerous alternative specifications as well as random slopes and fixed effects.
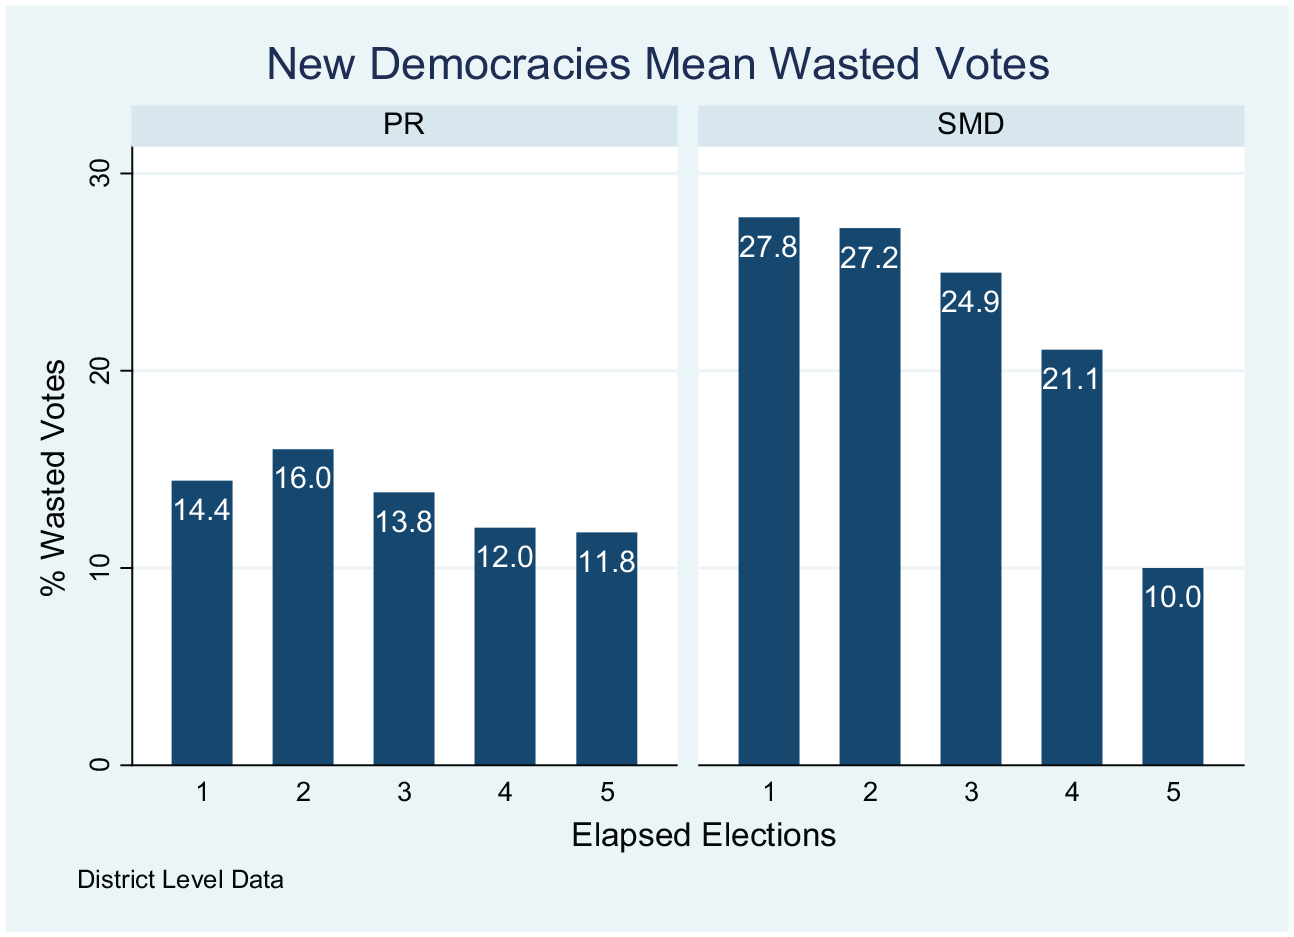
Wasted votes by the electoral system.
Rates of Change of Wasted Votes
The multi-level analysis of WV provided evidence that wasted votes decline over time in new democracies. However, it is unclear whether the rates of decline are similar across electoral systems. To properly compare rates of decline a second dependent variable is used, measuring the rate of change in wasted votes over consecutive elections. The variable is the first difference of WV divided by the previous election WV:
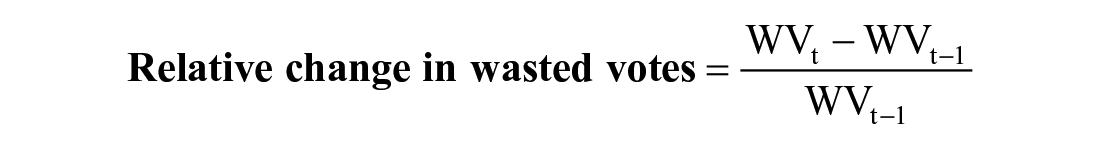
Positive values indicate a relative increase in WV over consecutive elections, whereas negative a decline. Dividing the first difference by the previous election’s wasted votes allows us to compare changes across electoral systems, circumventing the problem of different starting levels of WV between PR and SMD systems. Since the variable is calculated as a rate of change it is bound below at −1 and unbound at the top; it is also highly skewed to the right, as cases where significant increases in WV took place have very big values. To avoid the uneven influence of such outliers and to make the variable resemble a normal distribution, it is logarithmically transformed. 19
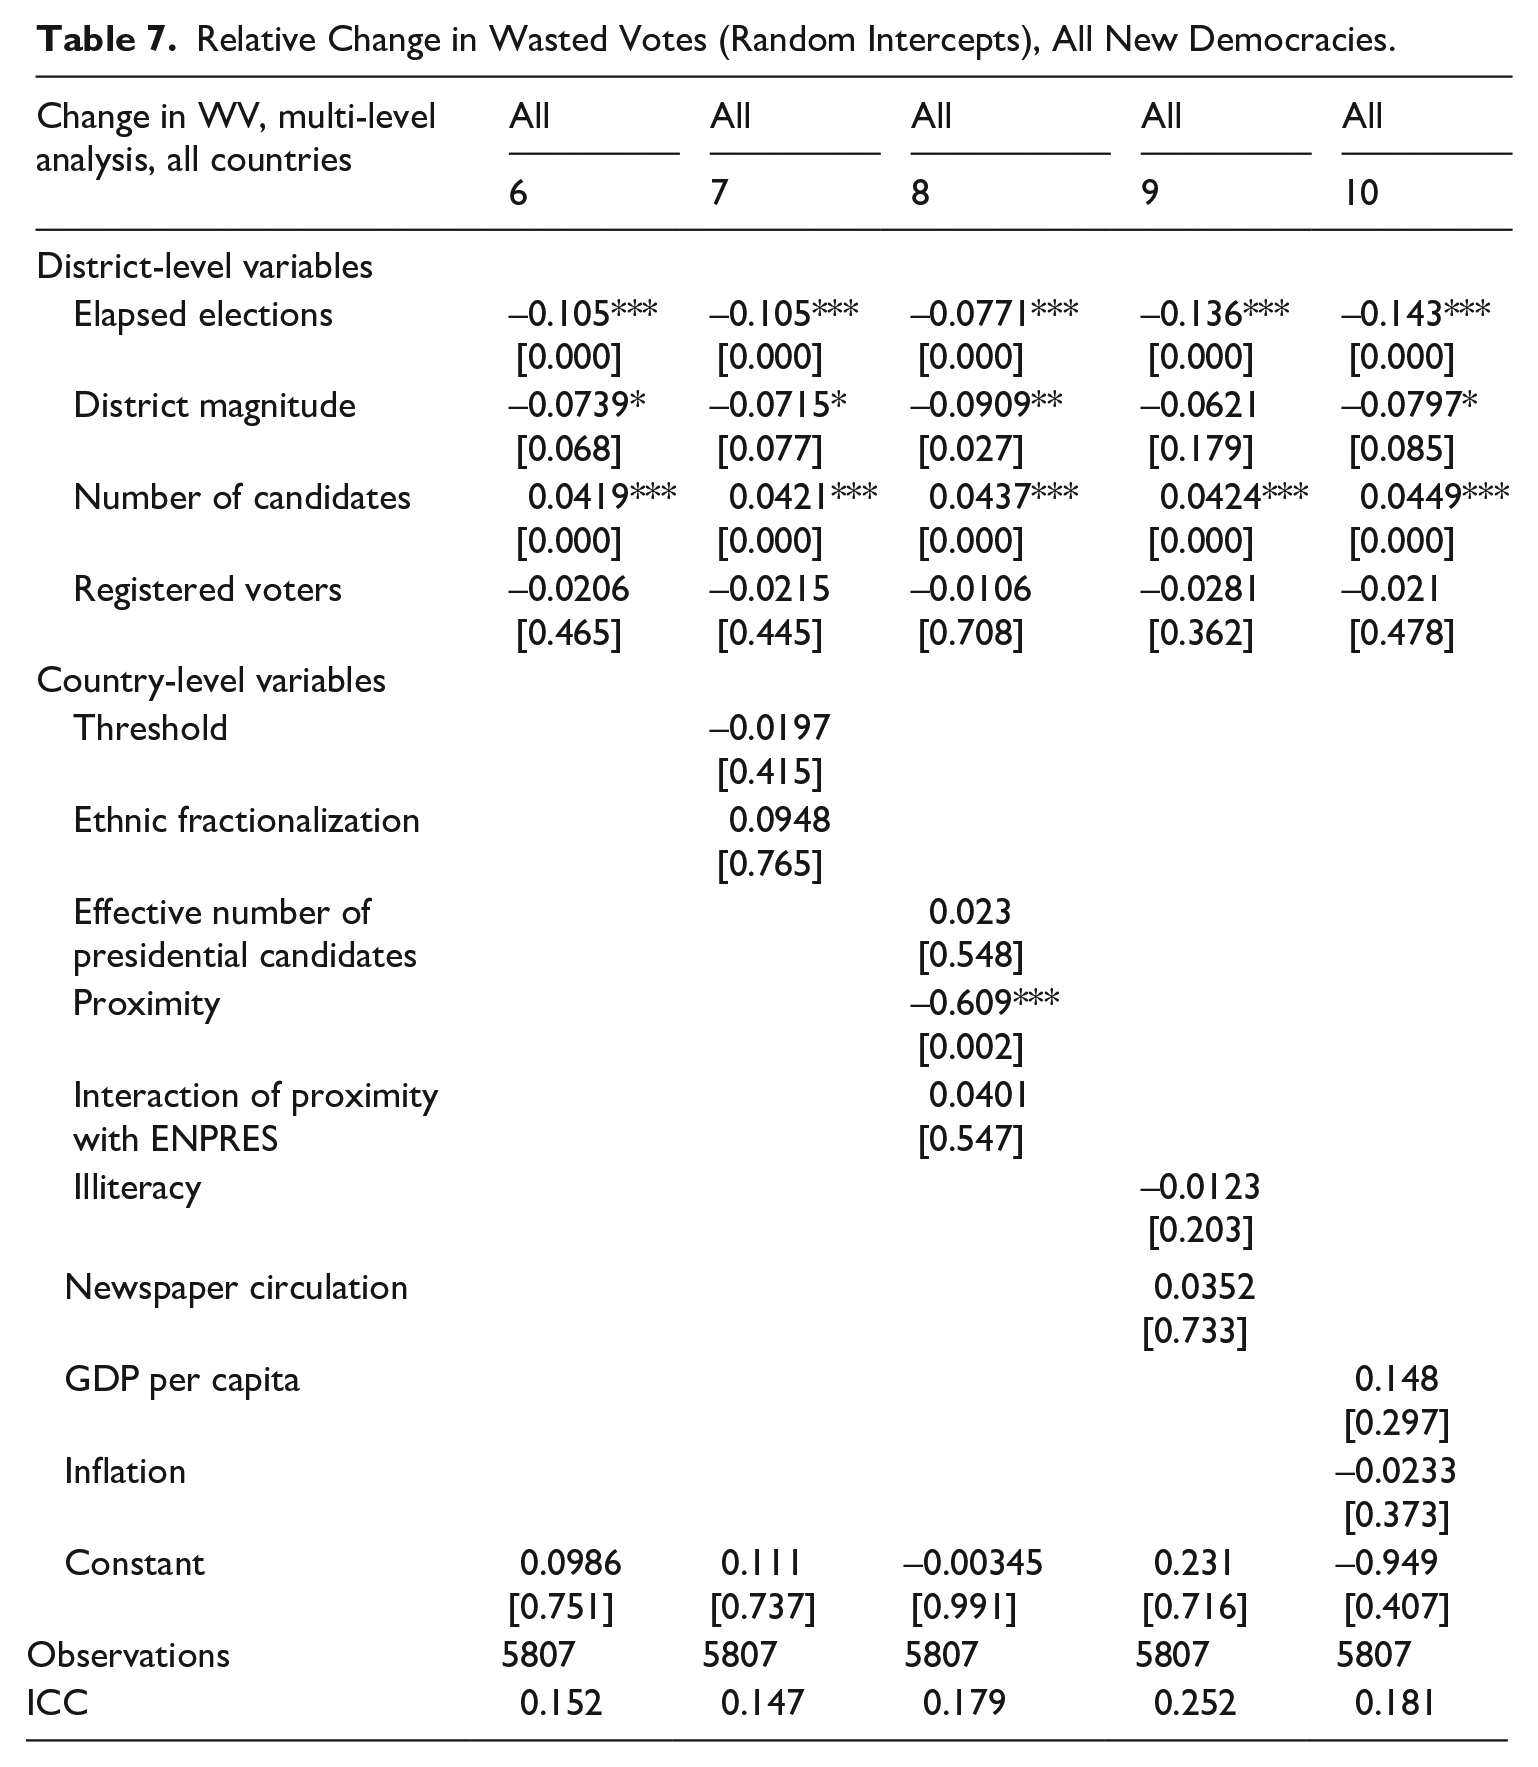
Tables 7–9 present the results in the full sample and the SMD and PR subsets. Results in Table 7 verify the relative reduction in wasted votes over time in the full sample; after the appropriate transformations the relative percentage reduction is estimated between 7.5% and 13.3% per election (Table 10), while the reduction is bigger if we look at the random slopes results. Each additional election reduces wasted votes by, on average, one-tenth of its previous value, indicating the significant rate by which changes occur in new democracies.
Relative Change in Wasted Votes (Random Intercepts), All New Democracies.
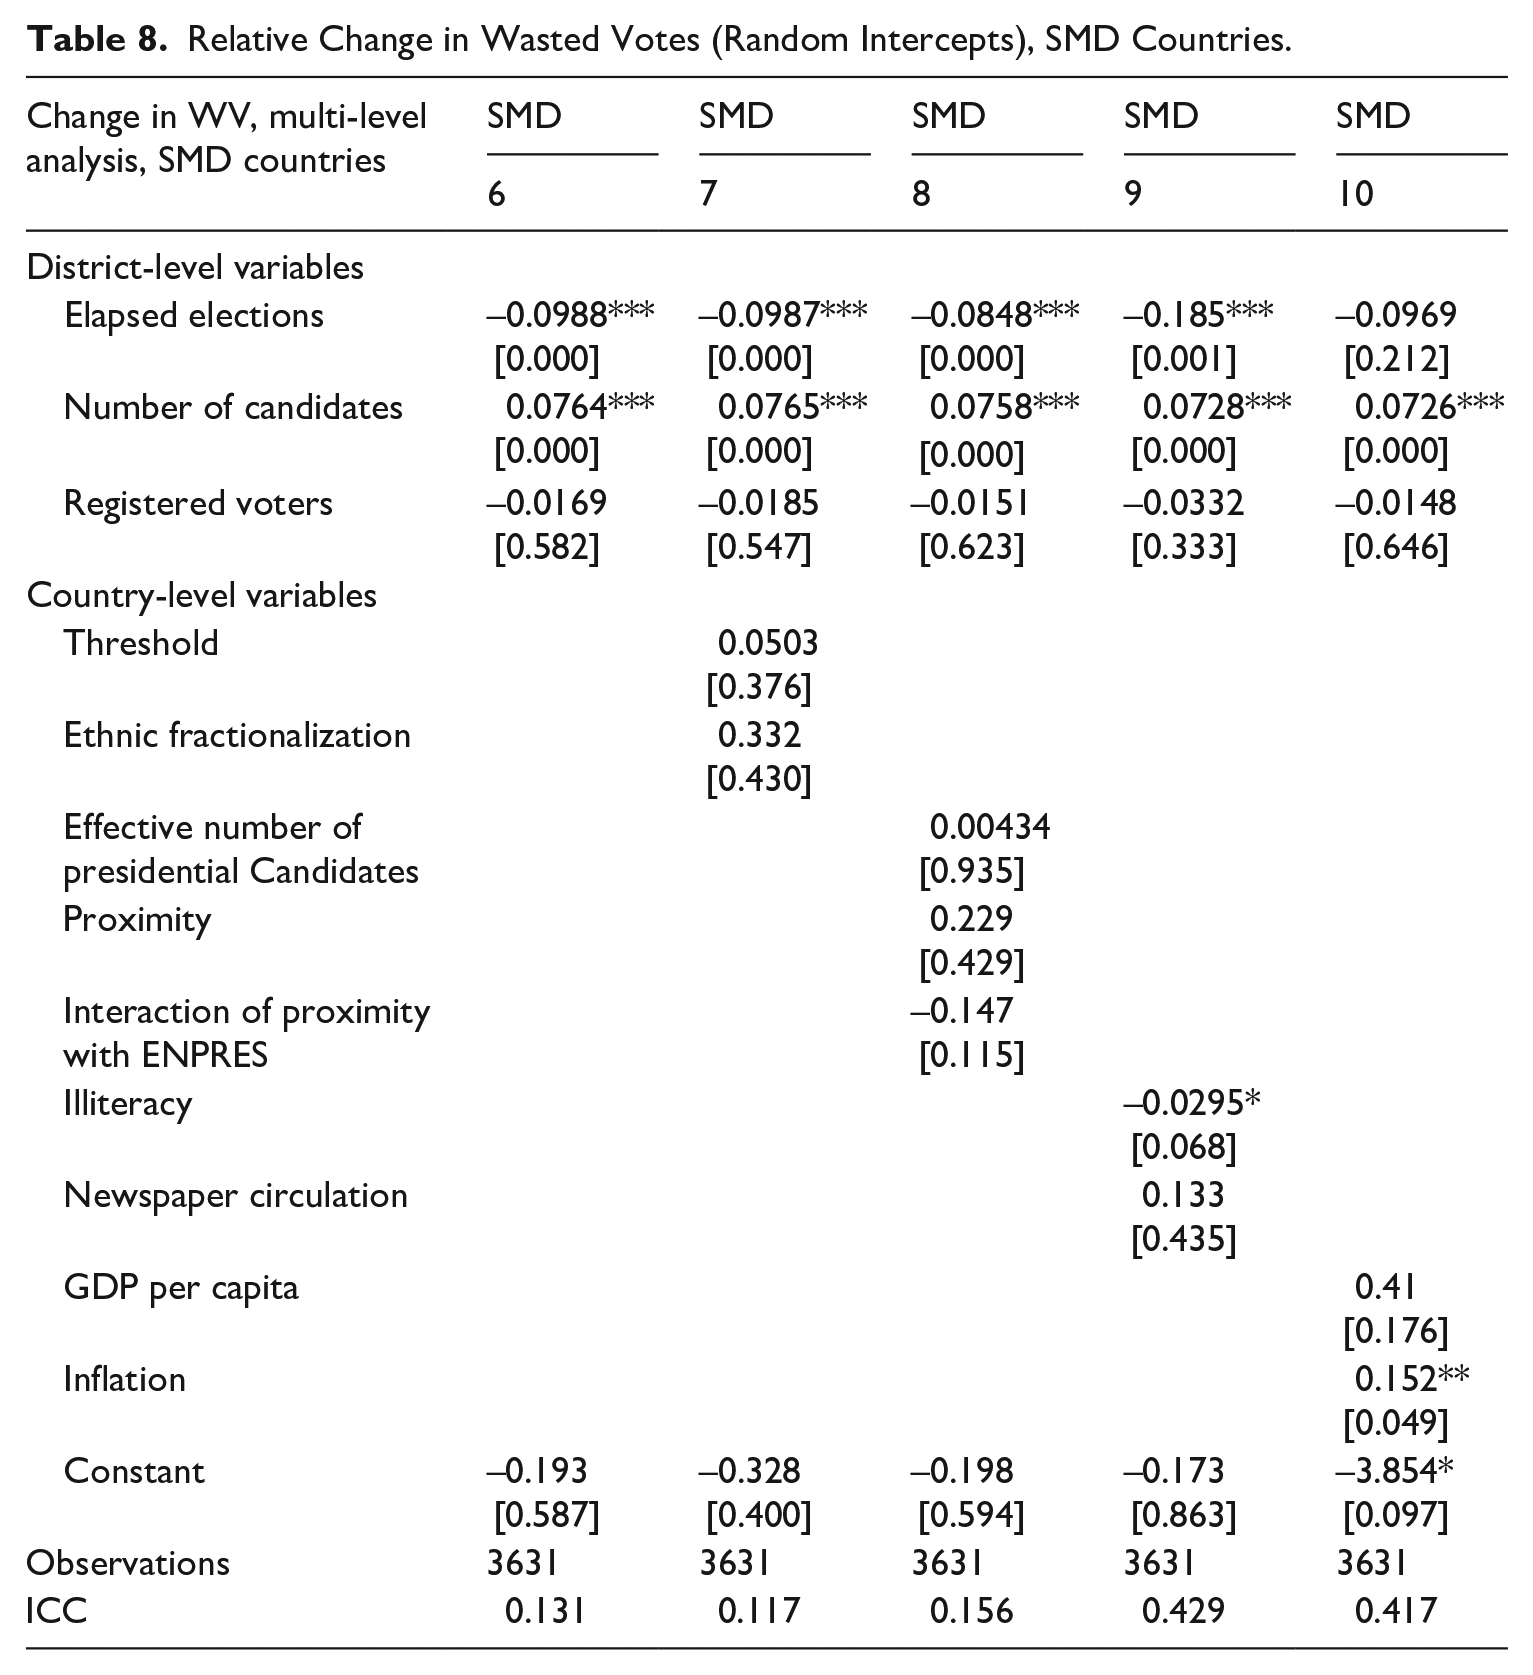
Relative Change in Wasted Votes (Random Intercepts), SMD Countries.
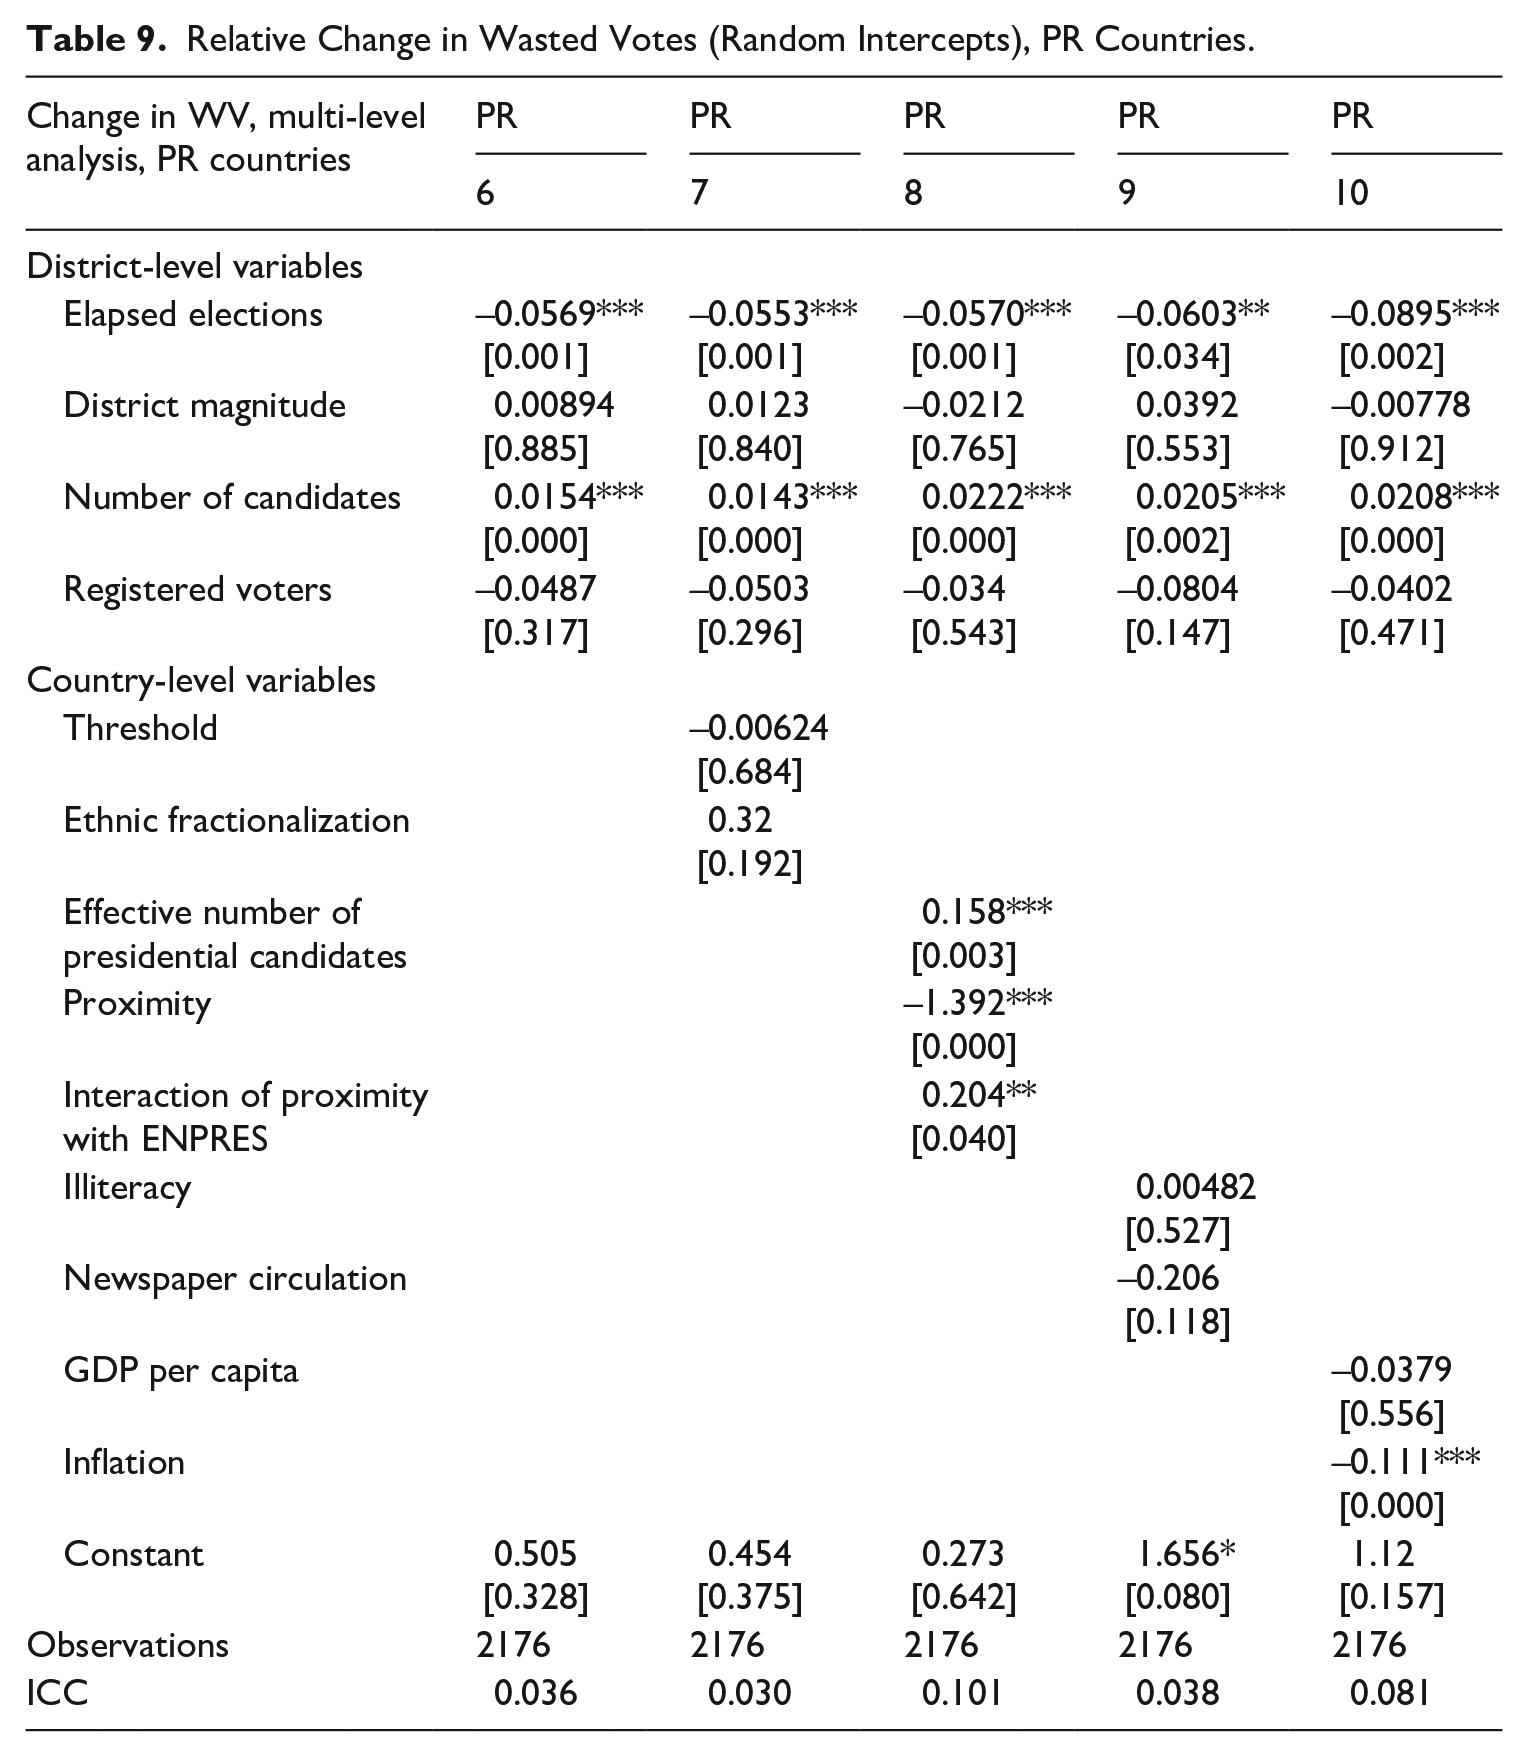
Relative Change in Wasted Votes (Random Intercepts), PR Countries.
Percentage Effect of Elapsed Elections on Wasted Votes.
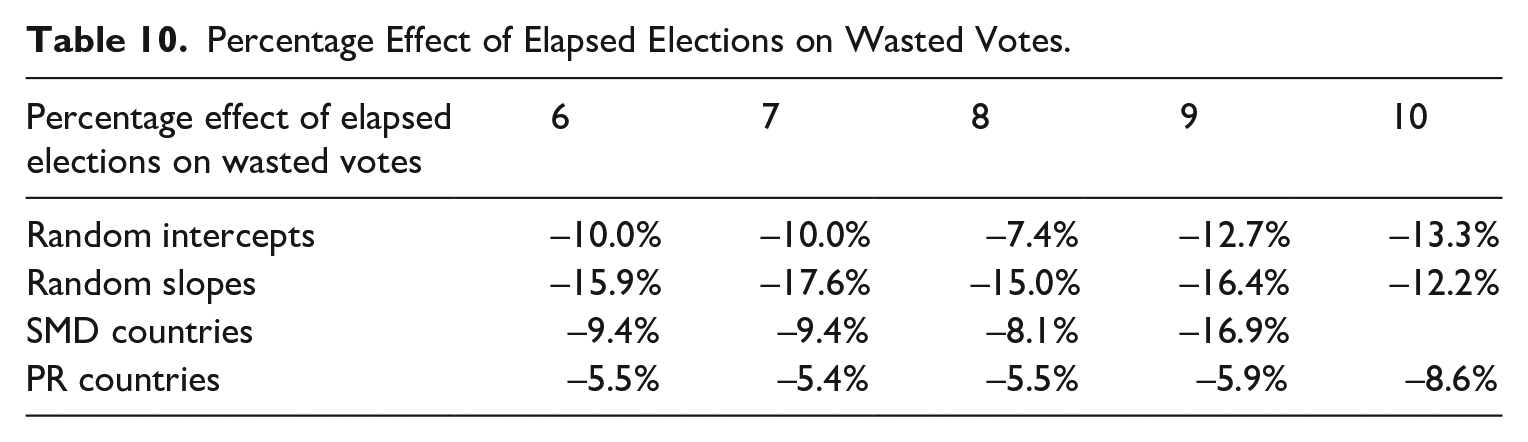
Rates of change are quite different in SMD and PR systems; in most models, the reduction is almost twice as fast in SMD systems, while in one model (9), it is three times as fast. Only in the last model (10) is the rate of change not significant. This is consistent with the expectation that learning occurs faster in SMD systems as voters respond to the institutional incentives. On average, each election leads to a reduction of about 9% of WV in SMD systems. In PR systems, the reduction is significant as well, yet slightly slower; each election reduces WV by just above 5%.
One last thing needs to be noted about the changes observed in WV over time. The different rates of change across the two electoral systems push the evolution of WV over time to quite different outcomes, with respect to established democracies. Figures 3 and 4 compare average WV for established and transitional democracies, by the electoral system. Figure 3 shows that in PR systems the levels observed in transitional democracies linger quite high in comparison to established cases. While WV in PR countries drop from 15% to almost 12%, established democracies consistently experience WV levels of about 5%.
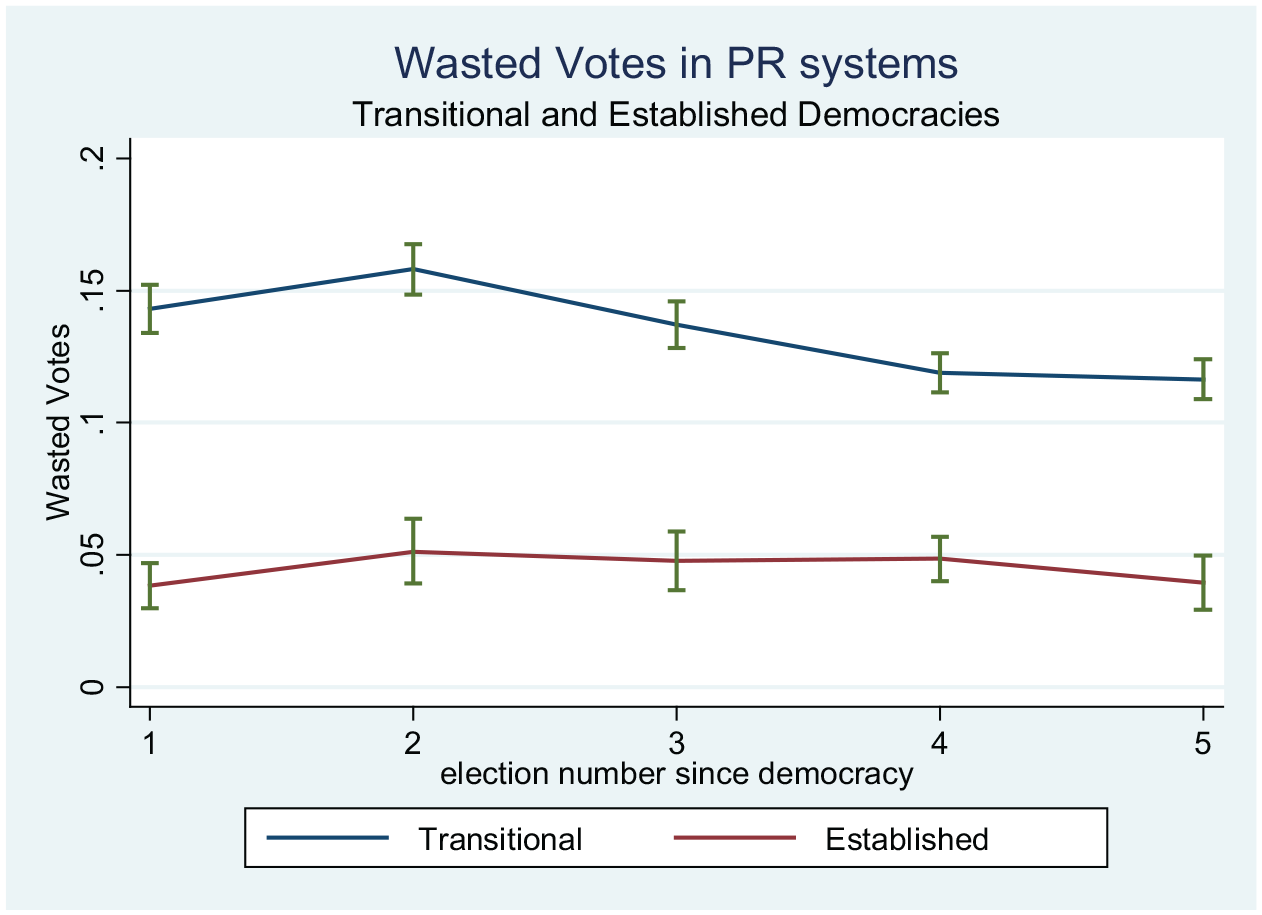
Wasted votes in PR systems in transitional/established democracies.
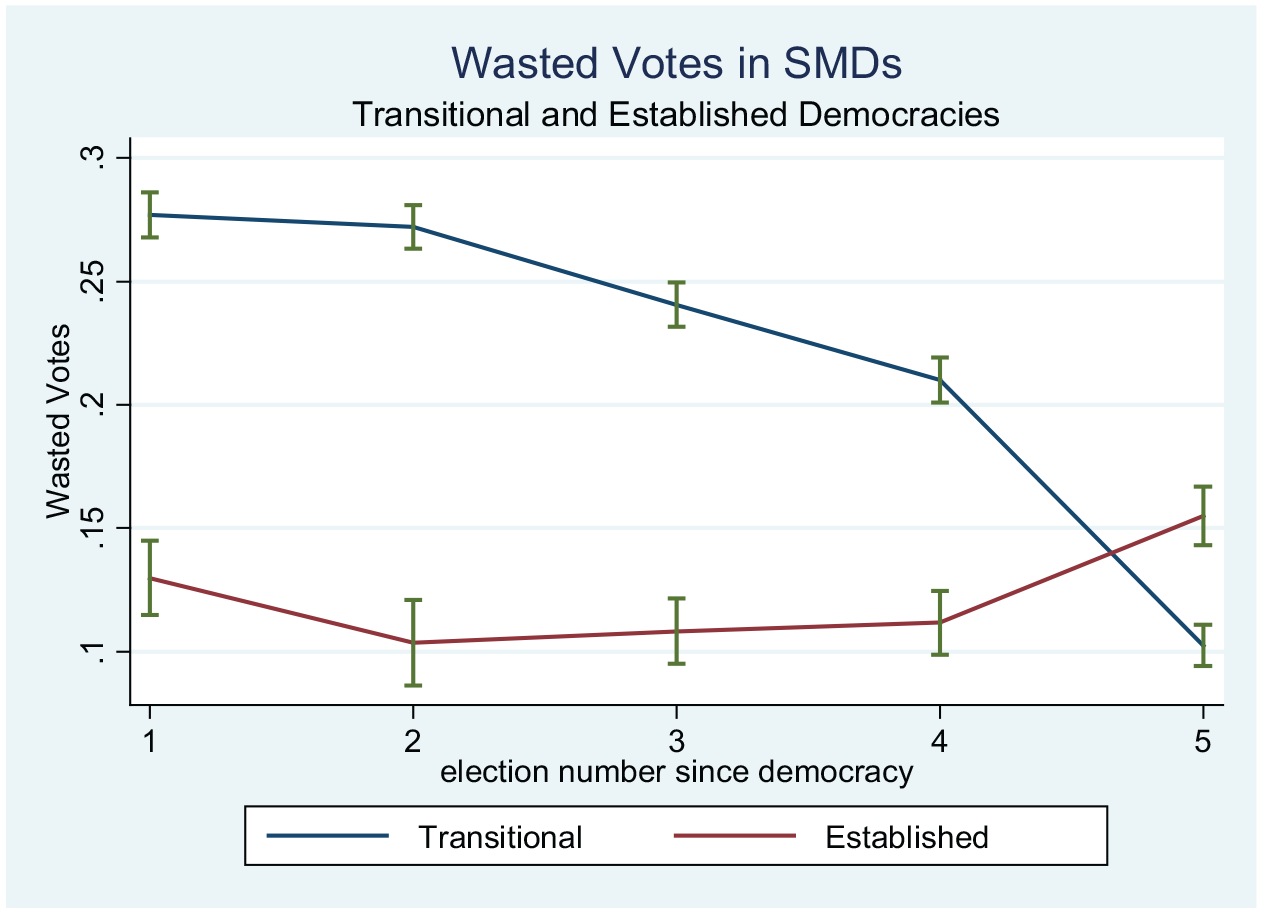
Wasted votes in SMD systems in transitional/established democracies.
The picture is quite different for SMD systems; while countries start with WV close to 28%, they are reduced to almost 10% by their fifth democratic election. This is a level comparable to the established cases, which in the same time period see WV hover slightly above 10%. The figures show that the different rates of change across the two types of electoral systems have a profound effect to the evolution of the party system and indicate that SMD systems may be close to consolidation after only five elections.
Apart from the effect of elapsed elections, some other results are worth noting. The number of candidates leads to an uneven increase in WV. This effect is much more pronounced in SMD systems, where one more candidate leads to a relative increase in WV of around eight percentage points, whereas it only results in an increase of about two percentage points in PR systems. This indicates that the overcrowding of candidates hinders the strategic behaviour of voters much more so in SMDs than in PR.
Summarizing the results, several things need to be noted. First, they support the learning mechanism proposed; fewer WV are cast over time in new democracies, indicating the increasing levels of strategic behaviour of voters. Second, this reduction differs both in absolute and relative terms, between electoral systems. Fewer WV are being cast in SMD countries with each elapsed election; moreover, the decline in WV occurs at almost the double pace in comparison to PR systems. This shows that voters respond to the incentives created by SMD systems and supports the notion that the institutional setting conditions party system evolution.
Third, the learning process moves new party systems towards the levels of WV observed in established cases. In SMD cases, the decline is so fast that by the fifth democratic election the WV levels are directly comparable to established democracies. Last but not least, it is worth highlighting that significant learning occurs in PR systems as well, despite the relatively weak incentives the system creates; voters absorb the information electoral results provide them and update their behaviour, even in environments of increased party supply.
Conclusion
This article maps the phenomenon of new party systems evolution. It proposes an institutional theory of learning; for evolution to occur voters need to gather information from elections, update their beliefs and change their behaviour. The pace of learning depends on the incentives created by the electoral system; restrictive systems, imposing harsh coordination failure penalties, expedite the learning process and accelerate party system evolution.
Analysing voter behaviour via wasted votes, the argument is tested on a district-level dataset. The results provide ample support; voters adjust their behaviour, casting fewer wasted votes over time. Learning occurs across both PR and SMD systems, yet the decline is twice as fast in SMD systems, as voters respond to the institutional incentives. This rapid decline in SMD pushes them almost at par with established party systems. PR systems also evolve, but their progress is slower, leaving ground to cover until they reach their established counterparts.
The institutional effects are of profound importance because they point to an important trade-off. The stability of new party systems may be facilitated by restrictive electoral systems, but this may come at a representation cost. SMD systems allow fewer parties to be competitive and less voices to be represented in the parliament. On the other hand, PR promotes representation but may lead to a protracted period of instability. It is not apparent which would weigh more in the minds of constitutional engineers. If there are concerns about the stability of a nascent democracy it may be advisable to start off with a more restrictive electoral system that can allow for a smoother consolidation process, and then open it up. If several minorities exist a PR system may be preferable; however, in these kinds of democracies, ethnic or religious tensions, combined with a PR system, may be perilous for democratic survival.
Footnotes
Declaration of conflicting interests
The author(s) declared no potential conflicts of interest with respect to the research, authorship and/or publication of this article.
Funding
The author(s) received no financial support for the research, authorship and/or publication of this article.