
Abstract
An increase in the use of postal services to deliver drugs purchased online raises concerns about widening access to drugs markets, especially in remote and rural areas that were previously protected by geographical boundaries. Yet little is known about the geographical patterning of drugs delivered through the post. Using a novel law enforcement dataset containing details of illegal drug packages intercepted by UK Border Force en route to Scotland, we examine the geographical destination of drugs purchased online and explore the area-based characteristics associated with higher rates of delivery. This article provides previously unavailable insights into the spatial patterning of digital drugs markets at sub-national level. We use descriptive statistics, Bayesian hierarchical regression models, and spatial autocorrelation to describe the relationship between area-based characteristics and expected rate of illegal drug consignments identified across Scotland. The majority of intercepted drug packages were destined for urban centres, but there was a higher than expected delivery rate to some of Scotland’s remote and rural locations. Increased rates of drug delivery within Scottish neighbourhoods was independently associated with higher levels of crime and deprivation, with Internet connectivity and with access to services, but not with higher rates of drug-related hospitalization. Analysis of spatial clustering showed that drug delivery to the most remote and rural locations was still associated with good access to services because the packages were typically delivered to addresses in larger settlements within remote locations. Overall, postal drugs delivery reflects both relatively high use in more urban, more deprived areas but also seems to open up more remote regions to drug markets, albeit with usage concentrated in larger settlements within otherwise remote areas.
Introduction
In recent years the use of postal services to transport illegal drugs has expanded substantially, driven by online purchases through surface-net websites, darknet cryptomarkets 1 and, increasingly, social media (European Monitoring Centre for Drugs and Drug Addiction and Europol, 2019: 64). This trend has created concerns about widening access to drugs markets, especially to those living in geographical areas that were previously protected by virtue of their physical remoteness. This is a specific example of a much broader phenomenon of ‘time–space compression’ where Internet access makes places that are physically distant more connected (Dolliver et al., 2018: 45). Previous studies on the geography of digital drug markets have focused on international drugs flows, which, although important, do not help to inform national or local law enforcement and health services, which may find that digital drug markets have differential effects within countries. Currently, little is known about the geographical patterning of digital drugs markets and postal delivery at small spatial scales.
This article uses data from the National Crime Agency (NCA) – a national law enforcement agency in the UK that focuses on, amongst other areas, drugs trafficking and border policing – to analyse the destination of illegal drug consignments en route to Scotland from overseas that were intercepted by the UK Border Force (UKBF). To our knowledge, this is the first time administrative data from a law enforcement agency have been used to understand the spatial patterning of drugs distributed through the postal system. Taking an exploratory approach, we use this novel data source to describe the characteristics of areas within Scotland to which drug packages were destined and to examine regional variation in the expected number of drugs packages per area when controlling for neighbourhood characteristics. We also use spatial autocorrelation techniques to identify geographical clusters with higher than expected numbers of drug packages based on population size and other area-based characteristics.
We find that the majority of drug packages were destined for highly populated urban centres, but also that there was a higher than expected rate of delivery to more remote and rural Scottish locations. Higher drug package rates were independently associated with other drug-related factors, including higher levels of crime and deprivation, but not with higher levels of problematic drug use as measured through drug-related hospitalization. Higher package delivery rates were also associated with greater Internet connectivity, which is a necessary precondition of buying drugs online, and with higher levels of access to services, a proxy for urbanization. We also find that package deliveries within the remote and rural parts of Scotland were highly clustered around their largest settlements. We conclude that the opening up of licit markets through greater Internet connectivity within remote and rural parts of Scotland has probably also facilitated an increase in online drugs purchases, which are then delivered through the post.
Research context
Geography and drug postal delivery
Existing research suggests there are two ways in which the growth of digital drugs markets and the distribution of orders through postal delivery are likely to affect the geography of drug markets. First, digital drug markets change the geographical relationship between drugs users and sellers by connecting purchasers to a global market of providers rather than just local sources. The impact of the Internet on the globalization of market forces means that people have become more connected through ‘time-space compression . . . [defined as] the growing speed of communication and movement of capital worldwide’ (Dolliver et al., 2018: 45; citing Harvey, 1990, and Appadurai, 1996). Emerging platforms, such as social media sites and messaging apps, have served to widen access to online drugs marketplaces (Moyle et al., 2019). Morgan and Mall (2019) argued that the purchase of drugs online, especially via the darknet, has intensified in urban areas because of the expansion in WiFi connectivity, but it is also evident that ‘time–space compression’ has increased cryptomarket use in remote areas that previously had limited or irregular access to local drug suppliers. For example, Ormsby (2016: 64) found that for geographically isolated Australians and New Zealanders some drugs were substantially cheaper on the Silk Road cryptomarket than through other sources. In Scotland, Dibben and Atherton (2010) showed that prevalence of drug misuse in remote areas was lower than would be expected based on a global model estimating prevalence of misuse, arguing that this remoteness acted as a protective factor to reduce the prevalence of drug misuse. However, Freathy and Calderwood (2013) argue that Internet access has fundamentally changed life in the Scottish islands, overcoming many of the difficulties of remoteness that they previously experienced and increasing their access to goods and services. This raises a question about whether the protective effect of remoteness has been eroded by an increase in access to drugs in remote areas through online drugs markets fulfilled through postal delivery, in a similar way to that described by Ormsby (2016). This would accord with recent media reports suggesting that drug use and drug-related deaths have increased in parts of rural Scotland as a result of pills bought online via social media from sources that described themselves as ‘vendors on the dream market [sic]’ (Clements, 2019). 2
Second, unlike other illegal commodities, such as stolen credit card details, drugs ‘are tangible and must be physically transported from the source’ to the purchaser (Dolliver et al., 2018: 46). As a result, digital drugs markets remain deeply tied to geography and postal distribution networks. Parcels shipped internationally must be delivered to a specific address, which poses a law enforcement risk to the purchaser. There is evidence that cryptomarket purchasers often use PO Boxes rather than home addresses as package drop-off points (Schrager, 2015); and they adopt risk reduction strategies to avoid detection, such as using drop-off points far away from work or home addresses, avoiding post offices with CCTV and rotating drop-off points (Aldridge and Askew, 2017). Such strategies may be easy to employ in larger settlements with a large number of eligible drop-off points, but could be problematic in rural communities.
These two features of digital drugs markets – the improved accessibility to global drugs markets and the need to physically transport commodities to purchasers – raise important questions about the geography of the drugs supply through postal services and the characteristics of neighbourhoods and communities that are most likely to use them. In order to answer these questions, however, we need ‘a better understanding of [digital drug markets] “cyber geography”’ and the role of postal delivery in distributing drugs bought online (Dolliver et al., 2018: 63).
To date, interest in the ‘cyber geography’ of digital drugs markets has mostly focused on national or international geography. For example, Norbutas (2018) stated that cryptomarket trade was shaped by continental geographical boundaries; and Demant et al. (2018) emphasized the importance of transactions within the same country, analysing transactions across cryptomarkets as either ‘domestic’, ‘potentially regional’ (for example, within the EU) or ‘international’. However, little attention has been paid to the internal geography of digital drugs markets within countries. For example, it is unclear whether neighbourhoods that receive packages purchased online are more exposed to factors that are known to influence drug use, such as high crime rates, poverty and disadvantage (Lambe and Craig, 2017). Furthermore, it is useful for practitioners and policy-makers who operate at the national or local level to know whether postal deliveries of drugs packages cluster within specific areas or are more generally widespread. A better understanding of these issues could facilitate the development of appropriate responses or interventions, and so this article aims to contribute to this area of policy interest.
Methods for researching digital drugs markets
One reason that within-country geographies of postal drug delivery receive little attention could be that the data sources used to examine online drugs markets are typically not suited to this kind of analysis. Cunliffe et al. identify three types of methods typically used in digital drugs markets research (2019: 2): qualitative methods; surveys; and ‘digital trace’ methods, which involve ‘downloading and organising the content of the live online markets on a regular basis and using this as the basis for analysis’. In both qualitative and survey methods there are understandable problems gaining accurate information about the location of users at a sub-national level, given problems of sampling, sample size and the clandestine nature of the behaviour. Similarly, web-scraping information from vendors’ webpages offers little information on the location of customers at a sub-national level. There is, therefore, a need for different research tools to examine this problem.
To address this issue we use a novel administrative data source capable of shedding light on the sub-national geography of drug delivery in Scotland. Increasingly used for social science research within the UK, administrative data can provide valuable research evidence based on information collected through organizational databases. 3 To study the geography of postal drug delivery in Scotland, we use administrative law enforcement data collected by the NCA. The NCA holds information on illegal consignments of drugs and drug-related commodities (for example, cutting agents) intercepted en route to Scotland by the UKBF. This information includes the content of the intercepted packages, such as the size and type of commodity, and the package’s delivery address.
For this analysis we used the geographical information in the NCA dataset to explore the spatial distribution of drug packages intercepted via the postal service. Using this data source to make inferences about the geography of digital drugs markets rests on the assumption that the sizeable majority of the packages intercepted by the UKBF were purchased online. This assumption is in line with the explanation given by the European Monitoring Centre for Drugs and Drug Addiction and Europol (2019), who link the rise in postal delivery of drugs to the ability to purchase drugs online. In addition, detailed examination of the NCA dataset does indicate that the profile of consignments was similar to that of major cryptomarkets known to be operating during the same period (Matthews et al., 2020), and Van Slobb (2016: 78) suggests that cryptomarkets are the primary driver of an increase in drugs packages identified in the post. Although some of the packages in the NCA dataset may have originated offline, we contend that this is unlikely to be common and that most of the packages in the NCA dataset were online purchases. Further information on this data source and how we used it is provided below.
Research aims and questions
The overarching aim of this article is to examine the sub-national geographical distribution of drugs packages intercepted within the UK postal system. Given the lack of existing research in this area, our approach is primarily descriptive and exploratory. Using the NCA dataset on intercepted illegal drug consignments, we set out to answer four research questions:
Where in Scotland were drugs packages being delivered to?
Was the package delivery rate higher in neighbourhoods that had characteristics known to be related to drug use? 4
Did some Scottish neighbourhoods have a higher than expected rate of package delivery than others, after controlling for factors related to neighbourhood-level drug use?
Was there any additional spatial patterning to package delivery (for example, hotspots) after controlling for area-level characteristics?
In answering these questions, we hope to inform policy-makers and practitioners not only about the geographical distribution of drugs delivered via postal services, but also about how this aligns with other drug-related risk factors and whether there are areas of Scotland that require particular attention or intervention in respect of this issue.
Research design
To answer these questions, we first describe regional differences in the rate of package delivery. Then we examine the statistical relationships across neighbourhoods between a set of variables relating to local-area drug use and the rate of postal drug package delivery. Finally, we assess the extent of spatial clustering in package delivery after controlling for neighbourhood characteristics, and we identify clusters of neighbourhoods with higher than expected rates of drug package delivery.
Scotland as a case study
Although our focus on Scotland is partly driven by data availability, it is well suited for a study of postal drug delivery because drug misuse has been a pronounced social issue in Scotland. In 2018, the mortality rate from drug-related deaths was 3.4 times higher in Scotland than in the rest of the UK (National Records of Scotland, 2019), with the UK itself having one of the highest drugs death rates in Europe (European Monitoring Centre for Drugs and Drug Addiction, 2018). Scotland also has a wide range of geographies, including major industrial cities, small towns with easy access to major population centres, extremely remote villages in the mountainous Highland region, and a large number of islands with varying degrees of remoteness. As a result, people in Scotland have widely different access to, and reliance on, the networks of services and infrastructures through which the drugs supply would have to flow, allowing us to examine the distribution of drugs packages across a wide range of geographies. These factors make Scotland an interesting locus in which to examine the spatial distribution of drugs packages intercepted during postal delivery, but generalizing the results of our Scottish findings to other countries is a matter of judgement that should be based on an understanding of the similarities and differences between Scotland and any intended comparator jurisdiction.
Data
The NCA illegal drug consignment dataset contains information about 1374 packages intercepted between April 2011 and January 2016. The dataset contains information on package destination, size and unit of the commodity, date of seizure, and whether the package was adopted for a controlled delivery. 5 Of these consignments, 27 percent contained cannabinoids, 26 percent were benzodiazepines and 9 percent were MDMA. There was a steady increase in the number of packages per quarter, from around 30 in 2011 to around 95 in 2014, declining slightly to around 85 in 2015. Matthews et al. (2020) provide more detail on the temporal trends in the dataset.
The process for identifying illegal consignments coming into the UK is described in detail by Matthews et al. (2020). In summary, packages being delivered to the UK from overseas come through clearing houses at different airports. Packages suspected of containing illegal drugs are flagged up by parcel handlers or members of the UKBF based on appearance, country of origin and the current intelligence picture of where commodity is being sourced. They are X-rayed and those that raise further suspicion are opened for examination. If a possible illegal substance is detected, a sample is tested using a mass spectrometer and, if it proves to be an illegal drug, the UKBF notifies the NCA.
The NCA data have two important limitations. First, one implication of the selection mechanism by which these packages are identified is that we can study only packages that were delivered from overseas. Users may seek domestic sellers on online markets rather than using higher-risk international shipments (Demant et al., 2018). Therefore, our study does not claim to examine all online drugs purchases or postal drug deliveries in Scotland. Because our interest is in geographical variation in package deliveries, our results could be biased if different regions were likely to have different detection rates, which may bias regional variation in the observed consignment rate. We believe this is unlikely, given that the postal processing centres are, for the most part, centralized in England and parcels destined for all parts of Scotland go through the same centres (staffed by personnel who are unlikely to be alert to specific Scottish addresses). The high volume of parcels that go through central processing hubs make it unlikely that UKBF have scope to factor the destination of a specific package into their decision on whether or not to analyse its contents. 6 Therefore, it is unlikely that any observed difference in the number or nature of package deliveries observed between areas of Scotland was biased by the package identification process.
The second limitation is that the delivery information in the dataset tells us about the intended destination of the package but not necessarily the location of the purchaser. Aldridge and Askew (2017) note that delivery location may not be the same as the purchaser’s home address, because purchasers may be keen to avoid detection. This reflects the reality of how digital drugs markets are used and so is not ‘bias’ in the dataset per se, but we must be careful not to make inferences about the location of users from the location of the package delivery point. Nevertheless, because the address information in the dataset was aggregated to a larger spatial unit, there is a good chance that, in most cases, they were the same.
Research design
We take an exploratory approach to describing the geographical pattern of drug packages delivered into Scotland, using regression models to provide ‘sophisticated descriptions’ (Connelly et al., 2016: 6) of the relationships between drug-related neighbourhood characteristics and package deliveries. These models allow us to identify which of these area-based characteristics are associated with higher rates of package deliveries. Address information in the dataset was aggregated to Scottish datazones. Datazones group together households with similar characteristics (based on the 2011 Census) into areas containing around 500–1000 people, and have been designed to reflect both physical boundaries and natural communities. The largest datazone in Scotland has over 3000 residents, whereas the smallest has around 250.
As our dependent variable, we model the number of drug packages addressed to Scottish datazones calculated as a rate per 1000 datazone residents. Overall, 14 percent of Scottish datazones had at least one observed package delivery. Information on the resident population was drawn from the 2011 Census. Six independent variables were included in our regression models. These are described and explained below.
Estimated Internet use
Purchasing drugs online requires Internet access. Morgan and Mall (2019) noted that Internet connectivity was driving a higher prevalence of drug use in urban areas, so we include estimated Internet use to determine whether intercepted drug packages simply reflect greater connectivity. Blank et al. (2018) calculated small area estimates of Internet use in Scotland using the 2013 Oxford Internet Survey and 2011 UK Census. We aggregate these estimates to datazone level to provide comparable geographies to the consignments data. Blank et al. (2018) suggest that there is no systematic geographical pattern to Internet use across the UK once demographic factors are controlled for. For this reason, this variable also acts as a proxy of the demographic structure of each datazone.
Deprivation
Neighbourhood deprivation is associated with higher rates of drug misuse (Morgan and Mall, 2019) so we test whether intercepted drug packages are a function of deprivation. The Scottish Index of Multiple Deprivation (SIMD) is the primary area-based measure of deprivation in Scotland. It is constructed from multiple indicators across six domains: education, employment, income, crime, health and geographical access to services. Each datazone in Scotland is ranked according to a number of measures within each domain, and these ranks are combined to create the overall Index. We have coded this variable so that higher values mean higher deprivation levels.
Crime rate
Drug misuse is also associated with neighbourhood crime rates (Morgan and Mall, 2019), so we use the SIMD crime domain as a measure of local-area crime rates. Again, this variable ranks datazones by crime rate (based on domestic housebreaking, drug offences, common assault, crimes of violence, vandalism and sexual offences), and we have coded the variable so that higher values mean a higher crime rate rank.
Drug-related hospital admissions
Drug-related hospital admissions (DRHA) reflect serious drug misuse in an area, so we include this in our models to determine whether serious drug use is associated with postal drug delivery. We measure DRHA as the European age–sex adjusted hospitalization rate based on drug-related admissions, again taken from the SIMD.
Urbanization
Morgan and Mall (2019) suggest that online drug market use is higher in urban localities, although media reports suggest it is causing problems in rural Scottish communities (Clements, 2019). To assess whether drug packages are more likely to be delivered to urban or rural areas, we use the Access to Services ranking scores from the SIMD, which measures level of accessibility to public services in a given area. Taking account of the financial cost, time and inconvenience to the public of accessing vital services, the SIMD Access measure is the Scottish Government’s primary indicator of deprivation based on rurality. Importantly this score captures accessibility of post offices, which are crucial in purchasing drugs online. In a broad sense Access SIMD is a measure of urbanization, and includes access to the kind of amenities that may facilitate digital drug market use based on the strategies outlined by Aldridge and Askew (2017). A higher value on the Access SIMD rank, the more easily, quickly and cheaply people living in a given datazone can access basic services and facilities. Because it is measured at the datazone level, Access SIMD tends to be higher in cities, but it can also be high in the centre of small settlements that have good amenities.
Local Authority
We use Local Authority (LA) boundaries to account for regional differences across Scotland. LAs are regional administrative units in Scotland. There are 32 LAs, which vary substantially in both geographical coverage (from 26 to over 12,000 square miles) and population (from around 20,000 people to over 600,000). Datazones nest within LA boundaries, with the number of datazones within an LA ranging from 29 in the Orkney Islands to almost 750 in the City of Glasgow. LA boundaries capture differences between areas such as the four largest urban centres (Glasgow, Edinburgh, Dundee and Aberdeen) and keep together groups of small islands (for example, the Shetland Isles, the Orkney Islands and the Western Isles). As such, LA acts as a proxy for the geographical features of remoteness and access to land-based drugs markets at a higher spatial scale than the datazone-level SIMD measure of Access. For example, a datazone in a small town in a remote island LA may have good access to the amenities on the island and so rank highly on SIMD Access. Therefore, including LA in the model alongside Access allows us to understand differences between parts of Scotland at this higher level of geography. Our independent variables are measured over differing time periods: estimated Internet use combines data from 2013 and 2011, our deprivation measure synthesizes data from between 2011 and 2015, our urbanization measure uses data from 2015, our crime measure from 2014/15 and DHRA from 2011 to 2014. We interpret these as measures of the conditions in each datazone for the whole observation period. It is a limitation of the analysis that these measures do not all cover the same time period, which prevents us from exploring temporal change in package deliveries in this analysis. However, we are constrained to work with the available data, and the SIMD variables we have used tend to be stable over time; the correlations between these measures and their equivalents in the 2020 SIMD ranged from 0.74 for DRHA to 0.98 for overall deprivation.
Model fitting and specification
We used a negative binomial (NB) regression model to describe the relationship between package identification rate and our independent variables. In the fitted model the estimated dispersion parameter indicated a substantial amount of over-dispersion, 7 suggesting that NB is more suitable than a Poisson model. We prefer the NB model to a zero-inflated model on theoretical grounds; the latter would assume that there were ‘structural’ zeros in the dataset – datazones that could never have package orders – which we do not believe is a plausible assumption. We started with a model with no covariates (Model 1), then included the covariates discussed above but with no geographical information (Model 2), and finally added the LA random effect (Model 3). We then tested the residuals from Model 3 for spatial autocorrelation and, after finding significant evidence of spatial autocorrelation, added a spatially lagged dependent variable to the model (Model 4). 8 We tested for multicollinearity amongst our independent variables and found that all had variance inflation factors under 5.
By including LA as a random effect we allowed the model to adjust estimates for different LAs, which can capture differences in package delivery between areas due to factors not included in the model. Because each datazone nests within only one LA this is a hierarchical model – every datazone nests within one LA. Our model specification lets the model pool information between LAs, which can prevent over-fitting the model in LAs with small numbers of datazones (McElreath, 2016). To examine variation in package delivery rates across LAs we calculate Marginal Effects at the Means (MEMs) for each LA. This value compares the estimated package delivery rate for a hypothetical datazone in each LA with the characteristics of the average Scottish datazone.
Spatial autocorrelation
To estimate spatial autocorrelation in the model residuals we conducted a Global Moran’s I test (Bivand et al., 2013) on the raw residuals from Model 3 (that is, the difference between the model’s expected number of packages for a given datazone and the observed number of packages in that datazone). We calculated the statistic using a permutation test with 10,000 iterations. 9 This test gave strong evidence that there was additional clustering in package receipt even after controlling for the independent variables in Model 3 (see Appendix 2). To account for this autocorrelation we include a spatial lag of our dependent variable by calculating the average number of packages received in the datazone’s neighbours. 10
After fitting our regression model using the spatially lagged dependent variable (Model 4), we examined additional local spatial autocorrelation in the model residuals using the Local Moran’s I measure. Local Moran’s I identifies areas with high values next to other areas with high values (in this case, areas with observed package counts higher than those predicted by the model). We can use Local Moran’s I to identify ‘interesting observations’ 11 with additional spatial clustering in package delivery even after we have controlled for the neighbourhood factors we expect to be associated with drug consumption and the general tendency of packages to cluster together. This lets us gain a qualitative assessment of where these areal clusters (with a consistently higher number of packages identified than estimated by our statistical model) are, which we cannot get from the analysis of global spatial autocorrelation. Again, these observations must be interpreted with care given that apparent spatial autocorrelation can arise owing to model misspecification (Bivand et al., 2013).
Results
Descriptive statistics
Table 1 shows descriptive statistics for the variables analysed. For each independent variable we report the mean, standard deviation and 5, 25, 50, 75 and 95 percentiles of the variables on their original scales. All variables were scaled and centred before model fitting, giving them mean 0 and SD 1. For the dependent variable we also show the Gini coefficient (G), the adjusted Gini coefficient (G’, Bernasco and Steenbeek, 2017) and the proportion of datazones that received 50 percent and 25 percent of all packages. These measures are common ways to describe the concentration of crime events across locations. For G and G’, numbers closer to 1 show increasing crime concentrations, with the latter adjusted for scenarios where there are fewer events than locations, as in this study. The 50 percent and 25 percent figures are in line with typical crime concentration values (Weisburd, 2015), with 25 percent of all packages deliveries occurring in roughly 1 percent of datazones, and 50 percent occurring in around 4 percent of datazones. The discrepancy between G and G’ shows that some of the concentration of package orders amongst a small number of datazones is due to the small number of package orders relative to datazones. Although over-dispersion is a feature of a statistical model rather than the data, this concentration hints at the value of modelling package orders using an NB model to account for the concentration of packages in a small number of datazones.
Descriptive statistics.
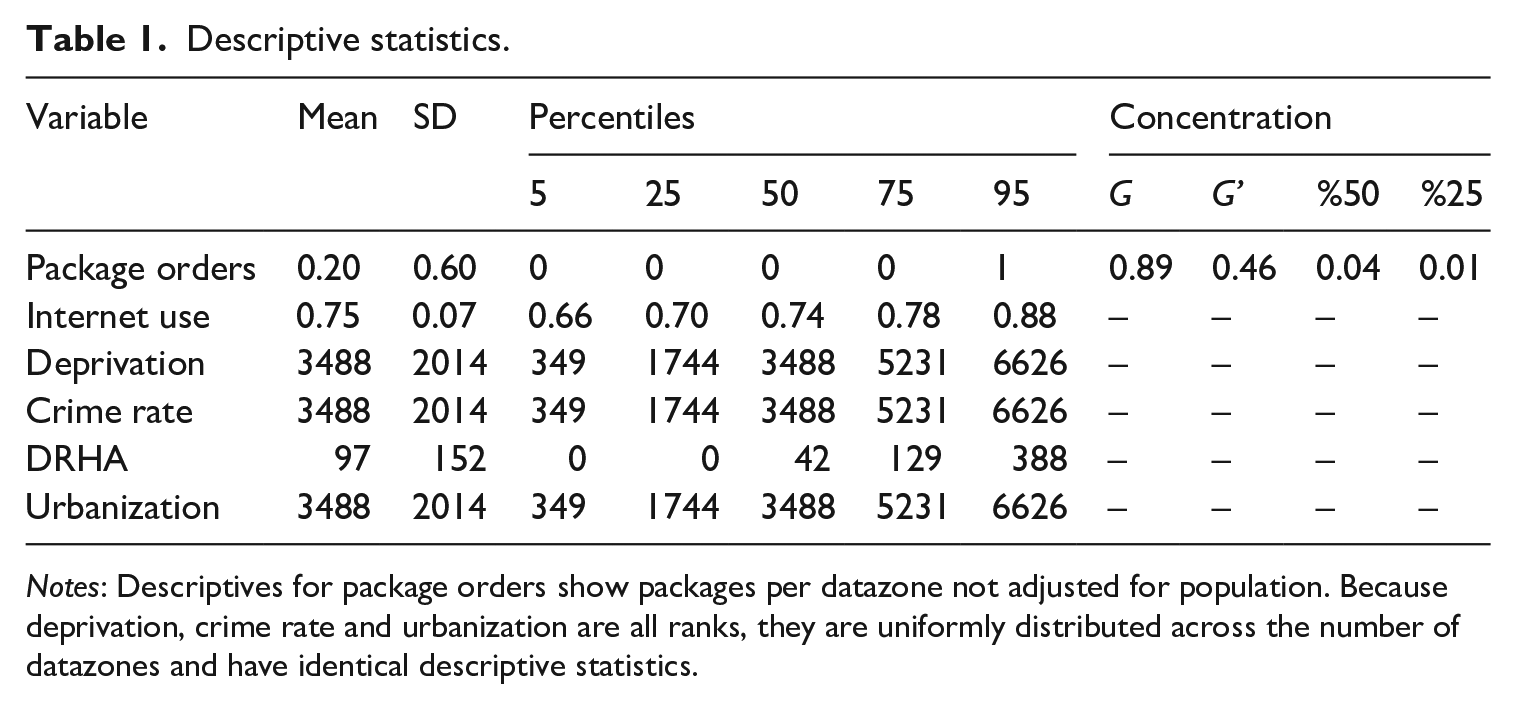
Notes: Descriptives for package orders show packages per datazone not adjusted for population. Because deprivation, crime rate and urbanization are all ranks, they are uniformly distributed across the number of datazones and have identical descriptive statistics.
The geography of drug package delivery in Scotland
Our first research question asked where in Scotland drugs packages were being delivered to. Figure 1 shows the number of packages per 1000 population at LA level. Lighter colours in the figure indicate higher rates. On the left, the y-axis is ordered by the total number of packages identified per LA, and the point sizes are proportional to the LA population. The rate of drug packages is shown both on the x-axis and as the colour of the points. On the right, the same data are presented on a map of Scotland, with the LA package rate differentiated by colour across the LAs. Three-quarters (24) of the LAs had fewer than 50 packages intercepted, whereas three had more than 100. In general, package delivery rates were higher in more populated LAs, especially Scotland’s four main urban centres (Glasgow, Edinburgh, Aberdeen and Dundee) and lower in more remote, rural and sparsely populated areas. However, there were some notable exceptions. The Western and Shetland Isles had a much higher rate of packages per capita (the second and fifth highest rates, respectively), though a lower overall number of packages, than other LAs. The relatively high package delivery rate in these island LAs provides an initial indication that postal delivery may be facilitating access to drugs in remote areas.
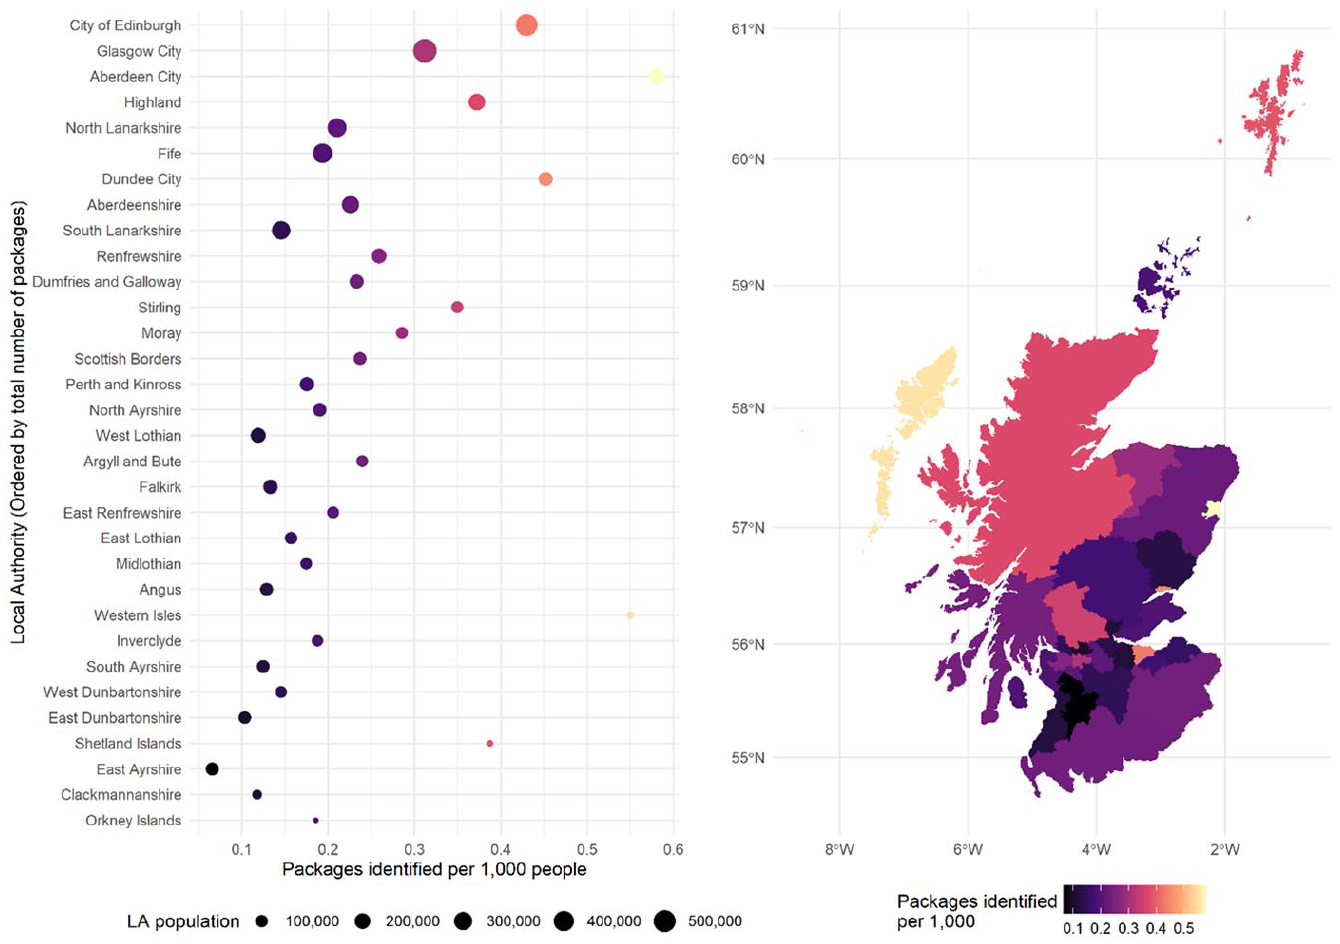
Rate of packages received by Local Authority.
Area-based characteristics associated with drug package delivery
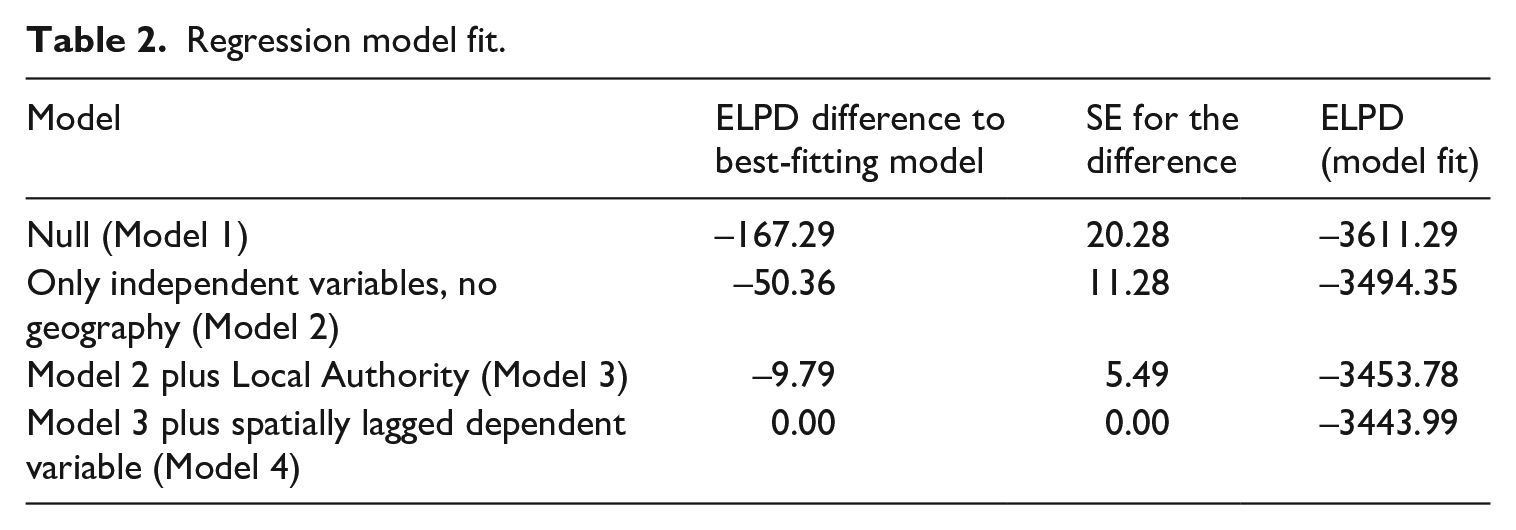
Our second and third research questions concerned whether the package delivery rate was higher in areas with characteristics related to drug use and across different parts of Scotland. These questions were answered using our regression models. Table 2 summarizes the model fit, comparing each model to the best-fitting model and providing a standard error for the difference. Expected log predictive density (ELPD) provides an overall measure of model fit, with values closer to zero showing better model fit. Adding the explanatory variables (Model 2) increases the fit of the model substantially over the null model, and including the LA random effect (Model 3) improves model fit still further. 12 Adding the spatially lagged dependent variable (Model 4) improved model fit only marginally over Model 3, but we present the results for this model because the spatial lag variable was statistically significant. (See Appendix 1 for model fitting diagnostics.)
Regression model fit.
The results for each explanatory variable are presented in Figure 2. Two sets of parameter estimates are shown: the ‘unadjusted estimates’ represent the univariate strength of association between each covariate and the drug packages rate; 13 and the ‘fully adjusted estimates’ represent the strength of association between each covariate and the dependent variable in Model 4. This allows us to assess the potential importance of each explanatory variable before and after the other variables are taken into account and, therefore, which remain significant even in the presence of the others.
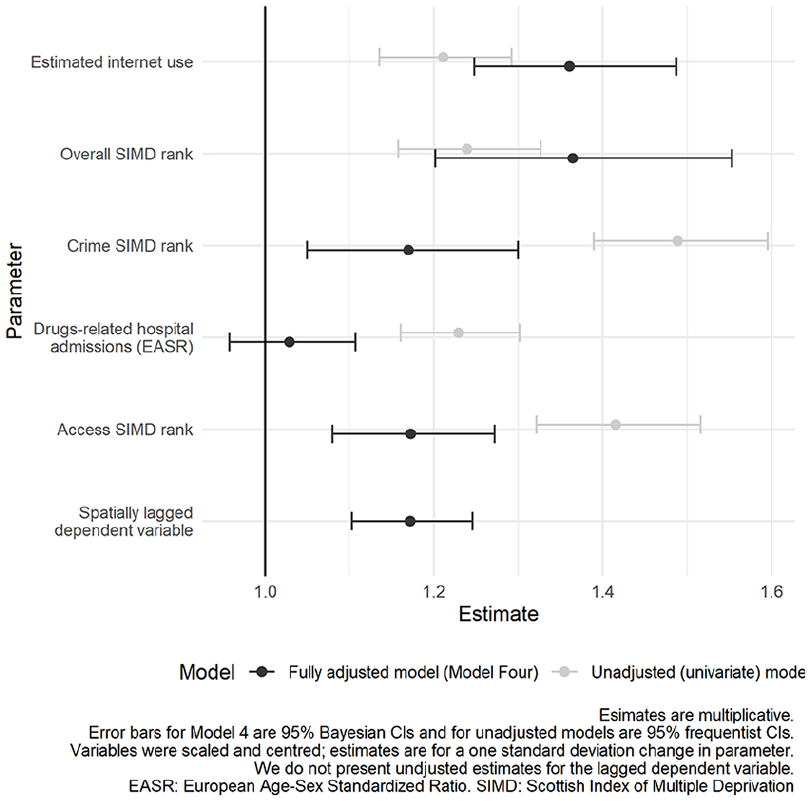
Estimated associations between independent variables and package delivery rate.
Looking first at Internet use, there is a significant and positive univariate association between the estimated level of Internet use within datazones and the package delivery rate. When the effect of Internet use is estimated alongside the other covariates, the strength of this association increases. This indicates that, even when taking account of a range of other drug-related and geographical factors, a higher level of Internet connectivity within datazones predicts greater rates of package delivery. The strength of this relationship provides support for our assumption that the packages in our dataset were most likely purchased online.
There was a positive association between both the overall SIMD rank and the crime rank with package deliveries. This suggests that the higher a datazone is on both of these ranking scales (that is, the more deprived it is and the higher its crime rate) the more likely it is to receive package deliveries. This aligns with the findings of other studies that found substance use was associated with neighbourhood deprivation (for example, Lambe and Craig, 2017). Once the other factors were taken into account, both factors remained independently important within the model. The strength of the association with the crime SIMD rank reduced but remained significant whereas the effect of the overall SIMD rank increased slightly, giving some evidence that the level of social disadvantage and deprivation has a stronger conditional relationship with postal drug delivery.
Univariate analysis found a positive association between the rate of DRHA and package delivery. This fits with the hypothesis that higher rates of package deliveries are likely to be associated with higher rates of serious drug use within neighbourhoods. However, in the presence of the other explanatory variables, there was no significant relationship between DRHA and package delivery. It is possible that this could indicate a different pattern or scale of drug consumption between drugs purchased online and delivered through the post and those purchased through other supply chains. It may also reflect the fact that most of the drug packages intercepted by UKBF contained a relatively small amount of the commodity (as discussed by Matthews et al., 2020) and, therefore, the consignments in our dataset are of quantities too low to impact significantly on DRHA.
The Access SIMD rank, our proxy measure of urbanization, had a positive association with our dependent variable, which remained even when controlling for other factors. This suggests that the higher a datazone is on the Access SIMD ranking (that is, the more easily, quickly and cheaply people living there can access basic services and facilities), the higher the package delivery rate. This fits with Morgan and Mall’s (2019) contention that online drug market use is higher in more urban areas.
Including the spatially lagged dependent variable in the model had a positive effect, suggesting positive spatial autocorrelation. In other words, a high rate of package delivery to one datazone was associated with a higher rate of package delivery to neighbouring datazones, all else being equal. This indicates a general tendency for package deliveries to cluster, even after controlling for neighbourhood characteristics (which themselves are spatially patterned).
The estimated LA effects are presented in Figure 3, which shows the MEM for each LA. The average MEM for Scotland as a whole was 0.21 package deliveries per 1000 people, represented by the dashed lines on the left-hand plot. However, Figure 3 shows considerable variation in MEMs between LAs. The top six estimates were all in the most northerly parts of Scotland, with the Highlands and Aberdeen City being significantly above average. Although low in absolute numbers, Highland LA had a mean estimated package rate of around 0.36 per 1000 people, more than 50 percent higher than that for Scotland as a whole. These results answer our third research question: there is strong regional variation in the package delivery rate across Scotland, even after controlling for other area-based characteristics. Although the Orkney Islands are an exception, the fact that the highest MEMs include some of the most remote and rural LAs does suggest that these regional differences may partly be due to their geographical positioning. Given that the LA measure in the model reflects all differences between LAs, we must be tentative in attributing these effects solely to geographical differences between LAs.
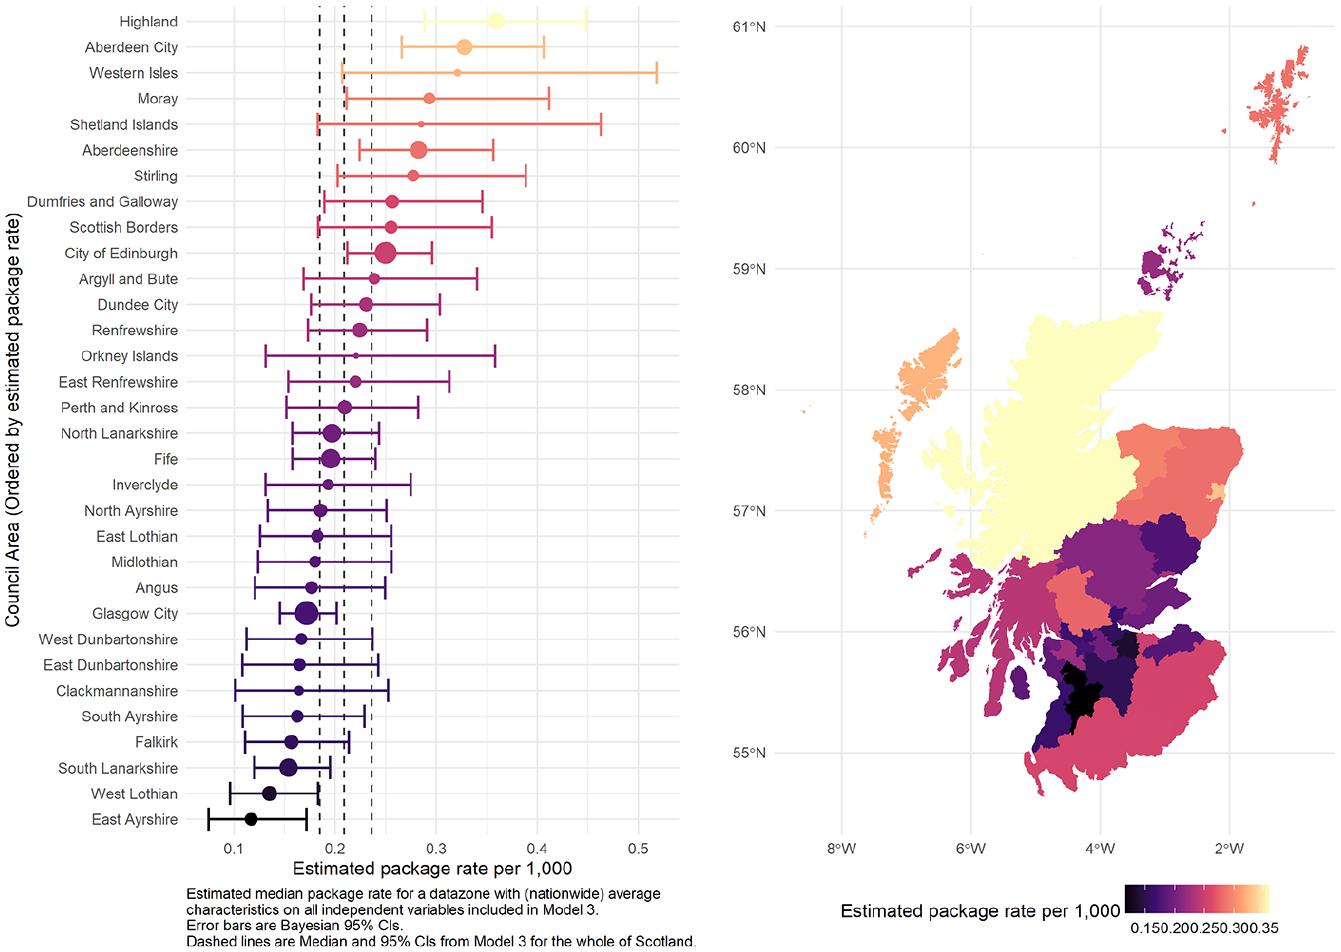
Estimated package rate for an ‘average’ datazone in different Local Authorities.
The spatial patterning of drug packages
Our final research question concerned whether we could determine any specific clusters of areas with higher than expected rates of package delivery, after controlling for area-based characteristics and the global tendency towards clustering identified by the Global Moran’s I test. To answer this, we conducted a Local Moran’s I test on the residuals from Model 4. 14 Each datazone with an ‘interesting’ value 15 is mapped in Figure 4. In total we found 44 datazones forming clusters of neighbourhoods with higher than expected package delivery rates. So there do appear to be clusters of high package delivery rates once we have accounted for factors related to Internet use, deprivation, crime rate, serious drug use, urbanization and geography. Seven of these datazones were in the predominantly urban LAs of Glasgow, Edinburgh and Aberdeen, five in Highland LA and the rest are dispersed across LAs. The high number of hotspots in the cities may reflect the fact that there are more datazones in general within these urban LAs. 16 There may also be a bias towards finding clusters of high package delivery rates in cities, given that urban datazones tend to have more neighbours and multiple datazones can form a single contiguous unit, perhaps reflecting a single cluster of package deliveries in the real world that is not well captured by datazone boundaries. It may also be that these clusters reflect a general tendency to observe clusters of social characteristics in urban areas rather than in rural areas. In spite of these caveats, we can draw two general conclusions from Figure 4. First, clusters in the Western Isles and Highlands are illustrative that the high MEMs for these LAs are not evenly dispersed across these remote areas but rather are clustered in particular locations. For the Western Isles, this clustering is in the largest settlement, and four of the five datazones identified in the Highland LA are also in larger settlements. Second, our observation of clustering both within large cities and also in small settlements in remote areas may indicate that there are spatial processes affecting package delivery at varying spatial scales (Bivand et al., 2013: 286).
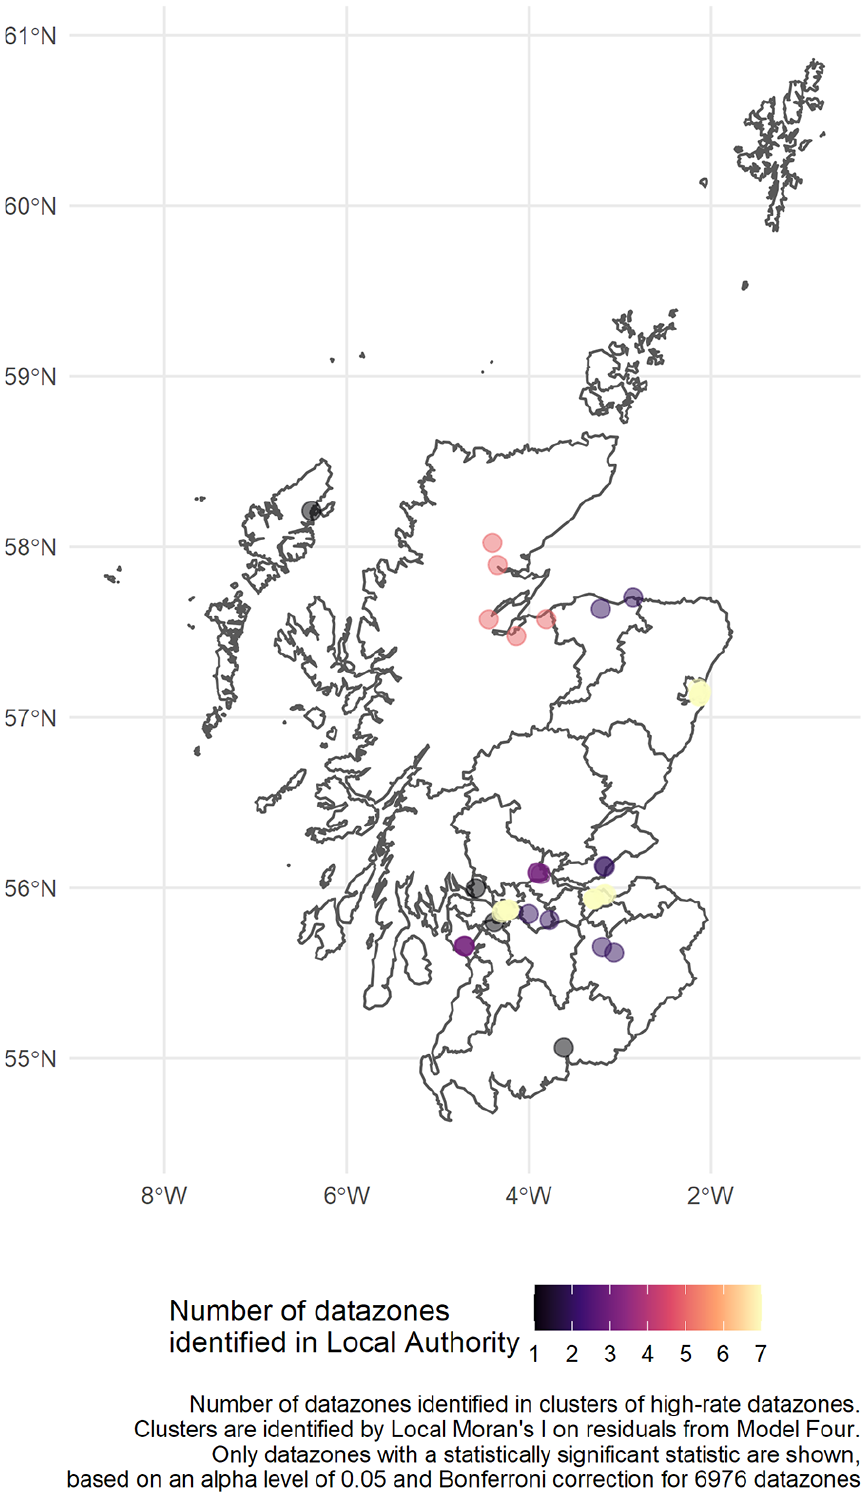
Clusters of datazones with a higher than estimated number of packages observed, based on Model 4 residuals.
Discussion and conclusions
These results present an interesting, albeit complex, geographical picture of the postal supply of drugs within Scotland and highlight the potential of administrative data to explore the impact of digital drugs markets.
Like other studies that have examined area-based factors related to drug use, we found strong relationships between deprivation, crime and package deliveries. Many of these drug packages were destined to end up in areas already affected by a range of social and economic problems. We also found a strong association between Internet connectivity and package delivery, as suggested by Morgan and Mall (2019). Although this makes sense, because the use of online drugs markets requires Internet access, Anderson and Whalley (2015) note that Internet connectivity is not evenly spread across areas and there is a strong socio-economic dimension to this. Specifically, they found that Glasgow (a city with significant levels of poverty and inequality) had lower than average Internet adoption, and that public libraries were often used to plug this gap. We find it plausible that package deliveries associated with digital drugs markets may be greater particularly in more deprived and crime prone areas, specifically those that have better broadband and WiFi connectivity. This may also be a function of the demographic profile of those who purchase drugs online. Matthews et al. (2020) suggest that most of the parcels in this dataset contained small amounts of drugs that were most likely for personal use or non-commercially motivated supply. The fact that we found no relationship between areas with drug-related hospitalizations (an indicator of serious drug use) and intercepted drug packages in our final model suggests that postal delivery is mainly used by personal users or those who supply others to a very small degree.
Our finding that the package delivery rate was greater in more urbanized areas, as measured by access to services, aligns with Morgan and Mall’s (2019) research. In contrast, the LAs with the highest MEMs were not necessarily the most urbanized. Indeed, the six LAs with the highest estimated drug delivery rates included only one city (Aberdeen, which has a smaller population than Glasgow and Edinburgh) and were all in the most northerly parts of Scotland, which are characterized by their remoteness and rurality. This resonates with media reports of online drugs purchases being a particular issue in rural parts of Scotland (Clements, 2019). The higher than average drug delivery rates to such remote LAs suggest that, although Internet connectivity, urbanization and social disorganization are important factors in predicting postal drugs delivery, physical geography is also important. A plausible explanation for this is that the Scottish islands’ increased access to licit online markets (identified by Freathy and Calderwood, 2013) has extended equally to illicit markets. This may be because widespread use of legal e-commerce services in remote areas makes their residents disposed towards online ordering in general and, hence, those tempted to purchase drugs have picked up this aspect of the ‘crime script’ more readily (Hutchings and Holt, 2015). We find it plausible that postal drug deliveries to the Highlands and Islands of Scotland are partly a function of lack of proximity to traditional drug markets, which operate in larger conurbations and are most easily accessed in the most populated Central Belt of Scotland.
There is an apparent contradiction between the findings that postal drug deliveries are more likely to be destined for urbanized localities but also to some of Scotland’s most remote and rural areas. Our analysis of clusters of higher than expected package rates goes some way to explaining this inconsistency; higher than expected drug delivery rates to remote areas seem to be clustered within larger settlements. The clustering we identified may also indicate that ‘time–space compression’ has not completely removed the effects of remoteness on package delivery. In other words, drug delivery to even the most remote and rural locations is still associated with good access to services because drugs are typically delivered to addresses in larger settlements within remote locations. This may reflect higher usage of online drugs markets by people who reside in these larger settlements within remote areas, either because the people who purchase drugs are more likely to live in larger towns, or because access to amenities in these larger settlements facilitates the necessary precautions of remaining anonymous when buying drugs online. Alternatively, purchasers from more remote areas may use PO Boxes or other central delivery points to collect their mail, potentially as a means of avoiding suspicion or detection, as suggested by Aldridge and Askew (2017). Our research is exploratory and we cannot determine the extent to which locations reflected delivery or usage, but we suggest that this is a fruitful area for further research.
Our results are of importance to policy-makers and practitioners in health and law enforcement. There is an ongoing debate as to whether digital drugs markets will increase or reduce harms related to drugs misuse (Aldridge et al., 2018). One implication of our analysis is that any impact of digital drugs markets on drug harms may vary geographically, and that increased accessibility to drugs could cause disproportionate harm to at-risk populations in more isolated areas who may previously have experienced a protective effect of remoteness in reducing harms from substance misuse (Dibben and Atherton, 2010). This has implications for the geographical distribution of support services available to drug users, which may need to change to reflect changing consumption patterns. That said, in our multivariate model there was little evidence of an association between package receipt and DHRA, and Matthews et al. (2020) show that most of the packages identified in the NCA dataset were small. As a result it remains an open question as to what extent a high prevalence of drug packages intercepted en route to a given area is related to high levels of harm due to substance misuse in that area. Nevertheless, this article has identified some initial avenues of exploration for informing law enforcement action around drugs supply through the postal service. The strong degree of geographical clustering in postal drugs supply could help to inform preventative and enforcement strategies, for example. The administrative data used for this analysis could also be used to identify the effects of police interventions, such as controlled deliveries (Cutting, 1983). This is beyond the scope of the current article but would offer a new perspective on tactics to disrupt the flow of drugs through the postal system that would be of benefit to many local practitioners.
There are of course limitations to our analysis. For example, the data source used does not allow for a reliable prevalence estimate of the international drugs supply into Scotland through shipments or via the domestic postal services. As with any quantitative analysis, our results relate to the time period covered by the data, and we should be cautious in generalizing our results beyond that time period. Our results are also specific to Scotland’s geography and so they may not generalize well to other countries, although they may be of interest to other jurisdictions with similar extremes of urbanization and remoteness. However, our findings certainly agree with Dolliver et al. (2018) in suggesting that growth in the capacity to buy drugs online and have them delivered through the post has important implications for the geography of the drugs supply – at both international and local levels.
Footnotes
Appendix 1: Regression model fit
Diagnostic checks of Model 4 showed that Rhat was close to 1 for all parameters, suggesting that the model’s input Markov chains had converged appropriately (Betancourt, 2017). None of the model parameters have an effective sample size less than 10 percent of the total sample size, and parameters have a Monte Carlo standard error greater than 10 percent of the posterior standard deviation. Pareto K diagnostics showed no overly influential values, with all values lower than 0.7. Predictive plots showed a good relationship between the observed data and predictions based on the model (see Figures 5 and 6).
Appendix 2: Spatial autocorrelation
A Global Moran’s I test on the residuals from Model 3 produced the distribution shown in Figure 7 of test statistics from 10,000 permutations. This shows very strong evidence of spatial autocorrelation in Model 3.
Acknowledgements
We thank Dr Stewart Weatherley and the National Crime Agency for providing the study data and for many helpful discussions about the analysis. We thank the eDRIS team at Public Health Scotland, and particularly Anthea Springbett, Dave Stobie, Amy Tilbrook, Brian Murray, Suhail Iqbal, Julian Augley and Fiona James, for facilitating data access via the National Safe Haven. We thank Dr Chris Playford for his role in negotiating data access. We thank colleagues at the University of Edinburgh School of Law and Alex Stevens for their helpful comments on an earlier draft of this article. Finally, we thank the anonymous reviewers for their careful reading of the article and their constructive comments and suggestions.
Authorship contribution statement
Ben Matthews conceptualized the study, led the analysis of data, and wrote and revised the manuscript. Ben Collier wrote and revised the manuscript. Chris Dibben and Susan McVie conceptualized the study, obtained study funding and revised the manuscript. All authors read and approved the final manuscript.
Funding
The author(s) disclosed receipt of the following financial support for the research, authorship, and/or publication of this article: Ben Matthews, Chris Dibben and Susan McVie were funded through Economic and Social Research Council (ESRC) grant ES/L007487/1 (Administrative Research Data Centre – Scotland). Ben Matthews and Susan McVie were also funded through ESRC grant ES/P009301/1 (Understanding Inequalities). Susan McVie and Chris Dibben were also funded through ESRC grant ES/S007407/1 (Scottish Centre for Administrative Data Research). Ben Collier was funded through Engineering and Physical Sciences Research Council (EPSRC) grant EP/M020320/1.