
Abstract
Understanding victimization inequality is crucial to addressing questions of fairness and justice in exposure to crime. A growing body of research has considered how the global crime drop has affected the distribution of victimization. These studies primarily aim to understand whether different social groups have benefitted equally from overall reductions in rates of victimization; however, much of the existing research is limited by three key methodological shortcomings. Firstly, studies often compare only two discrete points in time, rather than describing dynamic changes in victimization. Secondly, researchers typically focus on either ‘unadjusted’ estimates of victimization (which measure differences between groups without taking account of any other characteristics) or ‘adjusted’ estimates (which take account of additional characteristics), but rarely both, giving only a partial picture. Finally, few studies of victimization inequality account for uncertainty in the victimization estimates which are inherent in analyses of crime survey data. This paper addresses these shortcomings by applying a robust, simulation-based approach to estimating and visualizing temporal change in both unadjusted and adjusted indicators of victimization inequality using ten sweeps of data from the Scottish Crime and Justice Survey between 2008/2009 and 2021/2022. Our analysis focuses on nine socio-demographic variables which include individual, household and community characteristics. While the results show reductions in victimization rates within all groups studied, there was clear evidence of victimization inequality between groups. Moreover, the extent of victimization inequality and how it changed over time varied considerably depending on whether adjusted or unadjusted estimates were used. Overall, rising victimization inequality was most strongly associated with ethnicity, disability and financial hardship. We argue that our methodological approach provides a more nuanced and informative perspective on stability and change in victimization inequality than previously considered, which has important implications for both criminological theory and policy development.
Introduction
Since their introduction in the 1970s, national victimization surveys have shown that some groups are more likely to experience crime than others (Wolfgang and Singer, 1978). There has been renewed interest in this topic in the context of the global crime drop (Hunter and Tseloni, 2025; van Dijk and Tseloni, 2012) with several studies showing that reductions in victimization benefited some people more than others (e.g., Hunter and Tseloni, 2016; McVie et al., 2020; Pease and Ignatans, 2016; Thacher, 2004). Having a good understanding of victimization inequality is vital from a policy perspective because it can inform and support the development of primary, secondary and tertiary crime prevention measures aimed at tackling enduring, increasing or hidden inequalities (McVie et al., 2020). It is also important for theoretical advancement, as it poses fundamental questions about the extent to which changing patterns of social order are fair or just (see Ignatans and Pease, 2015a; Rawls, 1999). Nevertheless, equality can be conceptualized and defined in different ways, which has implications for how it is measured and interpreted, and what it means from a justice perspective (see Hunter and Tseloni, 2016).
The existing literature on victimization inequality in the context of the crime drop includes two main types of study which differ based on how they conceptualize inequalities (see Matthews and McVie, 2025). The first type focuses on ‘concentration’ effects in the wake of the crime drop and looks at the overall distribution of crime across the population. This typically shows that crime risk has become more concentrated amongst repeat victims (see, e.g., McVie et al., 2020; Pease and Ignatans, 2016; Suzuki et al., 2024). The second type focuses on ‘contrasts’ to determine whether falling crime has resulted in more or less inequality between specific socio-demographic groups. Studies of this type have identified changes in victimization inequality based on a range of socio-demographic characteristics, including age and sex (Dinisman and Moroz, 2016a, 2016b; Ganpat et al. 2022; Heimer and Lauritsen, 2008; Herranz de Rafael and Fernandez-Prados, 2019; Lu et al., 2023), income level (Grove et al., 2012; Levitt, 1999; Nilsson and Estrada, 2006; Thacher, 2004), household tenure or composition (Grove et al., 2012; Hunter and Tseloni, 2016), ethnicity (Hunter and Tseloni, 2016, 2025) and urbanicity (Herranz de Rafael and Fernandez-Prados, 2019; Hunter and Tseloni, 2025; Kaylen et al. 2017).
While the body of literature on contrasts in victimization inequality has provided valuable insights, the number and types of characteristics examined varies widely across studies, the results are sometimes inconsistent or inconclusive, and there are still significant gaps in knowledge about who has benefited most from the crime drop. There are also three methodological limitations within the existing studies. First, conclusions about stability or change in victimization inequality are mostly drawn from comparing just two discrete time points rather than using repeated sweeps of data to measure dynamic change over time. As McVie et al. (2020) have argued, failure to take advantage of repeated sweeps of survey data risks misunderstanding the true nature of change in the distribution of victimization over time. Second, most existing studies are based on either unadjusted or adjusted estimates of victimization inequality, but rarely both. Matthews and McVie (2025) contend that distinguishing between unadjusted estimates (which measure differences between groups without taking account of any other characteristics) and adjusted estimates (which take account of additional characteristics) is of crucial importance, not just from a conceptual and methodological point of view but, from a justice standpoint since understanding inequality holistically is vital to determining the most appropriate policies and interventions to reduce it. And third, few studies of victimization inequality account for uncertainty in the victimization estimates which are inherent in analyses of survey data. According to Matthews and McVie (2025), assessing whether any observed changes are consistent with random chance is vital in terms of determining methodological rigor in any field of social statistics.
This paper addresses these limitations by applying a robust, simulation-based approach to estimating and visualizing temporal change in both unadjusted and adjusted measures of victimization inequality across a range of individual, household and area characteristics. Using 10 sweeps of self-reported victimization data from the Scottish Crime and Justice Survey between 2008/2009 and 2021/2022, we compare and contrast stability and change in victimization inequalities across nine commonly studied socio-demographic characteristics. Our results show clear evidence of a reduction in victimization in Scotland for all socio-demographic groups over this period; however, patterns of victimization inequality vary considerably. Comparing unadjusted and adjusted estimates provides a more nuanced and informative perspective on stability and change in victimization inequality than previously considered. We find rising, falling and unchanging patterns of victimization inequality across different socio-demographic groups, with rising inequality most strongly associated with ethnicity, disability and financial hardship. While the primary contribution of this paper is methodological, we conclude by highlighting important contributions of this work for both policy and criminological theory.
Literature review
Measuring change in victimization inequality over the crime drop
We begin by examining the extant literature on victimization inequality in the context of the crime drop. It is worth noting that inequality can be understood and conceptualized in different ways – as equality of opportunity, process, output or outcome (see Hunter and Tseloni, 2016). Most of the studies discussed here focus on equality of outcome based on differences between groups; however, there are differences in the way that inequality has been defined and how differential outcomes in victimization rates have been measured. For example, some focus on ‘vertical equity’ while others look more at ‘horizontal equity’ (see Hunter and Tseloni, 2016, 2025). Such differences make a material difference to how inequality is interpreted and theorized within criminology, and how it should be addressed by policy. This is a point to which we will return in the discussion.
One of the most common factors studied is household income, with research generally finding an increase in victimization inequality over the course of the crime drop. This is mainly because there has been less decline in victimization for low-income households – which already tended to have a higher relative risk of victimization than higher income households – for vehicle crime, violence and theft (see Grove et al., 2012; Nilsson and Estrada, 2006; Thacher, 2004). Although Hunter and Tseloni (2016) found that increased inequality in burglary victimization was due to a smaller relative reduction amongst households in the highest income bracket compared to the baseline (low-income) category. Another commonly studied household factor is household tenure, where research has tended to find larger relative reductions in victimization amongst owner occupiers and the least amongst social renters, thus widening the inequality gap between social-renters and those living in more secure tenure types (Grove et al., 2012; Hunter and Tseloni, 2016). Overall, therefore, studies suggest that those living in more impoverished socio-economic conditions were least likely to benefit from the crime drop.
Studies of demographic factors, such as age and sex/gender, have tended to show reductions in victimization inequality, mainly because men and younger people generally experienced a larger relative reduction in victimization than women and older people (Dinisman and Moroz, 2016a, 2016b; Herranz de Rafael and Fernandez-Prados, 2019; Lu et al., 2023). Nevertheless, some studies have found variation in how inequality changed over time when looking at different crime types or measures, especially in relation to sex. For example, Ganpat et al. (2022) found a large reduction in inequality by age and sex for acquaintance violence, but far less so for stranger violence; while Heimer and Lauritsen (2008) found a reduction in the gender inequality gap for assault, especially stranger violence (mainly due to a larger reduction for men), but no change in the gender inequality gap for robbery victimization. Cooper and Obolenskaya (2021) also identified a narrowing gender gap when using a standard measure of violence (based on wounding and assault); however, victimization inequality increased when sexual offences were added to this measure. In both cases, the prevalence of victimization for men fell at a steeper rate than for women; however, the underlying prevalence levels differed depending on which violence measure was used, which shifted the inequality story. This highlights the importance of measuring baseline levels as well as change.
A range of other measures have been examined in the context of victimization inequality, albeit there is no clear narrative due to inconclusive or minimal evidence. For example, there are equivocal findings with regards to household composition or structure (Dinisman and Moroz, 2016a, 2016b; Grove et al., 2012; Hunter and Tseloni, 2016, 2025), ethnicity (Dinisman and Moroz, 2016a, 2016b; Hunter and Tseloni, 2016, 2025) and urbanicity (Herranz de Rafael and Fernandez-Prados, 2019; Hunter and Tseloni, 2016, 2025; Kaylen et al. 2017). Moreover, some factors have received no attention at all, including religion – a common driver of hate crime (Sherr and Montesino, 2009), area-level deprivation – a longstanding correlate of violent and property crime (Bursik and Grasmick, 1993) or disability – recently identified by UK-charity Victim Support as the most common single factor associated with all types of victimization (Rossetti et al., 2016).
Overall, there are gaps in the literature that could be addressed by making better use of existing data. Expanding the range of variables studied would be helpful for policy makers, not only in terms of highlighting specific areas of injustice (see Hunter and Tseloni, 2016; Ignatans and Pease, 2015a), but also in steering supports or resources towards individuals, households or communities who have benefited least from the crime drop. Many existing studies simply compare change in risk of victimization across two static time points, rather than developing a detailed understanding of how victimization inequality has changed dynamically over time (see Cooper and Obolenskaya, 2021; Hunter and Tseloni, 2016). McVie et al. (2020) addressed this issue by applying quasi-longitudinal analysis to multiple sweeps of Scottish data to demonstrate dynamic change in the concentration of victimization inequalities, but they did not examine contrasts in victimization inequalities between socio-demographic groups.
Unadjusted and adjusted measures of inequality
Improving the approach used to estimate inequality measures is a key area for potential development in this field. Matthews and McVie (2025) note that most studies have used ‘unadjusted’ descriptions of differences in victimization rates between groups. A few have considered both unadjusted and adjusted measures of inequality (e.g., Hunter and Tseloni, 2016; Rossetti et al., 2016); however, there has not been comprehensive attention given to understanding the changing profile of inequalities across different victim characteristics or what this means for developing crime prevention policies.
Unadjusted victimization rates tell us simply who is more likely to experience crime by comparing the rate for one particular group (e.g., women) with the rate for another group (e.g., men). Studies using unadjusted measures of inequality (e.g., Grove et al., 2012; Ignatans and Pease, 2015b) compare the rates between groups for one characteristic without making any statistical adjustment for other characteristics that are held by these groups (e.g., age or ethnicity). In contrast, studies which take an adjusted approach (e.g., Hunter and Tseloni, 2016, 2025; Kaylen et al., 2017; Thacher, 2004) try to identify the independent effect of one characteristic on victimization, over and above the effects of other characteristics. Adjusted victimization rates establish the importance of one specific characteristic by controlling for a person's other characteristics, using a statistical model to create a counterfactual estimate of what the victimization rates in each group would have been if they were exactly equivalent across all the other characteristics included in the model.
This distinction between adjusted and unadjusted victimization rates may seem like statistical hair-splitting, but Matthews and McVie (2025) argue that both measures are important in the context of developing policy solutions to reduce victimization inequality. For example, comparing unadjusted victimization rates between areas of high and low deprivation is useful when designing tertiary crime prevention measures (van Dijk and de Waard, 1991), such as victim support services, because it shows where such services are most needed – regardless of what is driving the increase in inequality. This is consistent with a formal equity approach. However, if adjusted estimates show that differences between areas are driven by other factors, such as levels of financial hardship, this may suggest that secondary crime prevention efforts targeted at reducing household poverty may be more beneficial than efforts focused uniformly across households in deprived areas. This aligns with a substantive equity approach. Moreover, comparing both types of measure can identify ‘hidden’ aspects of victimization inequality, by highlighting characteristics that may have little apparent association with victimization in unadjusted analysis, but are strongly associated after adjustment for other characteristics (Rossetti et al., 2016).
Measuring uncertainty
Assessing whether observed changes in victimization inequality are distinguishable from random chance poses another methodological challenge for this type of research. This problem is common within social statistics; however, as Matthews and McVie (2025) note, it becomes more acute with more sophisticated ‘estimands’ like the Victimization Divide proposed by Hunter and Tseloni (2016) to measure changing victimization inequalities over time. Simulation methods provide a general solution to calculate distributions of quantities of interest from a fitted model (King et al., 2000) from which confidence intervals can be calculated. These distributions can then be used to easily visualize changes in victimization inequality, which has not been attempted in previous studies.
Research aims and questions
This paper aims to explore stability and change in victimization inequality, in the context of falling crime, focusing on nine socio-demographic groups. Importantly, we address the limitations of prior studies by using repeated sweeps of survey data to explore dynamic changes in inequality, comparing both unadjusted and adjusted measures of inequality and incorporating uncertainty into our estimates of inequality to produce robust results. The context for this study is Scotland which, like many other countries, experienced a crime drop in recent decades (McVie, 2017). Prior research demonstrated an increase in the concentration of victimization inequality based on crime type, prevalence and incidence (McVie et al., 2020); therefore, this paper sets out to explore contrasts in the characteristics of those most impacted by this overall increase in inequality. In doing so, our study was guided by three research questions:
Did victimization rates fall significantly for all socio-demographic groups during the crime drop? Does unadjusted analysis show stability or change in victimization inequality across socio-demographic groups? Does adjusted analysis change the story of victimization inequality?
Research design
Our study applies complex statistical models to repeated sweeps of national victim survey data to explore stability and change in victimization inequality during a period of falling crime. We present our results both statistically, by calculating bounds of uncertainty around unadjusted and adjusted model estimates, and visually, by graphing estimated victimization rates and ratios of victimization inequality. Careful uncertainty estimation allows us to be confident about where we do, and do not, find evidence of inequality, which is useful in identifying aspects of inequality that would benefit from further investigation.
Data
The SCJS uses face-to-face interviews with one adult (aged 16 or over) from randomly selected households across mainland Scotland and its largest islands (see Scottish Government, 2023). We used ten sweeps of data from the Scottish Crime and Justice Survey (SCJS), from 2008/2009 to 2021/2022, accessed via the UK Data Service. The estimated number of incidents of victimization in Scotland fell from 1,045,000 annually in 2008/2009 to 494,000 in 2021/2022, representing a halving of population prevalence from 20.4% to 10.0% over this period (Scottish Government, 2023). While crime surveys were conducted in Scotland prior to 2008/2009, variables used in previous sweeps were not sufficiently comparable to use in this analysis. The comparable sweeps from 2008/2009 onwards have still seen some changes to their methodology (Bell et al. 2024). From 2016/2017 onwards the survey was conducted every year rather than every 2 years, but with an approximate halving of the target achieved sample size. The intended number of responses over the 2-year period remained the same as in 2014/2015, but with 6000 sampled each year rather than 12,000 every 2 years. At this point the sampling frame was also extended to cover all Scottish islands, with some smaller islands were excluded from the sampling frame in earlier years. The sweeps since 2012/2013 have used a single stage, unclustered, stratified sample design, stratified by Local Authority. Earlier sweeps have a more involved sampling design (see Page et al., 2010). These changes emphasise the importance of appropriately incorporating the weights provided in the analysis to account for the sampling design (see discussion in Methods). 1 The pooled dataset included 96,229 respondents of which 26,460 (17%) were the victim of at least one crime. A description of the variables used is provided below and in Table 1.
Descriptive statistics.
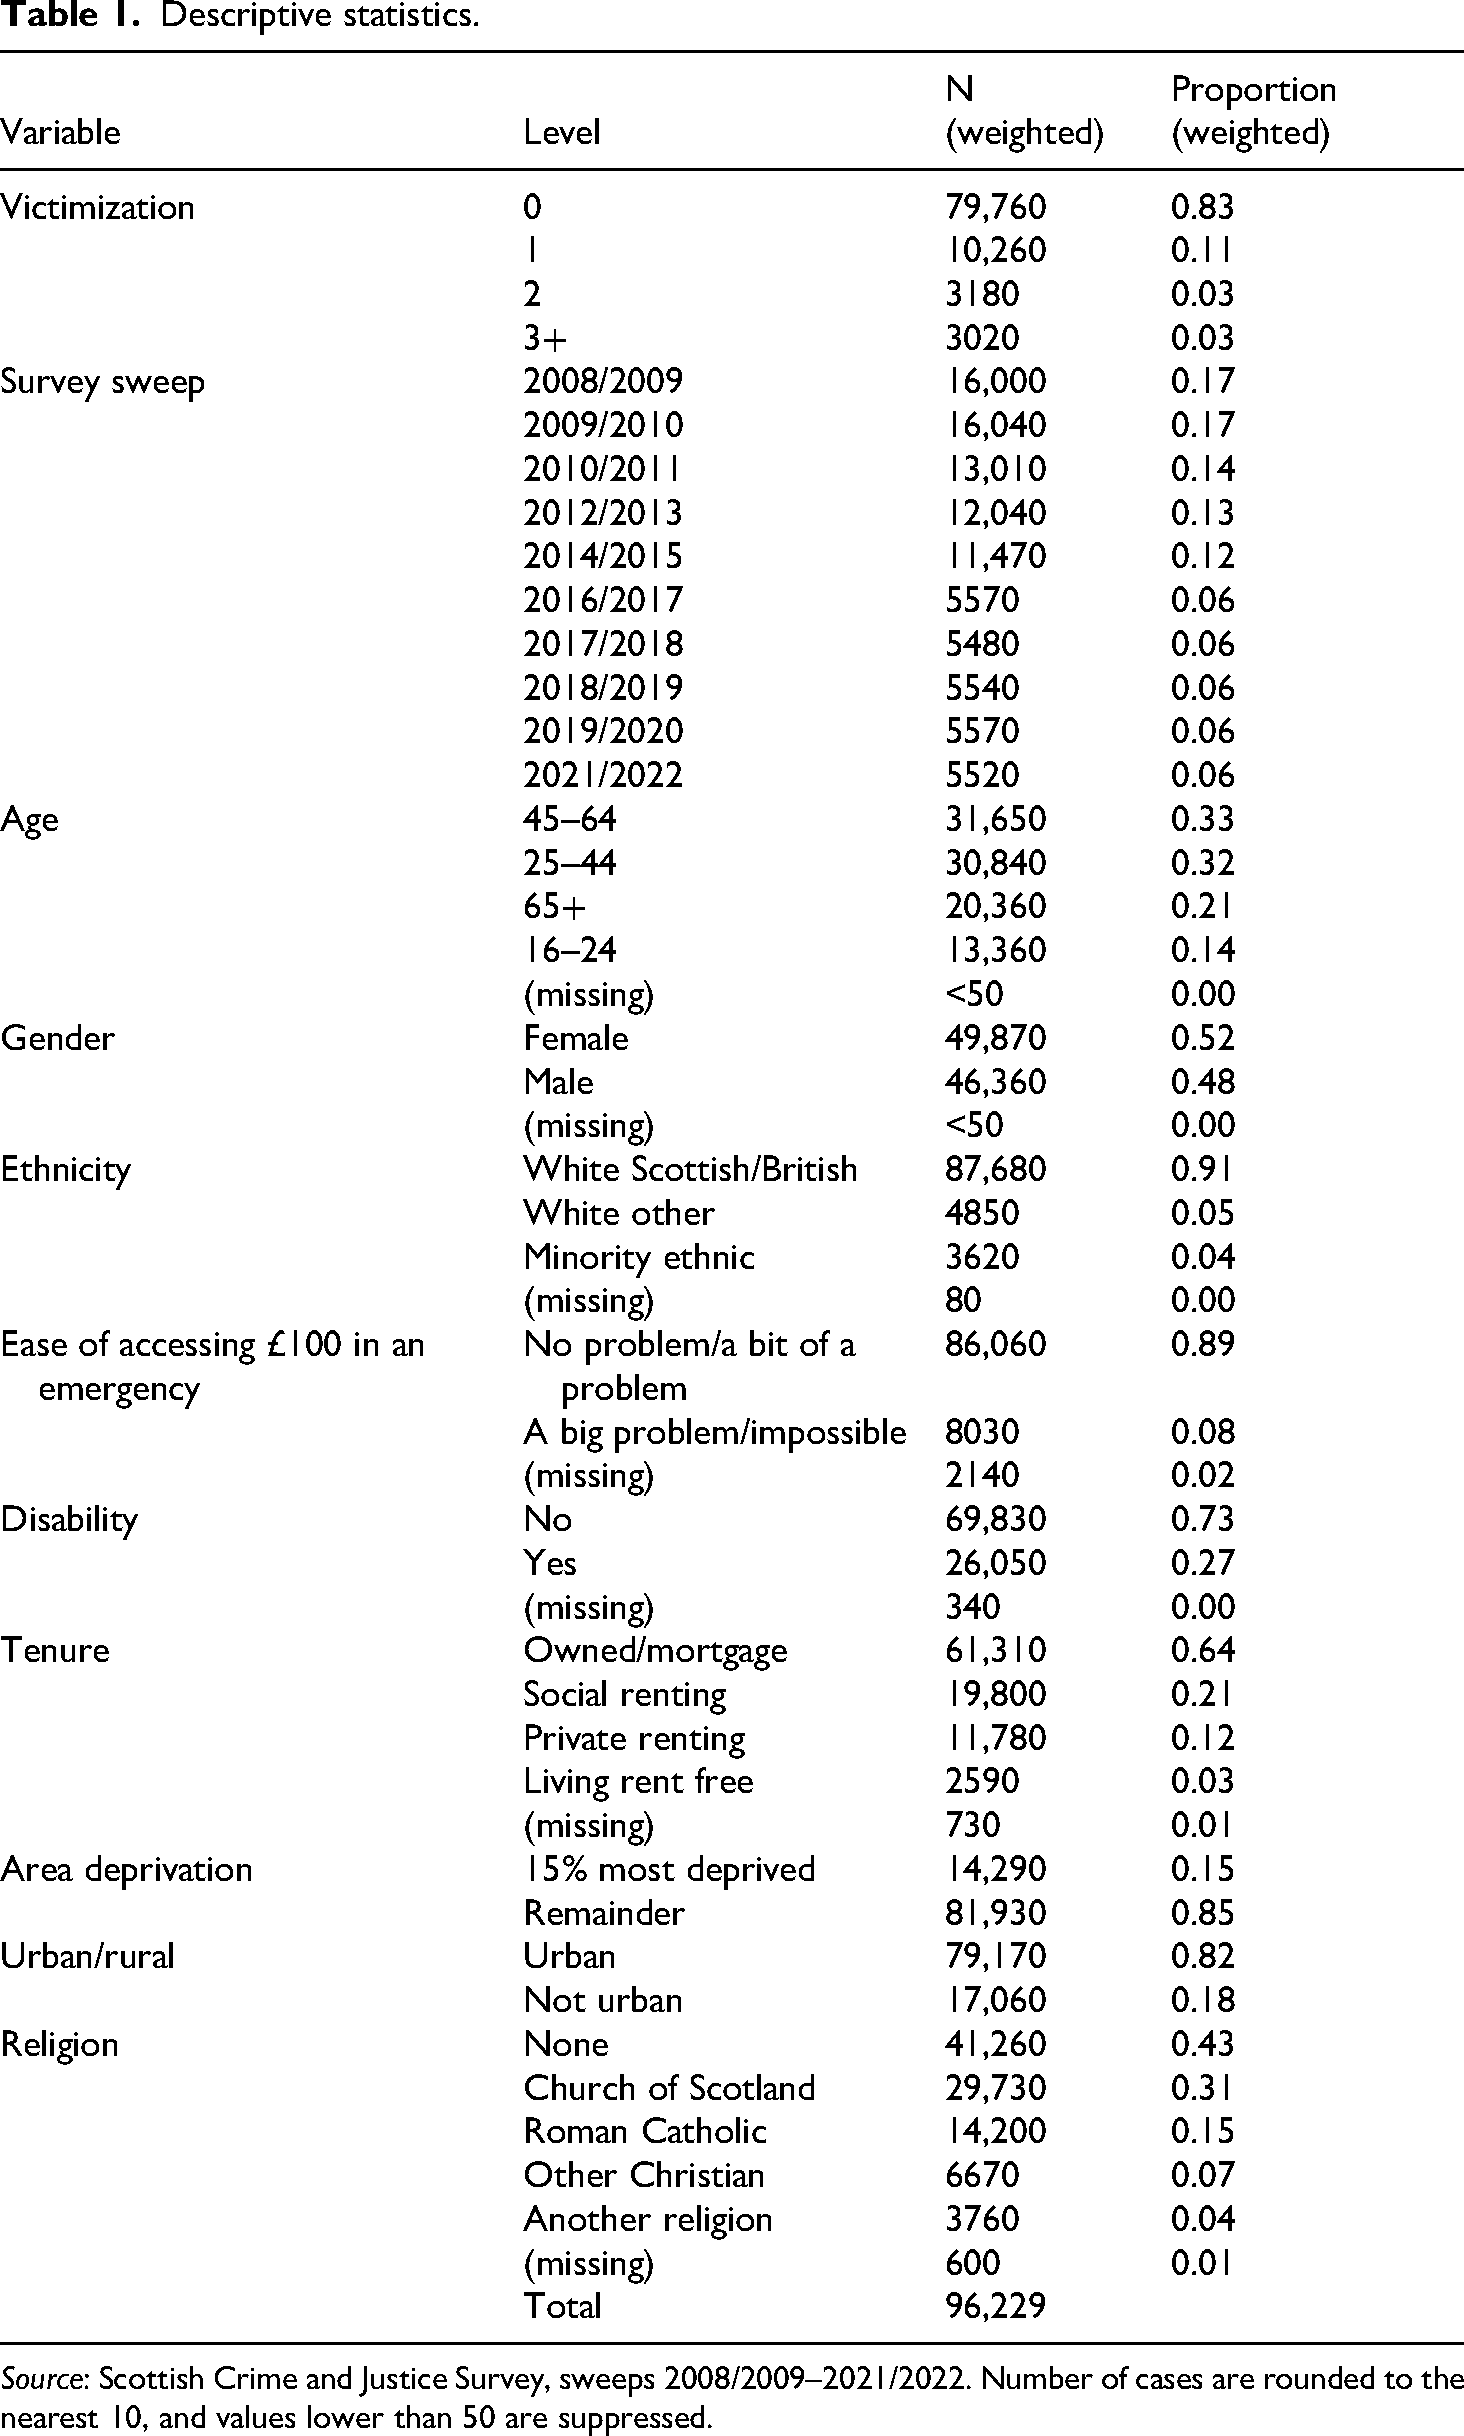
Source: Scottish Crime and Justice Survey, sweeps 2008/2009–2021/2022. Number of cases are rounded to the nearest 10, and values lower than 50 are suppressed.
Outcome variable
Our dependent variable was the total number of incidents of victimization (including motor vehicle crime, household crime, personal theft, robbery, assaults and threats) recorded for each person. Victimization incidence in the SCJS is capped at 25 incidents per person (Bell et al., 2024), meaning that we under-estimate the true incidence of victimization in Scotland; however, this prevents any significant skewing of the victimization rate due to a few extremely large values. As recommended by Scottish Government (2019a), we focus on all crime rather than specific crime types, as sparsity of data when modelling multiple covariates would have increased uncertainty in our results. Given likely differences in levels of victimization inequality by crime type (see discussion in the Literature Review), our results for overall victimization may not be universally applicable. Our outcome measure, referred to throughout as the ‘victimization rate’, represents the model's estimate of the average number of incidents that a random adult living in a private household in Scotland could expect to experience during a specific year.
Survey year
We measured survey year as the number of years since the first sweep of the SCJS in its current form (2008/2009). Coding survey year in this way means that when we model the victimization trends across inequality dimensions we can interpret the coefficients for each dimension as the difference 2 in the estimated victimization rate between the reference category and the comparison category in 2008/2009, and the interaction terms between each inequality dimension and survey year reflect how the slope of the estimated linear trend varies between the reference category and the comparison category.
Dimensions of inequality
We identified nine characteristics for inclusion in the modelling based on the existing literature on victimization inequality (as discussed above). These variables (and the reference categories for each) are described below.
Individual measures
Age: Four age groups were provided consistently across the ten SCJS datasets. Age 65 or over was used as the reference category.
Sex: SCJS respondents were recorded as male or female, but it is not explicit whether this referred to biological sex or gender identity. We have used the term sex and defined male as the reference category.
Ethnicity: The SCJS provides consistent information on four ethnic categories only: white Scottish, white British, minority ethnic, and white other. We combined white Scottish and white British into a single category which was used as the reference category.
Disability: Disability was defined as having a physical or mental health condition or illness that is expected to last at least 12 months. No reported disability was used as the reference category.
Religion: SCJS respondents were asked what religion, religious body or denomination they belong to. Using the most common groups, we distinguish between the Church of Scotland, Roman Catholic, another Christian group and some other religion. No religion was the reference category.
Household measures
Financial hardship: We used a measure of financial hardship as a proxy measure of household poverty. Respondents were asked how easy it would be for the household to find £100 to meet an unexpected expense. Responses of ‘impossible’ or ‘a big problem’ were classed as households in financial hardship, with ‘not a problem’ or ‘a bit of a problem’ as the reference category. SCJS also includes questions about household income, but this data was not used due to the high level of missing information (25%). Financial hardship measures are strongly correlated with other poverty measures (Short, 2005).
Tenure: The SCJS distinguishes owner occupiers from private renters and social renters. Social renting, which involves government subsidized rents for people on low income, represents another proxy measure of poverty at household level. Owner occupier was used as the reference category.
Area measures
Neighbourhood deprivation: Having an address in the top 15% of the Scottish Index of Multiple Deprivation was used as an indicator of living in a deprived neighbourhood. The reference category included all other addresses.
Urbanicity: The SCJS uses the Scottish Government's six-fold Urban Rural Classification to assign households to the sample frame for the survey. The dataset identifies whether the respondents were living in large or other urban areas (with a population settlement size of 10,000 or more) versus small towns or rural areas. Non-urban area was used as the reference category.
Methods
Modelling victimization inequality: Unadjusted rates
The average number of crimes experienced by each group was modelled using a quasi-Poisson model to account for over-dispersion (see Walby et al., 2016). 3 Separate models were created for each of the nine variables, with victimization rates modelled as a combination of each characteristic (e.g., men and women), a linear time trend, and an interaction between each characteristic and the linear time trend. The interaction terms allow for different trends over time for each group, letting the models measure increasing or decreasing levels of inequality. We used the model to predict the average victimization rate for each group in each year between 2008/2009 and 2021/2022.
The linear time trend provides a parsimonious description of change over time in victimization inequalities between the groups we analysed. Due to the combination of survey weighting and multiple imputation to handle missing data (see section Missing Data below), it is not straightforward to analyse whether there would be statistical grounds to prefer a more complex functional form for the change over time in inequalities. Exploratory analysis (see Supplementary Materials) suggested that the only variable where a quadratic term would improve the fit of the model was ethnicity. However, we decided to remain with the linear time trend in the bivariate model for ethnicity both on grounds of parsimony and comparability across models.
Modelling victimization inequality: Adjusted rates
To estimate the adjusted victimization rates, we calculated counterfactual victimization rates for each respondent across every level of each variable to show the independent effect of each inequality dimension on victimization. This averages out the effect of all the other variables in the model, giving estimates of victimization rates for populations that are exactly identical across every other characteristic than the one under consideration at a given time (see Matthews and McVie, 2025). This process of constructing ‘average predictive comparisons’ is recommended to understand the results of complex statistical models (Gelman and Pardoe, 2007). We use the same quasi-Poisson model specification and weighting strategy for the adjusted models as for the unadjusted models. The model specification for the adjusted models included all nine variables, a linear time trend and interactions between the nine variables and the linear time trend.
Measuring change in victimization inequality
Change in victimization inequality was measured in two complementary ways. First, we examined the interaction terms in the models. Where these were not statistically significant, even though there may have been differences in rates between groups, there was little evidence of changing victimization inequality over time.
Second, we converted the victimization rates estimated by our statistical models into incidence rate ratios (IRRs). An IRR is the ratio of the estimated victimization incidence rate between groups (calculated by dividing the estimated victimization rate in the group of interest by that of the reference group). Measuring the IRR allows the level of inequality between groups to be assessed in isolation of any effect of changing crime levels. However, this measure must be interpreted in the context of the absolute victimization rates (Spiegelhalter, 2017), otherwise we cannot tell if the victimization rates between two groups are becoming less equal because one is falling faster than the other, or one is falling and the other is rising. Uncertainty in the IRRs was calculated by simulating multiple possible victimization rates implied by the regression models, taking account of the uncertainty in the model estimates, and calculating the IRR for each simulated draw (see King et al. 2000). This gave us a distribution of IRRs for each group in each year, which was used to visualize uncertainty in the changing pattern of victimization inequality.
Missing data and model specification
We used Multiple Imputation by Chained Equations (van Buuren and Groothuis-Oudshoorn, 2011) to impute missing values. The MICE used five iterations, considered acceptable with a small percentage of missing values (van Buuren, 2018). The D1 goodness of fit measure (van Buuren, 2018) showed that the fully adjusted model fit the observed data better than each bivariate model.
Results
Did victimization rates fall significantly for all socio-demographic groups during the crime drop?
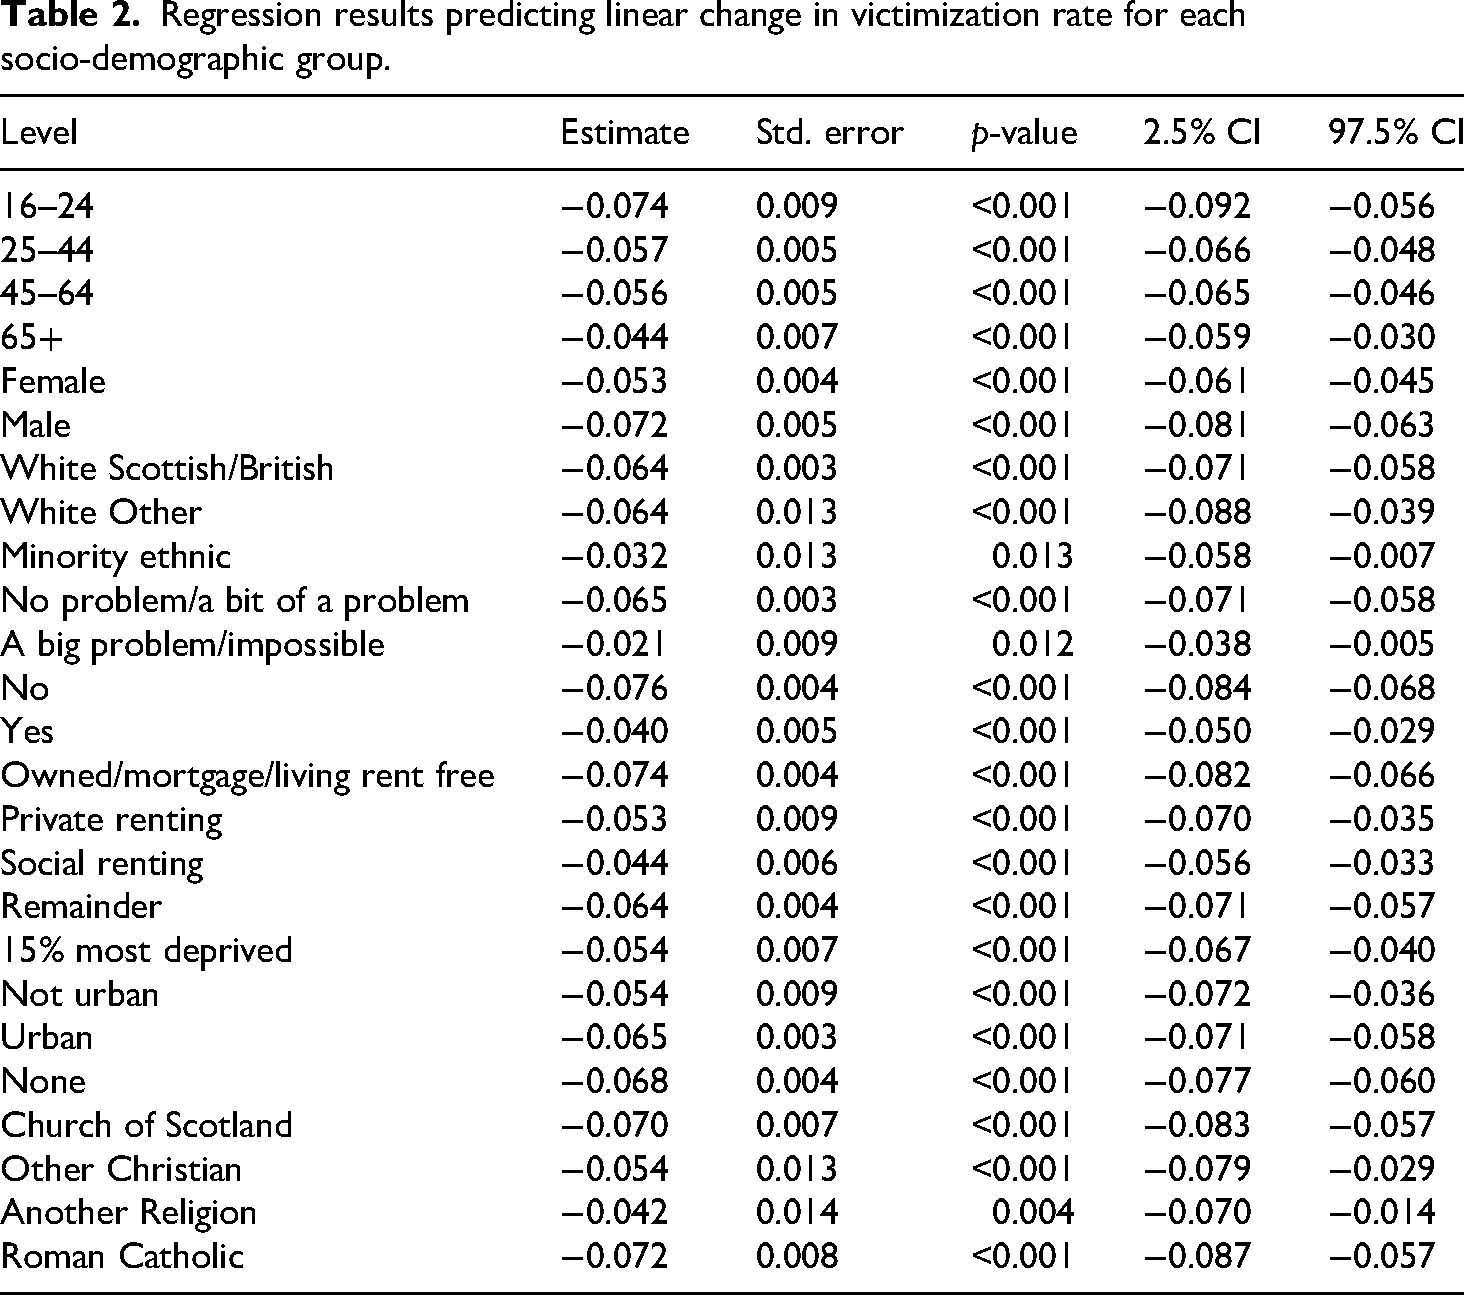
A linear time trend was fitted for each socio-demographic group across the nine variables to determine whether the regression slope was negative and statistically different from a flat linear trend. As can be observed from Table 2, this was the case for every estimate, meaning there was a reduction in the victimization rate for all groups from 2008/2009 onwards. This stage of the analysis provides useful context for addressing the second research question, because it confirms that – regardless of whether there were different trends between groups – there is evidence that victimization rates fell significantly for all the socio-demographic groups we studied during this period of the crime drop in Scotland.
Regression results predicting linear change in victimization rate for each socio-demographic group.
Does unadjusted analysis show stability or change in victimization inequality across socio-demographic groups?
Table 3 presents parameter estimates from nine unadjusted regression models (one for each socio-demographic variable) using victimization rate as the outcome variable. For ease of presentation, these have been stacked in one table to show the independent estimate for each group (compared to its reference category), controlling for survey year, and the interaction between each group and survey year. As expected, the estimate for survey year was negative and statistically significant for all nine models, reflecting the reduction in victimization rates after 2008/2009 shown in Table 2.
Regression results predicting differences in linear victimization trends for each socio-demographic characteristic.
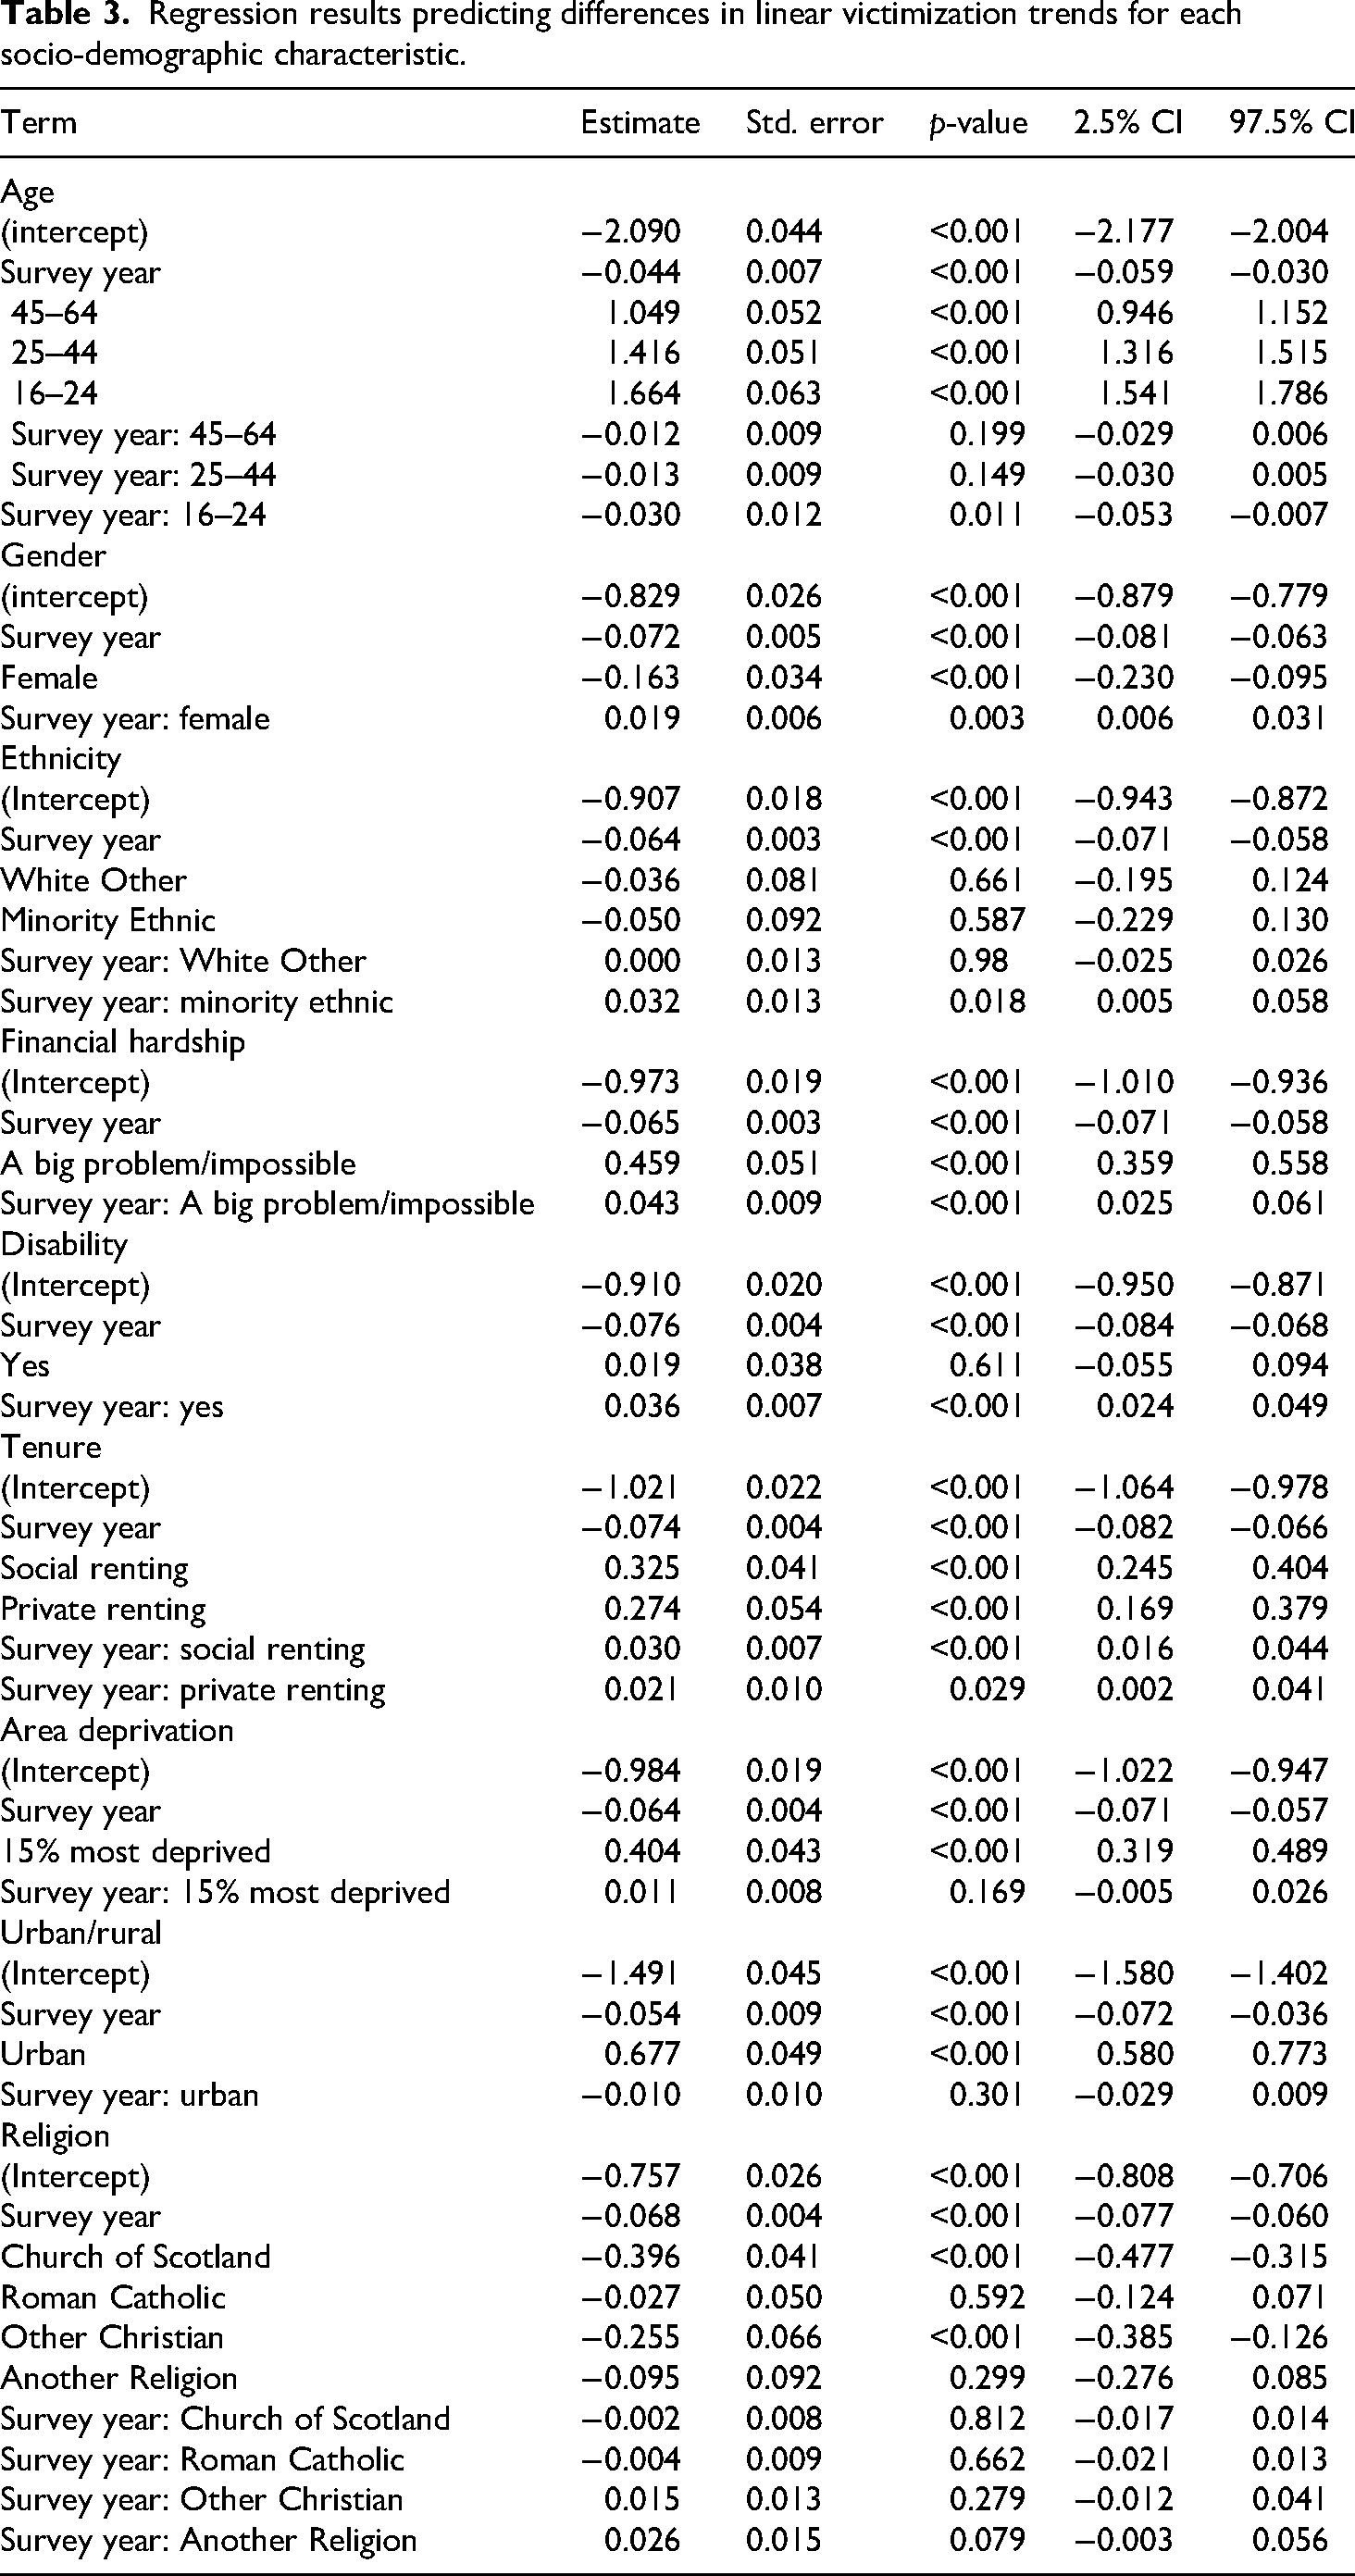
For seven of the nine models, the main effect of at least one group was statistically different to its reference group. The results show that modelled victimization rates in 2008/2009 were significantly higher amongst: people in all three age groups between 16 and 64 (compared to age 65+); men (compared to women); people experiencing financial hardship (compared to those who were not); people living in social or private rented accommodation (compared to owner occupiers); people living in the 15% most deprived areas of Scotland (compared to the remainder of the population); and people living in urban areas (compared to people living in less populated communities). For religion, there was a significant difference in victimization rates between those from Church of Scotland or Other Christian groups and those with no religion; but not for those from Roman Catholic or other religious backgrounds. On average, however, there was no significant difference in the victimization rates between disabled and non-disabled people, nor between minority ethnic or white other groups compared to white Scottish/British.
Statistically significant interaction effects were found in six of the nine models. These showed that victimization rates declined more steeply over time amongst people aged 16–24 (compared to age 65+), but less steeply amongst: women (compared to men); people from minority ethnic backgrounds (compared to white Scottish/British); people in financial hardship (compared to those who were not); disabled people (compared to non-disabled); and both private and social renters (compared to owner occupiers). There was no significant interaction effect with survey year for area deprivation, urbanicity or religion. Overall, therefore, there was evidence that some groups benefited more than others from falling victimization rates during the crime drop.
Does adjusted analysis change the story of victimization inequality?
A quasi-Poisson regression model was used to produce adjusted parameter estimates for each independent variable and interaction term. The results, presented in Table 4, show a significant negative estimate for survey year, confirming a decline in the average incidence of victimization from 2008/2009 onwards.
Multiple regression results predicting differences in linear victimization trends for all socio-demographic characteristics.
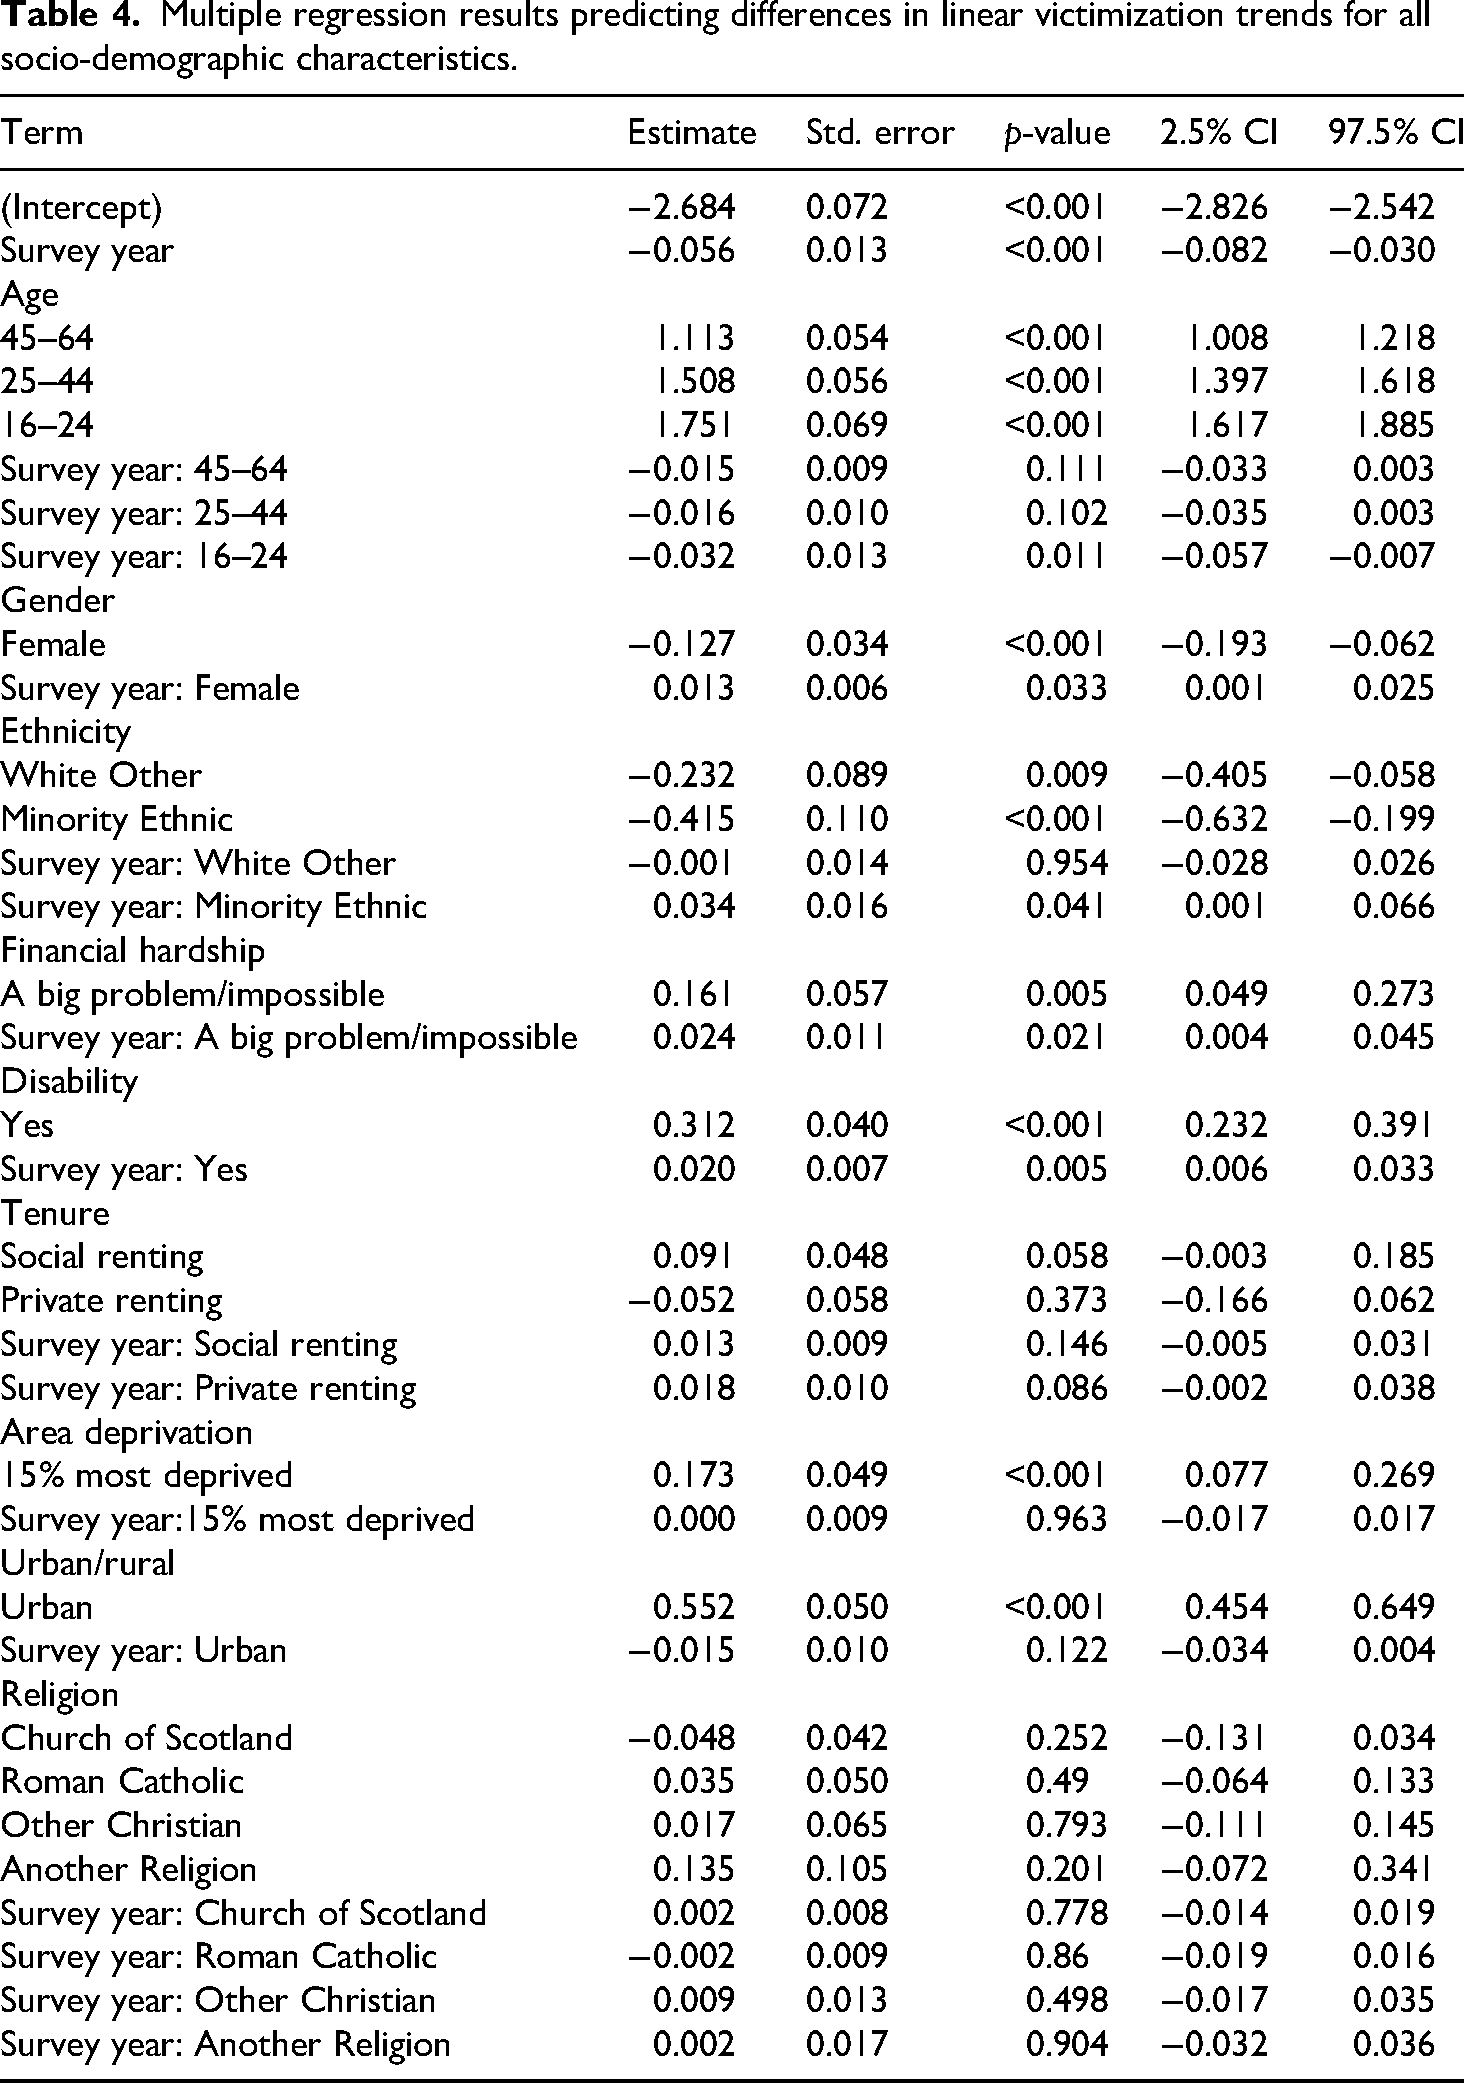
When adjusting for all of the socio-demographic variables in the model, the main effects were statistically significant for all but two of the nine characteristics. There was no significant difference between any of the groups based on tenure or religion (compared to their respective reference categories) in terms of victimization rates in 2008/2009. This suggests that differences between groups based on tenure and religion in the unadjusted models can be explained by other characteristics held by these groups. The adjusted estimates for age, sex, financial hardship, area deprivation, and urbanicity were all broadly in line with the unadjusted estimates, albeit they were slightly attenuated (with the exception of age, where the effect sizes were larger in the adjusted model). For ethnicity and disability, however, the adjusted estimates were much larger than the unadjusted estimates, and they were also statistically significant. These results suggest that having a disability or being from an ethnic group other than white Scottish/British was associated with a higher victimization rate in 2008/2009 once respondents’ other characteristics are controlled for. Using adjusted analysis did, therefore, change the story of victimization inequality for some groups.
Table 4 shows significant interaction effects with survey year for five of the nine variables in the adjusted regression model. These reveal a narrowing of the victimization inequality gap after 2008/2009 for three groups: people aged 16–24 (compared to age 65+); women (compared to men); and people from minority ethnic groups (compared to white Scottish British). For the other two groups, there was a widening of the victimization inequality gap over time: disabled people (compared to non-disabled); and people experiencing financial hardship (compared to those who were not). These findings suggest that trends in victimization inequality were also different for some socio-demographic groups in the adjusted compared to unadjusted models.
Explaining levels and trends in victimization inequality from the estimates alone is complex; however, data visualization helps to communicate these findings in a more user-friendly way. For the five socio-demographic characteristics that had statistically significant interaction effects in Table 4, we used data visualization to illustrate stability and change in victimization inequality. Figures 1–5 plot the victimization rate (left column) and the IRRs (right column) for the unadjusted model (top row) and adjusted model (bottom row) for each of the variables. The left and right panels for each figure provide complementary perspectives on stability and change in victimization inequality over time: the left shows differences in the victimization rate between groups, while the right shows change in victimization inequality. For the IRRs, the horizontal line at 1 represents complete equality between each socio-demographic group and its reference category. If the IRR trendline is moving away from this reference line it indicates that the victimization rates are diverging; whereas, if the trendline is moving towards this line it indicates that inequality in victimization rates is reducing. Shaded confidence intervals show the degree of uncertainty in the estimates.
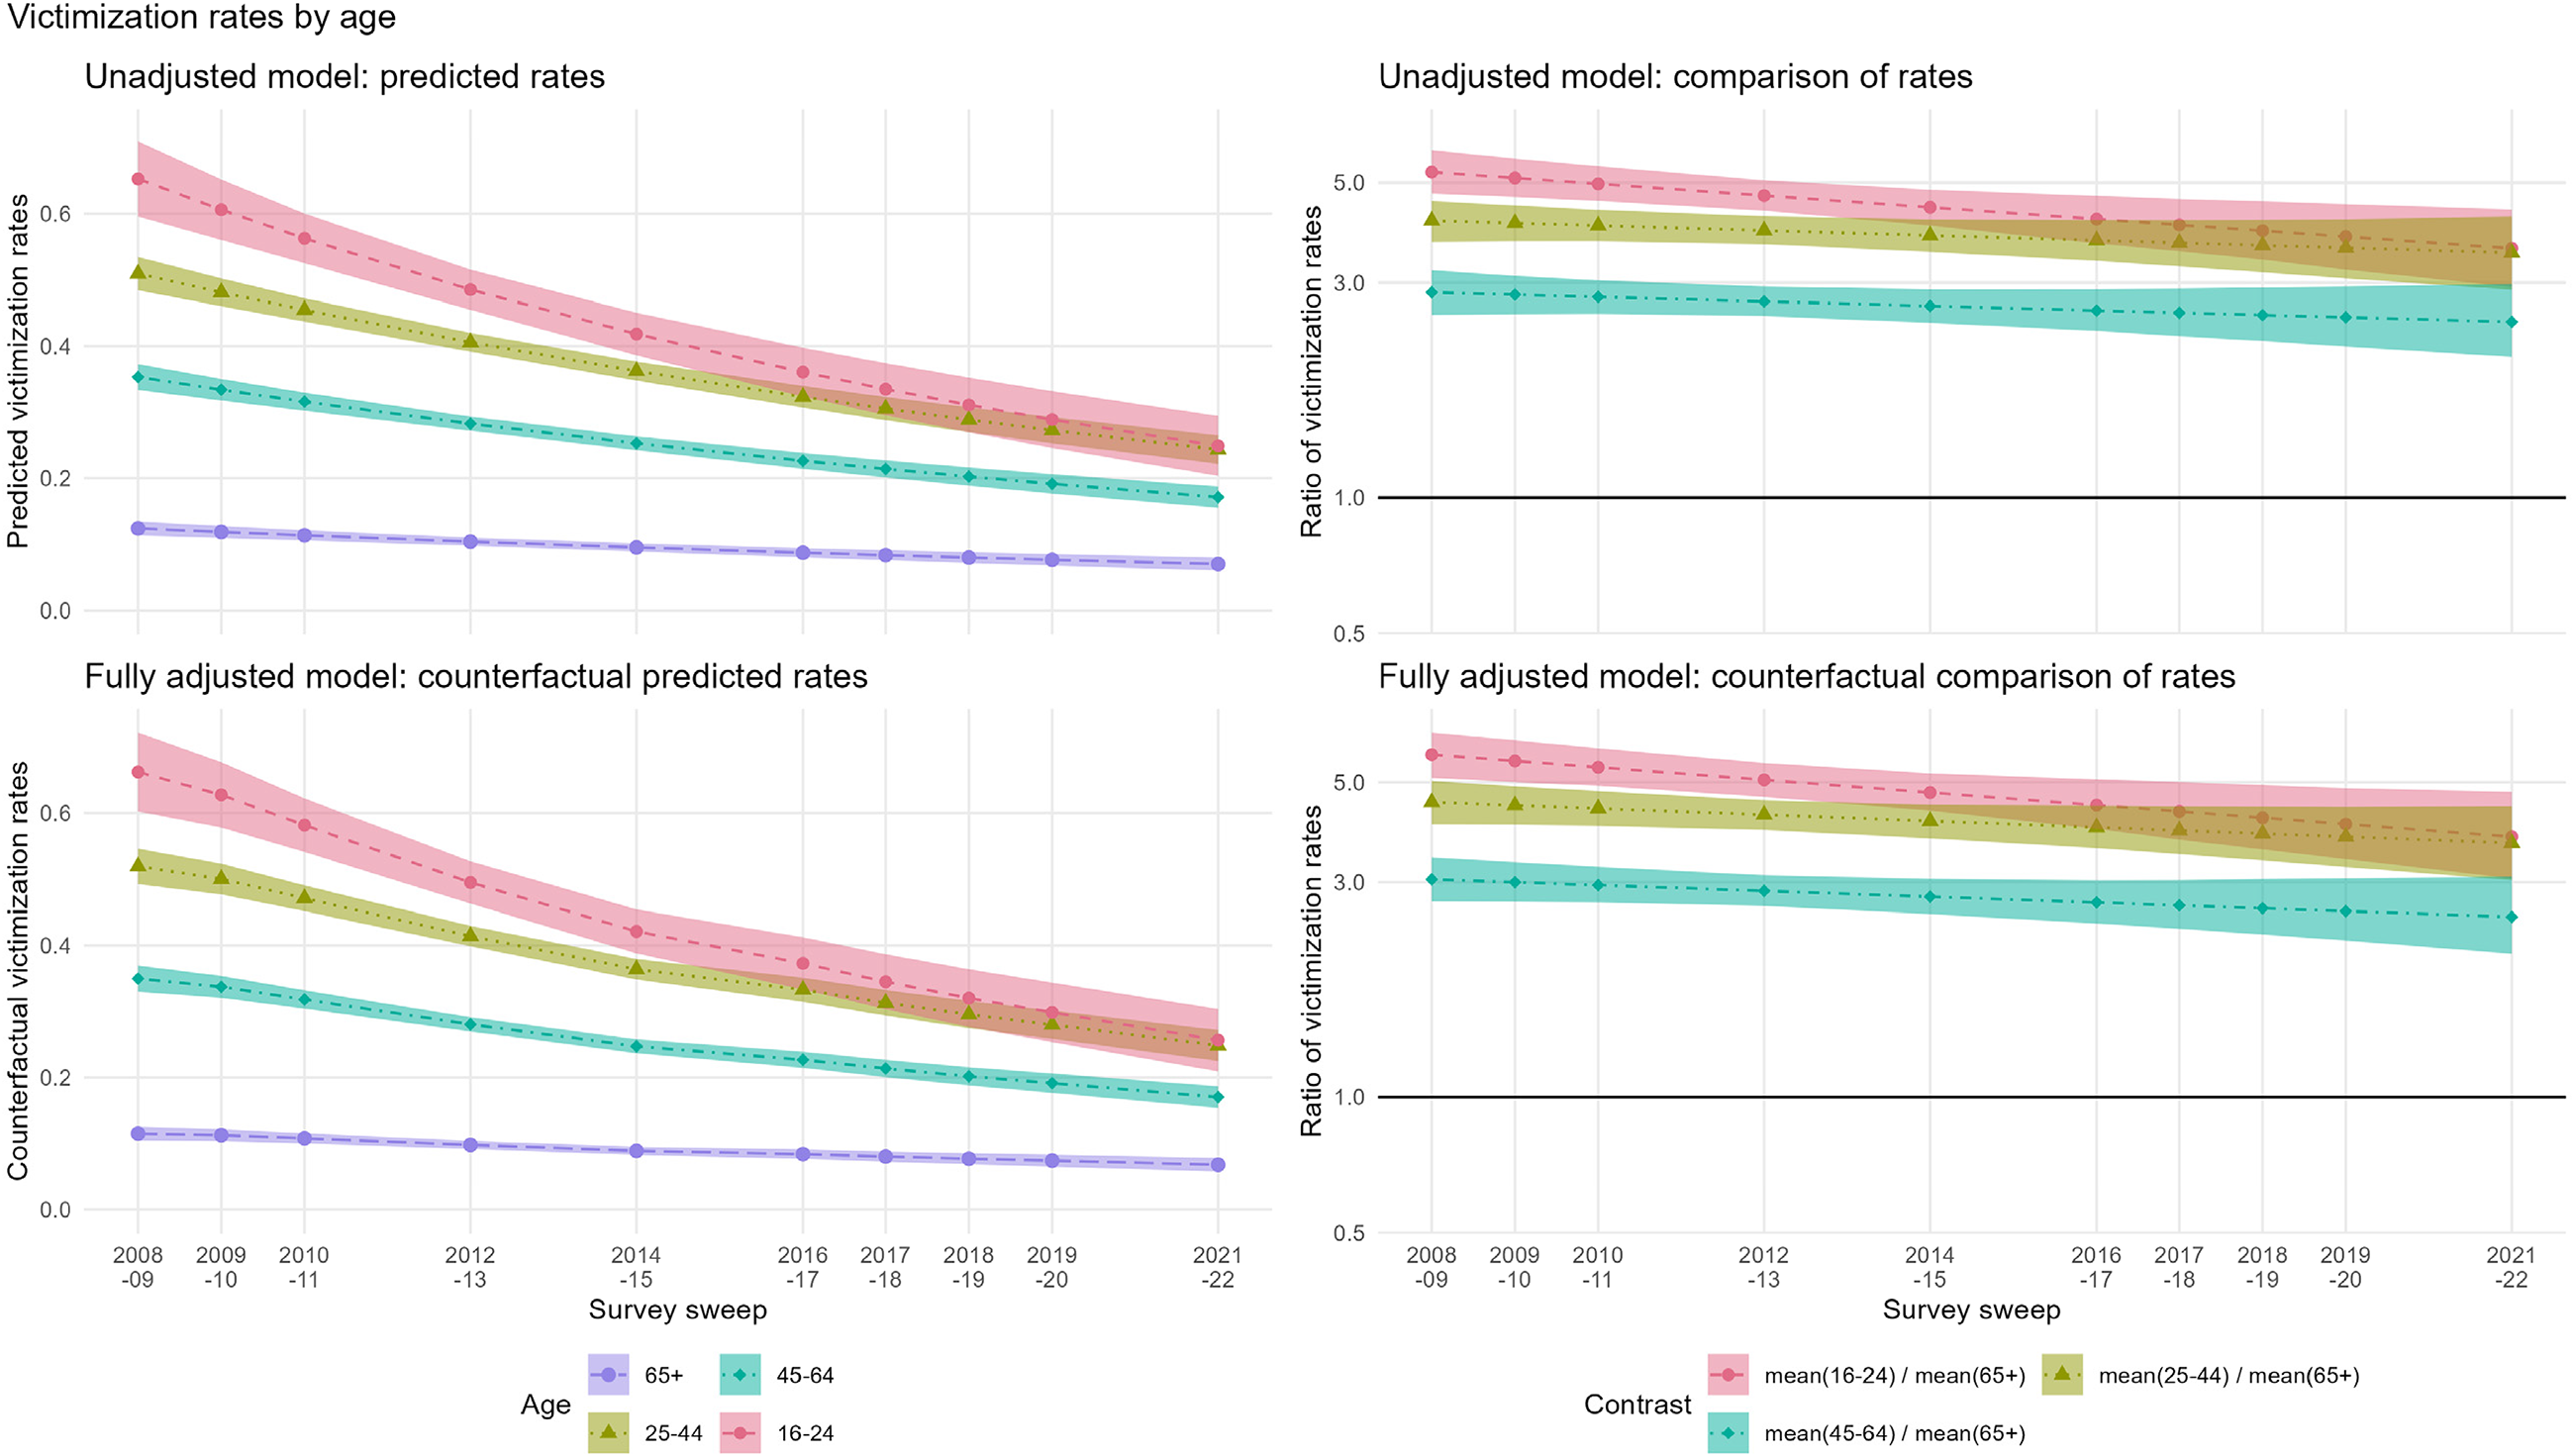
Modelled victimization trends and inequalities by age.
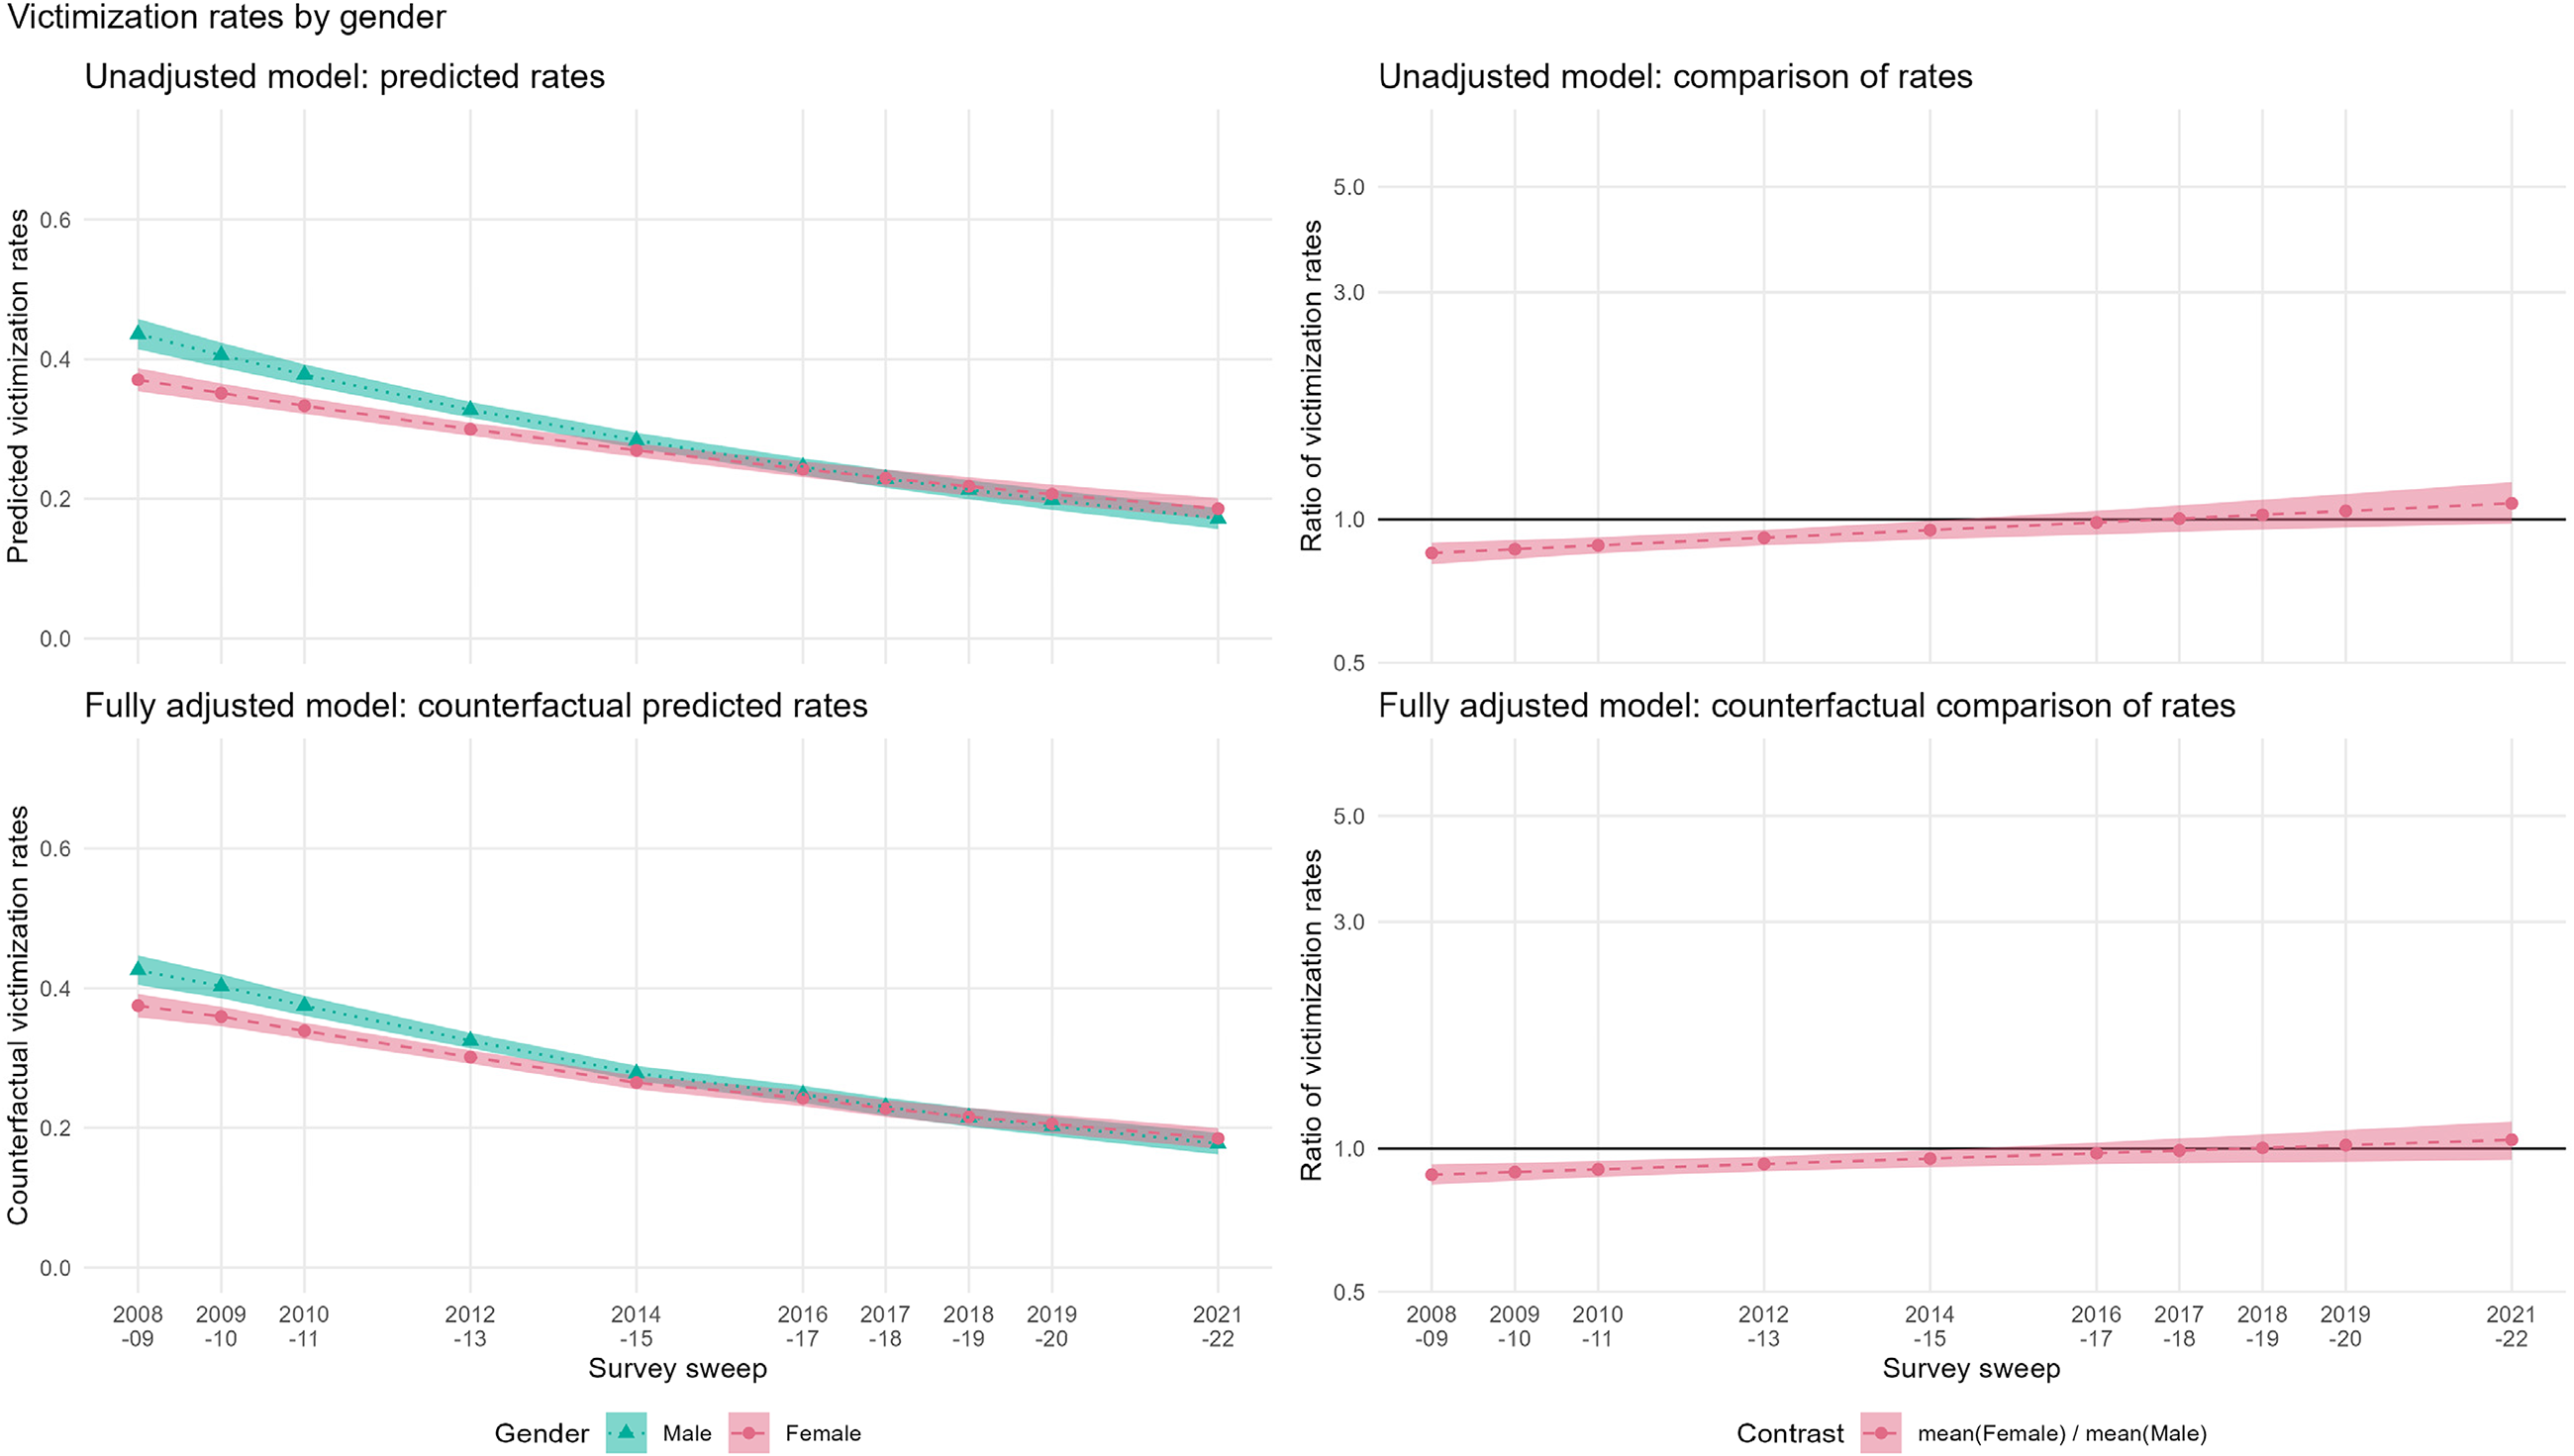
Modelled victimization trends and inequalities by gender.
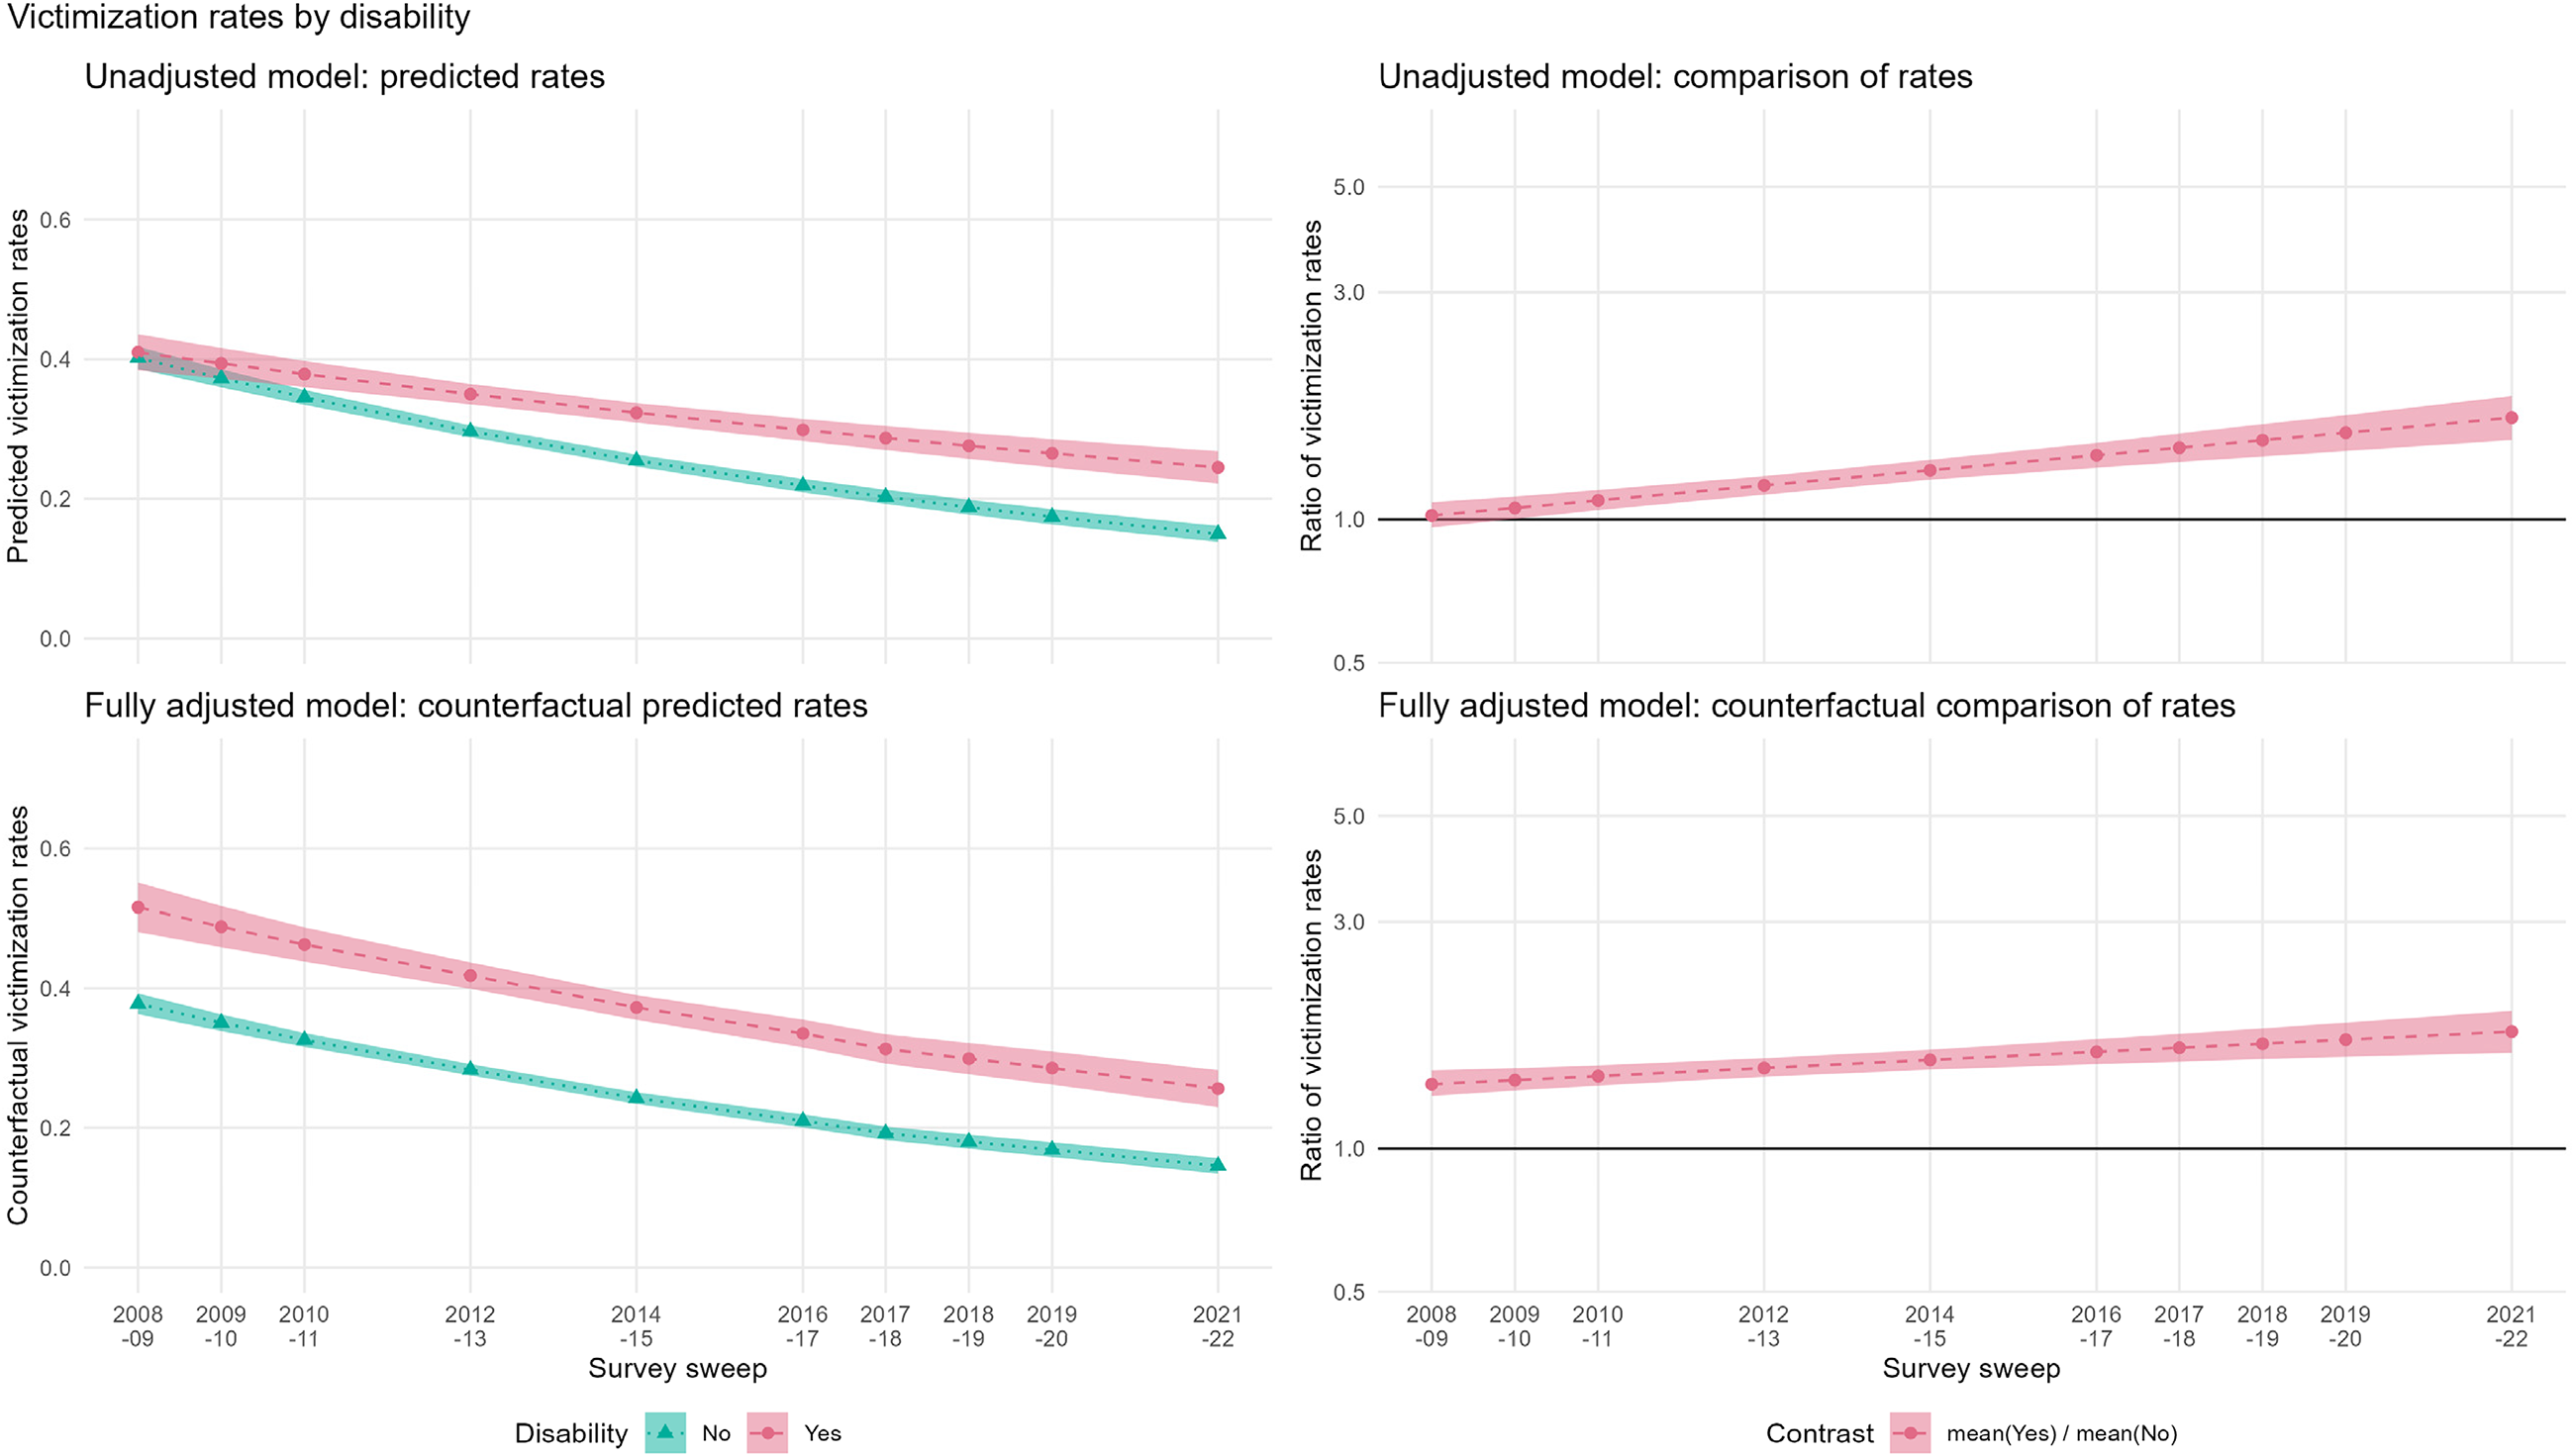
Modelled victimization trends and inequalities by disability.
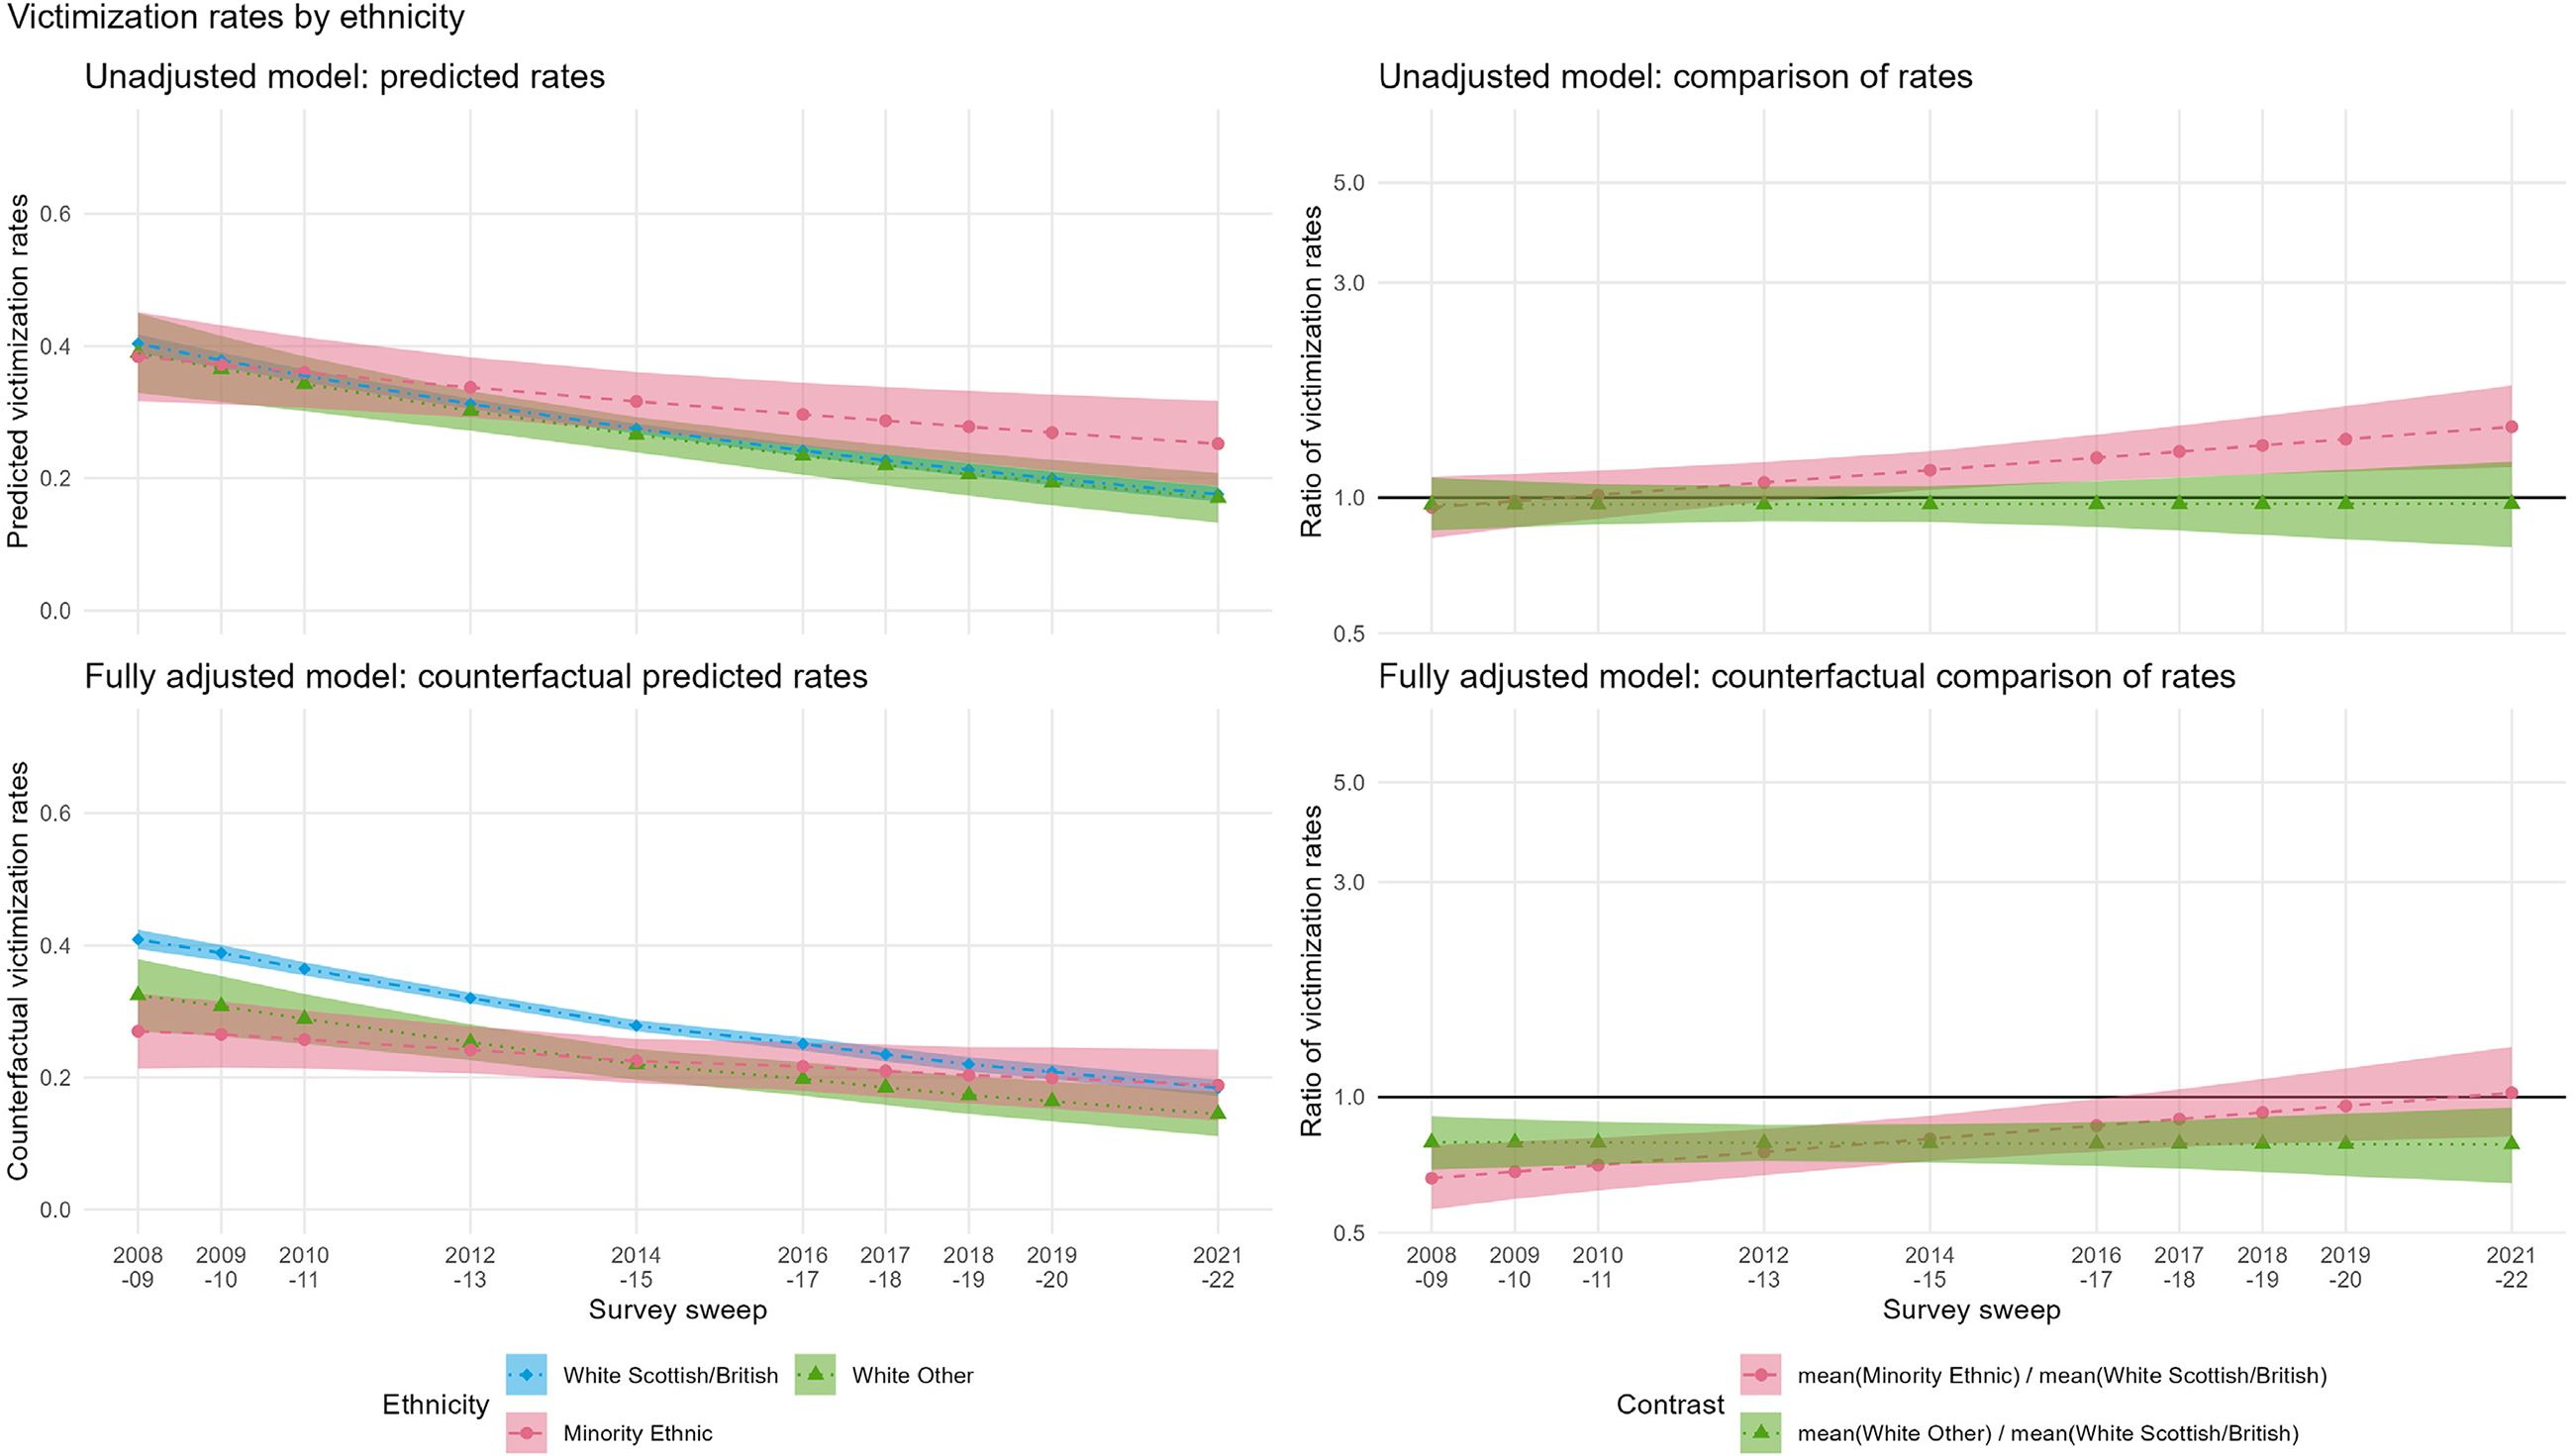
Modelled victimization trends and inequalities by ethnicity.
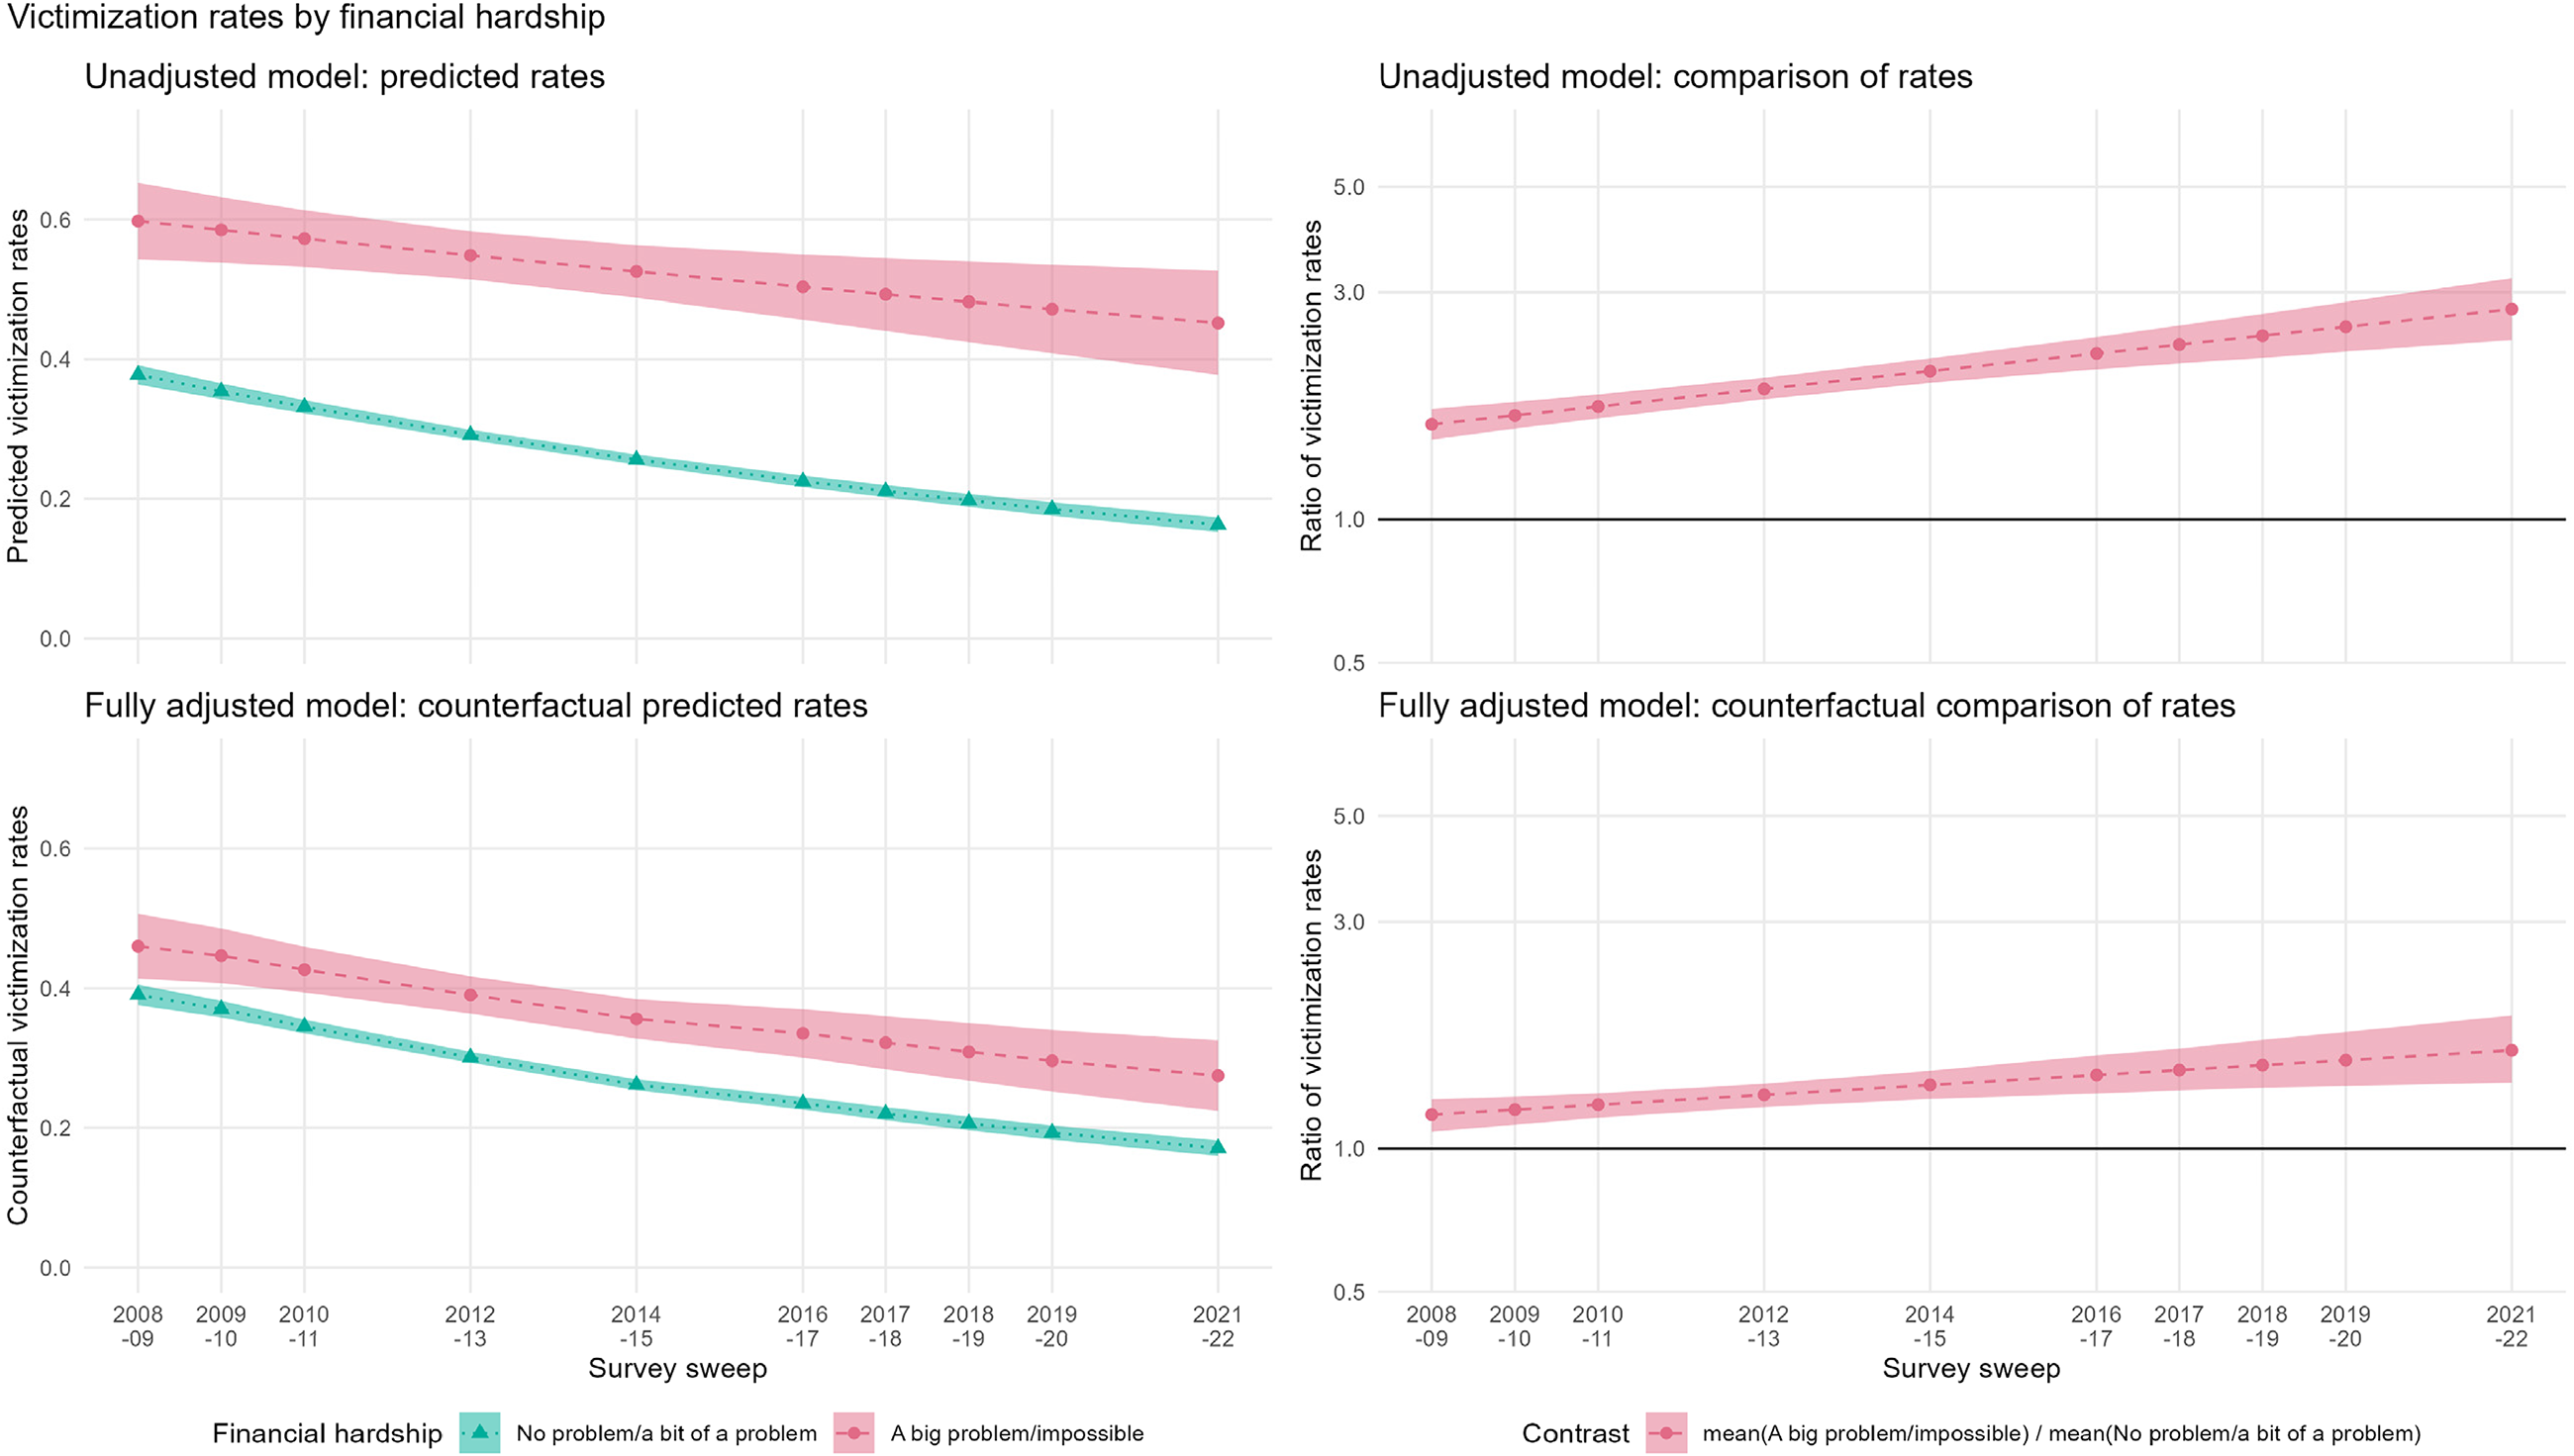
Modelled victimization trends and inequalities by financial hardship.
The trends in victimization rate by age group, shown in Figure 1, are almost identical for the unadjusted and adjusted models. It is clear that the largest decline in victimization occurred amongst the youngest age group (age 16–24), with the rate for this group becoming indistinguishable to that for those aged 25–44 by around 2016/2017, and approaching the rate for those aged 45–64 by 2021/2022. The lack of difference between the two models suggests that this age-related trend was not being influenced by any of the other socio-demographic characteristic examined in this analysis. A gradual narrowing of the victimization inequality gap between these three age groups is confirmed by the unadjusted and adjusted IRR trendlines which, by 2021/2022, have overlapped completely. However, the gap between the reference line and the IRR trendlines for the other three age groups confirms an ongoing victimization inequality compared to the reference category (age 65+).
Figure 2 shows that the gap between victimization rates for men and women narrowed over time, with men being net winners during the crime drop. Again, the strikingly similar pattern for the unadjusted and adjusted models suggests that change over time in the victimization rates for men and women were not being influenced by other variables included in this analysis. The IRRs for both models suggest that the narrow victimization inequality gap that existed between men and women in 2008/2009 had closed by around 2014/2015.
The unadjusted model for Figure 3 shows no significant difference between the three ethnic groups based on trends in the victimization rate (as the shaded ribbons are overlapping). However, the adjusted model suggests that the modelled victimization rate for people identifying as white Scottish/British was higher than that for the other two ethnic groups from 2008/2009 until around 2016/2017, but around the same thereafter. This suggests that some ethnic differences in victimization in the unadjusted rates are being masked by other characteristics included in the analysis.
The IRR trendlines show change in victimization inequality between people from a minority ethnic background and those who were white Scottish/British after 2008/2009; however, the question as to whether the inequality gap narrowed or widens depends on which model is examined. The unadjusted model suggests that there was no victimization inequality between the minority ethnic and white Scottish/British groups in 2008/2009; however, an inequality gap emerged over time, with those from minority ethnic groups having a greater risk of being victimized from around 2016/2017 onwards. Whereas, when accounting for other socio-demographic characteristics, the adjusted model suggests that people from minority ethnic backgrounds were less likely than those from white Scottish/British backgrounds to be victimized in 2008/2009; but by around 2016/2017 there was little difference. For those in the white other ethnic group, there was no victimization inequality compared to the white Scottish/British group in the unadjusted model, but there was in the adjusted model.
In Figure 4, the trendlines for the unadjusted model shows that victimization rates for disabled and non-disabled people were virtually identical in 2008/2009, but the trends diverged over time as the rate of victimization fell more steeply for people without disabilities. This is reflected in the IRRs, which show an increase in victimization inequality based on disability status over time. The trendlines for the adjusted model show a similar rate of decline for both disabled and non-disabled people over time; however, the gap between the two groups remains fairly constant. The difference compared to the unadjusted model is that the adjusted estimates of victimization rates for people with disabilities were higher when other factors were taken into account. As shown by the adjusted IRRs, this means that controlling for other characteristics revealed an otherwise hidden victimization inequality between disabled and non-disabled people in 2008/2009 that grew over time.
Finally, the trendlines for Figure 5 show a far greater difference between victimization rates by financial hardship in the unadjusted model than the adjusted model. The trendlines for the unadjusted model suggests that victimization rates were considerably higher for those in financial hardship than those who were not, while the IRRs provide evidence of victimization inequality between groups in 2008/2009 which increased over time. The adjusted model suggests a much narrower gap in victimization rates between groups based on financial hardship status, and the IRRs show a far lower level of victimization inequality, albeit there is still evidence of increasing inequality between groups over time.
Discussion
While victimization inequality is not a new concept, research in the context of the global crime drop has increased its prominence (Hunter and Tseloni, 2025). By addressing three key methodological limitations of prior research our study makes a novel contribution to the growing body of literature in this field. While we cannot claim that our results are generalizable to other jurisdictions, they do offer important insights about stability and change in victimization inequality in Scotland, and provide new insights about measuring victimization inequality that could contribute to both criminological theory and policy decision-making.
Like other UK-based research (Dinisman and Moroz, 2016a, 2016b), we found that age-related victimization inequality fell over time in Scotland. This aligns with wider debates about how young people shaped the crime drop (see Estrada et al., 2016; Matthews and Minton, 2018) and supports arguments that age effects should be added to Farrell's (2013) criteria for theories explaining the crime drop (see Matthews and Minton, 2018). Unlike other studies, however, we revealed a tighter closing of the inequality gap between those aged 16–24 and the two nearest age groups (25–44 and 45–64); whereas, there continued to be a wide and broadly stable pattern of victimization inequality between the oldest group (age 65+) and everyone else. This means that, while the youngest people in society were the biggest relative winners during the crime drop, their risk of victimization continued to be considerably higher than that of the elderly population.
We found a small, but statistically significant, degree of victimization inequality between men and women in Scotland in 2008/2009, but greater reductions for men than women over time meant that victimization inequality disappeared. This is consistent with research in England and Wales (Dinisman and Moroz, 2016a, 2016b); albeit, other studies conducted in the UK (Cooper and Obolenskaya, 2021; Ganpat et al., 2022) and the US (Heimer and Lauritson, 2008) found that changes in the gender gap varied by crime type. There may be many reasons for this narrowing of the victimization gap between men and women which we cannot speculate on from this analysis. But while reducing sex inequality aligns with Rawl's (1999) ideals of distributive justice, greater sex equality may represent a ‘backlash effect’ when seen through a feminist lens, especially where this relates to violence (see Vieraitis et al. 2011).
While levels and trends in victimization inequalities for age and sex varied little by unadjusted and adjusted analysis, this was not the case for ethnicity, which illustrates the strength of using both forms of analysis. People from minority ethnic backgrounds in Scotland benefited less from the crime drop than white Scottish/British people; but whether this led to an increase or decrease in victimization inequality between groups depends on the type of analysis used. Data visualizations for the unadjusted analysis showed an emerging ethnic inequality over time while adjusted analysis suggested that an existing inequality disappeared. The difference is due to the estimated baseline victimization rates, which varied depending on whether other characteristics of those in the minority ethnic group were accounted for or not.
These results conflict somewhat with those of Dinisman and Moroz, who found a similar drop in violent victimization for white and non-white groups (2016b), but no consistent pattern for theft victimization (2016a). Exploratory analysis of our data (see Supplementary Materials) suggested that the primary driver of this difference was age, as the minority ethnic group was younger, on average, than the Scottish/British group. However, there was considerable uncertainty in our model (due to the small sample of people from ethnic minority backgrounds in SCJS), so we urge caution around drawing any firm conclusions from these results. Nevertheless, given concerns within Scottish Government around addressing racial inequality (McKelvie, 2020), improvements in the methodological design of the SCJS are recommended to generate greater clarity around ethnic inequality in risk of victimization.
An increase in inequality between disabled and non-disabled people was clearly evident from our analysis. However, data visualizations for the unadjusted models showed an emerging inequality, whereas the adjusted model showed an enduring inequality. This means that the confounding effect of other characteristics masked a disparity in victimization rates between disabled and non-disabled people in 2008/2009 when only unadjusted analysis was considered. These findings align with those of Rossetti et al. (2016) who found increasing victimization inequality by disability in England and Wales; although they differ in as much as Rossetti et al. observed no reduction in victimization amongst those with a disability, which there was in Scotland. Our findings also validate national wellbeing statistics for Scotland, which reported increased victimization inequality for disabled people during the crime drop (Scottish Government, 2019b); albeit, this report only used unadjusted measures so did not show the true extent of the inequality. As for ethnicity, hidden inequality in unadjusted data for disability was most likely due to the confounding effect of age. Many people with disabilities are elderly and, because old age has a protective effect, our adjusted comparisons effectively show what victimization rates would look like with an equal age distribution. Again, these results demonstrate the value of studying both types of inequality measure.
Previous studies have largely focused on low income as a measure of poverty, rather than financial hardship, but our results broadly support those of Levitt (1999), Thacher (2004), and Nilsson and Estrada (2006). Both the unadjusted and adjusted models for financial hardship showed an enduring inequality; albeit, the adjusted model showed this to be lower than the unadjusted model (suggesting some confounding effects from other variables, potentially disability or ethnicity). The unadjusted model for tenure also showed inequality between home renters and owner occupiers. We cannot be certain why poverty may have become an increasingly salient driver of victimization in Scotland, although others have proposed credible theories. For example, people in financial difficulty may not be able to afford security devices (Tilley et al., 2011), or they may have lifestyles and leisure activities that increase their victimization risk (Aebi and Linde, 2010).
Some of our findings did not align with other studies. For example, Kaylen et al. (2017) found important differences across urban, suburban and rural communities, whereas we did not. This may well be due to differences in measures, study design or outcome variable, although it also highlights the importance of context in conducting this type of analysis. Despite a global crime drop, it is by no means certain that crime fell comparatively the same way cross-nationally.
Implications for criminology
Our study contributes to a growing body of criminological scholarship around victimization inequality in the wake of the global crime drop, much of which has theorized about the extent to which this has created distributive injustice (e.g., Hope and Norris, 2013; Hunter and Tseloni, 2016, 2025; Ignatans and Pease, 2015a; McVie et al., 2020). However, it raises questions about existing approaches and assumptions that need further consideration. From an outcomes perspective, some researchers have argued that it is most important to focus on ‘vertical equity’, where victimization reduces at a faster rate for those at highest overall risk, as this achieves greater distributive fairness than ‘horizontal equity’, where victimization reduces at the same rate for everyone (Hunter and Tseloni, 2016, 2025). While we agree in principle that vertical equity is desirable, we would argue that focusing principally on this conceptualization of inequality risks overlooking important theoretical nuances in the nature, extent and patterns of victimization inequality.
We identified growing vertical equity by age and gender using both adjusted and unadjusted measures, which could contribute to theories of growing distributive justice. Albeit, from a Rawlsian (Rawls, 1999) perspective, a just crime drop should disproportionally benefit the least advantaged members of society, so our findings in relation to victim gender (which indicated that women benefited less from the crime drop than men) are theoretically problematic. Caution is required in drawing conclusions based on gender, as it has been observed that victimization surveys may do a worse job of reflecting women's experiences of victimization than men's, at least for some crime types and definitions (Davies et al. 2025). Testing our methodological approach across crime types and definitions would be a promising area for future research.
For disability, ethnicity and financial hardship, we found inconsistent results with regards to vertical equity across our unadjusted and adjusted models, but uniformly clear evidence of inequality. As Hunter and Tseloni (2016: 4) note, ‘different conceptions of equality imply different types of policy goals, and require different combinations of policy instruments if they are to be realized’. It is imperative, therefore, that such conceptions also allow us to understand equity and equality in their wider, relational, context. If the crime drop has been achieved at the expense of fairness, this raises important questions about the extent to which distributive justice can ever be achieved.
Implications for policy
Distinguishing between unadjusted and adjusted estimates of victimization inequality could help to inform better policy responses to crime prevention. For example, unadjusted measures that demonstrate change in victimization inequality for specific socio-demographic groups (regardless of other characteristics) could be valuable in targeting victim support services at those who benefitted least from the crime drop. Despite a crime drop dividend for all socio-demographic groups in Scotland between 2008/2009 and 2021/2022, some clearly benefited more than others. Our findings from the unadjusted analysis suggest that tertiary crime prevention efforts (van Dijk and de Waard, 1991), such as victim support services, should be focused on a variety of groups, including women, people from minority ethnic backgrounds, disabled people, those in financial hardship and home renters. Whereas our adjusted measures show an increase in inequalities based on ethnicity, disability and financial hardship that are not explained by other factors. This information could be used to design more targeted secondary crime prevention measures where intervention will make the biggest difference in terms of reducing further risk. Being able to see the big picture in terms of both absolute and relative inequalities could enable the design of more ‘joined up’ policy responses that cut across policy domains and identify interconnected secondary crime prevention approaches.
Limitations
This study has several limitations. First, the estimated relationships between different characteristics and victimization are only as robust as the indicators used to measure them. In some cases, such as age and ethnicity, we were constrained to use the categories available to us and that were consistently coded over time. In other cases, it would have been preferable to supplement the measures used with additional information, such as combining our measure of financial hardship with data on income. These constraints are common to analyses of secondary survey data, and are counterbalanced by the breadth and temporal scope of the data in the SCJS in answering our research questions.
Second, our results are conditional on the model specifications. Our modelled estimates of victimization inequality for ethnicity had substantial uncertainty, and more bespoke models could be tailored to estimate the prevalence of victimization amongst minority ethnic respondents specifically (see e.g., Gao et al. 2020). Whilst there are open questions about how these models can be best applied to survey data, we believe this to be a promising avenue for further research.
Finally, whilst our results have possible implications for crime prevention strategies – particularly important in the context of the limited financial and human resources available to the justice system – some measures have in the past been contentious, facing criticism for potentially stigmatizing groups they are intended to help (Sutton, 1994). Policy responses to the changing landscape of victimization in Scotland need to bear both of these factors in mind. Our results can only be a first step towards helping the response to victimization in Scotland match the changing realities of victimization over the crime drop.
Conclusion
This paper contributes to the existing literature by offering a more developed approach to understanding stability and change in victimization inequality using Scotland as a case study. From a methodological perspective, it addresses three key limitations of the existing literature, and challenges others to adopt a similar approach. It contributes to criminological knowledge by highlighting a different narrative around victimization inequality that is missing from the extant literature. And from a policy perspective it demonstrates that, despite reductions in victimization risk across all socio-demographic groups, there is still work to be done in reducing inequality amongst some of the most vulnerable groups in Scottish society. Further research is needed in this field to test our methodology in other jurisdictions and further develop our understanding of how and why certain groups benefited less from the global crime drop than others.
Supplemental Material
sj-docx-1-euc-10.1177_14773708261427682 - Supplemental material for Who benefited most from the crime drop? Measuring stability and change in victimization inequality across different socio-demographic groups
Supplemental material, sj-docx-1-euc-10.1177_14773708261427682 for Who benefited most from the crime drop? Measuring stability and change in victimization inequality across different socio-demographic groups by Ben Matthews, Susan McVie and Paul Norris in European Journal of Criminology
Footnotes
Acknowledgements
We would like to thank all those involved in the commissioning, design, delivery and archiving of the Scottish Crime and Justice Survey for their work in producing and curating the data used for analysis. We would like to thank Louise Brangan and Josiah King for comments on an earlier version of this manuscript.
Ethical approval and informed consent statements
This research was reviewed and approved by the University of Stirling General University Ethics Panel (Reference Number EC 2025 23483 17691).
Author contributions
Ben Matthews: conceptualization, methodology, analysis, writing – original draft preparation, and writing – reviewing and editing. Susan McVie: conceptualization, methodology, writing – original draft preparation, writing – reviewing and editing, and funding acquisition. Paul Norris: conceptualization, methodology, writing – original draft preparation, and writing – reviewing and editing.
Funding
The author(s) disclosed receipt of the following financial support for the research, authorship, and/or publication of this article: This work was in part funded by Economic and Social Research Council (ESRC Grant Reference ES/P009301/1) as part of the Understanding Inequalities project.
Declaration of conflicting interests
The author(s) declared no potential conflicts of interest with respect to the research, authorship and/or publication of this article.
Data availability statement
Scottish Crime and Justice Survey data are available via the UK Data Service. https://beta.ukdataservice.ac.uk/datacatalogue/series/series?id=2000046. Code used for analysis is available at ![]() .
.
Supplemental material
Supplemental material for this article is available online.