
Abstract
Wind energy is proving to be the backbone of the transition to sustainable electricity generation. However, due to the permanent increase in wind turbine rotor blade length to achieve higher capacities, the already challenging transportation process of rotor blades becomes even more difficult, which can be addressed by segmenting the parts. This work presents several measurement campaigns of bolted connections used to couple the structural parts of wind turbine blades, monitored by both passive low-frequency strain measurements and active high-frequency ultrasonic waves. The comprehensive test concept enables gaining insight into the degradation process of the connection type under different loading conditions. Moreover, the monitoring systems are analyzed separately, and the impact of data fusion by combining the obtained scores is thoroughly investigated. The results reveal the strong need for more reliable analysis of the individual measurement systems. Particularly challenging is the high number of false positives due to the ultrasonic guided wave’s high sensitivity. The additional strain measurements incorporated at the decision level address this endeavor, despite their lower sensitivity, thereby increasing the reliability of the results at the macroscopic level. Overall, the study presents extensive test results for bolted connections under various loading conditions and demonstrates the reliable monitoring of the system employing decision-level data fusion.
Introduction
The expansion of wind energy and the reduction of energy production costs through larger wind turbines are crucial components of the energy transition. Modern blades often exceed 80–100 m in length, making transportation and installation increasingly complex. 1 The static and dynamic loads on structural components, which increase with rotor blade length, require the use of new structural and monitoring technologies. To address these difficulties, the industry has developed segmented rotor blades, which are manufactured in multiple sections and assembled directly at the wind farm site. The segmentation approach allows for easier transport along transport routes that would otherwise be impossible for a single-piece blade. Beyond addressing logistical barriers, segmented blades also enable larger rotor diameters, thereby enabling higher energy yields. The concept relies on carefully engineered joints that ensure both structural strength and aerodynamic smoothness, thereby matching the performance of a conventional blade. Additionally, segmented designs can simplify maintenance, as damaged sections can be replaced individually rather than removing an entire blade. 2 The connection technology required to join the rotor blade segments significantly increases the complexity of the rotor blades. Due to a lack of experience in the design, manufacture, inspection, and repair of these complex connection structures, it can be assumed that the high level of reliability required for future rotor blades cannot be maintained. 3 A defect in the connection technology of segmented rotor blades usually leads to the failure of the entire rotor blade, thus reducing the economic efficiency of wind turbines.
Therefore, the connection type requires proper investigation, and structural safety must be ensured throughout the wind turbine’s lifetime. That is where structural health monitoring (SHM) comes into play, which involves the real-time tracking of the health condition. It is common practice to define the objectives of SHM in a hierarchical order in which each level requires the previous one: detection, (ii) localization, (iii) classification, (iv) quantification, and (v) prediction of the remaining service life.4,5 Damage localization in SHM is feasible at best when utilizing unsupervised techniques that do not require labeled damaged states. The monitoring can be divided into whether a few sensors are attached to track the health status via global analysis, or into locally instrumented sections where damage is expected to occur. 6 In wind turbine blade monitoring, the local SHM approach is more commonly employed, with dense sensor deployments concentrated in high-risk joints to increase sensitivity to incipient damage. Active techniques inject controlled excitations and measure the system’s response (e.g., guided waves, impact–echo). In contrast, passive techniques listen to ambient or self-generated signals (e.g., acoustic emission, operational vibration), exploiting the structure’s natural response without external actuation. 7 Current research highlights that different types of segmented blades exist: (a) lap-joint, (b) butt-joint, (c) scarf-joint, and (d) stepped-joint. 8 Among these, the lap-joint is currently considered the most suitable configuration for large-scale offshore wind turbine applications due to its proven structural performance and assembly feasibility. Strain-based monitoring using strain gauges (SGs) is widely utilized to track macroscopic load transfer and identify typical bearing failure modes such as hole elongation; for instance, McCarthy et al. 9 utilized local strain distributions to analyze load-sharing imbalances in multi-bolt composite joints, while Ihn and Chang 10 demonstrated that monitoring local strain gradients is critical for detecting fastener-induced damage progression under fatigue loading. Complementing these passive measurements, active sensing via piezoelectric transducers (PZTs) targets incipient microscopic damage. Kessler et al. 11 established the high sensitivity of Lamb wave propagation to internal structural changes such as matrix cracking and delamination, even within the complex stress concentrations typical of bolted assemblies. Pedersen et al. 12 proposed a segmented wind turbine blade that can be assembled from multiple sections, with a mechanical joint between them instrumented with sensors. For instance, sensors can be directly embedded in or near the mechanical joining elements based on the principle. Acoustic emission techniques allow for the passive detection of damage through elastic waves, 13 whereas active waves allow for the monitoring of structural integrity through actuator-receiver pairs. 7 In global dynamics, natural vibrations and modes are identified using modal analysis to correlate modal parameters to changes in the material integrity. 14 However, conventional techniques do not provide sufficient reliability to monitor the complex joint. Therefore, hybrid approaches that combine multiple types of measurements are being increasingly investigated. When multiple data sources are available, data fusion techniques can be employed to improve overall robustness and accuracy. This is particularly useful in the area of segmented rotor blades, as it combines global and local indicators of expected damage.
Data fusion in machine learning is the process of integrating data from different sources or modalities to obtain more comprehensive, reliable, and meaningful information. 15 This methodological approach aims to leverage the individual strengths of each data source while compensating for its weaknesses. The definition of data fusion includes the combination of sensor data or information derived from multiple measurements. These measurements can either come from different sensors or be collected by a single sensor at different points in time. Data fusion occurs at three levels: data, feature, and decision levels. 16 The data level describes the consolidation and analysis of decisions or evaluations based directly on sensor data of the same type (e.g., two temperature signals or two vibration signals). However, the idea is to explicitly combine a high-frequency and a low-frequency measurement system so that the data level is disregarded. Feature-level fusion with multiple linear regression is a powerful approach that models the relationship between multiple independent variables and a dependent target variable. At this level, decisions based on sensor data characteristics are merged. The decision-level form is often used to combine multiple decision models or algorithms to improve overall accuracy. The decision models or algorithms are usually trained separately and then merged at this level, keeping the individual strengths.
In feature-level fusion, Schnur et al. 17 proposed an approach based on a machine learning toolbox for condition monitoring that combines several complementary algorithms and focuses on the physical interpretability of the results, and examined the same dataset examined in this study. Several feature extraction methods, including principal component analysis (PCA), were used to reduce dimensionality. Then, feature selection methods were applied to identify the optimal reduced-feature combination and to classify based on the structural condition. Eleftheroglou et al. 18 utilized a Hidden Semi-Markov model to prognose structural performance. Acoustic emission and digital image correlation features are combined to obtain a more reliable feature. Broer et al. 19 combined acoustic emission data and distributed fiber optical strain measurements on a feature level to test its performance on all SHM goals. Spatiotemporal features extracted from earth–rock dams were fused by Tian et al. 20 using graph convolutional networks and long short-term memory. The method allowed the fusion of complex information from multiple sources, such as water-level features; however, the authors emphasized a macroscopic view, suggesting sensitivity to early damage.
Mikhail et al. 21 investigated an aluminum plate fastened at its corners with four bolts, where a single fastener failure was simulated by reducing the torque applied to one of the bolts. Several decision-level fusion approaches were evaluated, with the Dempster–Shafer method and type-2 fuzzy logic fusion demonstrating the best performance. The authors also noted that there remains potential for further improvement in the results by incorporating prior knowledge. Yang et al. 22 combined ultrasonic guided-wave measurements and vibrational signals to achieve trustworthy health indexes. The proposed approach consists of four stages: multilevel sampling, Bayesian estimation, neural network-based confidence scores, and decision-level fusion. Experiments were conducted on an aluminum beam using a modal shaker to generate dynamic excitation artificially. Zhang et al. 23 investigated the analysis of heterogeneous measurements on a convolutional neural network. The steel frame bridge was equipped with accelerometers, SGs, and displacement sensors. The final score was combined by the individual analysis of each response type and a neural network combining all datasets. For a comprehensive overview, the interested reader is referred to Wu and Jahanshahi. 24
To the best of the authors, the approach pursued in this article, namely a hybrid system for monitoring highly stressed structural elements of wind turbine rotor blades, has not been considered to date and therefore offers considerable potential for development and application. By combining passive low-frequency strain and active high-frequency sensing, the proposed system provides a multi-scale monitoring approach that captures both early-stage microscopic degradation and macroscopic structural failure modes capable of all damage types. Special focus is given to the data fusion at the decision level, which aims to minimize false-positive alarms by weighting the relative contributions and confidence levels of the heterogeneous sensing systems. Regarding the current literature, the need for more data fusion solutions is particularly prominent. Especially in the context of segmented wind turbine blades, there is a research gap that needs to be filled. Feature-level fusion requires normalization techniques to compare the resulting indices. Moreover, the need for samples from the damaged state hinders the use of unsupervised algorithms. The inherent variability of damaged states makes it extremely difficult to provide a comprehensive dataset that ensures model reliability across the full spectrum of potential failure modes (delamination, bolt loosening, matrix cracking, etc.). Therefore, in this work, both models are employed separately, and the results are combined at the decision level.
The novelty of this work can be summarized as follows: Firstly, the results of segmented blades, related to extensive experimental testing of coupons and components, are illustrated, given the complex material’s static and cyclic loading behavior. Secondly, the investigations include a novel decision-level data fusion approach to minimize false positives. At the same time, a low-frequency passive system and a high-frequency active system are combined to successfully detect damage at early stages. To address the SHM objectives more explicitly, this work investigates whether deployable sensor data can reliably detect early-stage damage in highly stressed rotor blade elements and evaluates how decision-level data fusion improves robustness and reduces false positives compared to single-sensor approaches. These objectives guide the experimental design and the assessment of strain- and guided wave-based indicators under realistic loading conditions.
The article is structured as follows: The first section provides a brief introduction to the theoretical background of the mathematical models. In the second section, the original test concept and the experimental methods are demonstrated. The results of the experiments are shown in the following section. The mathematical analysis and results, including data fusion at the decision level, are illustrated in the fourth section. The article concludes with a summary of its findings and highlights potential directions for future research.
Mathematical methods
This section comprises an illustrative overview of the innovative decision-level data fusion employed throughout this work. The concept is based on using linear (PCA) and nonlinear (autoencoder) dimensionality reduction methods, in which the statistical models are forced to learn the relationships between the measured variables. Damage alters learned dependencies, leading to poor model performance and higher evaluation scores. Based on the individual anomaly-detection results, data fusion is performed at the decision level to leverage information from both systems.
Principal component analysis
PCA offers an unsupervised machine learning approach that summarizes the information content of large datasets into a smaller set of uncorrelated variables, called principal components. 25 These principal components are eigenvectors, ordered in descending order by the proportion of variance they explain in the data. Figure 1 illustrates an example in which two features (X and Y) are plotted, and the two corresponding eigenvectors (PC1 and PC2) are inserted. The components are orthogonal to each other, and PC1 explains more variance than PC2. The statistical technique involves both linear algebra and matrix operations and transforms the original dataset into a new coordinate system structured by the principal components. From there, the data is transformed back into the original space. This procedure can be used for reconstruction-based anomaly detection.
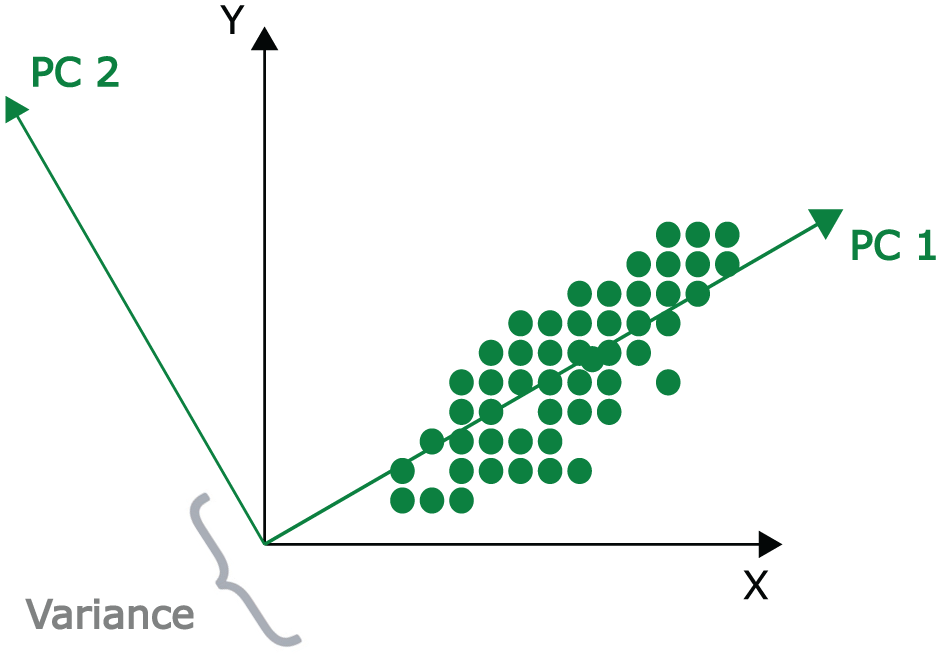
Transformation technique is illustrated for the application of PCA. PCA: principal component analysis.
In SHM, the principal components are derived from baseline data. Baseline data refer to measurements acquired under the structure’s healthy condition, enabling unsupervised damage analysis. After calculating the model’s deterministic parameters, the input data dimensions are reduced by projecting the data onto these principal components and evaluating the resulting reconstructions. Let
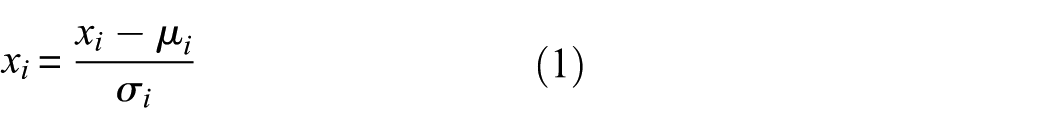
For a sample
Autoencoder
The autoencoder aims to reconstruct the original input based on the most relevant features by compressing the information into a latent representation.
26
As illustrated in Figure 2, the network consists of an encoder that maps the input to the lower-dimensional representation and a decoder that generates the corresponding output. The original input
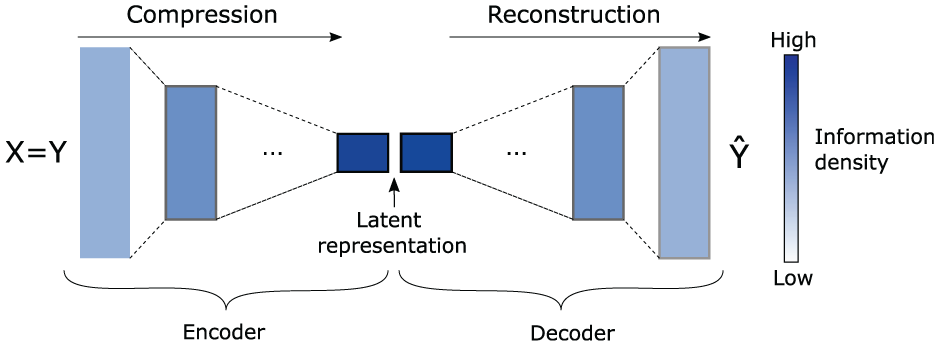
Basic structure of the autoencoder. 26
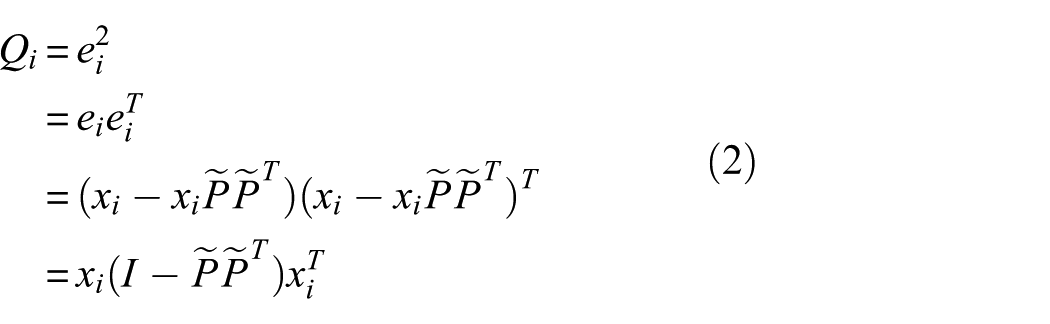
The reconstruction error of an autoencoder, denoted as

where
For the unsupervised learning process, 66% of the healthy baseline data are utilized for training, where each measurement time point is treated as an independent variable to characterize the undamaged state. By mapping the standardized signals, the model extracts non-linear key features inherent to the measurement response, as suggested in the study by Abbassi. 27 Once the model is established on the baseline data, it is applied to unknown measurements to identify deviations without requiring retraining.
Decision-level data fusion
Figure 3 provides an overview of the three stages of data fusion. Data-level fusion integrates information from multiple sources to achieve a more comprehensive evaluation. 28 Only data of the same type or trend can be taken into account; therefore, the level has not been used for data fusion in this context. Feature-level fusion combines different features to enhance reliability, although it can be affected by normalization issues. Decision-level fusion, typically implemented through linear methods, merges the predictions of multiple systems to produce a unified decision. 29 The method has been chosen in the context of segmented rotor blade monitoring as the feature-level requires data from the damaged state. Moreover, the benefits of the highly sensitive piezoelectric sensors are balanced with the robustness of the passive monitoring system.
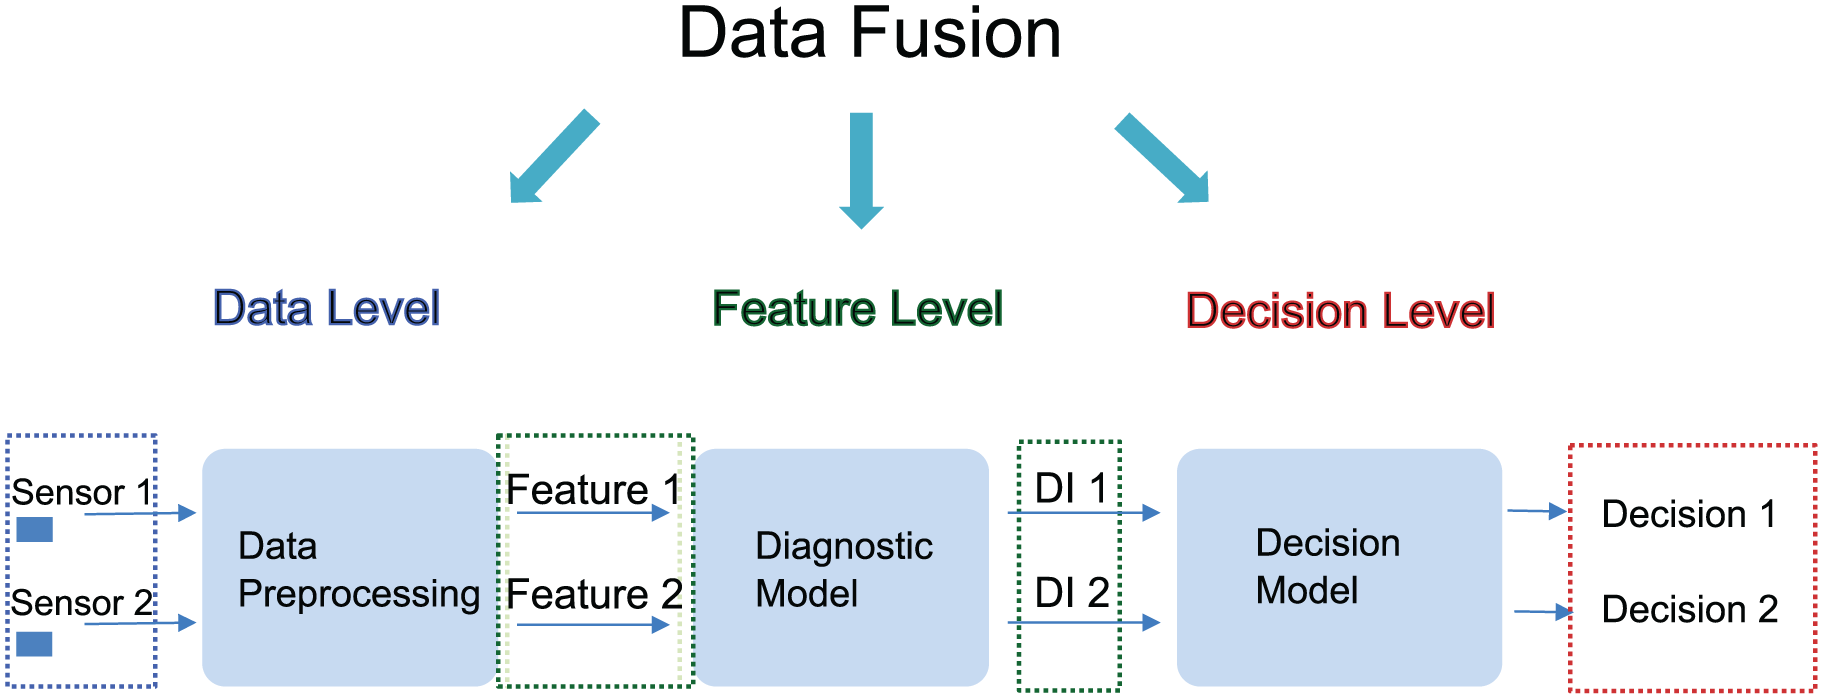
Workflow illustrating the different types of data fusion.
The damage indicators for both systems, the Q-index (cf. Equation (2)) and the
Here,
where
Experimental methods
The tests carried out were technically demanding and non-standardized tests, which were preceded by intensive planning and development. To investigate the bolted joint connections in segmented rotor blades, the study employs a multi-level experimental approach—ranging from single-bolt coupons to multi-bolt components—subjected to both static and cyclic loading. For further information regarding the overall scale, see the study by Wierach et al. 30 This section, therefore, provides an overview of the choice and realization of the sample design, the production of the test specimens, the test setup, the test procedure, and the measurement technology used.
Specimen design and fabrication
Based on the state of the art of joining techniques for segmented rotor blades, which includes adhesive, screw, and bolt connections of thick fiber composite laminates, the bearing properties of thick CFRP (carbon-fiber reinforced polymer) laminates and the associated complex damage behavior in the interaction of bolt and hole were identified as a critical problem to be monitored. The laminate-bolt connection shown in Figure 4 was selected as a representative connection configuration for well-founded investigation on a laboratory scale. In this connection, flanges support the laminate in the thickness direction. The flange consists of a screwed-on slotted nut plus washer. A longitudinal hole in the bolt is used for inner water cooling to keep down friction-related temperature during the fatigue experiments.
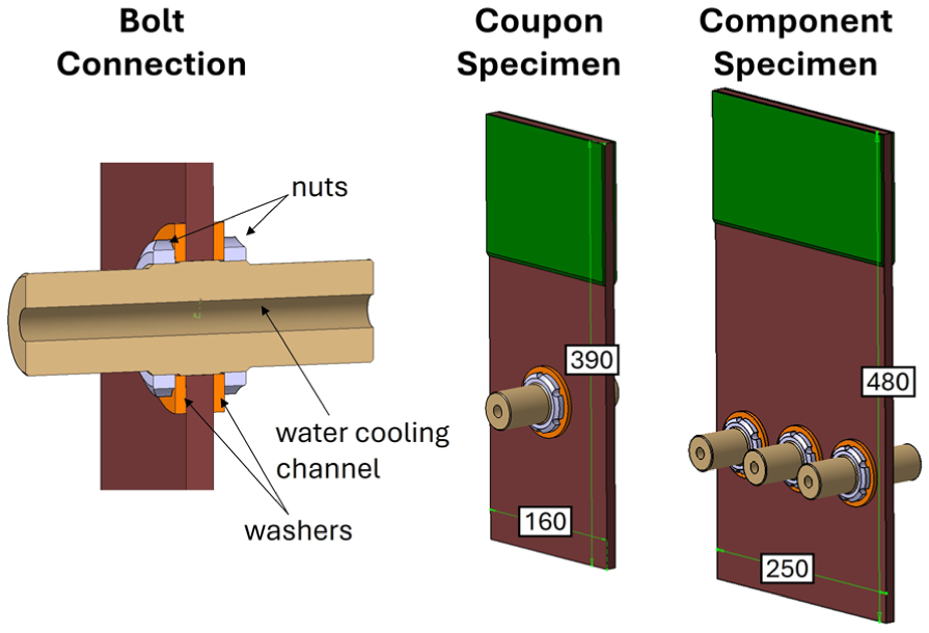
Overview of bolt connection type and both specimen types with dimensions given in mm. Specifically, the flange is composed here of two components: a screwed-on slotted nut and a washer.
Two specimen types with different complexities and intended final failures were defined. The first one, a specimen with one central bolted connection, referred to as coupon specimen, is used to conduct SHM at moderate structural complexity. This specimen is intended to show regular bearing failure. The second configuration, a larger test element with three bolts, representing the interaction of multiple closely spaced connections in a more realistic manner, is referred to as component specimen, which typically manifests a tensile net-section fracture.
Based on extensive research, requirements were defined for the material, specimen geometry, and test procedure. Commercial, typical rotor blade fiber/matrix systems and a standard infusion process (fiber volume fraction 50–60%) were used. A representative laminate thickness of 10 mm and a scaled-down bolt diameter of 39 mm were defined for the laboratory scale. The choice of a 10 mm laminate thickness and a 39 mm bolt diameter for the specimens was driven by the technical constraints of the available laboratory testing equipment while maintaining structural representativeness.
The geometries were designed so that coupon specimens exhibit a defined bearing failure and component specimens exhibit a net cross-sectional failure. The dimensioning was carried out analytically and numerically, taking into account the available testing equipment (max. 1 MN axial tension/compression). Both specimen variants are made of the same laminate material to ensure comparability.
All samples were produced by the project partner INVENT GmbH using a vacuum infusion process. A quadraxial carbon fiber fabric Q-C-806 g/m2 from SAERTEX was selected as the reinforcing fiber material. The epoxy resin EPIKOTE RIMR035c with the corresponding amine hardener EPIKOTE RIMH038 from HEXION was used as the matrix. The following layup was selected for the laminate structure: (−45°/90°/+45°/0°)6 s.
Finite element simulations (ANSYS) supported the evaluation of the strain distributions and the selection of suitable sensors and their positions, shown in Figure 5.
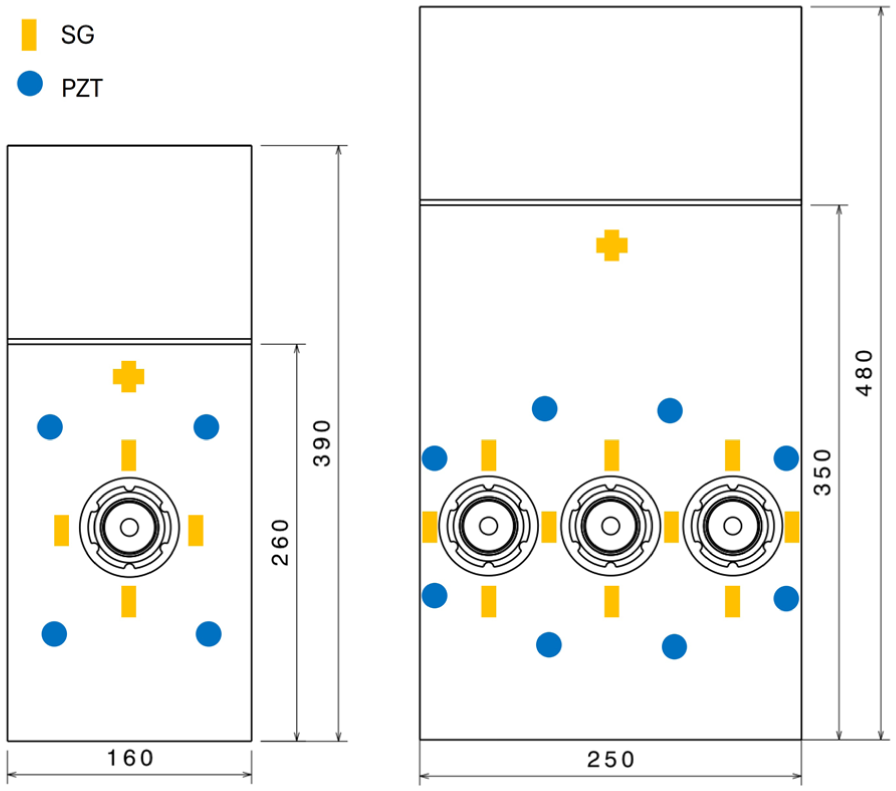
Representative instrumentation plan of both specimen types showing the main SG and PZT (DuraAct) positions. SG: strain gauge; PZT: piezoelectric transducer.
Specimen instrumentation
Once the coupons were designed, a requirements catalog was developed to define the sensor layout, the sensor type, and the number of sensors. To establish these specifications, extensive investigations were conducted on the distribution of strains and stresses under both dynamic and static loads, as well as on the optimal placement of sensors for SHM. Based on these findings, several design concepts were formulated and validated in consultation with the project partners. The coupon specimen is instrumented on the front side with four uniaxial SGs in the longitudinal direction (X) and one biaxial SG (XY). The SGs were reset to zero after applying the bolt preload. The strains analyzed, therefore, represent the changes compared to the preloaded initial state of the connection. The bolts were assembled using slotted nuts and washers to ensure a uniform distribution of compressive stresses within the laminate. For the installation, a maximum tightening torque of 300 Nm was established. On the rear side, four PZTs manufactured by PI Ceramics GmbH are provided for standard instrumentation. The sensors are DuraAct piezocomposites (10 mm diameter, 0.2 mm thickness) made of PIC 255. They were applied using a high-quality two-component epoxy adhesive in a uniform, thin layer to ensure efficient signal transmission. In addition, extended instrumentation (eight PZT) was used on two samples. The instrumentation of the component samples was carried out in a similar way, whereby the number of sensors is greater due to the number of holes. As the biaxial SGs proved to be less fatigue-resistant than the uniaxial sensors, only uniaxial SGs were used for the component specimen analysis. The passive, low-frequency strain measurements are combined with the high-frequency guided waves measurements to increase the trustworthiness of the results. These methods differ in both their physical nature and their temporal and frequency-based characteristics.
Testing equipment and procedure
The static and dynamic tests were carried out on a servo-hydraulic 1 MN universal testing machine (SCHENCK, TestControl II control system from ZwickRoell) with the fixture designed and manufactured by the project partner INVENT GmbH. A hydraulic clamping fixture model MTS647.100 from the manufacturer MTS (MTS Systems Corporation, Eden Prairie, MN, USA) was used for clamping the specimens on the tabbed side. The test was controlled using TestXPert R from ZwickRoell GmbH & Co. KG, Ulm, Germany (Figure 6).
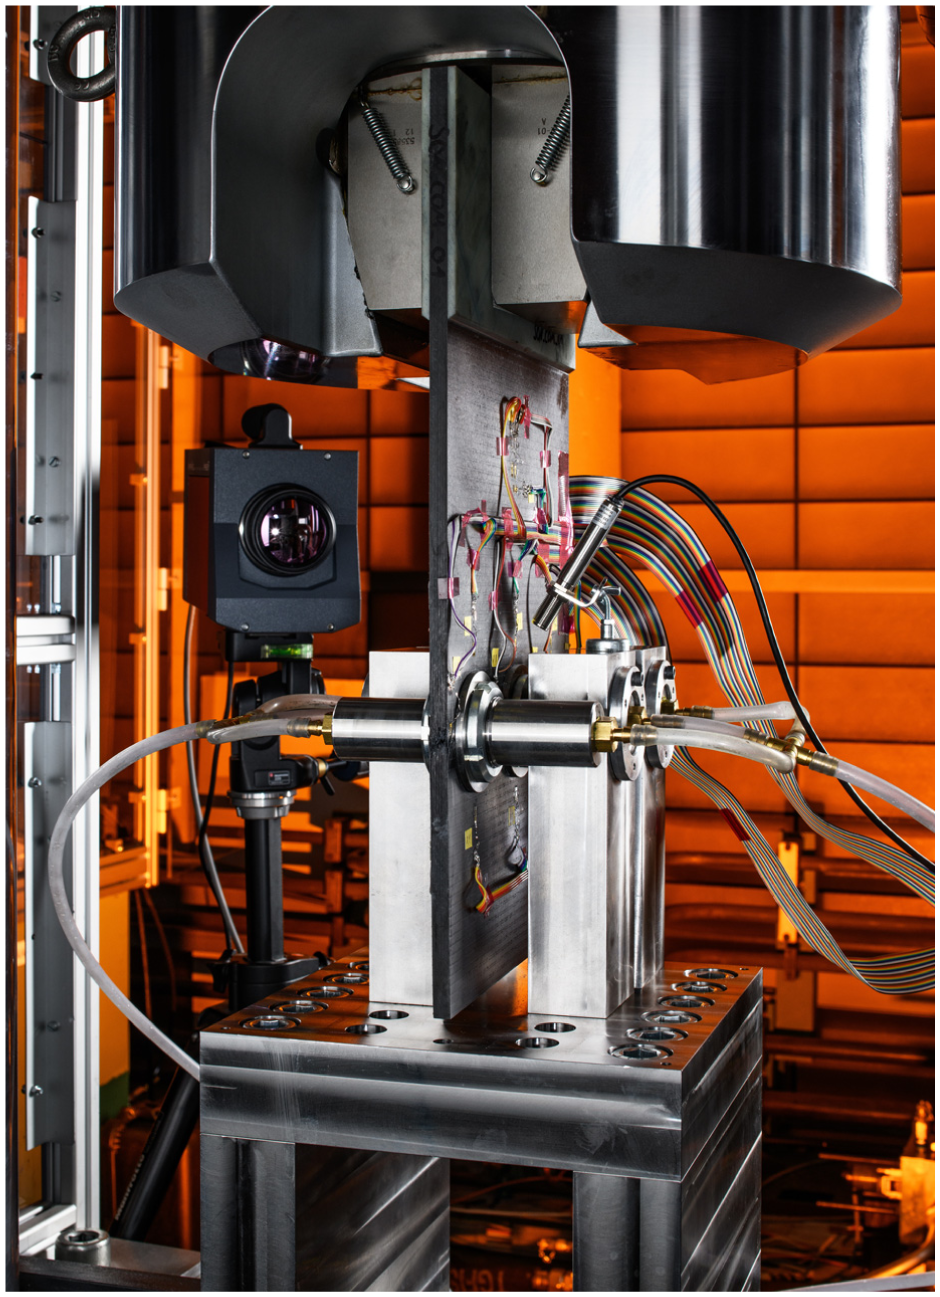
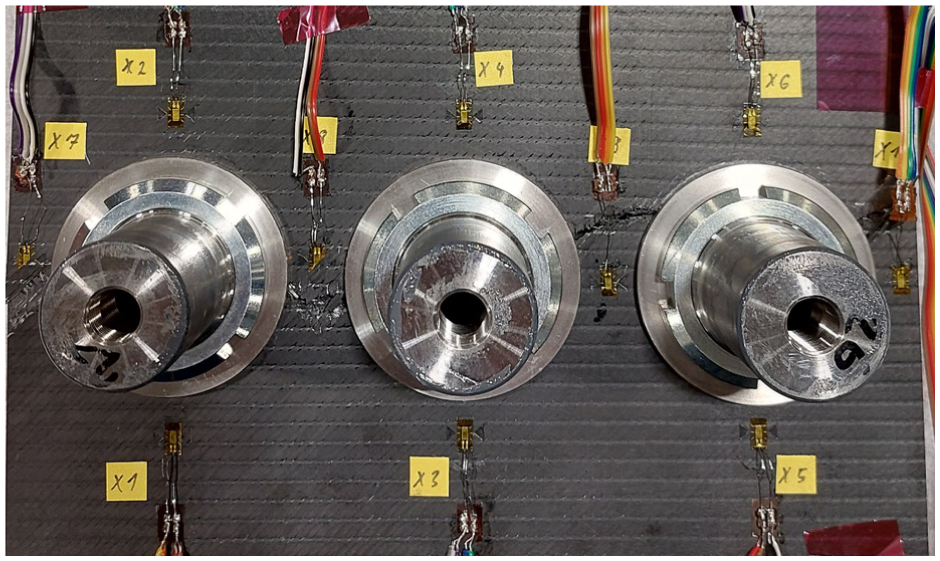
Test setup showing a failed component specimen with the front bearing connection disassembled.
The HBM Quantum X (840, 1615) measurement system and Catman AP software from Hottinger Brüel & Kjær (HBK) (Darmstadt, Germany) were used to record and visualize the measurement data from the testing machine, the SG signals, and the temperatures. The guided-ultrasonic-wave-based SHM was realized using a PXI system from National Instruments. This hardware system is suitable for measuring both guided waves and acoustic emission and is available at the DLR (German Aerospace Center). The system has a controller on which the software for data acquisition and evaluation runs, as well as a signal generator, amplifier, oscilloscope, switchable sensor matrix, and optional temperature measurement module. The switchable sensor matrix module has connections to which a maximum of 36 sensors can be connected. The electrical connection between the actuators and sensors and the measurement hardware is established using shielded coaxial cables to reduce interference and signal crosstalk from the transmitting to the receiving line. Typical parameters of the excitation signal are excitation frequencies between 40 and 250 kHz, a sine burst with 3–5 pulses, possibly with a Hanning window, and excitation voltages between 15Vp-p and 200Vp-p. In the preliminary tests, a high-end Infratec ImageIR® 8300 hp thermographic camera with IRBIS Prof. 3 was used for the surface measurements of the specimen heating. The measurement systems (HBM Catman, SHM system) were triggered by TestXPert R via analogue trigger signals.
The static tests were conducted as quasi-static ramps with monotonically increasing load and active measurement data acquisition of all systems. In individual tests, load increase tests (ramp sequence with holding steps) were carried out, whereby SHM measurements were performed on the holding steps. A more complex test sequence had to be realized for the dynamic tests. In view of the fact that the SHM measurements in particular were carried out on the stationary component (unloaded, static tensile load, static compressive load), the normally cyclic test was divided into a repetitive sequence of static ramps and a cycle block. The respective measurement data acquisitions were carried out at different times during the test sequence. An illustration of the test procedure and the measurement data acquisition/trigger times is shown in Figure 7. The ramps were recorded continuously for the strains and the direct machine data (force, displacement). Within a cycle block, the first load changes were stored in full in order to be able to evaluate the hysteresis behavior, and the envelopes (upper and lower peak values) were stored continuously. The peak value recording was realized in Catman using peak valley detection.
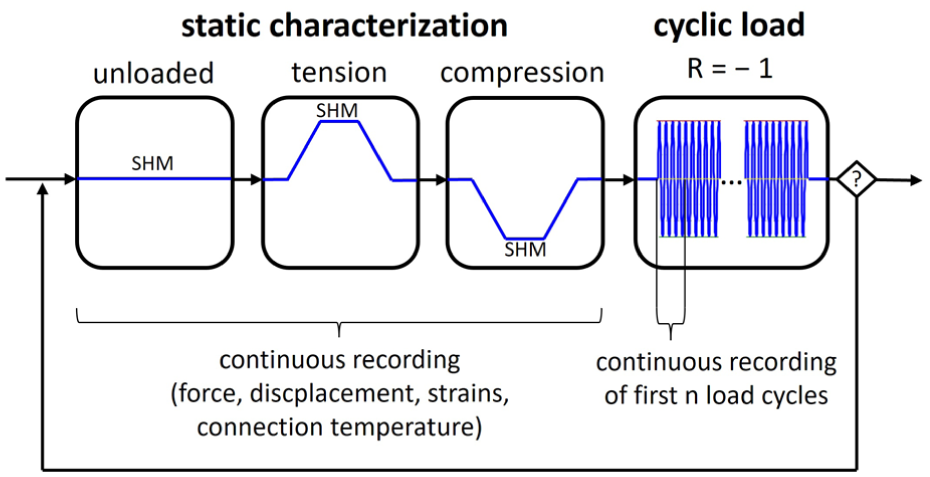
Test sequence of static characterization steps and fatigue cycle blocks.
The load cycle numbers defined in DNVGL-ST-0376
31
(
Experimental results
The joining technology for segmented rotor blades in wind turbines must withstand extreme static and cyclic loads and compensate for large manufacturing tolerances. For this purpose, static and cyclic load tests were performed on the coupons and components to evaluate their performance under realistic operating conditions. The coupons are designed to replicate the connection point in segmented CFRP rotor blades. Afterwards, the component tests were used to validate the developed method.
The extensive experimental investigations using a hybrid structural monitoring system for highly stressed bolted connections to increase the overall availability of wind turbines were performed at the DLR facilities in Braunschweig.
In the static load tests, coupons and components were gradually loaded to maximum to investigate the behavior of the connections under static conditions. In the cyclic tests, the coupons and components were subjected to a large number of load cycles idealizing wind turbine operating conditions. The program included both low and high load cycles to evaluate the durability of the connections. The structural state is considered critical when the diameter expansion reaches 0.4 mm, indicating that the joint bolt connection may no longer function securely. Table 1 provides an overview of the experiments conducted within this study.
Overview of the experiments conducted.
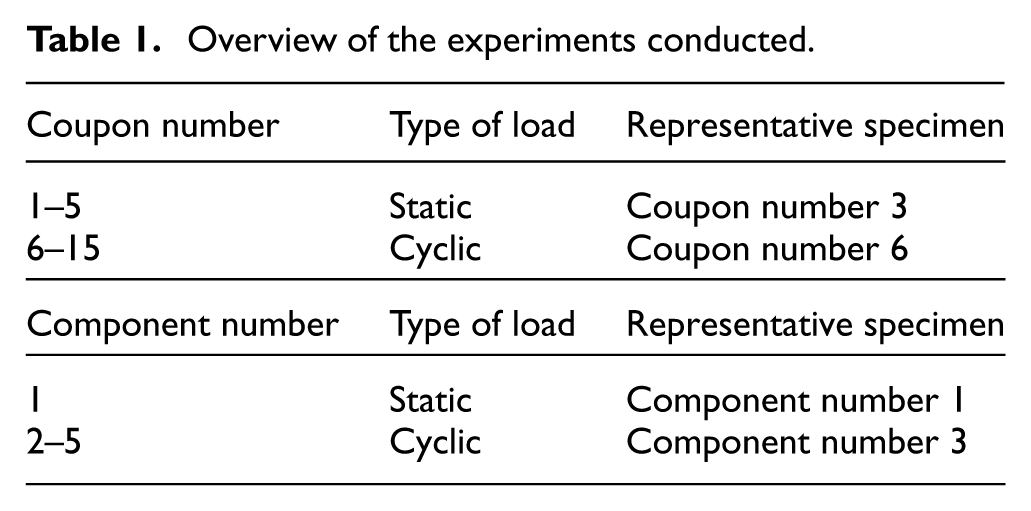
As illustrated, a total of 20 specimens at the coupon and component levels have been analyzed. For each of the four categories, only one representative specimen is illustrated in the results, as indicated in the last column. Specimens listed as representative in Table 1 were selected based on their adherence to typical mechanical failure modes (bearing failure for coupons and net tension failure for components) observed across the entire test series. Due to the consistent degradation behavior across all samples, alternative specimens would yield comparable damage detection results, as long as standard—rather than atypical—loading scenarios are considered.
Coupon tests
Static loading: Static loading can cause various types of damage in bolted joints. Delamination can occur due to shear or peel stresses between layers, whereas microcracks are typically caused by tensile or compressive stresses within the matrix. Debonding can occur at the interfaces between the composite layers or between the fiber and the matrix. In addition, high static loads can cause fiber rupture, especially in areas of stress concentration. In order to generate progressive damage, five coupons were subjected to a displacement-controlled (1 mm/min) monotonically increasing load until failure. Coupons 1 and 2 were loaded with a linearly increasing load profile until failure. For coupons 3, 4, and 5, the load profile was defined as a sequence of ramps with holding stages, during which the load increased from 0 to 120 kN. The load was increased in increments of 20 kN, and each ramp was held at its maximum for 140, 120, and 80 s, respectively, for the three identical coupons. Afterwards, the load was increased until the maximum failure load was reached.
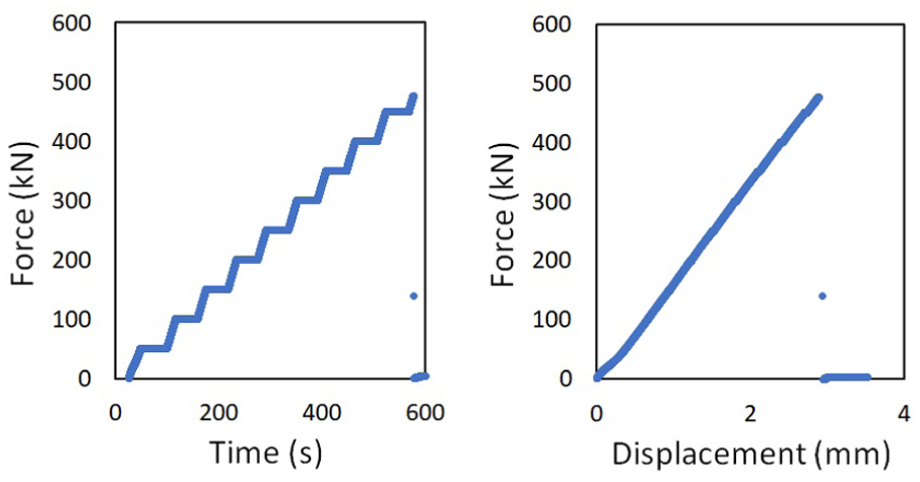
Figure 8 shows the stepwise increase in force over time of coupon 3. After reaching 120 kN,the load was further increased until the first load drop occurred due to hole elongation. Following this initial failure, a typical series of load drops, indicating progressive damage and hole elongation, was observed. After several load drops, the specimen was unloaded. Based on the evaluation of the hole expansion according to ASTMD5961, 35 which can only be determined imprecisely without direct whole widening measurement in the static tests, the first distinct load drop was used as the failure load for calculating the bearing strength instead. Since the specimens show a progressive increase in hole expansion after the first load drop, but no further significant increase in load, this procedure is justifiable.
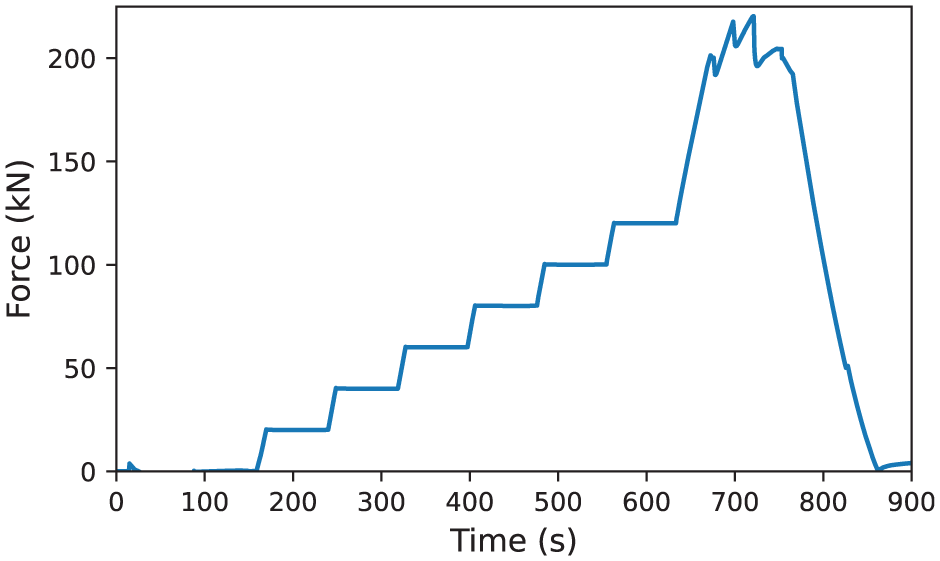
Coupon level: Static load-bearing behavior of coupon 3, showing a stepwise increase in loading force and damage-related load drops indicating hole elongation.
When examining the force–displacement response of the CFRP coupon specimen, it becomes evident that the relationship remains linearly correlated up to the onset of internal damage mechanisms (cf. Figure 9). Beyond this point, deviations from linearity indicate the onset of microcracking, matrix degradation, and delamination within the composite. This behavior is further confirmed by the presence of irreversible deformation upon removal of the external load, suggesting that permanent internal damage has occurred. CFRP does not have a defined yield point, as it exhibits brittle rather than ductile failure. The curves for the other experiments exhibit a similar behavior until the maximum load is reached. The post-failure behavior differs somewhat, although it must be clearly stated here that there is limited residual capacity in the connection. Once the bearing failure load is reached, the load cannot be further increased in a stable manner.
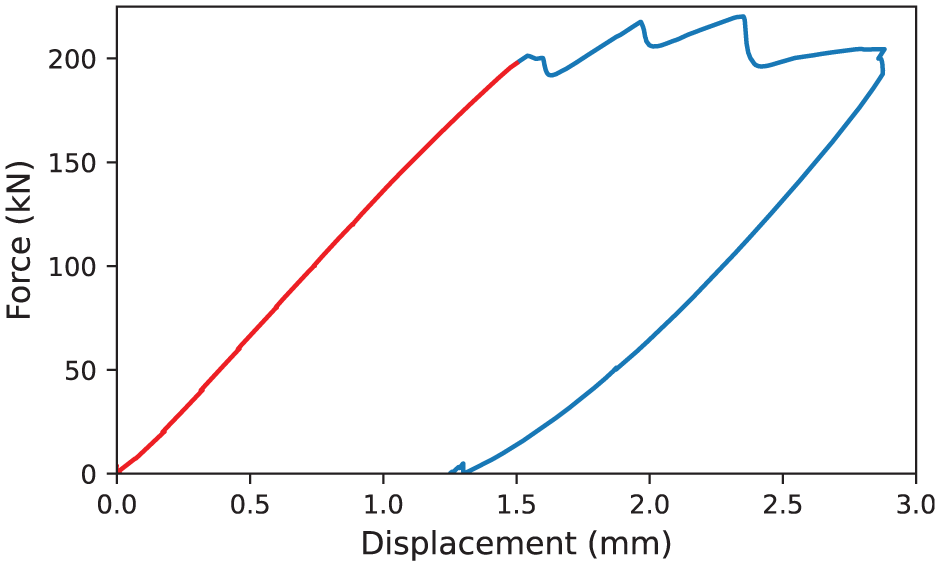
Coupon level: Force–displacement behavior of coupon 3 to illustrate the nonlinear material behavior of CFRP. The red line marks the range where the material exhibits nearly linear behavior.
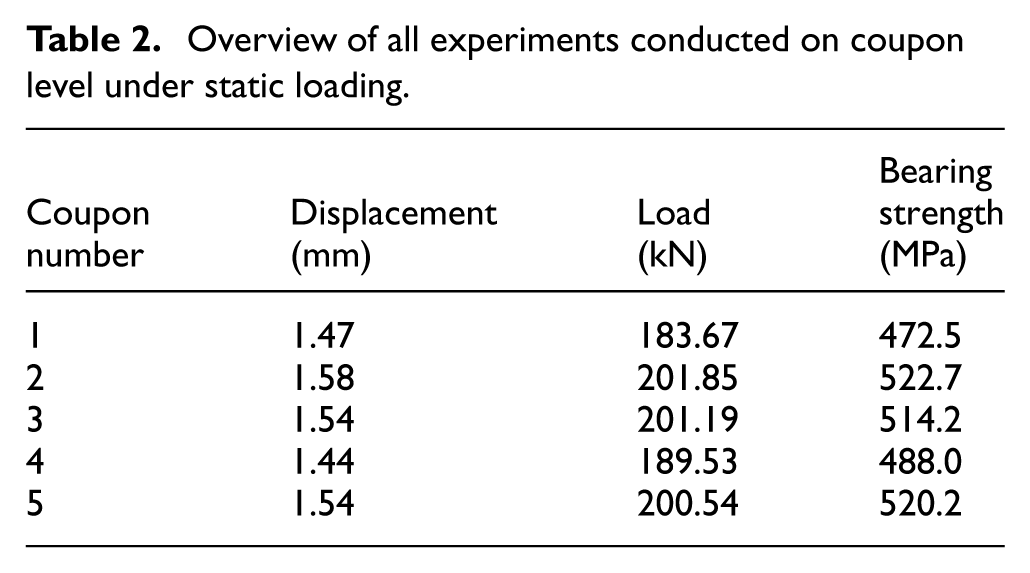
Because CFRP material is complex, a single test is not sufficient to fully describe its material behavior. Therefore, five tests were conducted. An overview of all test results is given in Table 2, which summarizes the maximum forces at failure. The bearing stress is calculated as the force of the machine divided by the hole diameter and thickness. This large number of tests provides a comprehensive picture of material behavior at the macroscopic level, which is the process of failure on the microscopic level. So, based on these results, physical material models can be derived and used to describe the stress-strain relationship. There is a clear picture of the static load, in which a load of 200 kN is possible until nonlinear behavior is achieved (cf. Figure 8). The applied force results in a hole pressure of approximately 500 MPa. No further increase in load-carrying capacity is possible; on the contrary, the material begins to fail, and its stiffness decreases significantly. The standard deviation of the bearing strength using Bessel’s correction is 22.2 MPa (4.4%), and considering the sample size and the complexity of the test—is to be regarded as very low, which indicates good specimen quality with respect to laminate quality as well as compliance with geometric tolerances of the specimen dimensions and the bolted joint. No irregularities attributable to the type of load increase (continuous or interrupted) were observed either.
Overview of all experiments conducted on coupon level under static loading.
The importance of monitoring such degradation behavior is paramount, as there are no reserves. For instance, steel exhibits a distinct yield point followed by a plastic region. After the elastic limit, the material can still deform plastically while maintaining, or even slightly increasing, its load capacity (strain hardening). Failure occurs gradually, not abruptly, allowing for ductile behavior and warning before fracture.
Figure 10 demonstrates the final damage state in detail, showing a pronounced hole elongation and compression-dominated damage state. Local bulging of the laminate indicates that the steel washers were unable to withstand the through-thickness stresses and subsequently deformed plastically.
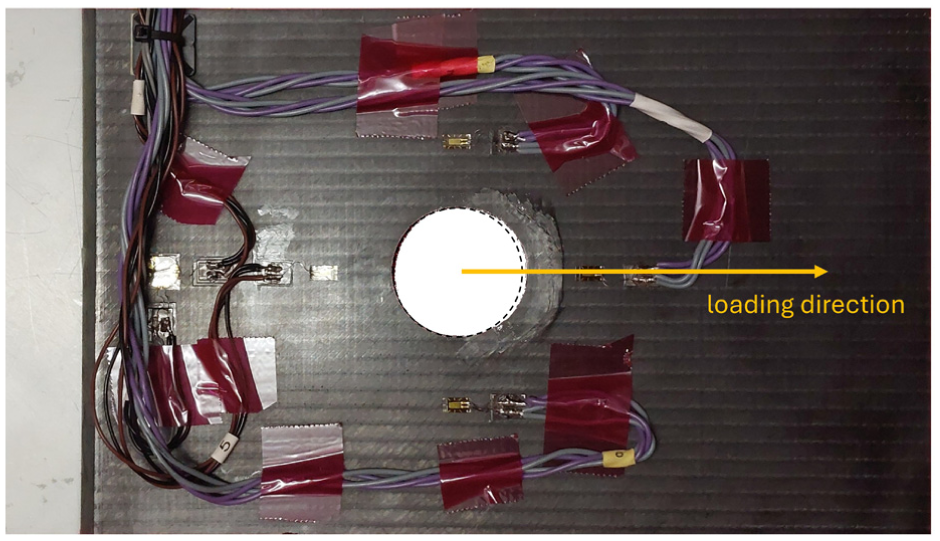
Exemplary photo of the final damage state of a coupon specimen tested under static bearing tension showing local cracking, bulging of the laminate, and hole elongation in the loading direction.
Cyclic loading: After the coupon specimens were statically tested to failure, a total of 10 specimens were dynamically loaded in fatigue tests following ASTM D6873. 34 The tests were single-stage fatigue tests with a stress ratio of R = −1. A stress ratio of R = −1 (alternating load) is considered highly relevant because it reflects the alternating bending loads of the rotor blades caused by their dead weight during rotation. Regarding its mechanical relevance, this type of loading is particularly critical for CFRP structures, as the alternation between tension and compression is significantly more damaging than a purely static tensile load. The tests were force-controlled using the horizon method, 33 whereby the load levels were determined on the basis of the ultimate tensile bearing stress (UTS) (%UTS: 70, 60, 50, and 40%). Three test specimens were tested at each of the 70 and 40% load levels, and two each at the intermediate levels (60 and 50%). The test sequence followed the scheme shown in Figure 7, whereby the force targets of the ramps and the height of the holding levels corresponded to the maximum dynamic stress. The test frequencies were varied in order to reduce the test duration on the one hand and to limit heating 32 on the other.
A plot of the cyclic stress (dynamic maximum bearing stress) over fatigue life is shown in Figure 11.
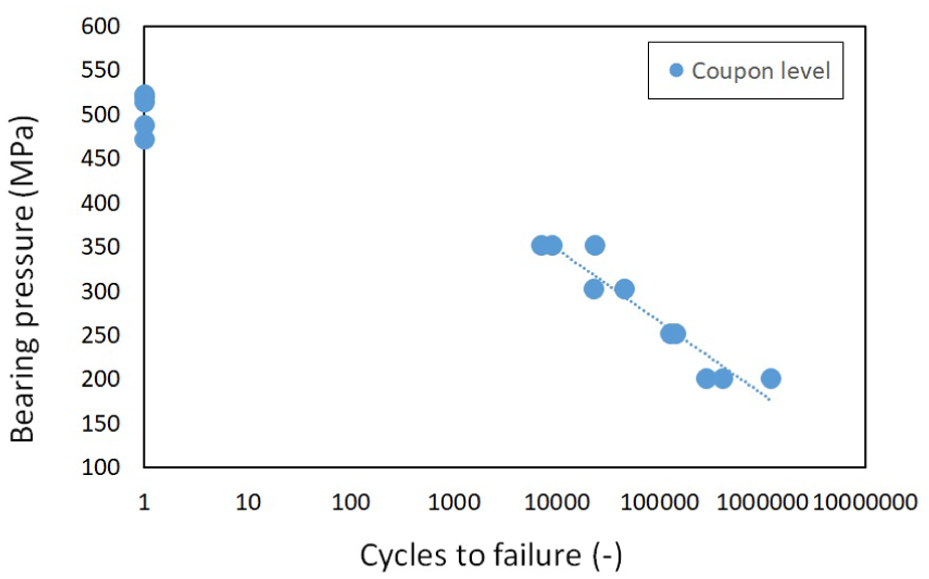
Coupon SN curve (Stress-Number of cycles).
The fatigue lives reached for the applied load levels are between
In addition to the SN data, the hole expansion was calculated on the basis of the hysteresis loops, as described in ASTM D6873. 34 As shown in Figure 12 in the cyclic test, the damage accumulates gradually over time rather than occurring suddenly. Coupon 6, as a substitute for the remaining experiments, shows that the nonlinear expansion starts at a low level and increases due to material degradation. Whereas at the beginning no significant change is observed, the expansion becomes nonlinear and progressive after a while.
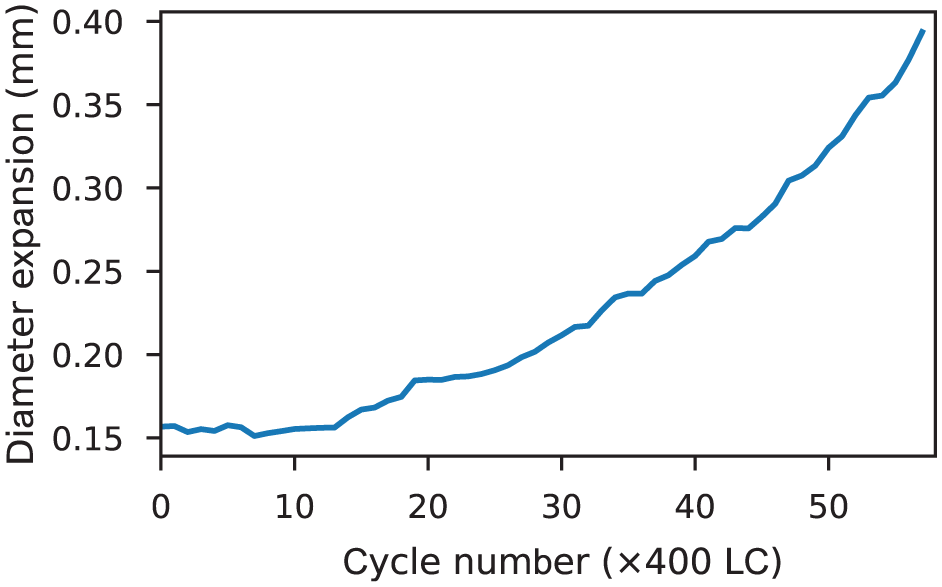
Coupon level: Diameter expansion of the bolted connection under cyclic loading, as observed in coupon 6.
Figure 13 illustrates the damage on the specimens when subjected to cyclic tension-compression loading. The original diameter is marked. It can be seen the hole has elongated in the directions of the alternating loading, in the compression and the tension direction. Damage is dominated by matrix cracking and immense surface abrasion in the areas surrounding the bolt holes, which presumably resulted in a decrease in the bolt’s effective clamping force. As the material surrounding the bolt hole progressively deforms and expands under repeated load cycles, the bolt becomes relatively loose due to the loss of a tight fit within the enlarged hole. In practical applications, this hole expansion can reduce clamping force, which is essential to maintaining the connection’s structural integrity and overall performance. In the moment of final failure, local bulging of the laminate occurred in the direction of the last tension load. As observed under static loading, the bulging force reached a magnitude that caused the steel washers to deform plastically.
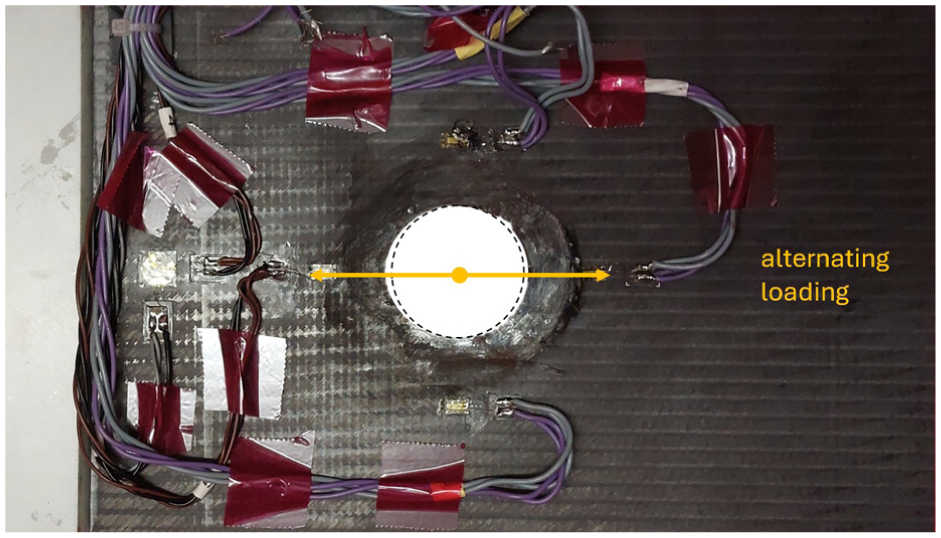
Exemplary photo of the final damage state of a coupon specimen tested under alternating bearing tension showing cracking, immense surface abrasion, bidirectional hole elongation, and bulging of the laminate in the direction of final failure.
Component tests
Component specimens as depicted in Figure 5were designed, manufactured, instrumented, and tested for validation purposes. Like the coupon specimens, the component specimens were tested under static and fatigue loads. Again, comprehensive test data in terms of single measurements at discrete holding steps, continuous measurements, and min/max envelopes were captured, including the testing machine outputs, strain measurements, and ultrasound-based SHM. The goal was to validate the performance of the sensor technology and the measurement systems under representative conditions at a higher level of structural complexity and to evaluate their practical suitability.
Static test results: Due to the low total number of component specimens, only one static test could be carried out. A gradual increase in the load (in 50 kN increments) with intermediate holding stages and a monotonic load increase until the specimen failed was selected for the test sequence. During the holding stages, measurements were carried out with the SHM system. The component specimen failed at a load of approximately 475 kN, which corresponds to an average bearing strength of approximately 431 MPa. Figure 14 shows the diagrams determined in the test. However, the damage pattern of the component specimen did not show a valid progressive bearing failure with the typical sequential load increase and drop behavior as in case of the coupon specimens. Rather, the specimen failed extremely abruptly by catastrophic rupture of the net section with any load-carrying capability remaining. Figure 15 shows the macroscopic fracture of the net section.
Results of the static component specimen test conducted as a sequence of monotonic 50 kN load ramps.
Damage image of the component specimen after static tensile testing showing net section failure.
With 431 MPa, the average bearing strength calculated from the static bearing test is significantly lower than the bearing strength of the coupon specimens (503 MPa). This is probably due to the different failure mode (bearing vs net tension) and a premature failure compared to the actual bearing strengths. The failure mode of the component samples, therefore, does not show a valid bearing failure; however, this does not affect the testing and evaluation of the damage detection method.
Cyclic test results: The dynamic tests of the component specimens were carried out as described in Figure 7. The load levels corresponded to 70 and 50% of the static component strengths. Two specimens were tested per load level. The component specimens failed with different damage mechanisms. While one specimen failed due to regular hole opening and bearing failure, the other three specimens failed as in the static test with a cross-sectional crack transverse to the direction of loading.
Similar to the experiments at the coupon level, the diameter expansion can be quantified and tracked over the number of cycles. As before, the diameter expansion gradually increases toward the end of the experiments (cf. Figure 16). The cyclic load profile led to progressive damage accumulation. Initially, hole wall damage occurred due to repeated compressive stresses between the bolts and the material, leading to matrix cracking and, over time, a loss of the connection preload. In addition, the cyclic loading caused fiber damage around the screw holes. As cyclic loading progressed, stress concentrations in the reduced cross-sectional area increased, accelerating damage propagation. Furthermore, cyclic loading caused abrasive wear of the components. This wear manifests itself as surface erosion.
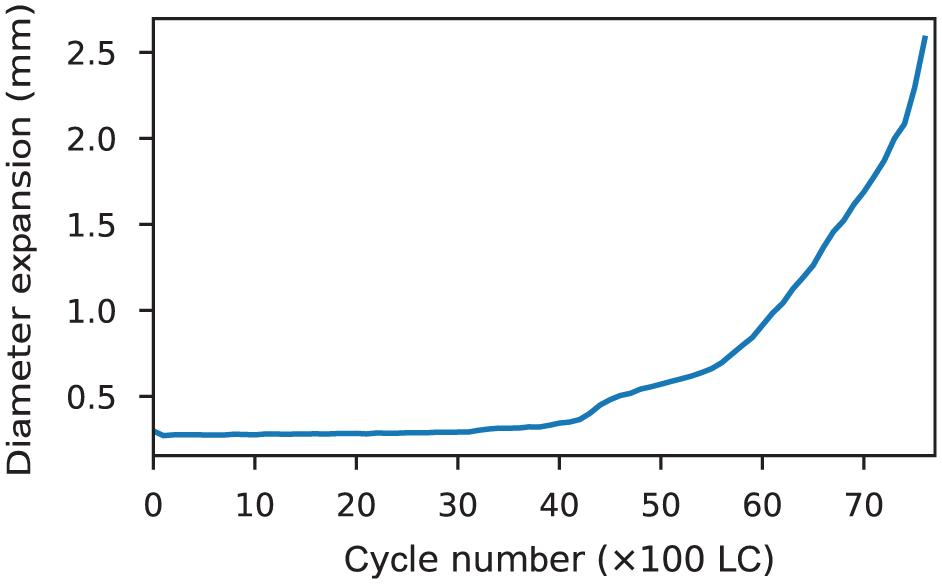
Element level: Diameter expansion over the number of load cycles during fatigue testing.
Discussion of the experimental results
As part of the study, bolted CFRP connections were extensively tested at both coupon and component levels under static and cyclic loads in order to evaluate their load-bearing and damage behavior under representative loading conditions and to validate a hybrid SHM system. The coupon tests showed a clearly pronounced, progressive bearing damage behavior, while the more complex component specimens mostly failed showing abrupt macroscopic net section rupture. The fatigue tests revealed a steady, reproducible accumulation of damage and characteristic hole extension. A direct comparison of the fatigue results of the different specimen geometries (coupon and component) in relation to the applied stresses is shown in Figure 17.
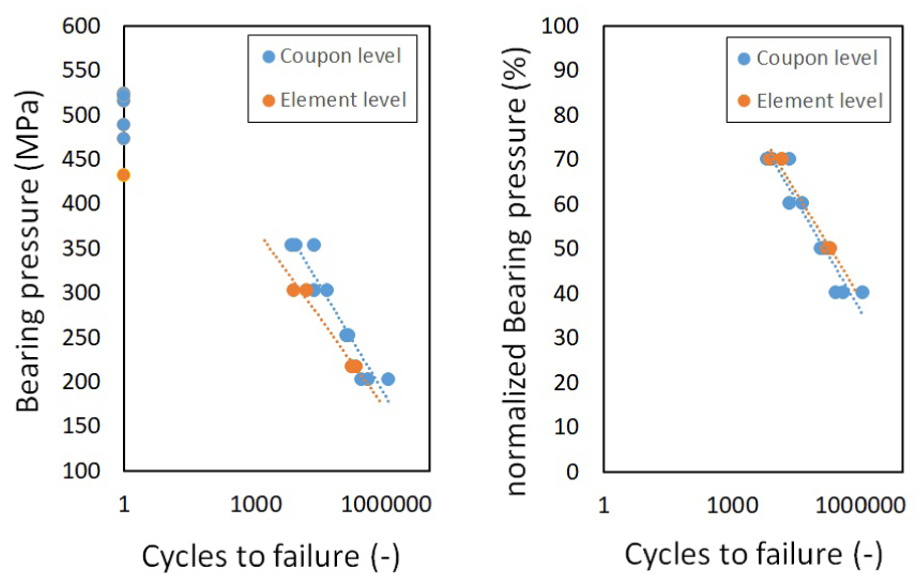
Comparison of coupon and element level SN data, absolute bearing pressure, and normalized with bearing strength from the static tests.
It can be seen from the curves that the fatigue life of the component specimens—depending on the cyclic stress—is shorter than that of the coupon specimens. One possible reason for this could be different failure mechanisms. While all coupon specimens show failure due to valid bearing damage, most component specimens show failure in the net cross-section. Uneven loading of the fastening bolts, due to the tight manufacturing tolerances and the fact that the component specimens could not be clamped over the entire width of the specimen, could provide a further explanation for the early failure of the component specimens. Indications of this were found in the SG evaluations and numerical analyses, which are not presented further here. While the coupon specimen transfers the load via a single bolt, the component specimen has three bolts. This leads to interaction between the closely spaced connecting elements in the component specimen. An inhomogeneous bolt load was detected in the component sample. Analyses revealed about 10% higher strains around the middle bolt compared to the edge near regions. Furthermore, the complex mounting and specimen alignment in the fixture could have had an impact. Furthermore, it cannot be ruled out that the heat development—as a result of the friction between the connecting bolts and the CFRP specimen—had an influence on the earlier failure of the component specimens. Although the connecting bolts were connected to a water cooling system during the cyclic tests, slight heating could be observed in the area of the bolt connection. In summary, it can be said that load transfer is idealized and direct in the case of the coupon, whereas in the case of the component, it is significantly more inhomogeneous due to geometric effects, clamping restrictions, and statistical manufacturing tolerances. If the cyclic loads are normalized to the respective static strengths of the coupon or component specimens, then resulting SN curves are very similar. This means that both specimen types exhibit the same relative fatigue behavior. The differences are therefore mainly in the level of static strength, while the underlying fatigue mechanisms and the dependence of the service life on the relative load are identical, except for the different final failure event. Overall, the data points of each curve align well along the fatigue trend line, indicating good consistency among the experiments and a low level of experimental error. Overall, the results form a reliable basis for the evaluation of the joining technology and the performance validation of the SHM approach used.
Mathematical analysis and results
The previous section detailed the material characterization and experimental results, whereas the present section examines the SHM data and the implementation of the proposed decision-level data fusion framework. Consistent with the methodology employed throughout this study, two-thirds of the baseline dataset is allocated for training. Subsequent increases in the Q-index (active sensing) and in
Throughout the experiments, data acquired from the active monitoring system were preprocessed to remove high-frequency noise. This preprocessing step was essential due to the high dimensionality of the datasets and the elevated sampling rates required for capturing the signals of interest. All datasets employed an excitation frequency of 40 kHz, which, according to the Nyquist criterion, mandates a sampling rate exceeding 80 kHz. To mitigate computational complexity, the active-sensing signals were low-pass filtered, resampled, and standardized prior to analysis. In contrast, data from the passive monitoring system were not resampled, as their inherent sampling frequency was substantially lower and already suitable for downstream processing. Noteworthy, active water cooling maintained specimen temperatures below 35°C. Furthermore, the training process implicitly incorporates temperature variations by utilizing multi-temperature baseline data, providing robust compensation for thermal impacts on the PZT signals.
Static tests—coupon level
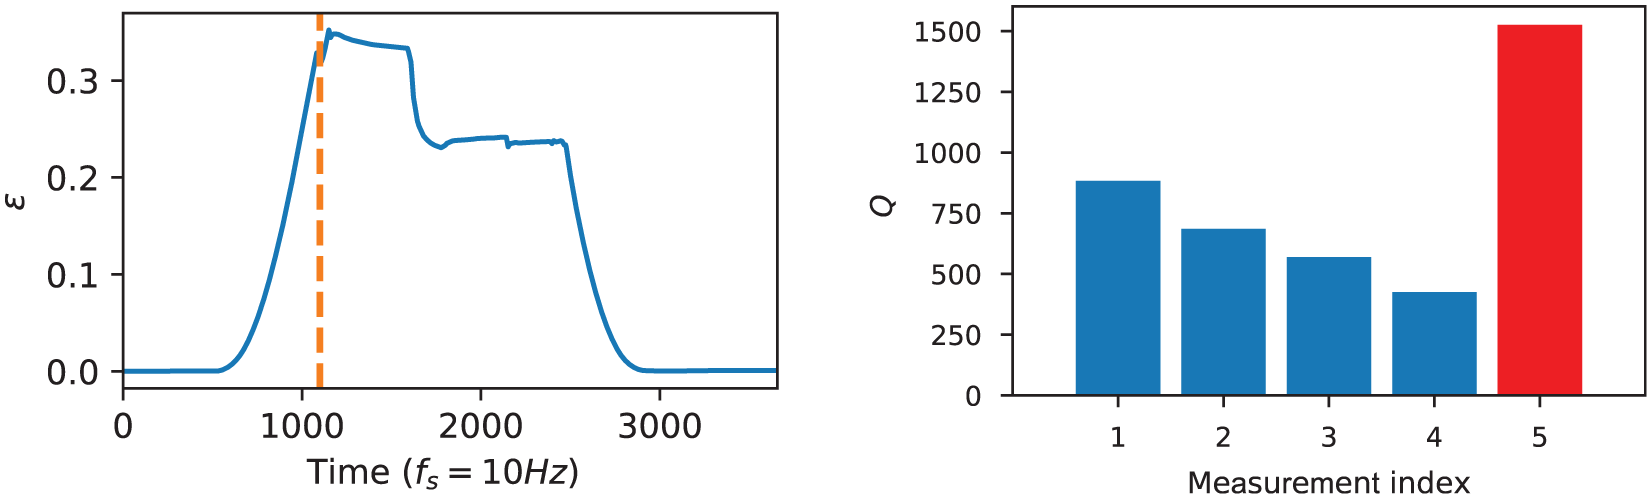
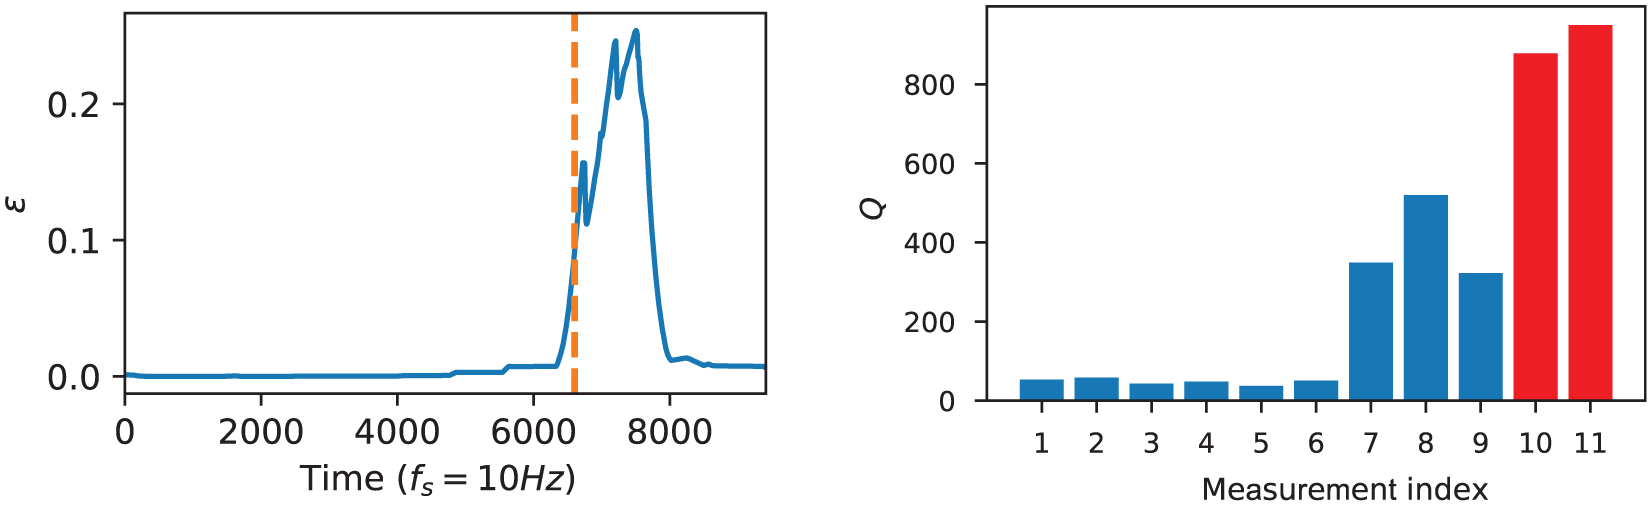
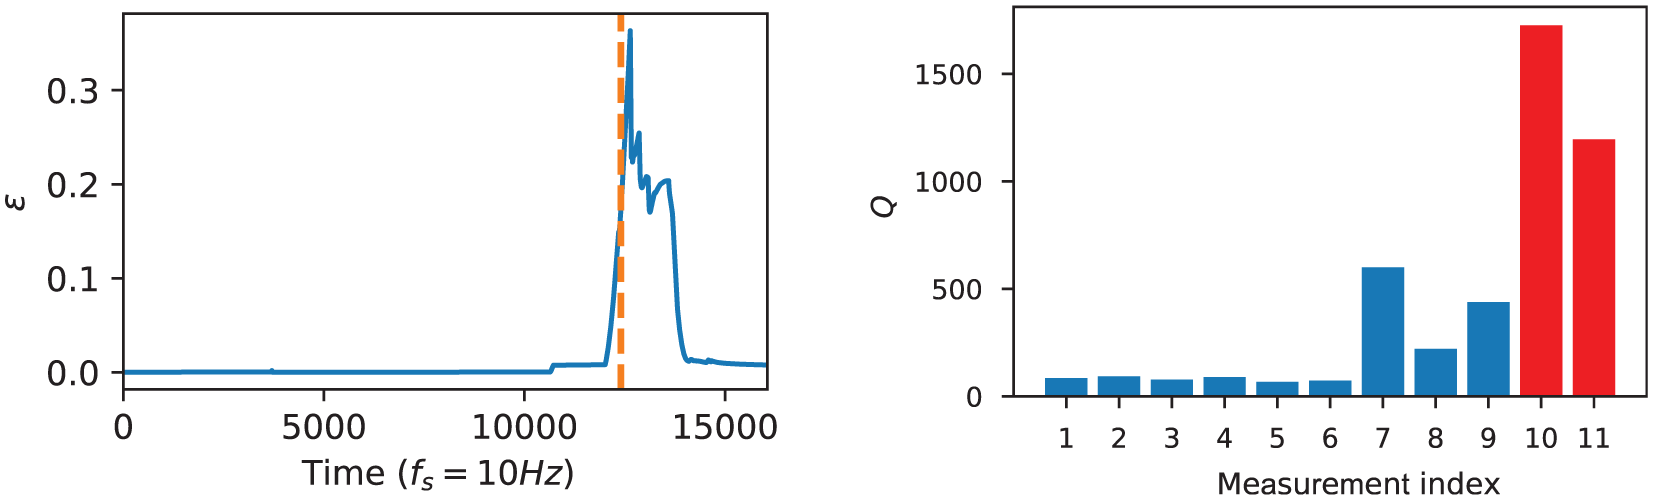
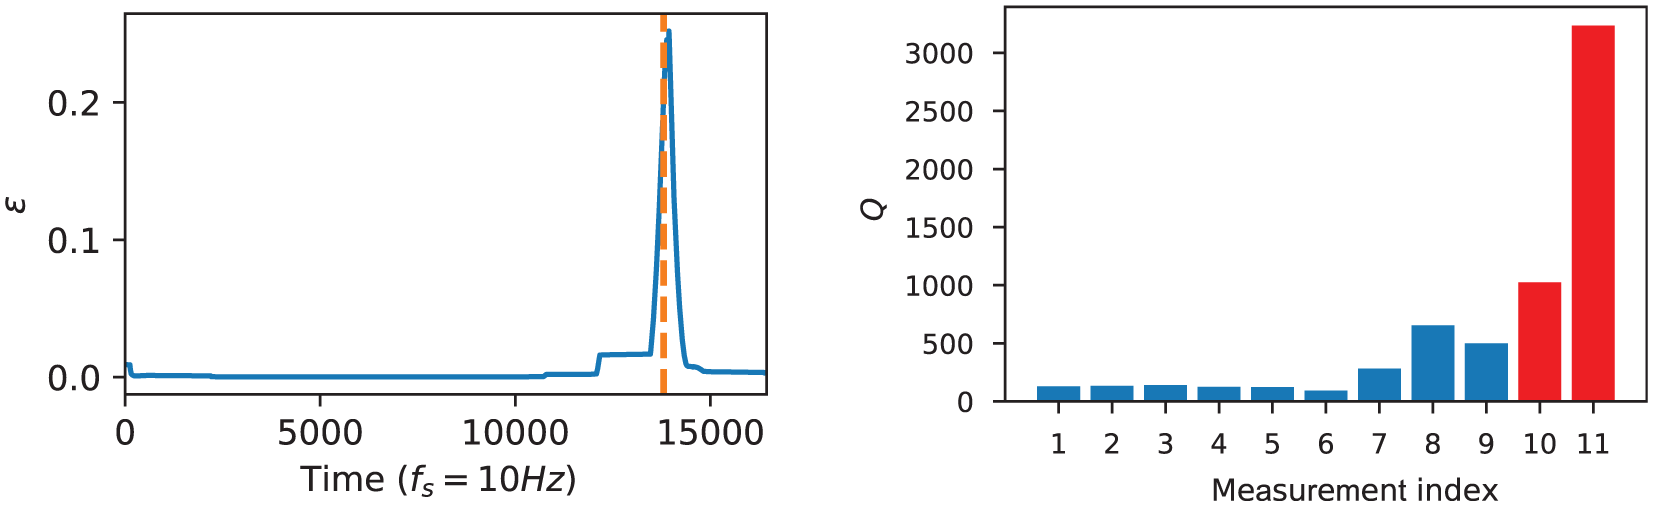
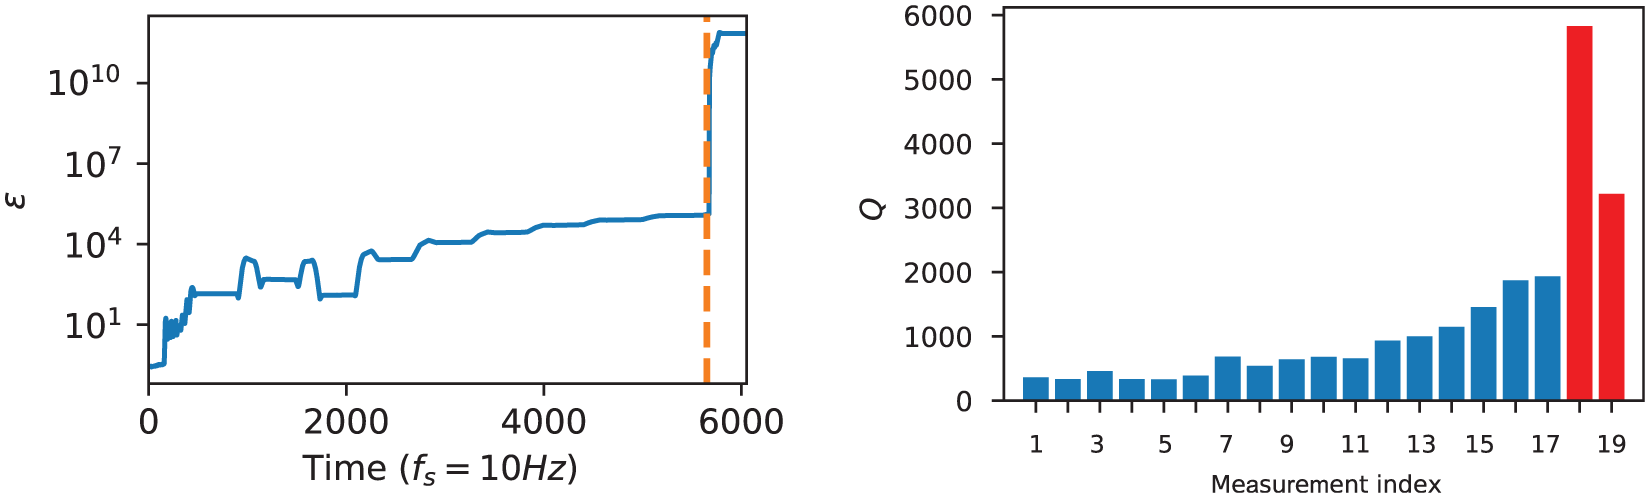
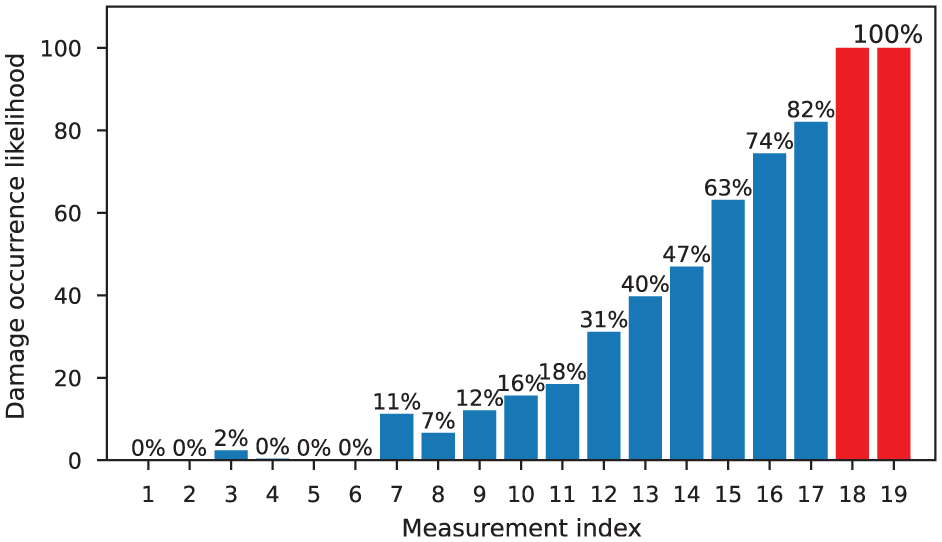
Damage is indicated by the exceedance of the elasticity threshold, at which irreversible deformation occurs. Figures 18 to 22 illustrate the results for the active and passive systems. Damage occurrences are marked in the passive monitoring system by vertical, orange-dashed lines. The measurement data for the undamaged state is shown in blue, while that for the damaged state is highlighted in red in the active monitoring system. A first observation concerns differences in data availability and collection between the two monitoring systems. With the passive system, data is continuously available, as it operates without external activation and records measurements continuously. Continuous acquisition enables seamless monitoring and is particularly well-suited for observing changes or damage over extended periods. In contrast, data collection in the active system is linked to the targeted activation of the excitation. The dependence means that measurement data are only available when the system is actively operating. The measurement index within the figures is used to represent consecutive data acquisition, as continuous recording over the entire duration was not performed in the active system. This conditional data acquisition requires conscious control of the measurement cycles, which means data availability is both time-limited and selective. Such methodical recording offers the advantage of targeted analysis but requires careful planning of measurement timing to capture relevant events or changes in status.
Results of both monitoring systems for coupon 1.
Results of both monitoring systems for coupon 2.
Results of both monitoring systems for coupon 3.
Results of both monitoring systems for coupon 4.
Results of both monitoring systems for coupon 5.
It is noteworthy that, despite the absence of a formally defined threshold separating healthy from damaged states, the overall trends of the response curves remain clearly interpretable. For instance, false negatives can be defined as values that remain within the baseline data range, even though damage has occurred. The results obtained from the passive monitoring system exhibit a high degree of sensitivity to the underlying external forces, providing valuable insight into the system’s dynamic behavior and its susceptibility to evolving damage. The damage index
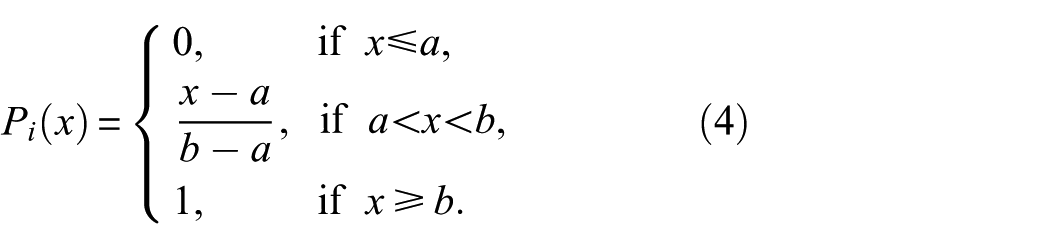
The analysis of the monitoring performance of passive and active systems highlights specific weaknesses and strengths in both approaches. The passive system shows a strong dependence on the applied load, leading to fluctuations in the damage index and complicating risk assessment. On the other hand, the active system offers independent damage detection without dependence on the load, but continuous monitoring is not possible due to conditional measurement data acquisition. These limitations prevent a consistent assessment of the damage risk. To compensate for these weaknesses, a fusion of both systems was implemented at the decision-making level. This fusion aims to combine the strengths of both approaches and eliminate their respective weaknesses. In particular, the fusion enables continuous data acquisition from the passive system, complemented by the robust damage detection capabilities of the active system. The decision to implement fusion at the decision level is based on the characteristics of damage progression under static loading. Since the damage is sudden and irreversible, a fusion at the feature level would be less valuable. Instead, the fusion approach was implemented directly using the damage indices derived from the two monitoring systems, as detailed in the “Mathematical methods” section. To determine the threshold values
Decision-level data fusion results for coupon 3.
Decision-level data fusion results for coupon 4.
Decision-level data fusion results for coupon 5.
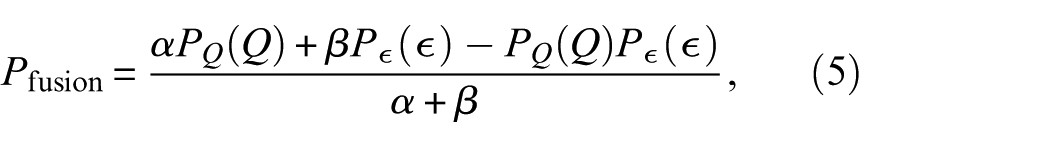
The resulting damage probability is categorized into three states: An intact state with a low damage probability (≈ 0%), a damaged state with a high damage probability (above 99%), and an uncertain state with intermediate values. Higher fusion values correspond to higher damage probabilities. By merging the predictions of both monitoring systems, the overall result is adjusted based on the confidence interval of the other system (the system with a high probability of damage). The overall damage probability only increases if at least one index predicts a damage probability other than zero as defined in Equation (5). The criteria improve the stability of the probability estimate, especially in scenarios where the strain-based monitoring system detects no load, thereby making the active monitoring system in this study more reliable. It is therefore possible to rely exclusively on this system and activate it permanently. Although the Q-index demonstrated effective damage detection, it did not show a clear correlation with the probability of damage, making it difficult to predict it before it occurs. It should be noted that, before the damage occurred, insufficient measurements were taken to better evaluate this point. The effectiveness of the combined monitoring systems was demonstrated by the precise and reliable prediction of the coupons’ condition. The ultrasound-based system proved insensitive to load changes and more reliable for damage detection, whereas the strain-based system showed a similar trend to the applied load. The advantages of both systems were combined in a fusion to correct inaccuracies in damage detection and enable reliable predictions of the probability of damage.
Cyclic tests—coupon level
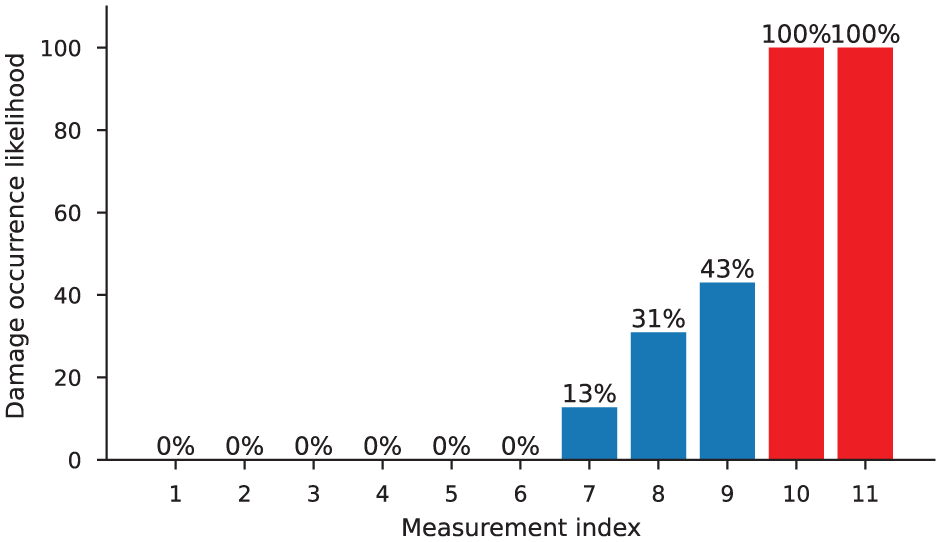
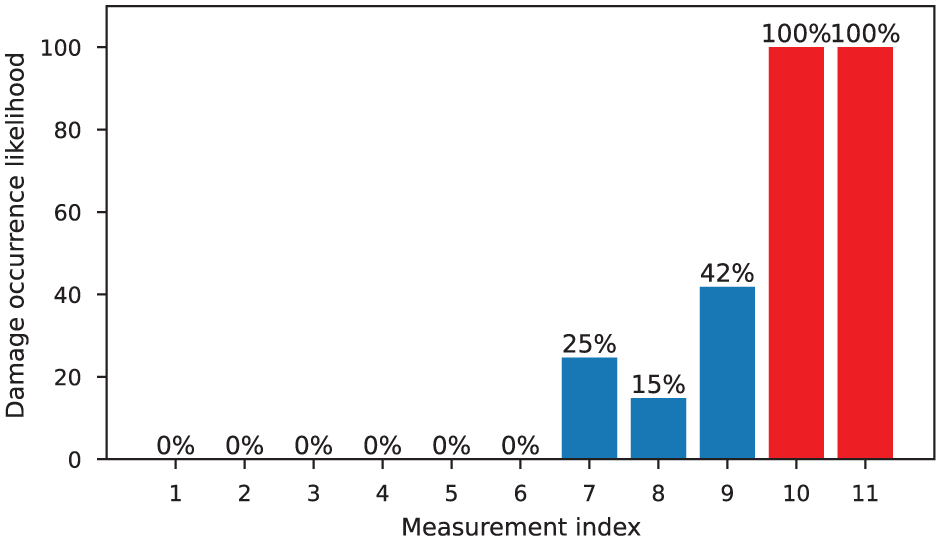
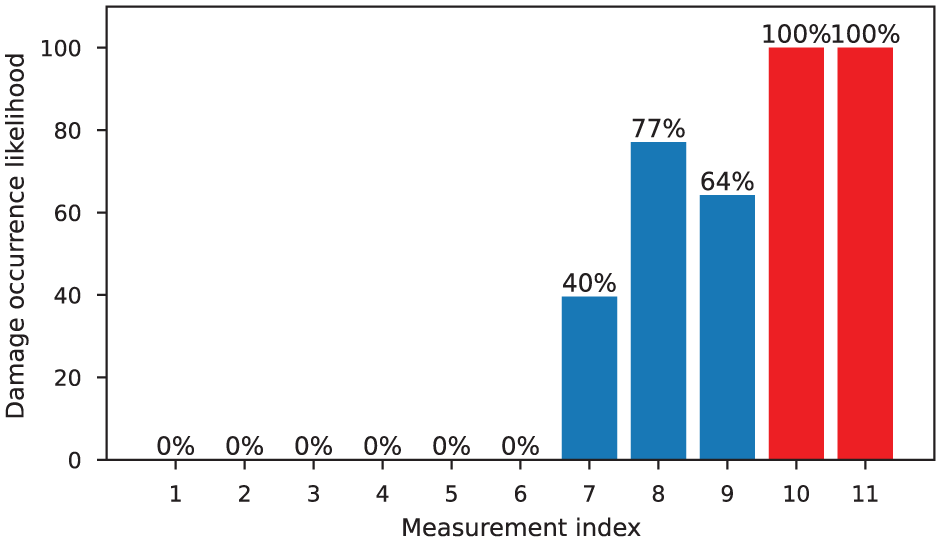
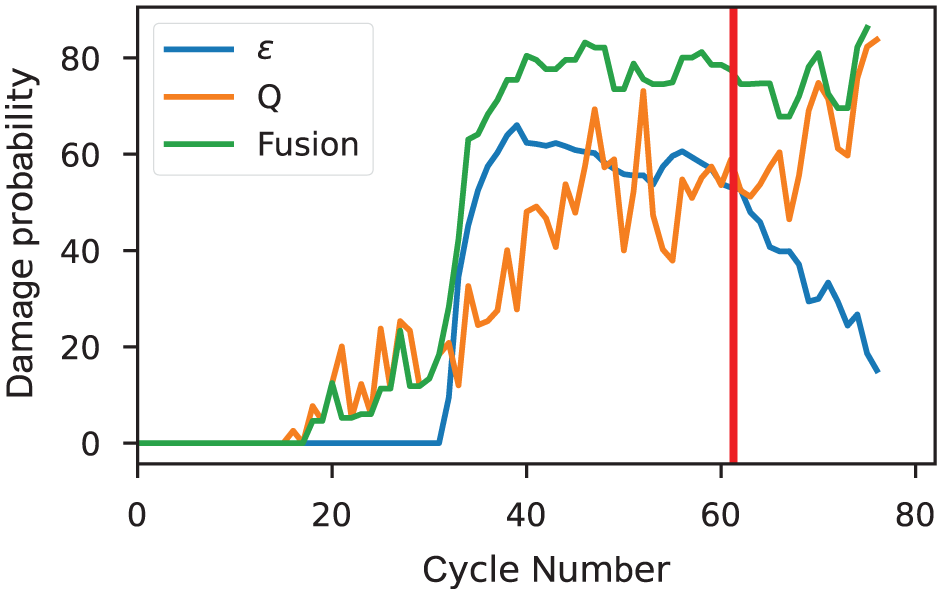
During the cyclic loading phase, coupons 6 through 9 exhibited partial malfunctions or issues related to the SGs. Because the primary objective of this work is to assess the impact of integrating passive and active monitoring systems rather than conducting isolated analyses, these coupons were excluded from further evaluation. For training the autoencoder and determining the principal components, only measurements recorded before the diameter expansion exceeded 0.25 mm were used; the diameter expansion was identified based on hysteresis behavior. Setting this threshold value was particularly challenging due to the nonlinear behavior of composite materials. With such materials, even small increases in strain can lead to unpredictable changes in material properties. The threshold value was therefore chosen to ensure a balance between collecting sufficient data for training and avoiding severely damaged conditions. Due to the different test configurations and load cycles of the individual coupons, the threshold value was exceeded at different times in each case. The evolution of the damage indices during the cyclic loading tests for coupons 10 through 15 is presented in Figure 26. Each subfigure illustrates the results obtained from the individual monitoring systems, while the decision-level fusion of both indices is shown in green. A red line denotes the threshold beyond which damage is considered to have occurred.
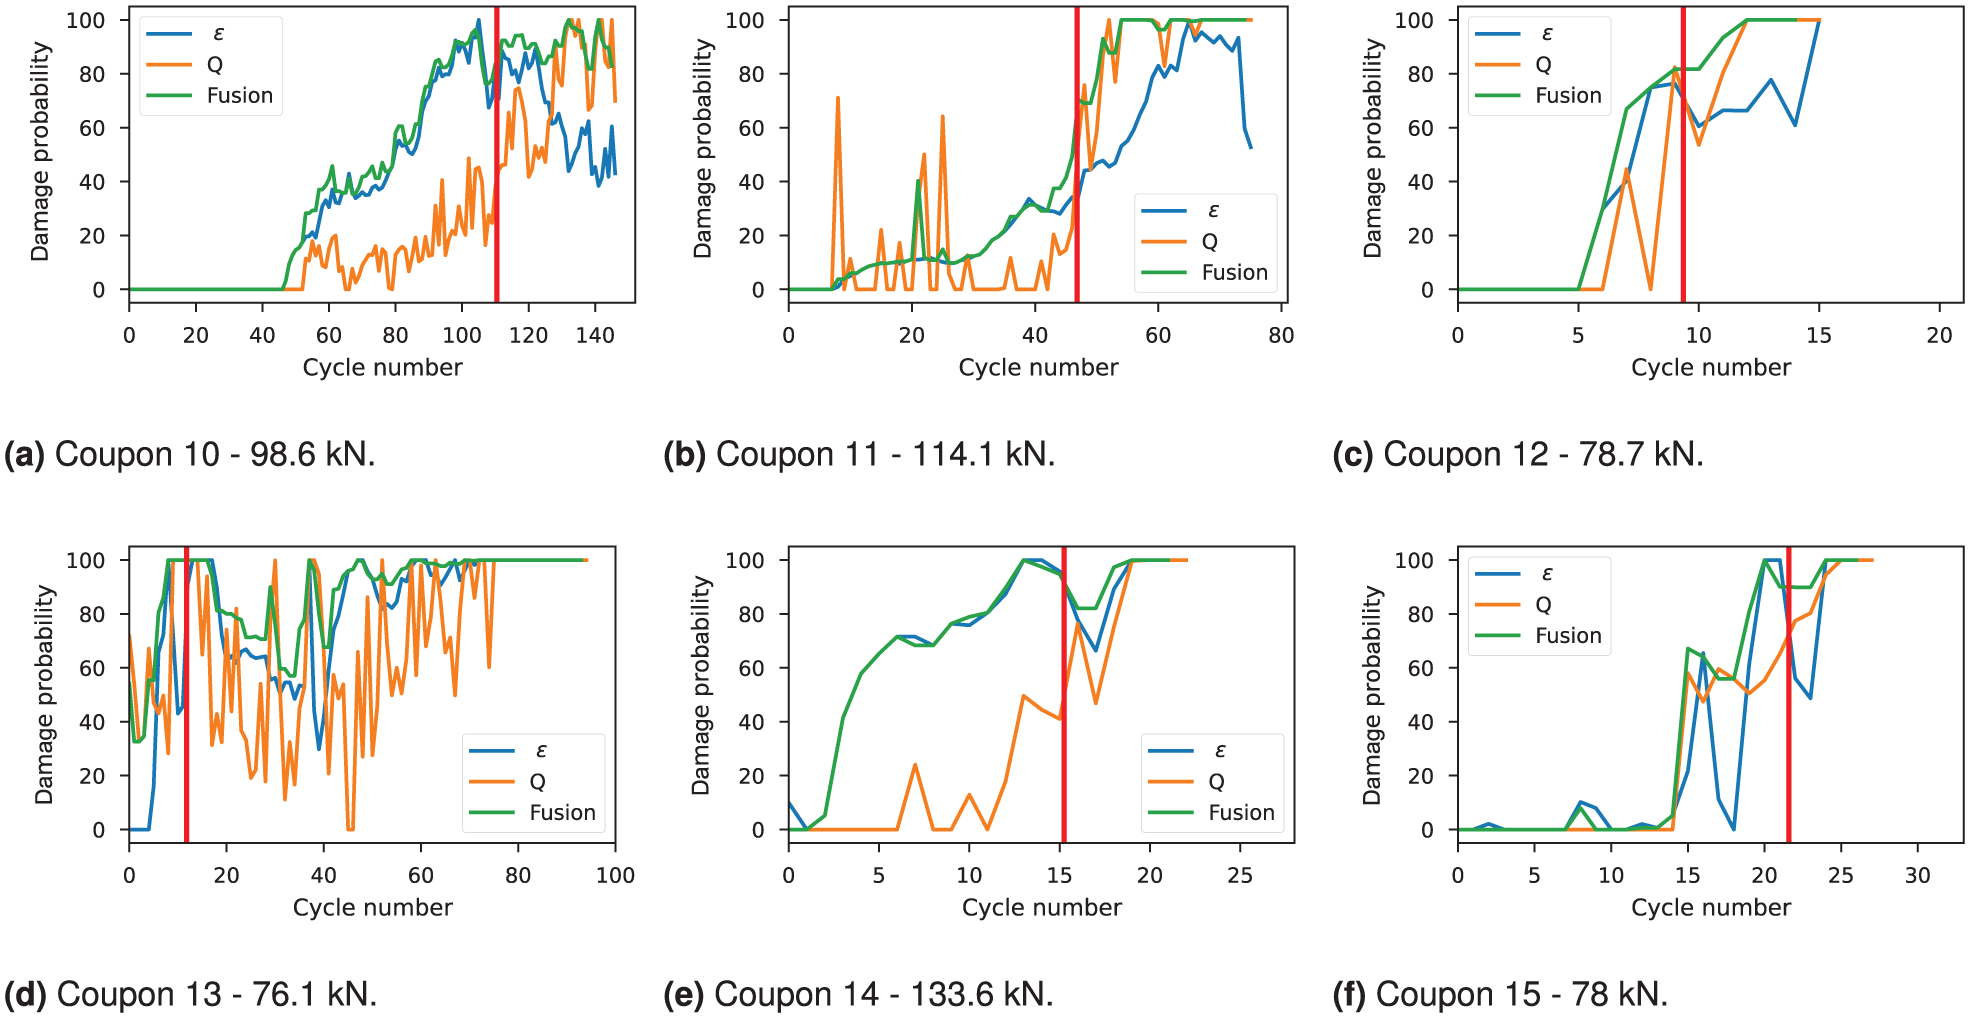
Damage analysis results for coupons 10–15 under cyclic loading. The corresponding alternating load is given for each coupon. The continuous thick red line indicates the critical state, where the diameter expansion reaches 0.4 mm: (a) coupon 10—98.6 kN; (b) coupon 11—114.1 kN; (c) coupon 12—78.7 kN; (d) coupon 13—76.1 kN; (e) coupon 14—133.6 kN; and (f) coupon 15—78 kN.
Both damage indices exhibit an overall upward trend during the cyclic tests, though some irregularities in the curves indicate uncertainty. For most coupons, the indices remain low at the beginning of the experiments, whereas coupons 13 and 14 deviate from this general behavior. Visual inspection of the results suggests a strong correlation between the progression of diameter expansion and both damage indices. Nevertheless, the observed fluctuations in the indices may reflect uncertainties arising from measurement noise, material-property variability, or nonlinear system effects.
The fusion proposed in Equation (5) gives more weight or priority to the monitoring system that indicates damage (cf. Figure 26). The weighting helps to eliminate false negatives that can arise, for example, due to the absence of load in the passive system. However, this approach increases the fusion’s susceptibility to false positives, especially when outliers arise from measurement errors or extreme changes in environmental conditions. To counteract this problem, the fused damage probability is further filtered by taking the minimum of each consecutive pair. This approach ensures that outliers in both systems are excluded, thereby improving the accuracy and reliability of the fused system. The visual results confirm this effect and show that the fusion effectively corrects the ambiguities and weaknesses of the two individual systems. In particular, Figure 26(c) illustrates the enhancements due to the fusion of both damage indices on the decision level. As a result, a much more robust damage indicator is present. By calculating the merged damage probability, outliers are mainly excluded, yielding a more stable curve with fewer fluctuations or declines. The function shows an almost continuous increase, reflecting the course of the diameter expansion. Both the passive system (e.g., coupon 11) and the active system (e.g., coupon 10) can provide less accurate estimates of damage progression in some cases. As shown in coupon 13, the fusion output can decrease even as damage increases, revealing an explicit limitation of the approach. However, the results show that the fusion consistently enables improved, more reliable damage prediction. In particular, the fused damage probability provides a reliable forecast in the range where the diameter expansion reaches its predefined critical range.
Static and cyclic tests—component level
At the element level, the stress distributions and the gradual decline differ from those at the coupon level when subjected to static loading. As defined above, damage occurs when the applied static stress exceeds the limit of linear elasticity, leading to irreversible deformation. The aim is to evaluate the structural integrity of components and to validate performance based on the individual sensor technology scores in realistic scenarios. As explained in the previous chapter, the realistic connection is based on three bolts. The results for both loading scenarios are illustrated using a representative component.
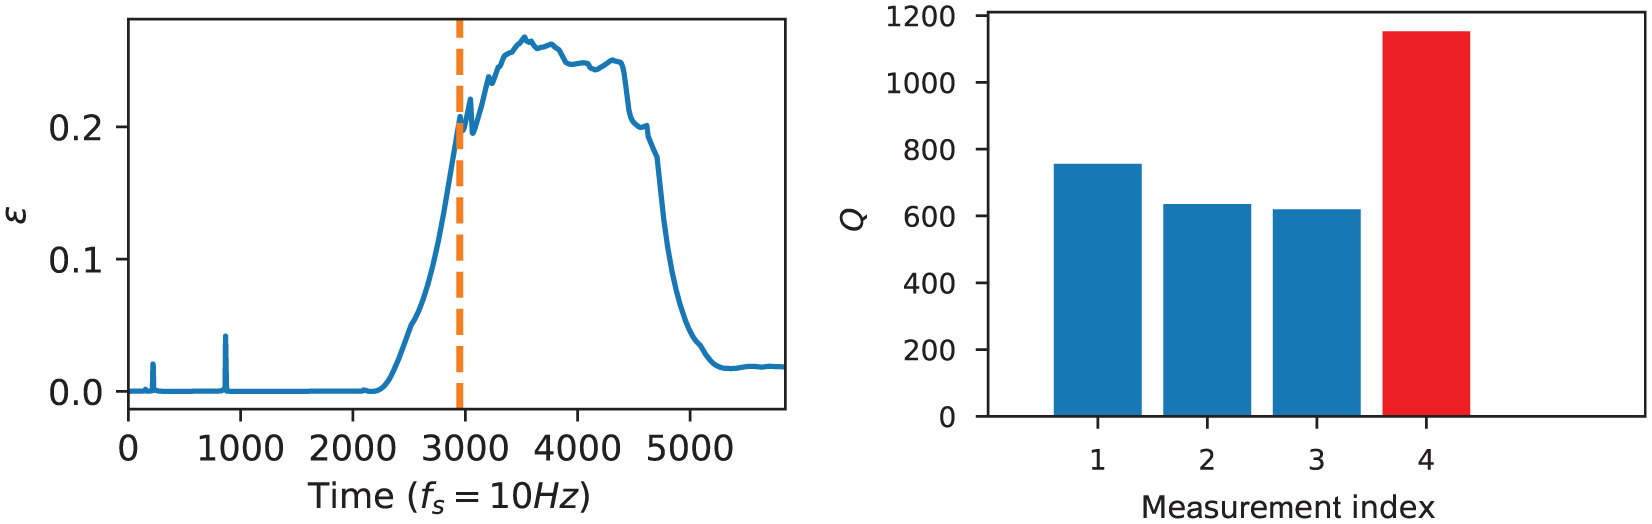
Figure 27 shows the results of the damage prediction under static loading, presented separately for the active and passive monitoring systems. Damage detection results for component 1 during static testing illustrate the passive monitoring system with an autoencoder (left) and the active monitoring system with PCA (right). The time of damage occurrence is indicated in the passive monitoring system by the vertical, orange-dashed line. In contrast to the coupons, both monitoring systems show plausible and reliable predictions in the component tests. The measurement data for the undamaged state is shown in blue, while the data from the active monitoring system for the damaged state is highlighted in red. Both damage indices show a continuous increase, reflecting the component’s increasing damage potential. When damage occurs, both indices show a significant jump, indicating reliable monitoring. Unlike in the coupon tests, the
Damage assessment of component 1 subjected to static loading.
The predictions of both monitoring systems for component 1 proved plausible, which supports the effectiveness of their fusion. Figure 28 shows the results of the fusion at the decision level. As already shown in the coupon tests, the resulting damage probability can be divided into three conditions: a healthy reference state with a low damage probability, a damaged state with a damage probability above 99%, and an uncertain area. Higher values of
Results of the data fusion analysis for component 1 subjected to static loading.
A key difference from the coupons is that the components have three bolts instead of just one. Since the testing machine only measures the overall elongation of the entire component, the individual-diameter expansion of the bolt holes cannot be determined. Figure 29 shows the calculated damage probability for cyclic loading, which was determined separately from each damage index, as well as the combined damage probability, which was calculated according to Equation (5) by merging the indices. The blue line corresponds to the obtained
Component 3: Damage analysis of cyclic loading on the element level. The continuous thick red line indicates the critical state, where the diameter expansion reaches 0.4 mm.
The visual results confirm that the fusion effectively corrects the ambiguities and weaknesses of the two individual systems. This includes the clear fluctuations caused by the active system’s damage index, which are reduced by the fusion, yielding a more reliable forecast than the inaccurate predictions observed in the individual systems. Similarly, the declines in the passive system are corrected by fusion. The fused damage probability shows a continuously smooth upward trend that accurately reflects the progression of damage.
Discussion and concluding remarks
Traditional features like amplitude or Time-of-Flight often lack the precision required for monitoring complex composite joints. Consequently, most works evaluate entire signal patterns via reconstruction-based models to provide a more robust, holistic assessment of structural integrity that effectively mitigates environmental noise. The physical meaning of the SHM indicators can be established by relating their evolution to independently observable mechanical and damage-related phenomena. Under static loading, the force–displacement response exhibits linear-elastic behavior in the intact state and transitions to nonlinear behavior after damage onset due to mechanisms such as matrix cracking, bearing damage, and hole elongation; this transition is consistently reflected by a pronounced increase in the damage indices
The weaknesses of the individual scores have been illustrated on the coupon level under static (cf. Figure 18) and cyclic loading (cf. Figure 26). The
To compensate for these weaknesses, a merger of both systems was successfully implemented at the decision-making level. The merger has combined the strengths of both approaches and eliminated their respective weaknesses. While damage trends can be observed from strain data alone, strain-based indicators are load-dependent and can become misleading. More precisely, to improve robustness, a decision-level data fusion approach is employed: when one sensing system is affected by operational variability or sensor issues, the other compensates, resulting in more reliable and consistent damage detection under realistic conditions. Impressively, the impact has been demonstrated for both the static (cf. Figures 23–25) and cyclic loading (cf. Figure 26). In particular, the fusion enables continuous data acquisition from the passive system, complemented by the robust damage detection capabilities of the active system. Notably, fluctuations could be influenced by factors such as measurement noise, variability in material properties, or nonlinear effects. Due to the importance of reproducibility, it is referred to the supporting dissertation. 27 This work provides the underlying statistical validation, including the mean values and scatter of the damage indicators across investigated specimens, ensuring that the representative results discussed in this paper are statistically grounded and reproducible.
Both monitoring systems produce plausible and reliable predictions in the component tests, unlike the previously observed coupons. The damage indices show a continuously increasing trend, reflecting the expected increase in the component’s damage potential. The
Overall, the data fusion strategy successfully distinguished between healthy and damaged states, while the data analysis uncovered key dependencies essential for robust SHM. Noteworthy, while mechanical effects like uneven load sharing and premature failure were observed, this study remains focused on developing an unsupervised SHM framework and decision-level data fusion. These complex structural mechanics merit further investigation through detailed FE analyses.
Conclusion and outlook
In this paper, we addressed the reliability and accuracy of damage detection in bolted connections for segmented rotor blades. Therefore, a dual-system monitoring approach comprising both active and passive sensing methods was implemented, and the acquired measurements were thoroughly analyzed. The hybrid measurement framework was validated through a series of static and dynamic bolt-hole bearing tests. To reflect varying structural complexities and loading scenarios, the investigated joints included both single-shear and multi-shear configurations subjected to different load levels. The component specimens showed a shorter fatigue life than the coupon specimens, regardless of the cyclic stress, which can be attributed to differences in damage behavior, premature net-section rupture, and uneven bolt loads and alignment uncertainties in the test setup. In addition, increased local strains and frictional heat between the bolt and CFRP specimen may have contributed to the earlier failure of the component specimens. For monitoring, the passive system results indicate that the damage index is susceptible to the load applied to the bolt connection. The results of the active monitoring system demonstrate a robust ability to distinguish between health states using the Q-index. The effectiveness of the combined monitoring systems was demonstrated by the accurate and reliable prediction of the coupons’ condition. The results revealed that the proposed data-fusion strategy can robustly identify damage, even when individual sensor systems exhibit limited or inconsistent predictive performance. The incorporated weighting leverages the complementary strengths of each modality: the high sensitivity of active guided waves to incipient microscopic damage is balanced with the macroscopic robustness of passive strain monitoring to effectively minimize false-positive alarms. The main limitations are the passive system’s reliance on the excitation force and the active system’s lack of consistently reliable response measurements. Nevertheless, the decision-level fusion architecture is highly versatile and sensor-agnostic; it is not limited to the current setup but can be readily extended to integrate various other sensing technologies, such as fiber optics or accelerometers, by mapping heterogeneous anomaly scores. Future studies may investigate the applicability of alternative data-fusion techniques in similar applications. Moreover, characterizing different damage types and analyzing their respective failure modes would provide valuable insights. To support future experimental studies, a displacement-sensor concept enabling direct measurement of hole expansion should be developed.
Footnotes
Acknowledgements
The authors would like to thank the Federal Ministry for Economic Affairs and Energy of the Federal Republic of Germany (BMWE) for funding, the project “SONYA—Increasing the reliability of segmented rotor blades through hybrid condition monitoring” (FKZ 03EE3026B), and the project partners.
Funding
The authors received no financial support for the research, authorship, and/or publication of this article.
Declaration of conflicting interests
The authors declared no potential conflicts of interest with respect to the research, authorship, and/or publication of this article.