
Abstract
In existing rehabilitation training, research on the accuracy of recognizing completed actions has achieved good results; however, the reduction in the misjudgment rate in the action conversion process needs further research. This article proposes a multichannel information fusion method for the movement conversion process of squat/sit-to-stand, which can help online movement conversion classification during rehabilitation training. We collected a training dataset from a total of eight subjects performing three different motions, including half squat, full squat, and sitting, equipped with plantar pressure sensors, RGB cameras, and five inertial measurement units. Our evaluation includes the misjudgment rate for each action and the time needed for classification. The experimental results show that, compared with the recognition of a single sensor, the accuracy after fusion can reach 96.6% in the case of no occlusion and 86.7% in the case of occlusion. Compared with the complete time window, the classification time window is shortened by approximately 25%.
Keywords
Introduction
In recent years, research on rehabilitation training for elderly and hemiplegic patients has become a very popular research field because weakness and disability limit the daily activities of such people and reduce their quality of life. For example, squat/sit-to-stand is one of the most basic and most performed activities in people’s daily lives. To complete the conversion of these actions requires a strong and healthy muscle group to perform a series of complex actions. Therefore, it is very difficult for frail elderly and hemiplegic patients to complete the conversion of several actions without any external assistance. Hence, it is particularly important to detect the intention of human movement and incorporate it into rehabilitation training control systems. In the current research, the methods for detecting and recognizing human movements can be roughly divided into two categories. One category uses the sensor signals of electromyography, electroencephalogram or mechanical sensors such as inertial sensors and K-nearest neighbors (KNNs), support vector machines (SVMs), artificial neural networks (ANNs), and Bayesian classifiers for classification. 1 The other is based on Red/Green/Blue (RGB) video sequences and depth cameras to identify human activities. 2 Most studies are about spatiotemporal trajectory, motion coding, and key pose extraction.3–5 With the development of deep learning, the use of deep learning methods has surged, leading to an increase in recognition accuracy. 6 –8 Many researchers have begun to study the application of deep learning convolutional neural networks (CNNs) and long short-term memory (LSTM) networks in RGB video action recognition. 9 Each method has its advantages in recognition, but it also has some inherent weaknesses. For example, conventional RGB images lack three-dimensional motion data, which affects recognition performance. In addition, light, occlusion, and clutter also affect recognition performance. 10 –12 The accelerometer may not be sufficient to provide enough useful information; it needs to be used in conjunction with other sensors, such as gyroscopes 13 –15 and ECG sensors, 16 to provide more accurate classification.
Therefore, multisensor fusion is an effective method for improving the accuracy of activity recognition. Its goal is to make use of the advantages of each kind of information to compensate for the other’s disadvantages. 17 Multisensor fusion is usually divided into three categories: data-level fusion, feature-level fusion, and decision-level fusion. 18 Data-level fusion is a fusion process such as denoising, data classification, and data compression. 19 However, the data generated from heterogeneous sources cannot be directly fused. 20 Feature-level fusion means that features can be extracted from multisource data to obtain new high-dimensional features. 21 Decision-level fusion is the final decision obtained from the respective decisions of multiple sensors. 22 At present, human action recognition and its perception modes, including cameras, force sensors, and inertial sensors, have been widely studied. For example, Mahjoub and Atri 23 proposed a method to identify human activities. Spatiotemporal interest points (STIPs) are employed to identify changes in images. A histogram of oriented gradients (HOG) and a histogram of optical flow (HOF) are used to extract features. Hou et al. 24 proposed a method to encode the spatiotemporal information of skeleton sequences into color texture images and use CNNs for action recognition. Although they obtain a good recognition rate, they all use a single piece of sensory information, which has some inherent defects. To enable different types of sensors to compensate for their respective disadvantages, Chen 25 extracted the features of depth cameras and inertial sensors and fused them to form high-dimensional feature vectors for action recognition. Aouaidjia et al. 26 proposed a method to recognize human actions from depth images and skeleton information using CNNs. Dawar et al. proposed a deep learning-based decision fusion method, 27 using depth cameras and inertial sensors to recognize actions or gestures. Compared with the case of using a separate sensing mode, the recognition accuracy is improved. However, the feature dimension they obtain is relatively high, and the training of the model is also time-consuming.
This article focuses on data feature-level fusion based on plantar pressure sensors and inertial sensors for the movement conversion process of squat/sit-to-stand and uses the RGB video information classification method to assist in decision-making. It is conducive to reducing the misjudgment rate of actions in rehabilitation training control and the influence of the occlusion environment on action recognition. Therefore, we constructed a multimodal human action recognition (HAR) framework with an inertial sensor configured in each of the five parts of the person (calf, thigh, and back). It is also equipped with a pair of plantar pressure insole sensors, which can measure the plantar force of the human body in real time. In addition, there is a traditional camera that collects RGB video information synchronously. To classify human movement, the experiment collected three similar conversion actions: standing-full squatting/half squatting and sitting, as a dataset. The main works of this research are as follows. A scheme suitable for HAR is proposed that uses the information fusion of RGB video, pressure sensor, and inertial sensor through mutual compensation between the fusion information of the pressure sensor and the inertial sensor and the information of the RGB video in different environments. This framework improves the classification accuracy during human motion transformation. Moreover, the squat/sit-to-stand motion conversion dataset is made, which provides help for follow-up studies of squat/sit-to-stand motion conversion.
Research methodology
Figure 1 is the data acquisition platform of this paper. The research method process is shown in Figure 2. First, the modal data of a single sensor are used to organize and identify the data. Then, feature-level fusion extracts the characteristics of plantar pressure data and inertial sensor data for classification and recognition to obtain a lower false-positive rate. Finally, the expected misjudgment rate is obtained through decision-level fusion classification with RGB video information.

Data collection hardware.

Block diagram of the human action recognition method.
Feature level fusion of IMU and plantar pressure
Inertial sensor configuration and data acquisition
The inertial sensor used in the experiment is the LPMS-B2 component, which is a total of five inertial measurement units (IMUs) placed on the back, thighs on both sides, and the calves on both sides. The x-axis of the IMU coordinate system points to the direction of the coronal axis, the y-axis points in the direction of the vertical axis, and the z-axis points in the direction of the sagittal axis.
The acquired data include three-axis acceleration and three-axis angular velocity information


where a represents acceleration;
The original data obtained by the IMU are often disturbed by the instrument or unexpected movements of the participants, and the generated noise reduces the accuracy. Therefore, it is necessary to preprocess the raw data of the inertial sensor before further processing. First, the collected raw data are processed by mean filtering. Figure 3 shows the IMU data channel that collects back movements. The angular acceleration curve around the x-axis has a peak and a trough, which correspond to the periods when the body angle changes the most during squatting and standing. The amplitude changes greatly, and the characteristics are obvious. The changes in angular velocity around the z-axis and around the y-axis are related to the swing and tilt of the human body, but the amplitude changes are small, and the characteristics are not obvious.

Inertial measurement unit data.
Figure 4 shows the results of a half squat-standing up process information acquisition. The change and amplitude of the curve of acceleration and angular acceleration are small when standing in the time period of 0–60 T and 800–900 T. The curve changes more gently when half squatting occurs in the time period of 300–500 T. It can be intuitively seen that the curve of acceleration and angular acceleration change drastically, and the amplitude of the curve is relatively large when we are in the process of half squatting in the time period of 60–300 T and standing up in the time period of 500–800 T.
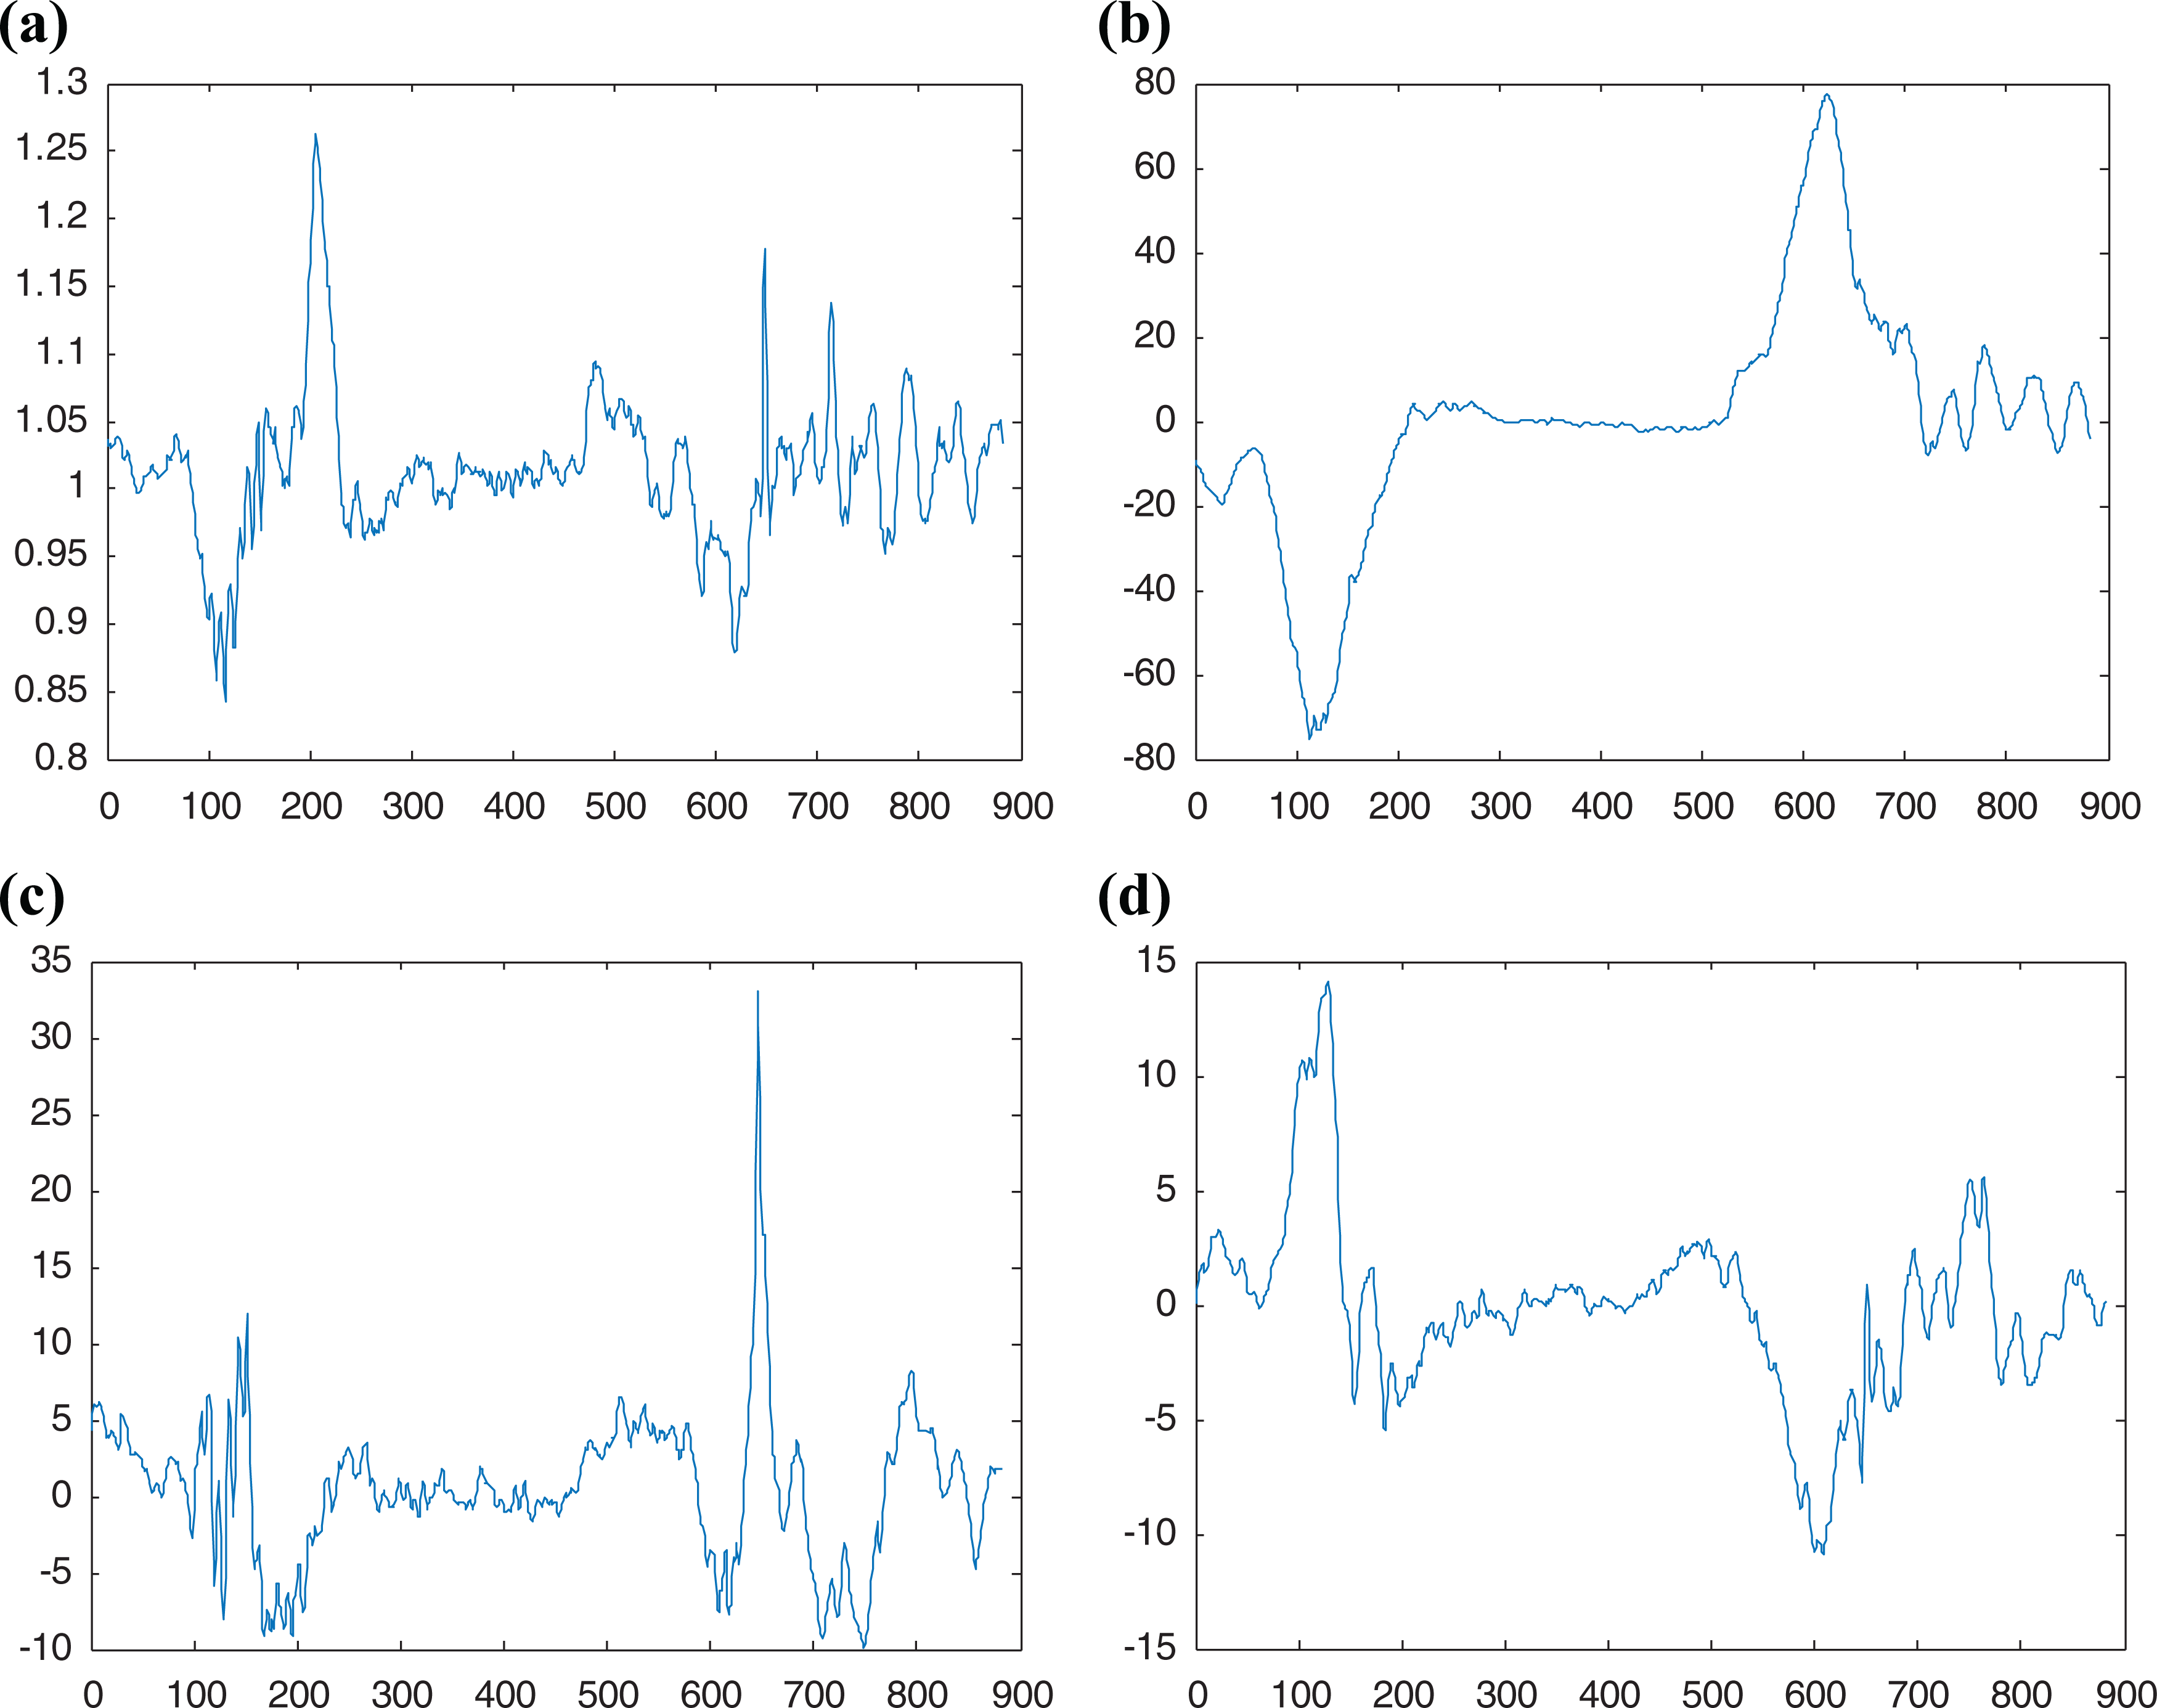
Half squat–standing process: (a) total acceleration, (b) angular velocity around the x-axis; (c) angular velocity around y-axis, and (d) angular velocity around z-axis.
Figure 5 shows the results of a full squat–standing up process information acquisition, in which the time period of 0–60 T and 800–900 T are standing state, the time period of 300–500 T is a full squatting state, 60–300 T is a full squat process, and 500–800 T is a standing process. Figure 6 shows the result of obtaining information about the process of sitting down and standing up processes, which includes the standing state in the time period of 0–60 T and 800–900 T, the sitting state in the time period of 300–500 T, a sitting process in the time period of 60–300 T, and a standing process in the time period of 500–800 T.

Full squat–standing process: (a) total acceleration, (b) angular velocity around the x-axis; (c) angular velocity around y-axis, and (d) angular velocity around z-axis.

Siting–standing process: (a) total acceleration, (b) angular velocity around the x-axis; (c) angular velocity around y-axis, and (d) angular velocity around z-axis.
The curve change in the resultant acceleration during the half squat–standing up process shown in Figure 4 is similar to the curve change in the resultant acceleration during the sitting-up process shown in Figure 6 and the curve change in the resultant acceleration during the full squat–standing up process shown in Figure 5 is more obvious. The change in the x-axis angular acceleration curve of the half squat-up process shown in Figure 4 is similar to that of the full squat-up process shown in Figure 5, and the change in the x-axis angular acceleration curve of the sit-up process shown in Figure 6 is more obvious. The curves of angular velocity around the y-axis and z-axis shown in Figures 4, 5, and 6 are also obviously different, but since their own characteristics are not obvious, they can be treated as auxiliary features.
Therefore, the combined acceleration of acceleration and rotational angular velocity information is as follows
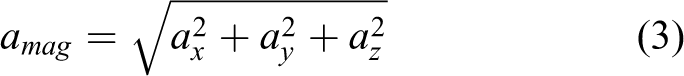
where ax
, ay
, and az
represent acceleration information along the x, y, and z axes, respectively, and the value of
Plantar pressure sensor configuration and data acquisition
The plantar pressure experiment uses a flexible membrane pressure sensor insole ZNX-01. The sensor is a resistive sensor, and its output resistance decreases as the pressure applied to the surface of the sensor increases. We can measure the size of the pressure through a specific pressure–resistance relationship and obtain data on plantar pressure by placing it on the sole.
The pressure of the eight pressure points of the left and right feet in the three squatting movements is drawn as a curve as shown below.
Figures 7, 8, and 9 show that in the process of completing the three movements of half squat, full squat, and sitting, the pressure curves of the left and right feet are similar during the sitting-standing process. However, in the process of half squat–standing up and full squat–standing up, the pressure curves of the left and right feet are quite different. These situations occur because, in the process of half squatting and full squatting, the body’s center of gravity tends to be more inclined to a certain lower limb to maintain the body’s own balance. When the experimenter is conducting the experiment, one foot is harder. In addition, it can be seen that the plantar pressure difference between the three actions is relatively large, so the data of the 16 pressure points (merge left and right feet) in the experiment can be organized into an array for feature extraction.

Diagram of the pressure on the left and right feet during siting-standing (a) Left foot pressure, (b) Right foot pressure.

Diagram of the pressure on the left and right feet during full squat–standing (a) Left foot pressure, (b) Right foot pressure.

Diagram of the pressure on the left and right feet during half squat–standing (a) Left foot pressure, (b) Right foot pressure.
Feature extraction and description
After the collected raw data have completed the mean filtering, the next step is to extract features. The purpose of feature extraction is to use the smallest number of features to obtain the best recognition effect. Hence, the designed feature extraction module cannot use too many complex features. This article selects three time-domain features. 28 The features are as follows

where
First, each sensor signal is connected in series, and then we extract the above features from all four channels of the accelerometer and gyroscope to form feature vectors. Hence, for each data sequence, the size of the feature vector obtained is [1 × (3 (the number of features) × 4 (the number of channels)] = [1 × 12].
Similarly, the plantar pressure also extracts the characteristics of the three time domains, namely, the mean value, the mean value of the absolute value of the first difference, and the mean value of the absolute value of the second difference. We calculate the obtained pressure value according to each pressure point, which is that each group of actions has 16 × 3 = 48 feature values. Then, we organize each group of actions into row feature vectors and packet marking the actual actions as labels.
Feature fusion and action recognition
After extracting features from IMU and plantar pressure information, the features need to be fused. Therefore, after calculating the feature vectors of each sensing channel (plantar pressure information and five IMUs) independently, the feature vectors obtained from multiple modal data related to the same action are connected according to the same timestamp, and a new high-dimensional feature vector is obtained. In feature fusion, balancing different feature sets means that the connected features must have the same numerical scale and similar length, so the min–max normalization technique is used to process the numerical range of the feature set.

It is unknown which feature is valid for the learning algorithm. Therefore, it is necessary to select the relevant features that are beneficial to the learning algorithm from all the features. In practical applications, the problem of dimensional disaster often occurs. If only some of the effective features are selected to build the model, the running time of the learning algorithm can be greatly reduced, the generalization ability of the model can be increased, and the overfitting can be reduced.
At present, feature selection methods are usually divided into three categories: embedding methods, filter methods, and wrapper methods. 29 The embedded method selects those features that are important to the training of the model in the process of determining the model. The filter method assigns weights to the features of each dimension; such weights represent the importance of the features and then sort them according to the weights without actually training the classifier, so it highly depends on the classifier and dataset used subsequently. 30 The wrapper method evaluates the usefulness of the feature set by using the classification performance of the classifier trained with the feature set. This article adopts a feature selection method based on the wrapper method. Table 1 shows the pseudocode of feature selection fusion in this article. This method uses a feature subset of sweep forward and includes the following steps:
An optimal feature selection algorithm.

2.2 RGB video classification algorithm
The RGB video classification algorithm used in this article is a three-dimensional residual dense network human behavior recognition algorithm for classification. 31
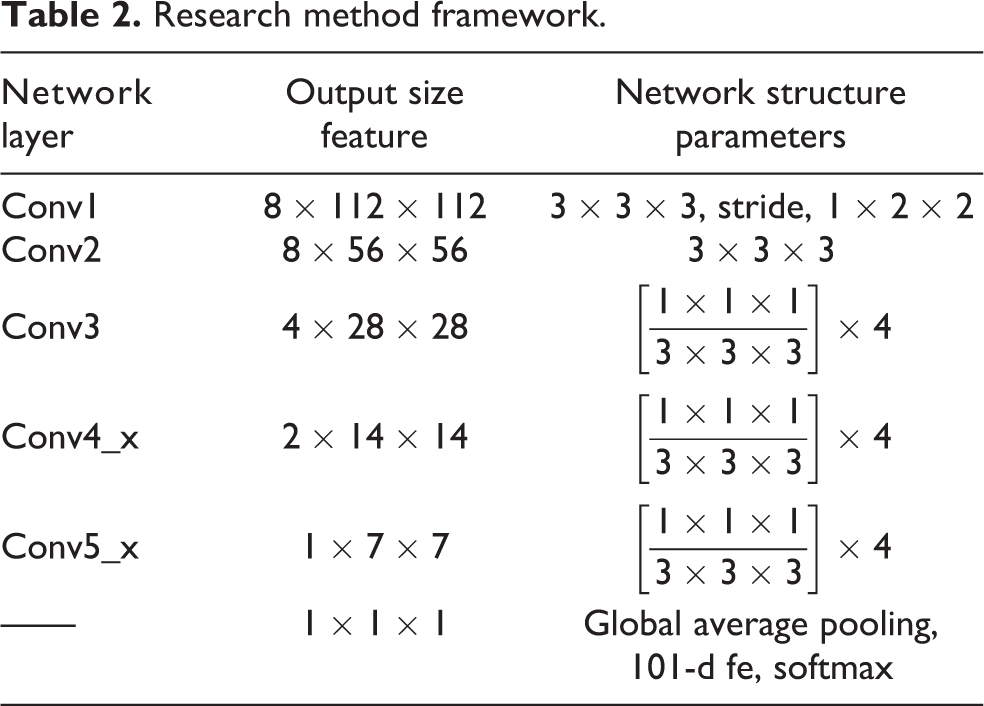
In the adopted three-dimensional residual dense network, the shallow first layer of the network is provided with 96 filters, the filter of the global feature aggregation convolutional layer is set to 512, and the remaining network parts are all set to 128 filters. Except for the convolutional layers such as 3D Conv1 and 3D Conv2, which are convolution downsampling in the residual dense layer, the other structural parameters are shown in Table 2, and the step size is 2 × 2 × 2.
Research method framework.
Decision-level fusion based on improved D-S evidence theory
The traditional D-S evidence theory applied to multiclassifier decision-level fusion faces the following two problems: The traditional basic probability assignment (BPA) function is constructed based on the recognition rate and the false recognition rate, and it is considered that the weight of each piece of evidence is the same. However, it did not account for the different distributions of training samples and the differences and uncertainties between the various pieces of evidence. Therefore, the weight of evidence should be different. When using orthogonal sums to synthesize conflicting evidence, it produces results that are counterintuitive.
Improved BPA function construction method
Hypothesis: The discrimination framework is

Then, the probability distribution function value for class Ak
is
From the perspective of probabilistic decision-making, assuming a test sample is judged to be class Ak , the greater the number of belongings and the number of belongings in the training sample, the higher the probability that the test sample is class Ak . In contrast, if the number of Ak categories in the training sample is lower than a certain value, the probability that the test sample is category Ak will be very low. Therefore, a new construction method for the BPA function is proposed. That is, according to the distribution of the training samples, the overall error rate is assigned to each focal element other than the correct judgment proposition, and the basic probability distribution function estimation formula is

where U is the set of classes,
The improved BPA function construction method can reduce the probability distribution of unlikely situations and assign them to more likely propositions.
Multiclassifier fusion based on improved D-S evidence theory
Since the traditional D-S evidence theory synthesis rule cannot integrate the probability assignment function of two contradictory pieces of evidence, to overcome this shortcoming, we adopt the method of high probability assignment. That is, for two conflicting evidence sources, we first determine the classification and recognition rates of the two through all training samples and then assign the probability distribution function corresponding to the evidence source with the larger recognition rate to the final composite probability distribution function. The specific integration process is shown in Table 3. Multiclassifier fusion to improve D-S evidence theory includes the following steps:
Improved D-S theory.

First, the training samples are sent to two trained classifiers, and the recognition rate of each classifier for the training samples is recorded. After training the system parameters, the test samples are sent to each classifier. According to the recognition rate and misjudgment rate of each classifier for each class, the improved BPA function construction method described in the section “Improved BPA function construction method” is used to obtain the probability assignment function.
Then, the contradiction between two probability allocation functions needs to be judged. If contradictory, find the probability distribution function provided by the classifier with a high recognition rate to the training samples through steps 6–8 and take this probability distribution function as the final synthetic probability distribution function. If it is not contradictory, then go to synthesis according to the synthesis rules of traditional D-S evidence theory to obtain the final probability distribution function.
Finally, the fusion decision is made according to the obtained synthetic probability distribution function.
Experiment and result analysis
Experiment and data collection
The experimental device is as follows: (1) IMUs (LPMS-B2) placed on the back, thigh (left and right) and calf (left and right) are used to measure the acceleration, angular velocity, and other data of multiple movements. (2) The flexible membrane pressure sensor insole ZNX-01 is placed on the sole to detect the sole pressure of the human body. (3) RGB video with a traditional camera is obtained.
The experimental dataset is composed of eight healthy subjects, including men and women, height range (168–175 mm), and weight range (42–80 kg). During one collection process, the corresponding subjects were asked to perform three motion tasks of sitting (chair height 450 mm), full squatting, and semisquatting (90°±10°), each of which was repeated 10 times. Therefore, the total size of the training data was 240 trials. Each subject can choose the exercise speed arbitrarily, but the order of the exercise task was required to remain unchanged in the order of standing-sitting/half squatting/full squatting–standing up. At the beginning and end of each recording, the subjects were all standing to avoid collecting data without a movement phase at the beginning and end of the acquisition process. During the collection process, some RGB video information under obstructions was also collected, as shown in figure 10.

Examples of actions in real scenes: (a) squat without cover, (b) sit down without cover, (c) half squat without cover, (d) squat with cover, (e) sit down with cover, and (f) half squat with cover.
Analysis of results
After the feature extraction and fusion of multiple sensors, the next step is to select the appropriate classifier to train and test the proposed recognition framework. In this experiment, four popular classification algorithms are compared and analyzed: the KNN, SVM, decision tree (DT), and LSTM. Eightfold cross-validation is used to obtain the recognition accuracy.
The KNN idea is that if most of the K most similar samples in the feature space (i.e. the nearest neighbor in the feature space) belong to a certain category, then the sample also belongs to this category. In other words, in the classification decision, the method only determines the category of the sample to be divided according to the category of the nearest one or several samples.
The principle of SVM classification is to identify different classes to maximize the distance between them by constructing an optimal hyperplane as the decision surface.
A DT is composed of a series of tree-like nodes, and each node represents a feature and has corresponding decision rules. All samples are continuously divided from the root node to subnodes until the leaf node ends the process to achieve classification. Therefore, the process of building a DT is to determine the sequence of features and the corresponding decision rules.
An LSTM is an improved recurrent neural network that can solve the problem that recurrent neural net cannot handle long-distance dependence. LSTM adds a method that can transmit information multiple time steps apart.
Classification and recognition based on single-channel sensors
Figure 11 shows the classification results of accelerometer information (Acc), gyroscope information (Gyro), plantar pressure information (Force), and accelerometer and gyroscope fusion information using KNN, SVM, LSTM, and DT, respectively. It can be seen that the KNN classifier achieves better classification than the SVM, LSTM, and DT classifiers. The results show that the accelerometer of the IUM sensor has a better measuring effect on HAR than the gyroscope. The accelerometer and gyroscope are added to the KNN classifier at the same time to increase the recognition rate of the KNN classifier to 80%. In the case of the SVM, LSTM, and DT classifiers, the recognition rates are 73.3%, 78.3%, and 76.6%, respectively. These results show that under the recognition framework of this article, the KNN classifier has a better classification effect than the SVM, LSTM, and DT classification instruments.

Single-channel recognition results of four classifiers.
HAR analysis based on feature-level fusion of IMU and plantar pressure sensor
Table 4 shows the recognition results of the feature-level fusion of the IMU and plantar pressure sensor. The highest accuracy of the KNN classifier for HAR is 93.3% (K = 126). In the case of the SVM classifier, LSTM classifier, and DT classifier, the highest accuracy rates are 86.7%, 90%, and 83.3%, respectively (K = 126), which is lower than the accuracy of the KNN classifier. Therefore, the KNN classifier provides the best accuracy of 90% for the HAR system that uses the feature-level fusion of these three sensors (plantar pressure, accelerometer, and gyroscope). Figure 12 shows their confusion matrix.
Eightfold cross-validation feature-level fusion classification results with different K values of four classifiers.
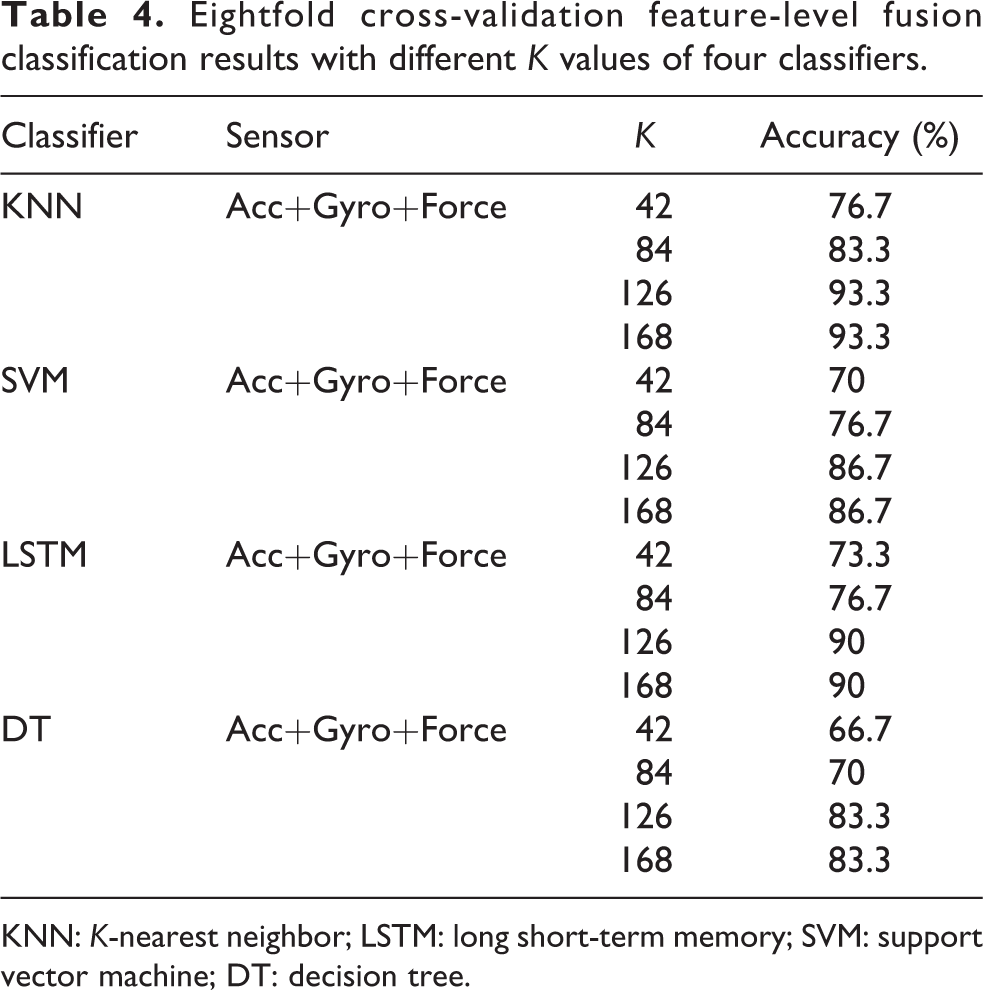
KNN: K-nearest neighbor; LSTM: long short-term memory; SVM: support vector machine; DT: decision tree.

Confusion matrices for the (a) K-nearest neighbor, (b) support vector machine, (c) long short-term memory, and (d) decision tree models.
Figure 13 shows the recognition rate analysis of three sensors using weighted average fusion and feature-level fusion in this article. This method separates the features of the three sensors and uses them to train three KNN classifiers. When given new test data, all three classifiers are configured to output class probabilities. These probabilities represent the likelihood that the new observation belongs to each category, and the category with the highest probability is selected as the final classification output. In the weighted average fusion method, two weights are evaluated: (33.3% ACC, 33.3% Gyro, and 33.3% Force) and (30% ACC, 25% Gyro, and 50% Force). The weight A + G + F (30/20/50) is selected because the recognition rate of pressure sensors is higher than that of accelerometers and gyroscopes and that of accelerometers is higher than that of gyroscopes, as shown in Figure 11.

Recognition results based on K-nearest neighbor feature-level fusion and two weighted average methods.
Therefore, the recognition rate of the HAR method based on the KNN classifier proposed in this article is higher than the recognition rate of the weighted average fusion and several other classifiers. In addition, compared with the other three classifiers, the KNN classifier has lower computational complexity. Consequently, the KNN classifier is considered to be the best choice for the proposed action recognition framework.
Evaluation of window size
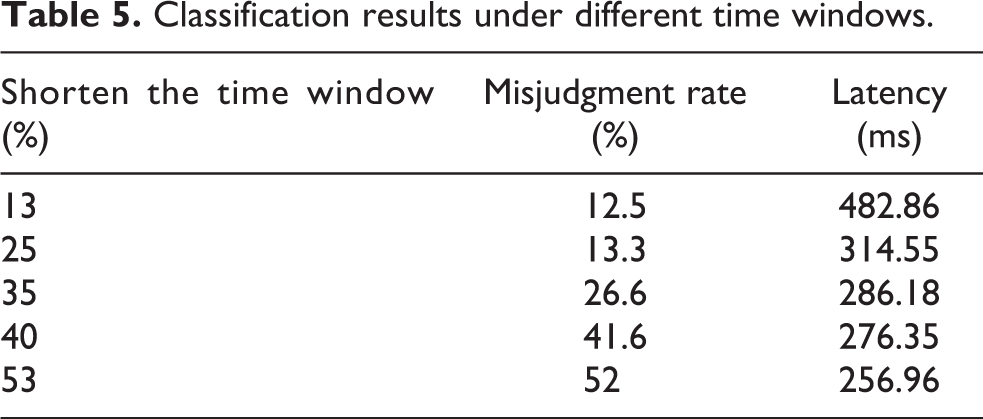
The goal of this research is to classify movements in real time, which means that the system should accurately classify movements as early as possible. Therefore, the time until the movement is correctly classified (waiting time) is an important metric for judging the performance of this system. This metric can be applied to the movement at the beginning of the classification processor, or it can be applied to the transition between different movements. The delay depends on the size of the window, so the three movements collected in this experiment have similar motion trajectories during the transition between the two motion states of standing and squatting (sitting). Therefore, this article studies the influence of the time window size on classification accuracy. To find a suitable time window, this article shortens each set of standing and squatting (sitting) data by approximately 13–53% of the time window for classification training. Table 5 shows the aforementioned accuracy and delay of different window sizes considered in the evaluation. According to the results, as shown in Figure 14, a 25% reduction in window size provides a good compromise between the false-positive rate (13.3%) and the acceptable delay (314.55 ms). For a smaller window size, the false-positive rate rises to below 26.6%, and the window size exceeds 400 ms, which may not be conducive to controlling the exoskeleton device.
Classification results under different time windows.

Misjudgment rates and latencies for different time window sizes.
Leave-one-out validation
To evaluate the subject independence of the proposed method, we want to study the extent to which the trained classification system is suitable for movement data observed from objects that are not part of the training set. Therefore, an omission analysis was performed, and the dataset of seven subjects was used as the training set, and the dataset of the remaining one subject was used as the test set. The eightfold cross-validation test was carried out, and the results are shown in Table 6. The second column gives the results of general eightfold cross-validation. The third column lists the test results after using the leave-one-out cross-validation method. The results show that when using eightfold cross-validation for training and testing, the average accuracy rate is 92.06% (1.59). When the test was performed with subjects being omitted, the average accuracy rate dropped to 81.2%, and the standard deviation increased (3.40). This analysis shows that our method can achieve considerable generalization performance when applied to subjects not included in the training set.
Results of leave-one-out validation.

HAR analysis based on RGB video
In Table 7, the classification algorithm used is a three-dimensional residual dense network HAR algorithm for classification, which is based on the HAR classification results of RGB video. When the video is not occluded, the accuracy can reach 90%. However, when the video is occluded, the accuracy is greatly reduced, up to 46.7%. Therefore, in the presence of obstacles, only the classification of RGB video is not sufficient so other sensors should be used to compensate for it.
RGB video classification results.

Decision-level fusion results based on improved D-S evidence theory comparison with the most advanced methods
In the process of assisting exoskeleton robots, to better provide effective assistance to the wearer in time, the action recognition framework k in the system is required to accurately classify the movement as early as possible. Therefore, this article studies the classification results obtained by shortening different time windows, as shown in Table 5. In the collection process, it takes the subject approximately 12s to complete an action, so the false-positive rate obtained by shortening approximately 25% in Table 5 is ideal.
To further reduce its misjudgment rate, this article uses RGB video information as auxiliary information, which is based on the improved D-S evidence theory algorithm, fusing RGB video information at the decision-making level with the classification information after the fusion of IMU and plantar pressure sensor feature levels.
Table 8 lists the information fusion action recognition effect of the improved D-S evidence theory under occlusion and no occlusion. Among them, the data of the IMU and plantar pressure sensor adopt the data after the time window is shortened by 25%. It is evaluated and compared with the single-mode sensor, the weighted average fusion method and the traditional D-S evidence theory. The experimental results show that when the fusion classification results of the mechanosensor are combined with the RGB video classification results by D-S evidence theory, the false discrimination rate is reduced, especially the RGB video classification results in the occlusion situation. Compared with the weighted average fusion method and the traditional D-S evidence theory, the improved D-S evidence theory also improves the recognition effect. Therefore, multichannel information fusion enables mechanical sensors and RGB video to compensate for their shortcomings and improve the recognition rate.
Recognition results of the multichannel information fusion test set.

Comparison with the most advanced methods
This section conducts experimental tests on the public dataset University of Texas at Dallas Multimodal Human Action Dataset (UTD-MHAD) and compares it with the state-of-the-art methods, as shown in Table 9. The fusion scheme presented in this article provides better recognition performance on UTD-MHAD. In the study by Mahjoub and Atri, 23 STIPs are used to detect segment changes, and HOG and HOF are used to extract features. Finally, action classification is performed by a SVM, and an accuracy rate of 70.3% is obtained. In the study by Hou et al., 24 a CNN based on skeleton optical spectra (SOS) was proposed to recognize human actions. Its main contribution is the encoding method for SOS image generation and achieves 86.9% accuracy on UTD-MHAD. UTD-MHAD was introduced in the study by Chen, 25 and the information from the depth and inertial sensors was used for action recognition. They extracted the feature sets of the depth camera and inertial sensor separately, fused them into one feature set, and finally sent them to the classifier to obtain 79.1% accuracy. In the study by Aouaidjia et al., 26 a CNN is used to extract information from depth images and skeleton information, and an arithmetic scheme based on Max and Prod is adopted in the three-channel decision-level fusion. The accuracy rate on UTD-MHAD reaches 88.1%. A deep learning-based decision fusion action recognition method is described in the study by Dawar et al. 27 They used CNNs for depth sensors and a combination of CNNs and LSTM networks for inertial sensors. Finally, the class scores of the output layer are multiplied to obtain the decision fusion score. The accuracy rate on UTD-MHAD reaches 89.2%.
Comparison of the proposed approach with the state-of-the-art methods on the UTH-MHAD dataset.

The scheme proposed in this article is based on the data feature-level fusion of mechanical sensors and finally carries out decision-level fusion with RGB video information. In feature-level fusion, we use an optimal feature selection method to reduce the dimension of fused features. In the final decision-level fusion, a decision fusion based on improved D-S evidence theory is adopted, which further refines the fusion rules and reduces the loss of information. It makes probability assignments more rational while solving the problem of composition when evidence is contradictory. The proposed scheme achieves 94.6% accuracy on UTD-MHAD, outperforming existing results.
Conclusions
This article proposed a multichannel fusion HAR method that uses data from vision, inertia, and pressure, which are three different perception methods. The proposed system uses a combination of feature-level fusion and decision-level fusion to recognize human actions. Detailed experimental results show that the proposed method has a lower misjudgment rate and better robustness in classifying human behavior compared with the setting of using each sensor modality separately. Additionally, the classification effect after shortening the time window was also discussed. The experimental results show that after the three-channel information fusion, the false-positive rate is obviously reduced, and the classification time window is shortened. This is meaningful for research on online classification and action conversion. The transition of different motion states based on these results will be further studied in the future. In addition, a systematic study of the feature space will be carried out to obtain which features must be related, thereby simplifying the configuration of the sensor.
Footnotes
Author contributions
YW contributed to the conception of the study, the background research, method design and experimental results analysis, and wrote the manuscript; TTM,YC,HL and RKL helped perform the analysis with constructive suggestions; JQS provided an important suggestion about the framework of this article and revised the manuscript. All authors read and approved the manuscript.
Declaration of conflicting interests
The author(s) declared no potential conflicts of interest with respect to the research, authorship, and/or publication of this article.
Funding
The author(s) disclosed receipt of the following financial support for the research, authorship, and/or publi-cation of this article: This work was supported by the Research Funds for the National Key R&D Program of China under Grant [2017YFB1303200], Anhui Provincial Key Research and Development Project [Nos 202004a05020013, 202004a07020051], and Anhui Provincial Major Science and Technology Project [No.2020b05050002].