
Abstract
As one cannot know in advance where a crack will form, currently used discrete crack monitors may miss to detect a crack if it grows outside the monitored regions. A high-resolution continuous 2D strain monitor applied to the entire surface of interest would solve this problem. Cholesteric liquid crystal elastomers (CLCEs) provide this ability, and with recent advances in chemistry, they can be applied very easily, similar to a paint coating. Here we demonstrate the detection of new cracks and monitoring of their progression using CLCE coatings applied to an extruded polystyrene insulation panel, an aerated concrete brick, and a reinforced concrete beam, respectively. Regardless of where and in which direction a crack develops, it can be easily detected thanks to a change in color. By analyzing the new color, quantitative information on the crack width can be extracted. Considering the ease of applying the CLCEs to standard building materials, the high 2D resolution strain monitoring with clear optical detection that it provides, and the low cost of the solution, we argue that CLCE coatings can have a revolutionary impact on structural health monitoring for buildings and infrastructure, to be constructed or already existing.
Keywords
Introduction
Structural health monitoring (SHM) plays a pivotal role in ensuring the structural integrity and safety of engineering systems by enabling continuous assessment and early detection of potential damages. In the realm of SHM, crack detection approaches encompass three main categories: (1) visual inspection by humans of the cracks themselves or of simple monitor devices glued to the structure across cracks, reliant on direct or remote observation; (2) sensor-based methodologies employing acoustic, strain, fiber optic, or ultrasonic sensors; and (3) secondary imaging and vision-based methods utilizing thermography, digital image correlation (DIC), and machine learning/deep learning algorithms for crack identification and localization. Manual visual inspection, while effective, is labor-intensive, subject to human error, and can be costly. Exploring more efficient, precise, and adaptable crack detection techniques remains a priority within SHM.
The sensor-based technologies of category (2) offer a more quantifiable approach, enabling continuous real-time monitoring 1 and measurement of crack propagation. However, most such methods face challenges in scalability, cost, weight, complexity of installation, and accuracy across diverse structural environments. In the case of wired electronic sensors, ensuring connectivity with the power source and data recipient is a significant challenge, 2 and false alarms arising from sensor faults can cause misinterpretations. 3 A further drawback with electronic and optical sensors currently on the market is the unavoidable limitations in resolution arising from the fact that each sensor gives only one signal: depending on how a sensor is installed, it may miss a crack that develops in the wrong place or wrong direction,4–6 not triggering a response. While guided ultrasonic waves have significant potential to enable SHM over large areas,7–9 their use presents challenges such as sensitivity to environmental changes, complex signal analysis, data volume, processing requirements, and signal attenuation over distance. Yan et al. applied a flexible electronic sensing skin constituting a soft elastomeric capacitor to detect and monitor cracks in reinforced concrete. 10 The sensing skin showed good results on two small-scale reinforced concrete beams albeit limited to monitoring along only one dimension. In general, sensor-based methods require a data acquisition system for the analysis, and managing the copious data generated by a large number of sensors presents fidelity and anomaly detection challenges. 11 Monitoring a structure’s internal condition is also important as damage is not always detectable on the surface of a structure. In this context, Downey et al. have proposed an automated crack detection method for conductive smart-concrete structures using a resistor mesh model. 12 This method utilizes carbon-doped cementitious materials and a sequential Monte Carlo method to accurately identify damage locations. While this approach is cost-effective and scalable, it is limited to new structures and involves complex implementation and computational requirements.
Recent research endeavors have largely centered on category (3), leveraging image processing and deep learning techniques for enhanced crack detection within structural components. Woods et al. utilized image analysis techniques to detect cracks in reinforced concrete (RC) structures and established a damage index based on the fractal dimension of the detected cracks. 13 Their study demonstrated the effectiveness of the proposed method in accurately detecting cracks and calculating the damage index for RC structures, yet accurately assessing crack propagation remains challenging, limited by the quality and resolution of the equipment used. Xiang et al. introduced an active machine learning approach integrating subset searching and weighted sampling to improve crack detection accuracy. 14 The method effectively addressed the lack of data in crack detection model training by selecting subsets with large uncertainty and training samples with large diversity. Despite its success in identifying cracks in images, challenges persist with the limitation in data sets. Golding et al. explored crack detection in concrete structures through a deep learning method using the convolutional neural network technique, showcasing enhanced reliability of gathered information. 15 Yet, the method did not address the quantification of crack widths.
Park et al. proposed the use of deep learning and structured light technology for the detection and quantification of cracks on concrete surfaces. 16 Their YOLO algorithm was used for real-time crack detection, and the sizes of the detected cracks were calculated based on the positions of laser beams projected on the surface. However, any inaccuracies or errors during the calibration of lasers, vision sensors, and distance sensors could directly impact the precision and accuracy of crack measurements. Gehri et al. presented a fully automated procedure for crack detection and measurement based on DIC in laboratory experiments on quasi-brittle materials. 17 The procedure allows for high-precision crack localization and accurate measurement of crack kinematics, even in large-scale experiments with complex crack patterns, when appropriate DIC parameters are used. The paper did not focus on the quantification of the crack widths, and the procedure for crack detection and measurement was limited in the case of very closely spaced cracks. For a crack development assessment and crack growth assessment, the methods need to monitor changes in crack dimensions and patterns over time. This can be costly, given the advanced technology that typically needs to be deployed on-site. Overall, approaches involving a machine/deep learning component must deal with the challenge of limited training set availability,18,19 and the random fractal nature of cracks can pose further difficulties. 20
A merger of categories (1) and (2) can be said to be the class of mechanochromic sensors, where the appearance or growth of a crack leads to a color change that can be detected and evaluated by the human eye. Pyeon et al. developed a mechanochromic sensor based on a Fabry-Pérot interferometer showing discoloration in response to deformations. 21 Small deformations from 0.01 mm could be measured, but the method showed sensitivity to temperature variations, and specialized equipment was required for precise assessment. Manufacturing inconsistencies may also impact sensor performance. Conversely, Lee et al. designed auxetic patterns filled with colloidal photonic crystals showcasing ultra-sensitive mechanochromism for SHM. 22 While the auxetic design allowed direct visual inspection with high accuracy of even small average strains, this was achieved by not measuring the strain continuously across the surface but rather the displacement of two measuring points, separated by several centimeters. The solution allowed strain detection only along the direction between the measuring points, and limitations arose beyond strains of 5%, displaying nonlinearity and an inability to detect new cracks.
Our study explores a different type of mechanochromic strain sensor, taking advantage of the intense selective reflection color of cholesteric liquid crystal elastomers (CLCEs)
23
to afford low-cost SHM sensors with full two-dimensional quantitative strain detection and monitoring with no resolution limit in any direction. A CLCE is a rubber in which the polymer chains are long-range ordered along a particular direction, and this direction rotates in a helical fashion along a direction
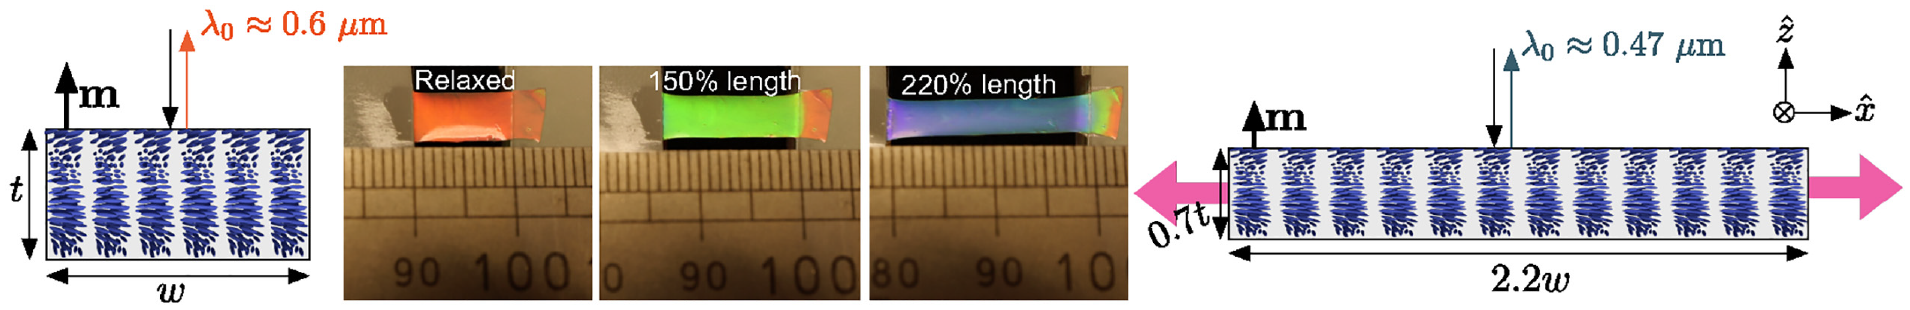
Photos of a CLCE in the relaxed state and two stretched states (middle), surrounded by schematic side view illustrations of how the cholesteric helix gets compressed within the CLCE as a result of tensile strain perpendicular to the helix.
For
To establish the quantitative relationship, one must also take into account the contraction of the rubber in the third dimension, perpendicular both to

as predicted by theory
24
and confirmed experimentally.
25
The shift from orange to blue retroreflection seen in Figure 1 (approximately a change from

which here gives
Because the CLCE precursor is a liquid that can easily be painted onto any surface of interest (following an application of a primer coating, when appropriate), and because the helix formation and transformation from liquid to rubbery state happen by self-assembly, our sensors are deployed following an exceptionally simple procedure. The result is an SHM sensor that allows the detection of cracks within structural components wherever they appear, as well as quantitative monitoring of their growth. Our prior research has showcased the robust mechanochromic responses of CLCE sheets 26 and fibers,25,27 highlighting their potential in strain sensing applications. Notably, continuous color changes indicative of local strain were detected when stretching up to 200%, and variations of strain across the CLCE are clearly revealed by variations in color. This current paper focuses on employing painted CLCE coatings on structural parts for crack detection. Through three small-scale laboratory experiments, the study assesses the applicability of CLCE coatings in detecting cracks and monitoring crack growth within structural elements.
CLCE coating for SHM applications
Our method to produce CLCE films for SHM is based on a two-stage thiol-acrylate Michael addition and photopolymerization reaction. The components are (Figure 2) a diacrylate liquid crystal monomer (RM257), a chiral monomer that induces the helical modulation and thereby the color (LC756), a chain extender (EDDET), a cross-linker (PETMP), black dye that absorbs non-selectively scattered light and thus ensures saturated color response,
28
a photoinitiator Irgacure 651 for the second stage radical-induced photocrosslinking, and the catalyst dipropylamine. All components are dissolved in toluene (full details on compositions are provided in the Supporting Information). In the first step, the Michael addition click reaction (catalyzed by dipropylamine) between acrylate and thiols leads to the creation of a sparsely crosslinked polymer gel network. The early formation of a gelled network simultaneously with the development of cholesteric liquid crystalline order as the toluene evaporates is of critical importance, as the gelation ensures that the solvent evaporation leads to anisotropic deswelling,
29
which aligns the helix axis
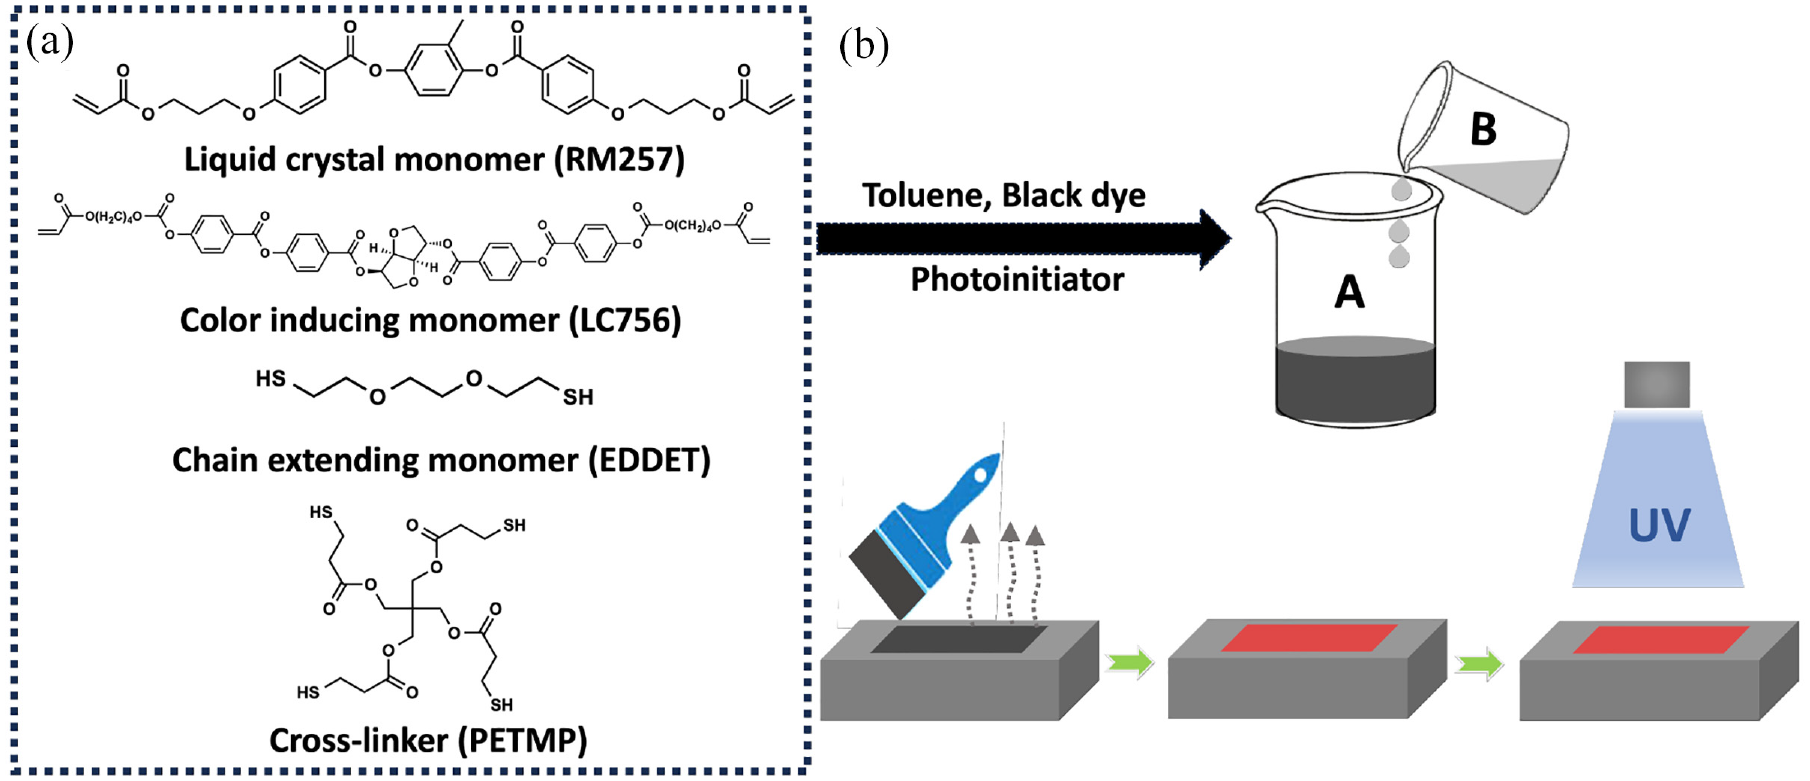
Monomers reacting to form the CLCE (a) and method of preparing the CLCE sheet by direct painting on a target surface and subsequent postprocessing (b).
In the second step, the soft gel network which has developed structural color as a result of the liquid crystal formation is photocrosslinked into a robust CLCE by means of UV light irradiation. To tune the relaxed state retroreflection color, the concentration of the color-inducing chiral monomer is varied from 4.5 wt% (red) to 5.5 wt% (green).
Results and Discussion
Preparing a CLCE precursor for applying onto arbitrary construction surfaces
In our earlier work aiming at CLCE sheets,
26
the precursor solution (CLCE-forming components shown in Figure 2a) was prepared in a laboratory environment and immediately poured into a petri dish, in which the transformation into a CLCE film took place. As we now wish to allow out-of-lab application, the aim being to directly brush-paint the precursor on a target surface of interest for SHM, we need to adapt the procedure. To this end, we divide the precursor solution into two parts A and B, which can both be stored for a long time (part A should be protected from light) and easily transported to the site of application. Just before application, part B (which contains the catalyst dipropylamine in toluene) is poured into part A (which contains all other components) and then the combined solution is mixed for about a minute before it is applied to the horizontal target surface by brushing (Figure 2b). Even if some specialty monomers are required, an optimal CLCE is thin (about 10–50
After application, the components are then allowed to react at room temperature (25°C) under normal atmospheric conditions for 12–24 h. Prior to applying the solution, we coat the target surface with a commercially available primer (Pattex Filler, Henkel, Germany) to prevent the absorption of precursor solution into pores in the surface, common in surfaces such as bricks. As shown below, this procedure yields CLCE films with sufficiently uniform retroreflection color in the visible spectrum on all surfaces explored in this study. After the first-stage reaction has completed (12 h is more than enough) and the toluene has evaporated, the film is irradiated with UV light to turn it into a robust CLCE by photo-induced crosslinking.
Crack detection and monitoring in an extruded polystyrene insulation panel
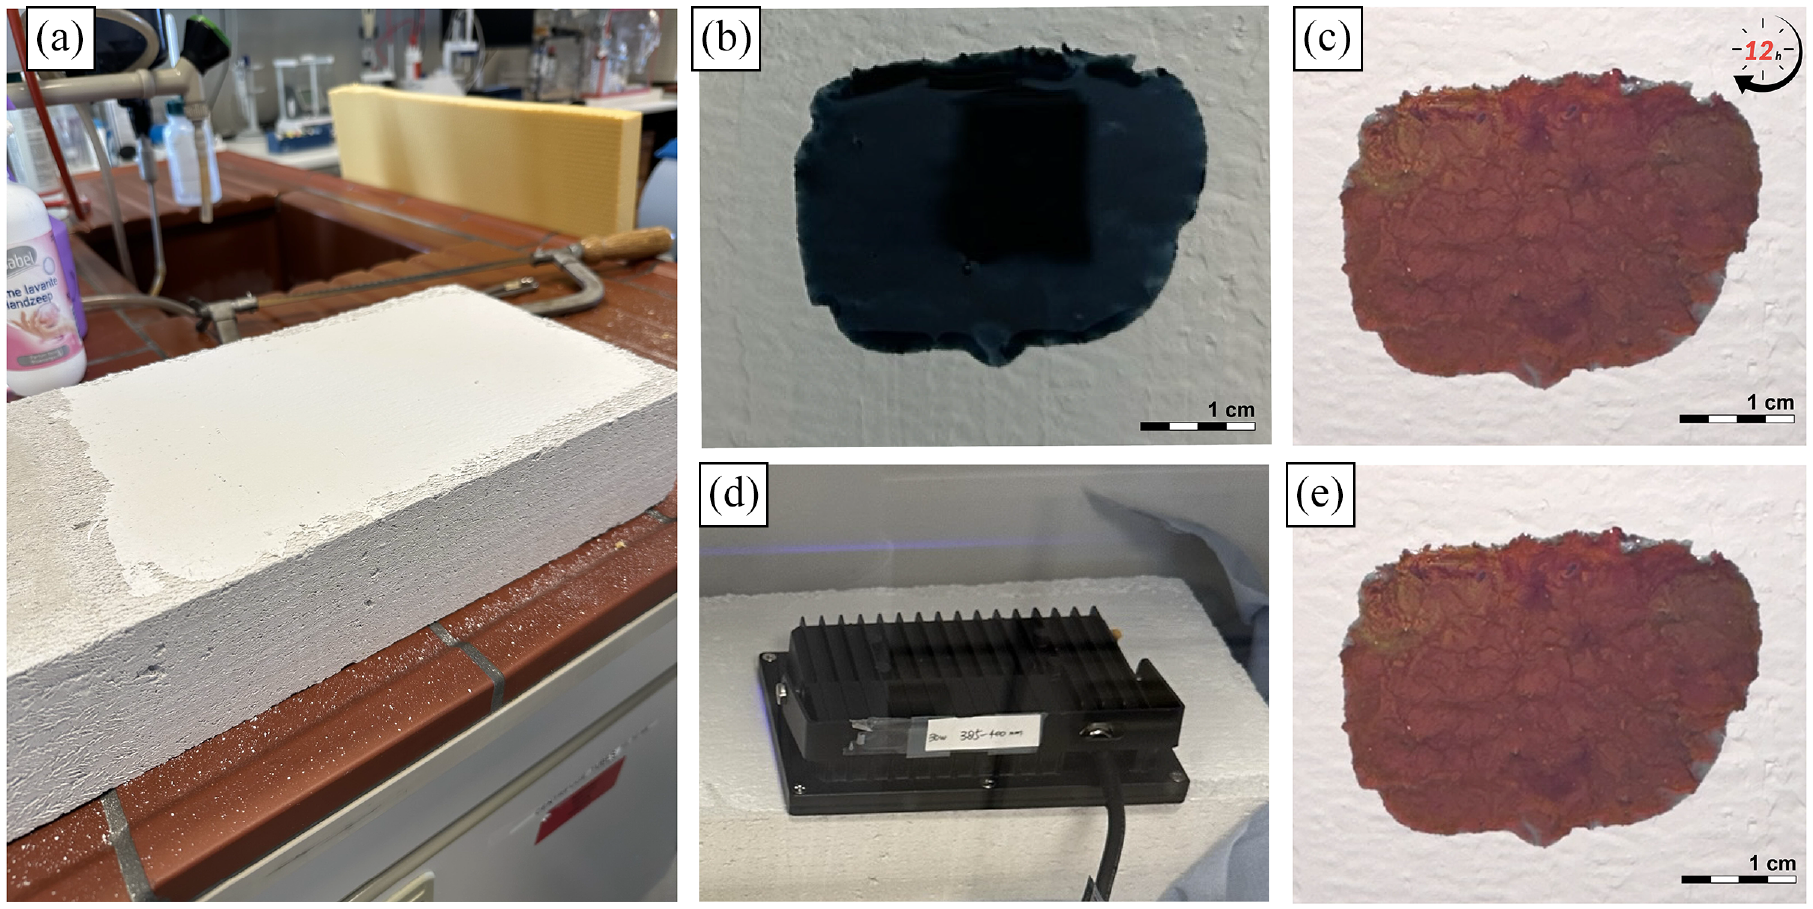
We start by conducting a simple controlled experiment to get a first evaluation of the effectiveness of painted CLCE strain sensors in SHM. We use an extruded polystyrene (XPS) insulation panel (Figure 3(a)) as test subject due to its flexible and soft nature. First, we create a predetermined cut in the panel from the front side, extending the full width and about 1 cm deep, using a carpet knife. In the relaxed state, the lips of the cut approach each other closely such that the cut cannot be seen (Figure 3(a)). We then apply the primer coating (white in Figure 3(a)) to prevent the CLCE precursor paint’s absorption into the panel. A small area of about 5 cm × 3 cm is then coated with the CLCE precursor solution (obtained by mixing parts (a) and (b)), as shown in Figure 3(b). Directly after application, the resulting patch appears black (Figure 3(c)) due to the dissolved dye and the absence of structural color, as the cholesteric liquid crystal structure has not yet had time to develop and as the toluene has not yet evaporated. After 20 h of drying, the patch has transformed into a strong red color under diffuse light (Figure 3(d)) as a result of the simultaneous solvent evaporation and liquid crystal formation. It is worth noting that we did not interact with the sample in any way after painting the precursor; the transformation into a structurally colored film takes place entirely by self-assembly. To turn the patch into a robust CLCE, we photocrosslink the gel using UV light irradiation.
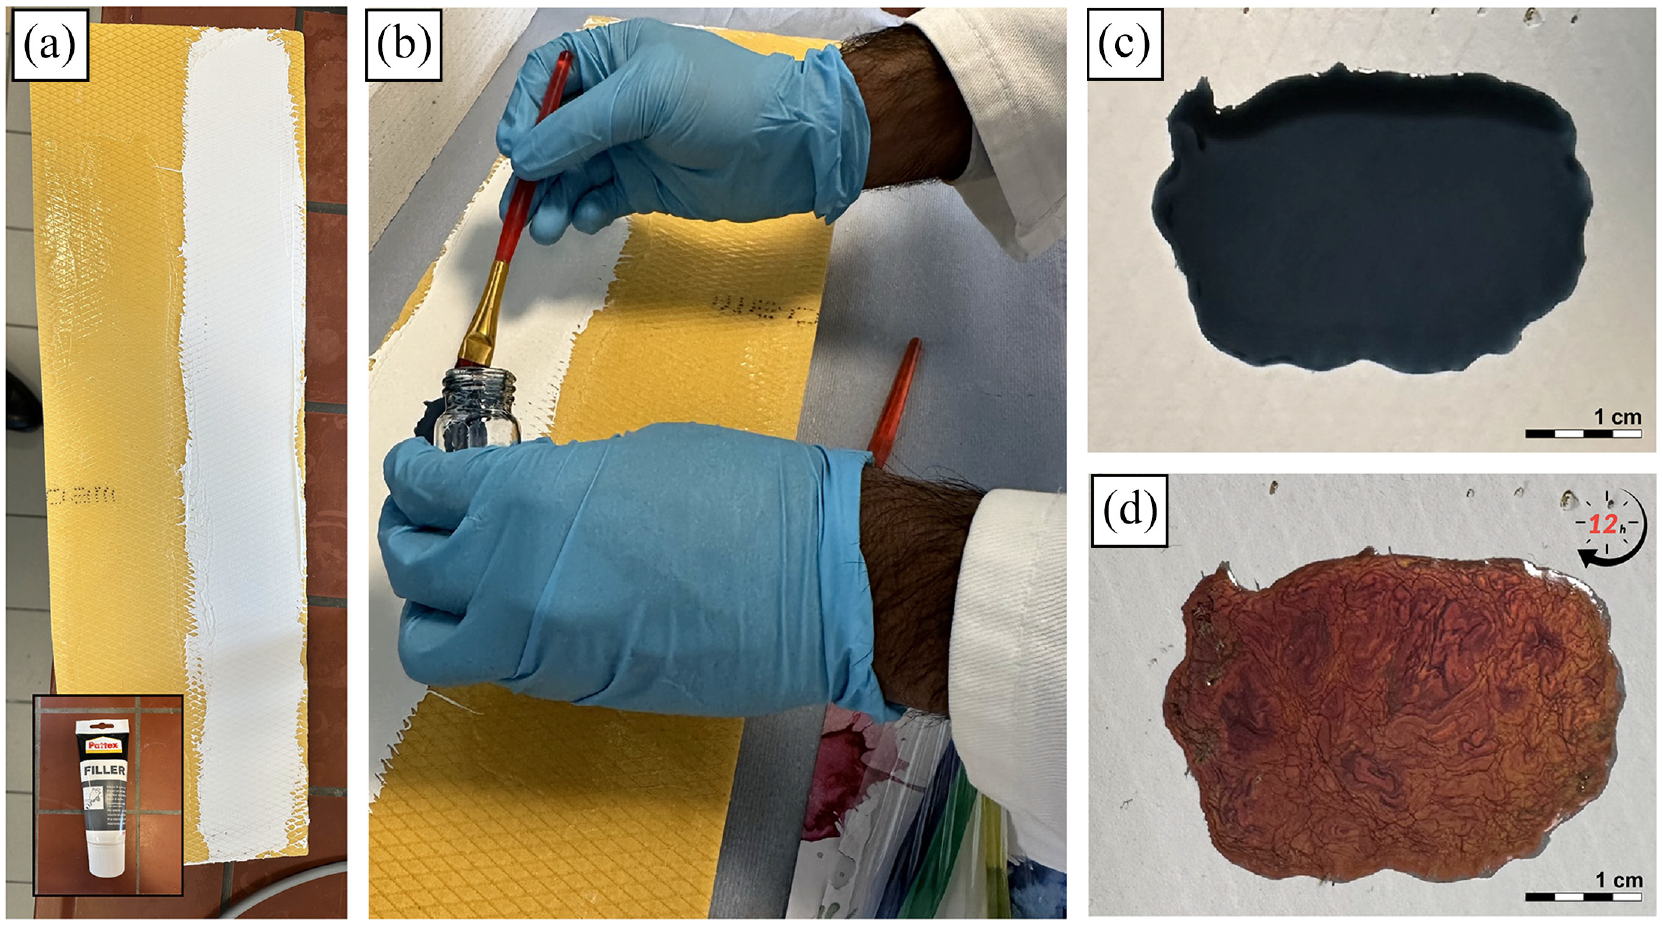
An XPS insulation panel (a; length 60 cm, width 20 cm, thickness 3 cm) is first coated with the primer to avoid that the CLCE precursor is absorbed into the porous XPS by capillary action, and then it is hand-painted with the CLCE precursor solution (b). Directly after application, the resulting patch is black (c) but after 12 h of solvent evaporation and chemical reaction (without any further manipulation after the paint application), the patch has transformed into a strongly red soft gel (d). The final UV-crosslinking step leads to no change of appearance, but turns the gel into a robust CLCE ready to reveal crack formation and growth.
We now bend the panel manually around an axis in the panel plane and along the predetermined cut such that the cut widens, see Supporting Video 1 and Figure 4(b)–(d). The panel is placed perpendicular to the laboratory bench and the illumination is diffuse white light from standard laboratory ceiling lighting (multiple fluorescent tubes). Figure 4(a) shows the CLCE prior to bending and Figure 4(e) just after releasing after bending. The initial cut widening (representing a first crack development in an actual SHM situation) is immediately revealed by a local change to a yellow hue along the cut (Figure 4(b)). As we bend the panel further, extending the lips of the cut further from each other, the color along the cut changes to more greenish (c) and eventually blueish green (d), reflecting the further widening. Next to the cut, no change in color is seen because that region experiences no strain.
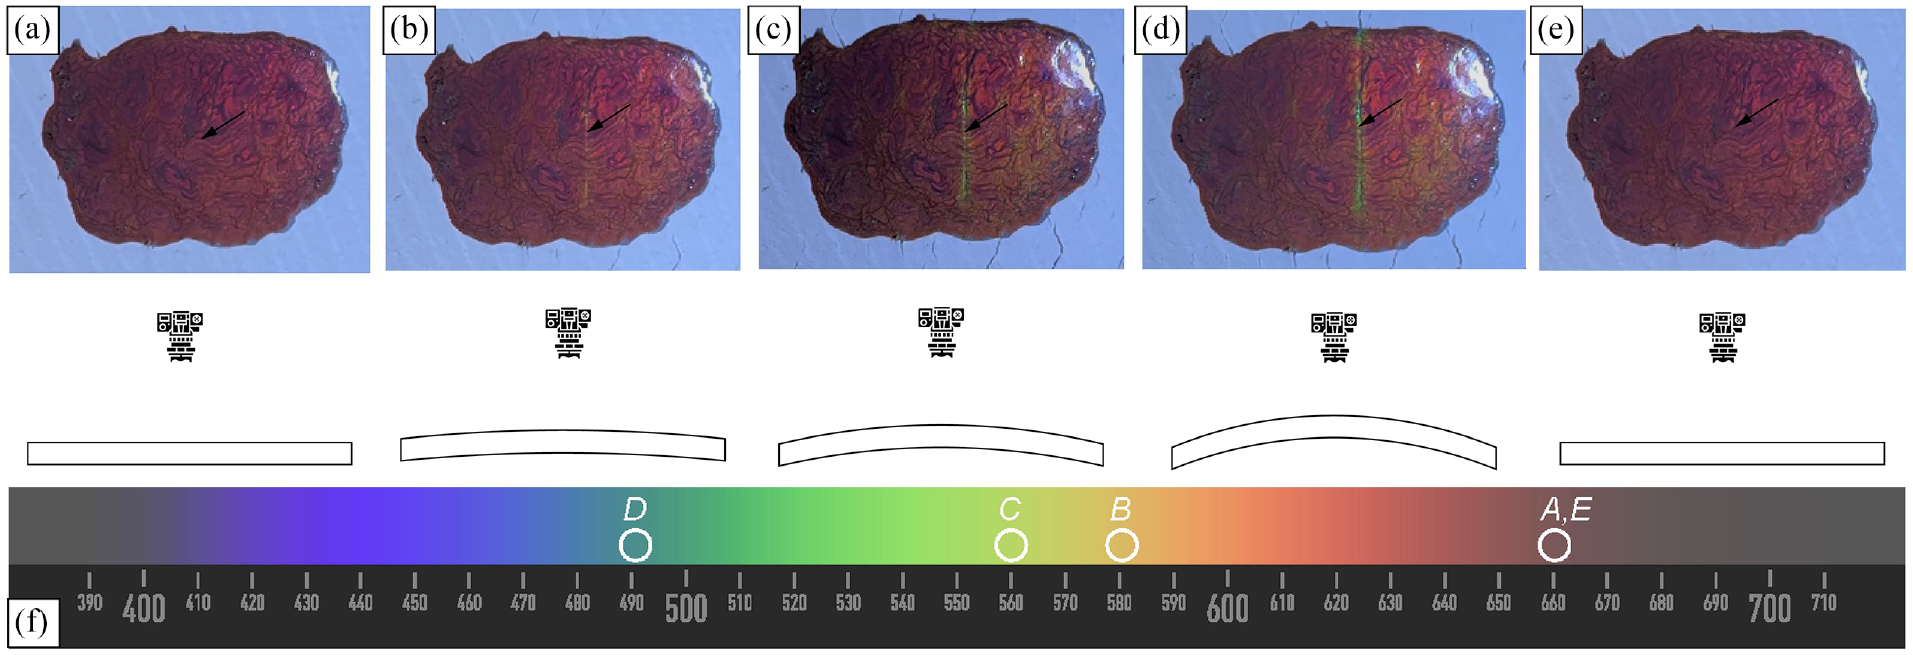
The CLCE was applied onto the XPS insulation panel with a pre-defined cut, in the relaxed state (a), as it is being increasingly bent toward the camera (b–d), and after relaxation (e). The photos are still frames from Supporting Video 1. The spectrum in (f) is reproduced from Wikimedia-Commons 30 on a Creative Commons 4.0 license. The rings highlight the colors of the CLCE above the cut as it is being strained, the letters referring to the corresponding photo panels in the top row.
This illustrates how powerful the CLCE is in revealing exactly where a crack arises regardless of where it appears or in which direction it runs, in an exceptionally simple-to-use manner. Note that the color response is in principle quantitative, a truly accurate evaluation of the crack width requiring the use of a spectrophotometer. However, already by looking at the color and comparing it with the visible color spectrum in Figure 4(f), we can estimate the effective peak reflected wavelength with this diffuse illumination to be, for the relaxed CLCE,
The experiment successfully demonstrates that crack formation, growth, and re-closure can all be monitored by observing the CLCE color change, the local color changes revealing the exact shape, propagation path, length, and width. The CLCE reverts to its original color when the panel is relaxed (Figure 4(e)), closing the gap. This demonstrates the reversibility of the color change for the CLCE coating. The ability of the CLCE to replicate the elastic behavior of the XPS insulation panel shows that CLCE coatings are well suited to clearly distinguish between breathing cracks and real cracks, which is crucial for accurate classification.
A breathing crack refers to the cyclic opening and closing movement of the crack under thermal expansion and contraction, load variations, or fatigue loadings. Further influencing parameters are the type of the structure, and deformations over time due to creep and shrinkage behavior. Therefore, regular inspections are necessary to evaluate cracks and to avoid missing cracks in the unloaded state. Depending on the monitoring budget available, different monitoring approaches can be considered:
Regular visual inspections are either conducted manually or supplemented by a remote mobile system where, for example, an Unmanned Aerial Vehicle periodically maps the CLCE.
Fixed high-resolution cameras with real-time monitoring surveying larger areas, immediately transmitting the data to a remote receiver if an internet connection is available or storing it on a local medium for retrieval during inspector visits.
The monitoring strategy needs to be tailored to each case based on the static system, structural complexity, accessibility, internet access, monitoring budget, and risk analysis of the structure.
Crack detection and monitoring in an aerated concrete brick
Reinforced autoclaved aerated concrete (RAAC) is a construction material that has been used extensively around the world, in the United Kingdom often in public buildings such as schools and hospitals. As Ball pointed out, 31 the country has recently developed a sense of critical urgency in monitoring the health of these structures, following the collapse of RAAC elements in a school building and the realization that similar RAAC slabs may have deteriorated in many other public buildings, with imminent risk of catastrophic failure. The costs of analyzing all affected buildings are tremendous and there is no obvious ideal approach, as it can be very difficult to detect cracks and their growth in the RAAC slabs prior to collapse. 31 This illustrates that the use of our CLCE strain sensors for detecting cracks in aerated concrete can be of immediate use, motivating us to choose an aerated concrete brick (Figure 5A) for our second experiment.
An aerated concrete brick (a; length 60 cm, width 20 cm, thickness 10 cm) is first coated with the primer to avoid the CLCE precursor being absorbed into the porous aerated concrete brick by capillary action, and then it is hand-painted with the CLCE precursor solution. Directly after application, the resulting patch is black (b) but after 12 h of solvent evaporation and chemical reaction (without any further manipulation after the paint application) the patch has transformed into a strongly red soft gel (c). The final UV-crosslinking step (d) leads to no change of appearance but turns the gel into a robust CLCE (e) ready to reveal the crack formation and growth.
Again the primer is applied to the brick’s surface to avoid absorption of the CLCE precursor into the brick pores, see Figure 5(a). We apply the CLCE solution following the same procedure as used for the XPS insulation panel. As before it shows a black appearance immediately after coating (Figure 5(b)). After 12 h of solvent evaporation and first-step chemical reaction (Figure 5(c)), the second step (photocrosslinking) into a CLCE is ensured by UV irradiation (Figure 5(d)). Afterward, the patch has a slightly darker red appearance under diffuse light (Figure 5(e)), such that we may estimate (using the spectrum in Figure 4(f)) the effective reflected peak wavelength to be around 0.67
To achieve a controlled crack also in this case, we define a fracture point on the upper side of the brick using a hammer and chisel. The brick is fixed horizontally with its opposite long side down onto the laboratory bench such that the region to the right of the CLCE sticks out, forming a cantilever system, see Figure 6(a). We now initiate crack formation by striking the free end of the cantilever with a hammer, with gradually increasing force, see Supporting Video 2. The pristine appearance of the CLCE is shown in Figure 6(a), whereas (b) shows how the CLCE reveals by a faint local greenish line that the crack has been initiated with the first blow of the hammer. Panels (c) and (d) in Figure 6 show how this region increasingly blue-shifts as the crack grows with each further blow of the hammer. Very rough estimates of the blue-shifted peak wavelengths along the crack are 0.58
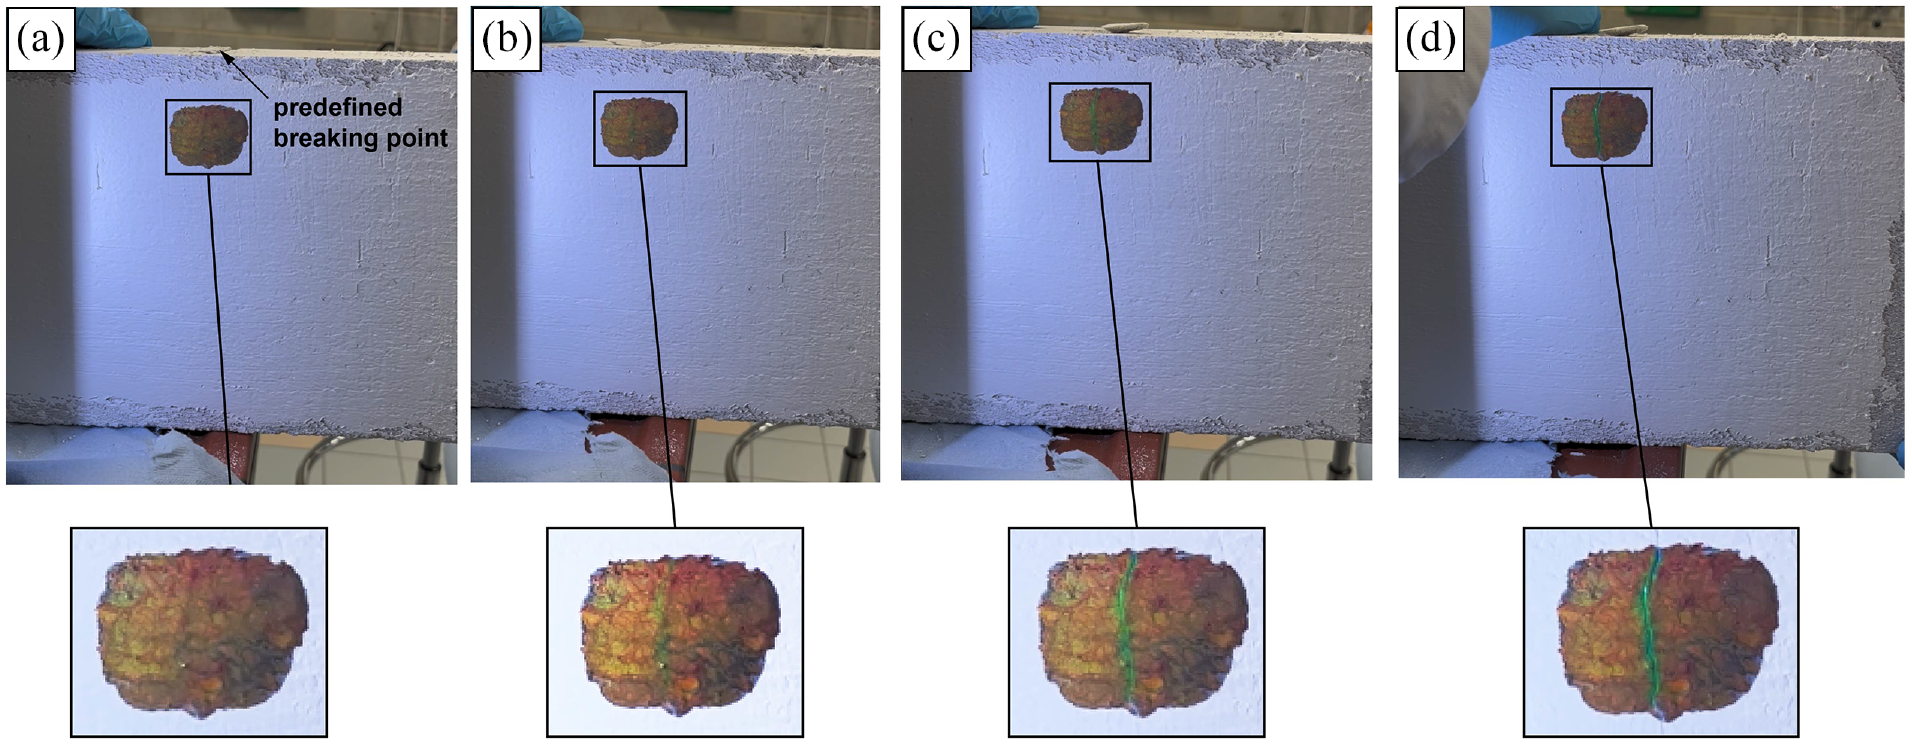
The CLCE was applied onto the aerated concrete brick with a pre-defined breaking point on top of the brick without cracking in the area of the CLCE (a). The free end of the brick is then stroked multiple times with a hammer to form a crack (b–d). The photos are still frames from Supporting Video 2.
This experiment clearly demonstrates the potential of a CLCE coating on aerated concrete for detecting, accurately locating, and monitoring the growth of cracks, emphasizing its applicability in SHM for a variety of construction materials. The upper row of Figure 6 shows that the crack is impossible to see outside the CLCE in (b), being only barely visible in the primer in (c), while in (d) it is clear to see also in the primer above the CLCE. The color change in the CLCE reveals the crack at an earlier stage, when it is still small, and with much greater contrast. The CLCE coating bridges the crack and changes color in the region of relative displacement as the bond evolves until full bonding is achieved. Moreover, the fact that the crack affects a region in the CLCE that is wider than the width of the crack in the primer (seen clearly in (d); in the brick itself the crack is still not detectable) also means that the CLCE effectively magnifies the crack, rendering it much easier to detect by camera inspection. The CLCE coating may thus be very well combined with the deep learning- or DIC-based crack monitoring solutions discussed in the introduction.
Crack detection and monitoring in a reinforced concrete beam
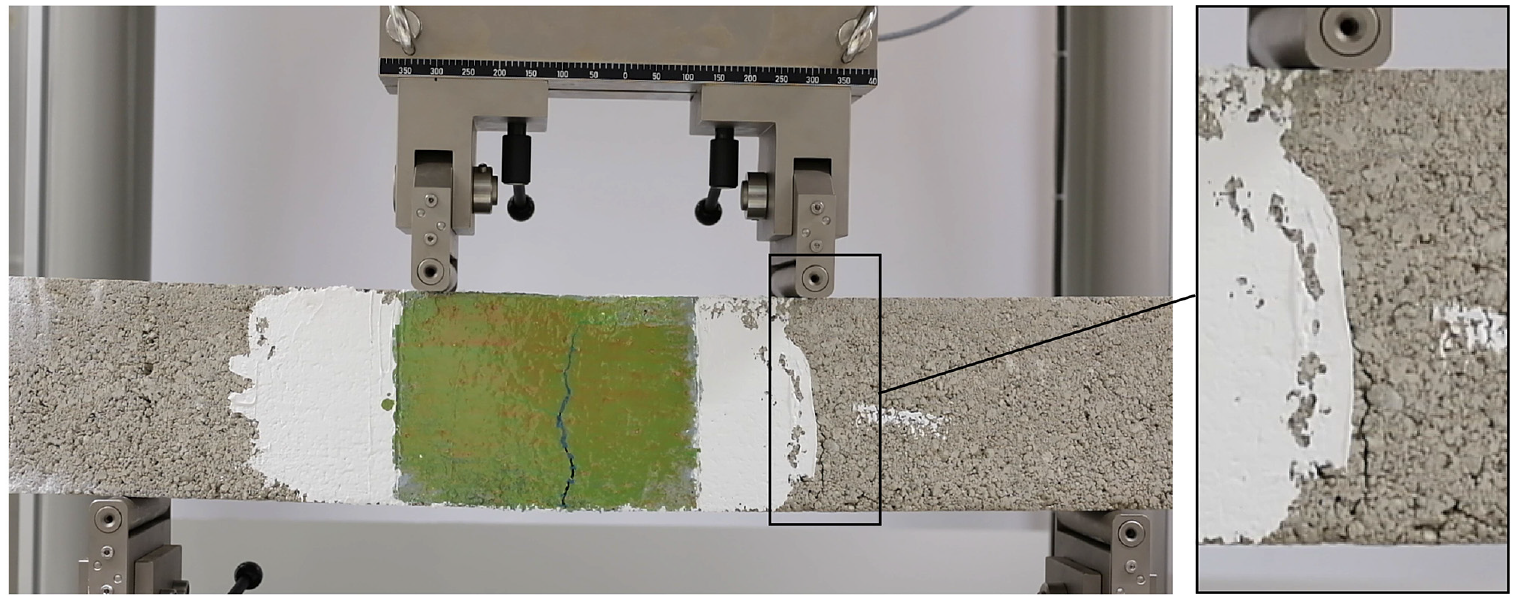
As a final demonstration, we test the applicability of painted CLCE strain sensors for crack detection without predetermining the crack formation point, in a loading experiment on an RC beam constructed of C20/25 grade concrete in a laboratory setting. The beam, which is reinforced with a single diameter 8 rebar placed centrally within the cross-section, is 1.13 m long with a height of 17.5 cm and a width of 11.5 cm. For this experiment, we apply the CLCE-based paint to a significantly larger area, covering the entire height over a length of 23 cm, with an eccentricity of ca. 7 cm, see Figure 7(a) and (b). Panel (c) indicates the dimensions of the section. The ground state helix pitch of this CLCE is slightly shorter than in the previous ones, with some local variations, yielding a mainly green ground state color, with some orange regions, under ambient diffuse light. As before, prior to painting the CLCE precursor we first apply the primer to avoid capillary suction of the precursor into the pores in the concrete. For comparison purposes, a similar loading experiment is conducted on an identical reference beam without the CLCE coating (Figure 7(d), left side). We subject both beams to central loading by a path-controlled hydraulic press, with a span length of 80 cm. The experimental setup is illustrated in Figure 7(b) and (c), Supporting Videos 3 and 4 show the experiment in full, and Figure 8 presents the load–deflection graphs.
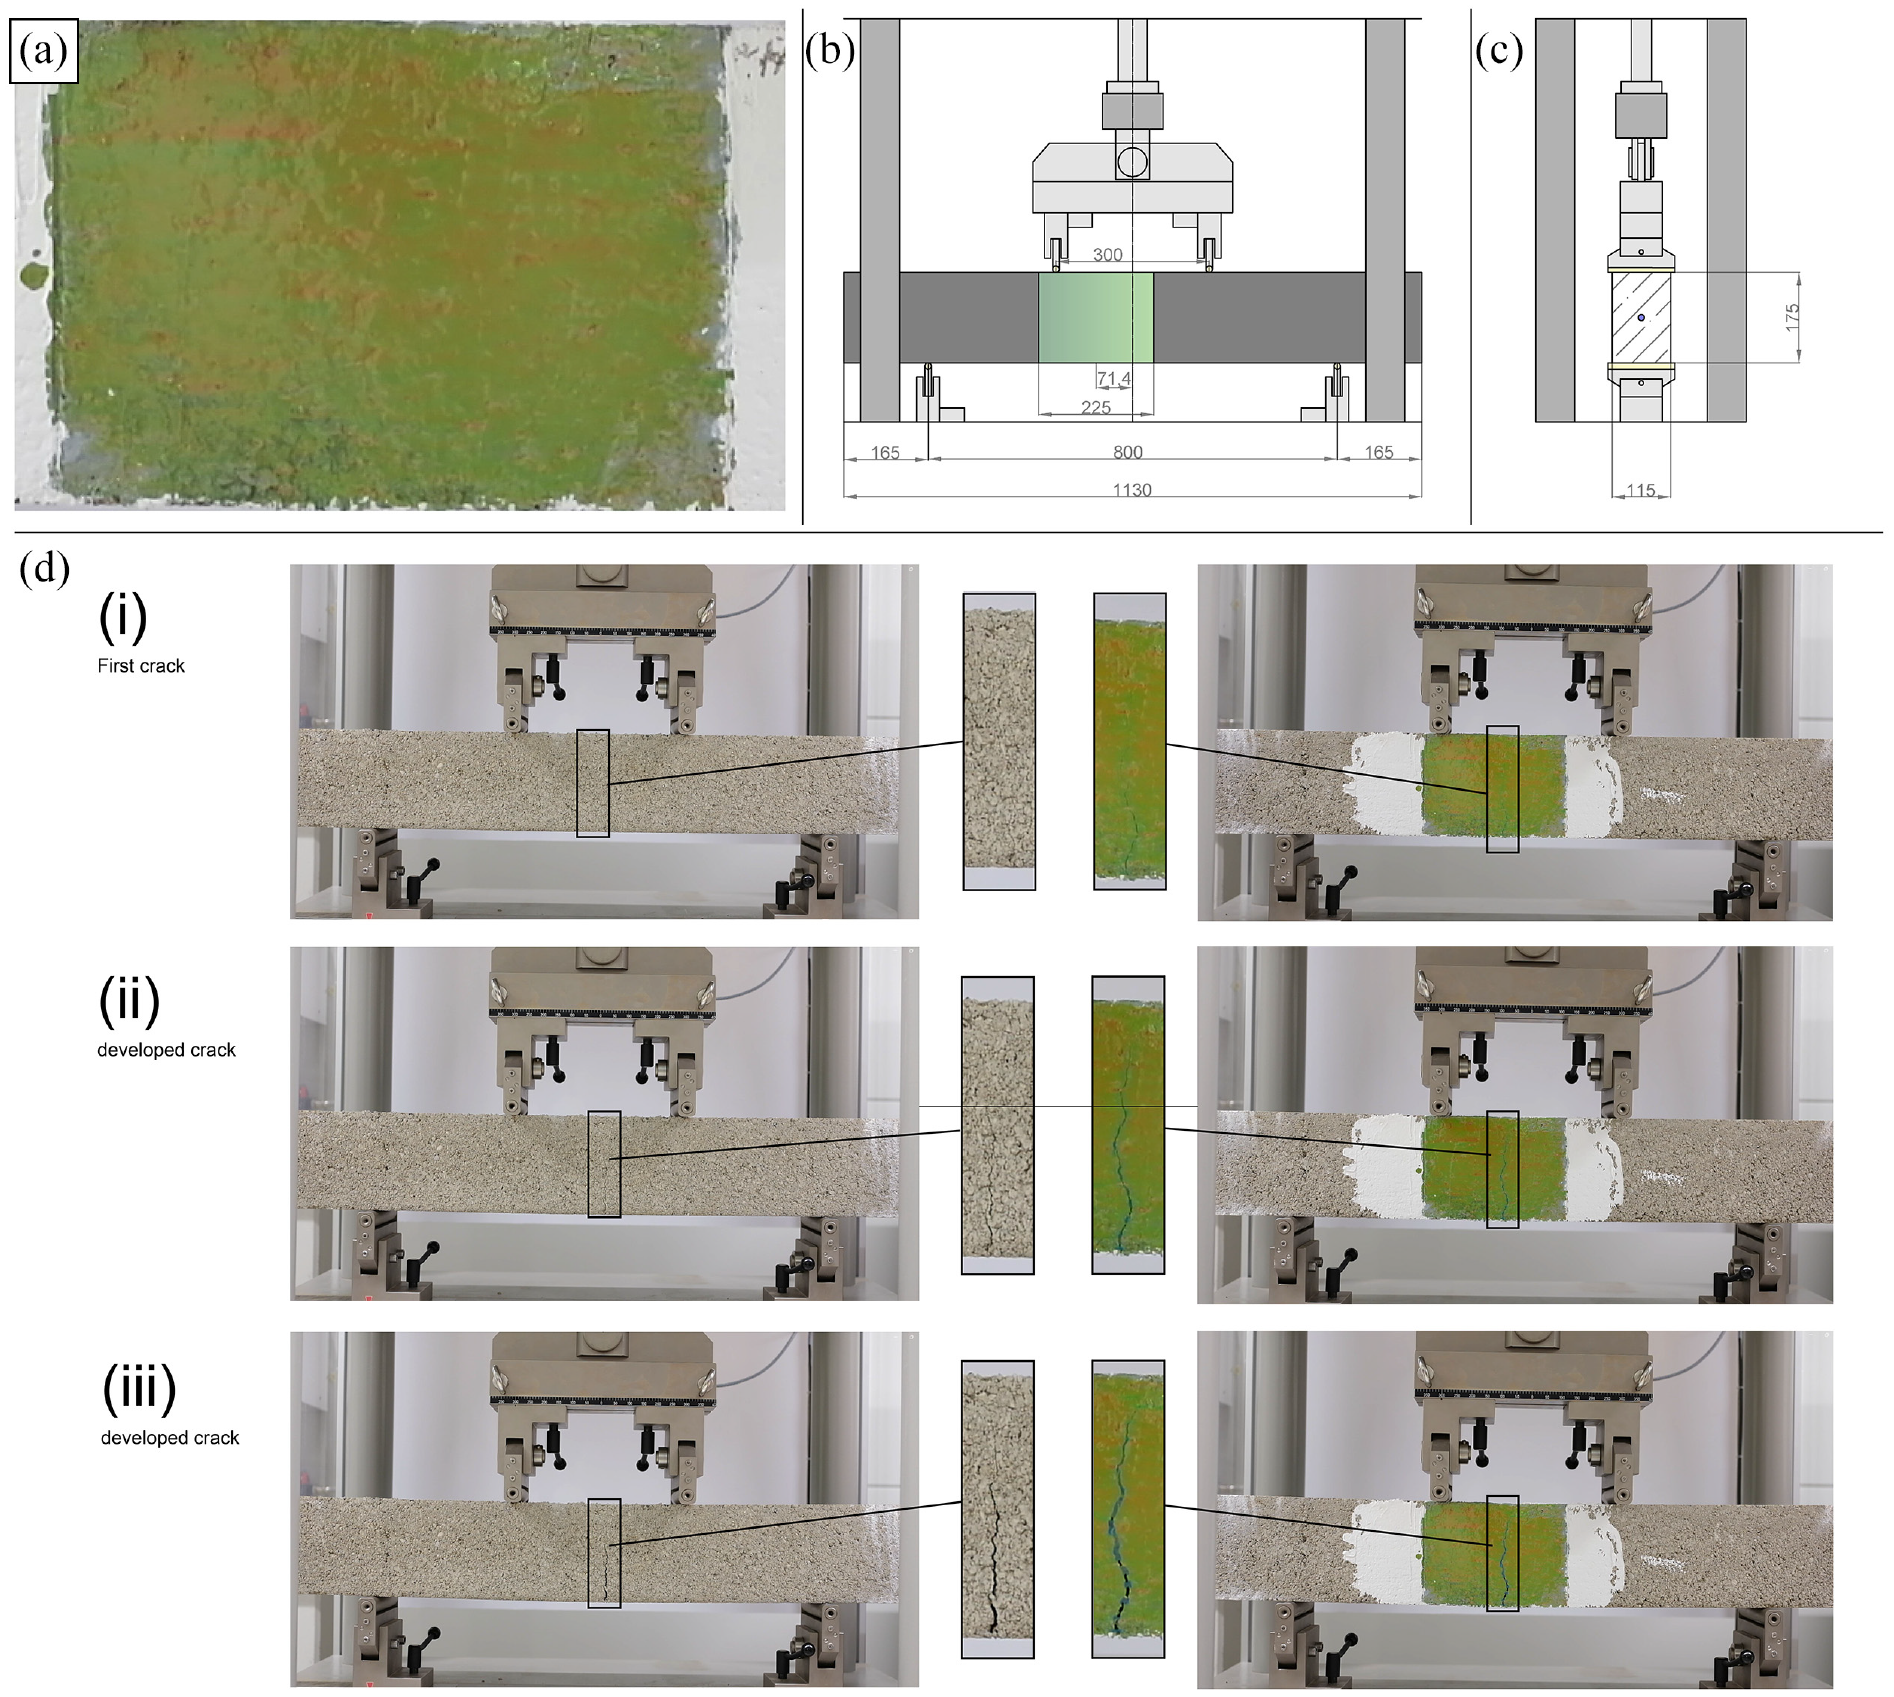
An RC beam (length 113 cm, width 17.5 cm, thickness 11.5 cm) is coated with CLCE (a). A hydraulic press is used to conduct a four-point bending test on this beam and on an identical RC beam without CLCE. The experimental setup is shown in elevation (b) and section (c). Panel (d) shows representative photos from the experiments, the reference on the left side, and the CLCE-coated beam on the right. Both beams were loaded until failure. The CLCE reveals and locates already the first crack at a stage where the crack in the RC beam without CLCE is not visibly detectable (i). The loading is constantly increased and the crack growth is monitored with a color change in the CLCE (ii, iii). The photos are still frames from Supporting Videos 3 and 4.
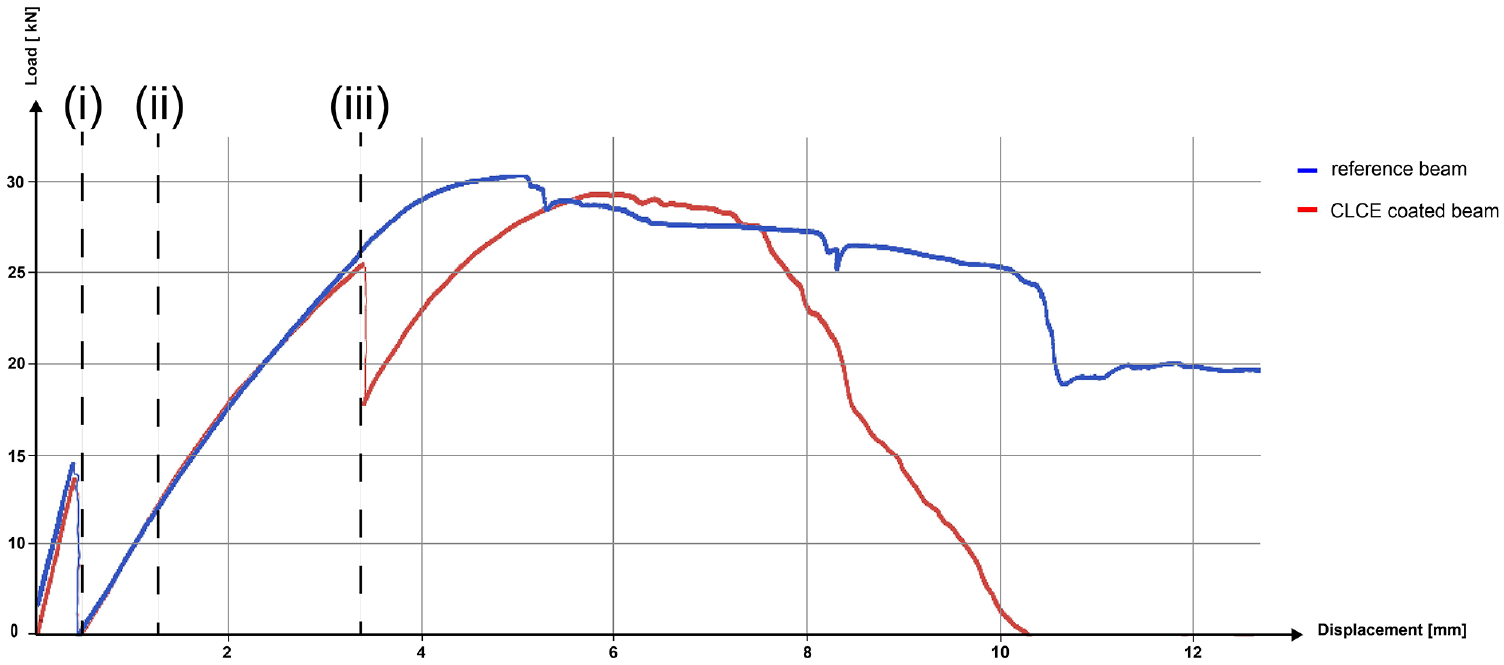
The load–displacement graphs from the experiments in Figure 7 compare the reference RC beam (blue curve) to the CLCE-coated RC beam (red curve). The horizontal axis represents displacement while the vertical axis represents force. Cracking is visible as kinks in the curves due to the experiment being path controlled. The first crack in both beams appears after 0.5 mm (i). It is immediately visible in the CLCE-coated beam, while it without CLCE-coating remains undetectable until about 1.3 mm (ii). At 3.4 mm (iii), a second crack appears on the CLCE-coated beam, marking the final comparable state of the two graphs.
Under a load of about 14 kN, a crack opens in each beam, as can be heard in the form of a snapping sound in both videos. In Figure 8, the crack formation is recognized as distinct kinks in the load–deflection graphs at the displacement indicated by the label (i). In the untreated reference beam, it is impossible to see the crack at this stage, as can be verified on the left of Figure 7(d), row (i). By contrast, the CLCE-coated beam immediately upon crack formation clearly reveals the crack by a bluish line varying in width standing out from the green background, see the right part of Figure 7(d), row (i). It is particularly apparent near the bottom of the beam, where the crack is the largest. As the crack develops further under increased load, it becomes detectable near the bottom of the untreated reference beam, although one would not notice it if not looking for it, see the left part of Figure 7(d), row (ii), indicated also in Figure 8. At the corresponding load, the crack is very visible along the entire height of the CLCE-coated beam, as the dark blue color stands out clearly from the green background (right side of the same row).
At the even higher load of label (iii) in Figures 7 and 8, the crack is now wide enough to be easily seen near the bottom of the untreated beam, whereas the CLCE-treated beam reveals its extension all the way up to the top. Interestingly, a second crack appears on the CLCE-coated beam outside of the coated area, shown in Figure 9 at a deflection slightly over 3.5 mm, creating another noticeable kink in the load–deflection graph. This may be due to the reinforcement of the system by the coating. Further research is necessary to assess whether the coating is reinforcing the system and bridging the crack.
A close-up of the appearance of the second crack in the CLCE-coated beam outside the CLCE painting, at a deflection of ca. 3.5 mm, during the experiment in Figure 7. Since a corresponding crack does not appear in the reference beam, the two response curves cannot be compared beyond this point (iii).
The experiment continues until the collapse of both beams. The CLCE sheet eventually ruptures at some points, precluding measurement of the strain based on the color change. Beyond point (iii) the comparative analysis of crack growth between the two beams is not possible, as no further crack develops on the reference beam. The photos in Figure 7D, row (iii), show the last comparison just before the appearance of the second crack (Figure 9) in the CLCE-coated beam. The width of the crack measured in the CLCE after unloading, as shown in Figure 10, is 3 mm. Interestingly, the CLCE sheet has not only made the crack visible but also highlights minor side branches of the crack pattern. This experiment highlights the improved visibility and measurable differences in crack development provided by the CLCE coating, further supporting its potential in SHM for RC structures.
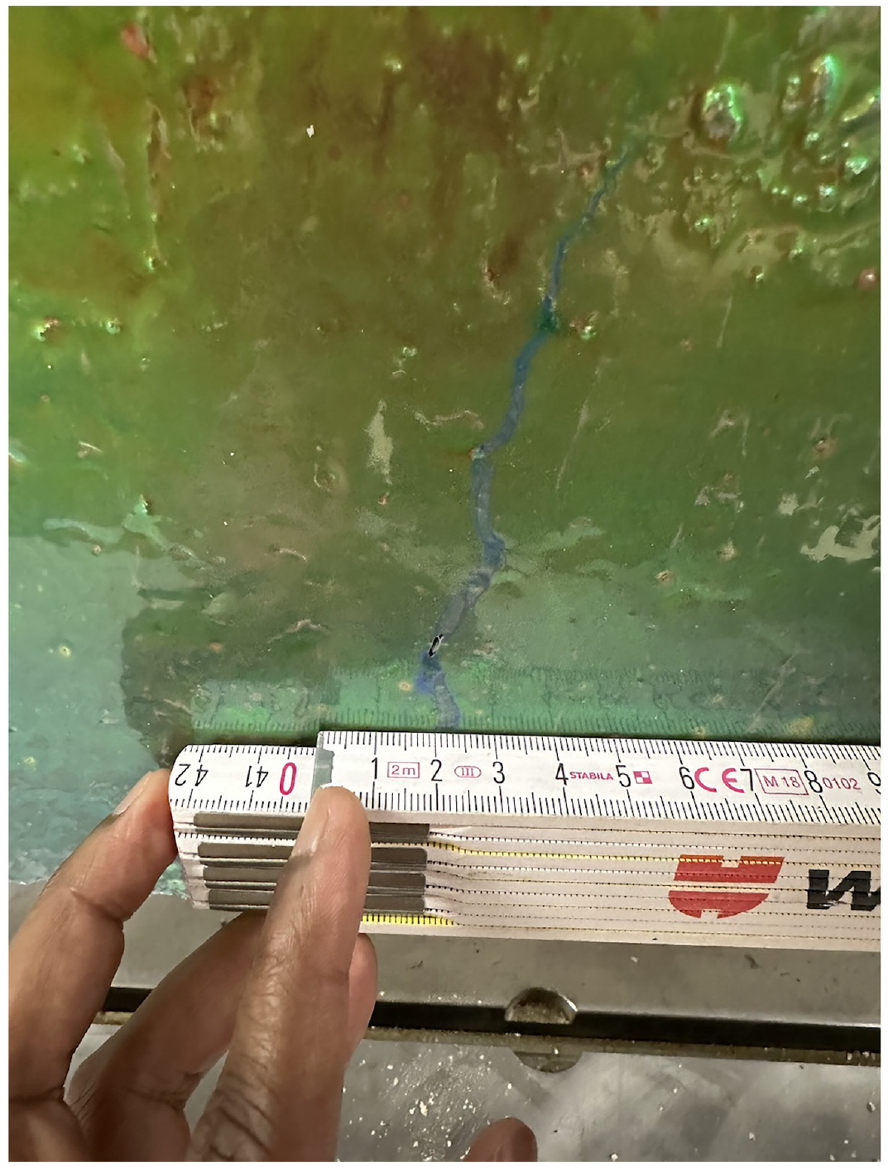
Measured crack width after the experiment in Figure 7. The CLCE coating was able to bridge a crack of ca. 4 mm without tearing. A small crack in the CLCE coating is visible above the ruler while most of the CLCE coating remained untorn.
Conclusions and Outlook
Our laboratory experiments conducted on CLCE coatings applied by painting the precursor onto primed target surfaces in the form of an XPS insulation panel, an aerated concrete brick, and an RC beam, respectively, have collectively demonstrated the substantial potential of CLCE strain monitors in SHM. These experiments have consistently shown that the application of CLCE coatings can significantly enhance the visual detectability of cracks and add measurability of crack growth in various construction materials. The CLCE coating effectively visualizes the development and progression of cracks, as well as their locations, and gradual color changes reveal further crack growth. The second and third experiments, on the aerated concrete brick and the RC beam, validate the effectiveness of paint-applied CLCEs as visually intuitive and easily applicable solutions for early crack detection and monitoring in various construction materials. Already based on color images, the local strain can be estimated, with high-accuracy quantitative assessment being possible when combined with spectrophotometric measurements of the peak reflection wavelength.
CLCEs offer a further powerful feature that we did not study in this paper: because the reflected color is circularly polarized with the same handedness as the cholesteric helix, and because circular polarization is very rare in our environment, a simple comparison of two video feeds obtained through right- and left-handed circular polarizers, respectively, removes any background very effectively, revealing the CLCE with extraordinary contrast even in a visually complex landscape. 32 This means that the CLCE coatings can be very easily detected even if they are prepared with a color that blends in with the regular background. We recently demonstrated 27 that the circular polarization remains during straining with sufficient contrast for this background subtraction to work for more than 100% strain.
Based on these results, we argue that CLCEs have the potential to revolutionize current practices in SHM, leading to more efficient and cost-effective maintenance and repair strategies. While the experiments in this article were all done on flat surfaces, the next step will be to paint the CLCE precursor onto arbitrarily curved surfaces, to allow CLCE-enabled crack detection and monitoring in any structure. Apart from enabling easier and more informative monitoring of the structural health of constructions under mechanical load and/or vibrations, the CLCE coatings may be very interesting for assessing the health of concrete or steel structures used to contain ionizing radiation sources, for example, in nuclear power plants or storage of radioactive waste. Radiation-induced volumetric expansion (RIVE) can severely compromise the structural integrity of such elements,33,34 and a CLCE coating might be valuable in detecting RIVE-initiated microcrack formation at an early stage.
Further research is needed to truly quantify crack width and measure crack growth through analysis of color change, which will require an evaluation of the impact of the thickness and Young’s modulus of the CLCE. This is a critical objective for future research. Moreover, a proper assessment of the variation of perceived color with viewing angle
Supplemental Material
sj-pdf-1-shm-10.1177_14759217241296831 – Supplemental material for Optical crack detection and assessment using cholesteric liquid crystal elastomers
Supplemental material, sj-pdf-1-shm-10.1177_14759217241296831 for Optical crack detection and assessment using cholesteric liquid crystal elastomers by Tarik Čamo, Rijeesh Kizhakidathazhath, Danièle Waldmann-Diederich and Jan PF Lagerwall in Structural Health Monitoring
Footnotes
Declaration of conflicting interests
The author(s) declared no potential conflicts of interest with respect to the research, authorship, and/or publication of this article.
Funding
The author(s) disclosed receipt of the following financial support for the research, authorship, and/or publication of this article: The authors gratefully acknowledge financial support from the European Research Council under the Horizon Europe Framework Programme/ERC Grant Agreement no. 101069416 (Proof of Concept project REVEAL).
Supplemental material
Supplemental material for this article is available online.
References
Supplementary Material
Please find the following supplemental material available below.
For Open Access articles published under a Creative Commons License, all supplemental material carries the same license as the article it is associated with.
For non-Open Access articles published, all supplemental material carries a non-exclusive license, and permission requests for re-use of supplemental material or any part of supplemental material shall be sent directly to the copyright owner as specified in the copyright notice associated with the article.