
Abstract
This article introduces a simple, efficient spectral-based approach for rapid preliminary seismic assessment of earthquake-affected structures. Performance is validated using data from three highly earthquake-affected structures in New Zealand, where visual inspection with subjective outcomes missed damage, resulting in inaccurate and delayed decisions with significant social and economic losses. The three structures considered include (1) the instrumented Bank of New Zealand (BNZ) building; (2) the un-instrumented Queensgate Mall (QM) Complex; and (3) the un-instrumented Canterbury Television (CTV) building. This study uses these cases to highlight the importance of structural health monitoring (SHM) instrumentation and reliable quantified post-earthquake assessment methods in earthquake-prone areas, where each damaging earthquake and subsequent further-damaging aftershocks demand continuous monitoring to continuously assess damage and life safety risk. The simple, low-cost spectral analyses in this study clearly show the existence of damage and deterioration not fully discovered with standard visual inspection methods. This outcome highlights the importance of sensor networks and SHM instrumentation so quantitative, post-event analysis can rapidly augment and target further, more subjective visual inspection results.
Keywords
Introduction
A decade ago, when the Canterbury earthquake series resulted in the tragic collapse of the Canterbury Television (CTV) building in Christchurch, numerous studies employing spectral analysis (Galloway et al., 2014; Goldsworthy, 2012; Kam et al., 2011) were published to show the incredible severity of the 2011 earthquake and highlight the main cause of the structural collapse. The 2023 Turkey earthquake series also caused numerous fatal collapses, and researchers once again used a similar approach (Ozturk et al., 2023). Thus, history shows structural collapses encourage researchers/engineers to use spectral analysis, but it seems there is no clear consensus on how it should be done.
In all cases, the approach uses spectral analyses comparing an earthquake’s elastic measured response spectra with the affected building’s elastic design spectra (Galloway et al., 2014; Goldsworthy, 2012; Kam et al., 2011; Ozturk et al., 2023). This approach ignores the fact structures are designed for ductile seismic performance, which affects structural damage initiation and collapse levels compared to elastic structures. Elastic spectra comparisons ignoring ductility might help show the severity of structural damage/collapse imposed due to very big earthquakes at or above the collapse level. However, it may not be applicable and accurate when earthquakes are in mid-to-severe ranges near design level to show the earthquake-induced structural damage and its accumulation.
There is also another clue showing a lack of awareness by spectral analysis users in assessing damage. The earthquake measured spectra should be compared with the design spectra for which the buildings were designed and constructed. However, they are often compared with the design spectra calculated according to the latest building codes published prior to seismic events (Galloway et al., 2014; Goldsworthy, 2012; Kam et al., 2011). It shows spectral analysis was used to show earthquake severity as the main reason for structural collapses instead of structural damage evaluation and interpretation.
This article develops spectral analysis from its current postcollapse assessment tool into a more useful assessment method for preliminary evaluation of structures, with a particular focus on real-time results immediately after seismic events. The proposed method is validated by case study analysis using three highly earthquake-affected structures in New Zealand, using data from GeoNet and the NZ Earthquake Commission (EQC) (Uma and Beskhyroun, 2019). The results of the case study analysis and review highlight the importance of efficient post-earthquake assessment methods and show the lack of reliability of post-event visual inspections.
From minor to extreme, earthquakes adversely affect structures, deteriorate their seismic performance, and make them vulnerable to future seismic events. Current building codes produce buildings guaranteeing life safety for design-level earthquakes. While code-designed buildings largely prevent loss of lives and injuries during these events, they still experience extensive non-structural and structural damage, adversely affecting safety, serviceability, and future seismic performance, as well as putting them out of service for long periods for repair. In some cases, demolition is the inevitable option when damage is too extensive and costly (ATC et al., 2018).
While extreme earthquakes beyond design level can lead to catastrophic failures and structural collapse, a sequence of earthquakes, even with intensities smaller than design level, can cause cumulative structural damage. This cumulative damage can increase structural vulnerability and eventually lead to structural collapse or demolition due to the severity and irreparability of accrued damage (Jalayer et al., 2011; Kalateh-Ahani and Amiri, 2021; Limongelli et al., 2019). Structural failures and long periods out of service have inevitable negative social and economic consequences with significant impact for earthquake-affected communities which can last years after the event. These adverse influences soar as the post-event recovery time increases (Johnson and Olshansky, 2016; Mitrani-Reiser et al., 2016).
Immediately after severe earthquakes, especially when subsequent aftershocks might strike already-affected regions, rapid structural damage and safety evaluations can play a vital role in mitigating the consequences of seismic events. These post-earthquake evaluations facilitate informed decision-making in response to seismic events (Mitrani-Reiser et al., 2016). Accurate evaluation of damage and future risk from aftershocks, particularly large ones, is thus critical to minimizing the negative impacts. However, this capability lacks precision with currently used methods.
Currently, the most commonly employed rapid post-event evaluation technique is subjective visual inspection by experienced engineers following specific guidelines and procedures (Spencer et al., 2019; Çelebi, 2019). However, such inspections are labor intensive, time-consuming, and costly. Accuracy is highly dependent on inspector skill and experience, as well as the visibility of the damage, all of which can lead to error-prone, inconsistent, and/or subjective evaluation (Kim et al., 2019; Spencer et al., 2019; Wang et al., 2021). Inaccurate evaluations, and time-consuming and delayed visual inspections, mainly due to the shortage of well-trained inspectors, drastically reduce the effectiveness of visual inspections for rapid response. These issues are exacerbated after significant earthquakes, where there is increased risk of destructive aftershocks in the next hours or days (Çelebi, 2019; Galloway et al., 2014; Mitrani-Reiser et al., 2016), and a large demand for a limited number of professionals able to undertake these tasks. The area is thus ripe for change.
The limitations of traditional inspection-based methods and recent advances in computation and sensor technologies have led to modern structural health monitoring (SHM) concepts. Accurate information would enable quantified, risk-based decisions on building re-occupancy, structural repair costs, and estimates for business downtime. Therefore, rapid reliable and quantified post-earthquake evaluations can be invaluable to the affected community from both safety and economic viewpoints (Çelebi, 2019).
Therefore, many earthquake-prone countries have developed sensor networks to monitor strong ground motions and evaluate earthquake characteristics, impacts, and geotechnical hazard information. However, only a few have had initiatives to instrument structures for SHM purposes. New Zealand is one such country, with an efficient, modern ground motion monitoring network, and a small-scale network of instrumented structures, which are all part of the GeoNet project funded by the NZ Earthquake Commission (EQC) (Uma and Beskhyroun, 2019).
In the last decade, despite significant investments in a robust monitoring network, New Zealand has encountered instances where the damage from earthquakes to buildings was significantly under-assessed or entirely missed by both property owners and structural inspectors. Lack of reliable information about the state and integrity of these buildings misled decision makers and caused the loss of many lives and significant cost, both of which carried significant adverse impacts for individuals and society. This article comprehensively studies three cases of these structures, reflecting the potential inaccuracy of standard post-earthquake visual inspections and underscoring the need for a reliable quantified post-earthquake assessment method to complement and verify traditional visual inspections.
More specifically, one building is the CTV building in Christchurch, damaged in the 2010 Canterbury earthquake, and which subsequently collapsed in the February 2011 Christchurch earthquake (Seibel, 2022). The CTV building was not monitored, but seismic assessment was feasible to evaluate the potential impacts on the building using ground motion sensor data from nearby locations. The second building is the former Bank of New Zealand (BNZ) building in Wellington, which was well instrumented. The BNZ building sustained extensive structural damage due to earthquakes between 2013 and 2016. The severity of the structural damage accumulated during these years led to its eventual demolition (Rabiepour et al., 2021). The third building is the Queensgate Mall (QM) complex located in Lower Hutt, damaged significantly due to the 2016 Kaikoura earthquake. The QM complex was not instrumented, but seismic assessment was still feasible using the nearby ground motion sensor records.
To address this issue, the article proposes a spectral-based assessment method. This method is subsequently applied to the three earthquake-affected structures previously mentioned. The assessment results are then compared with the visual inspection reports issued for these structures. The outcome of the analysis and review show the crucial potential role of efficient SHM technology, methods, and systems, and highlights the lack of reliability of post-event visual inspections. The article is structured by introducing the spectral-based post-earthquake assessment method and then presenting the three case studies and their analysis, followed by a discussion of the implications and further conclusions drawn. It ends with a summary of recommendations and overall conclusions.
Methods
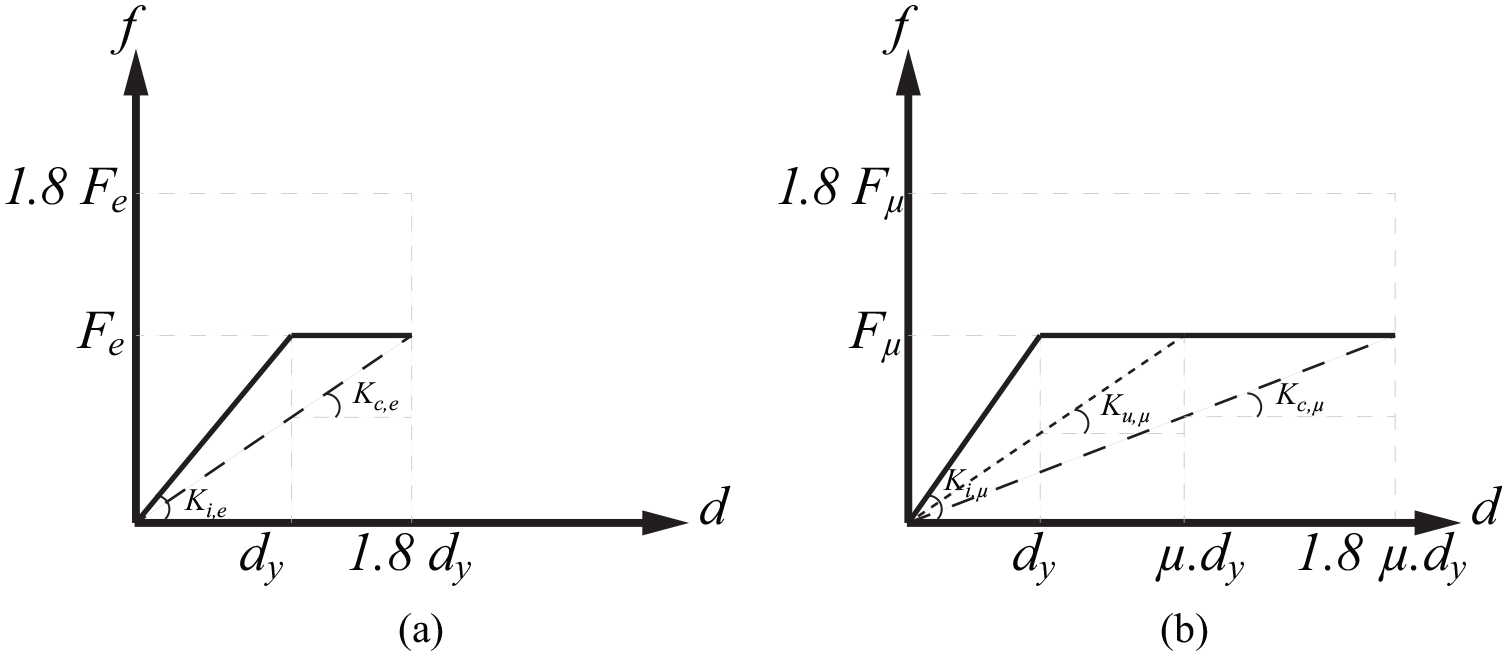
For decades, spectrum-based approaches have been an accepted method to obtain earthquake demands and design low-rise and mid-rise structures for lateral earthquake actions. Although most structures can generally sustain earthquake demands greater than the spectral design levels due to uncertainties in assumed seismic weights, overstrength design and damping values, the spectral level the building is designed for can be considered as a key threshold defining structural damage initiation and its further propagation. According to studies and seismic assessment guidelines, the seismic demand associated with structural collapse is approximately 1.8 times the spectral design level (Figure 1a) (Elwood, 2013; MacRae, 2012). In this section, a simple approach using these key points of spectral analysis is proposed to instantly and automatically assess health/damage status of structures after seismic events.
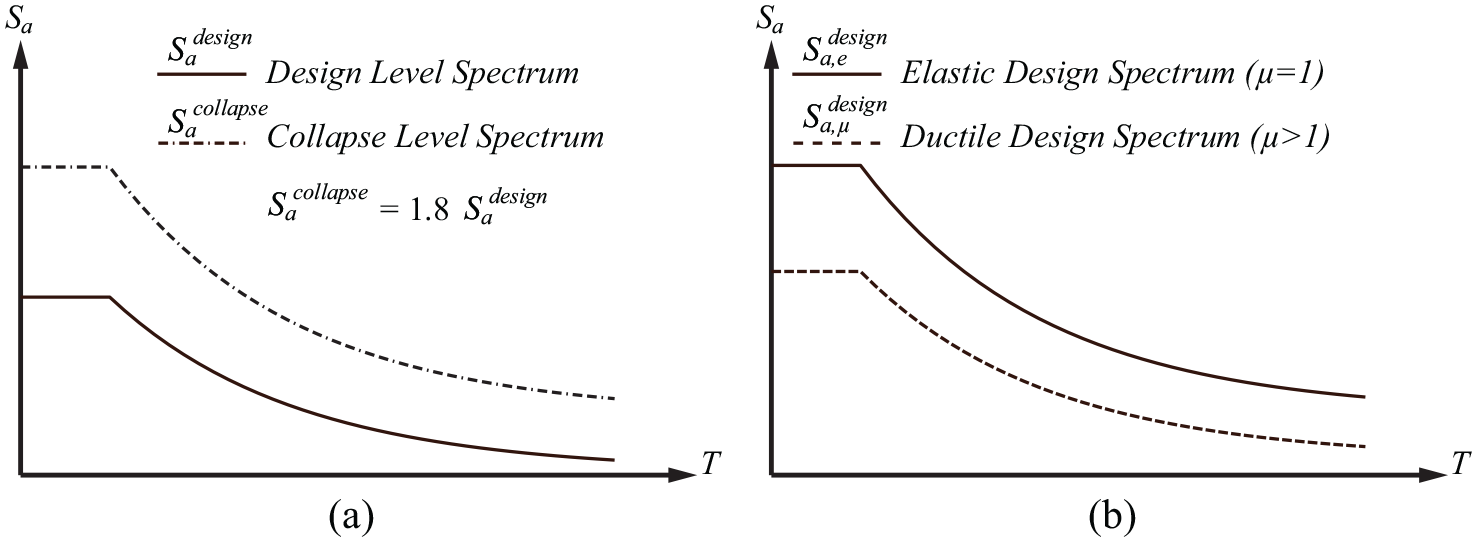
Figures schematically compare: (a) design and collapse levels defined by acceleration spectra and (b) spectra for elastic and ductile design of structures.
Figure 1b shows ductile structures are designed for lower actions compared to structures expected to remain elastic under the design earthquake level. More ductility enables structural systems to sustain large deformations before structural collapse, increasing their ability to dissipate earthquake energy after structural damage initiation. As a result, ductile designs generally lead to lighter and less-stiff structural systems compared to elastic designs.
To simplify the analysis, elastic-perfectly plastic behavior is assumed for assessed structures after structural damage initiation beyond the yielding deformation,


where

Figure 2 indicates ductile design leads to less-stiff (
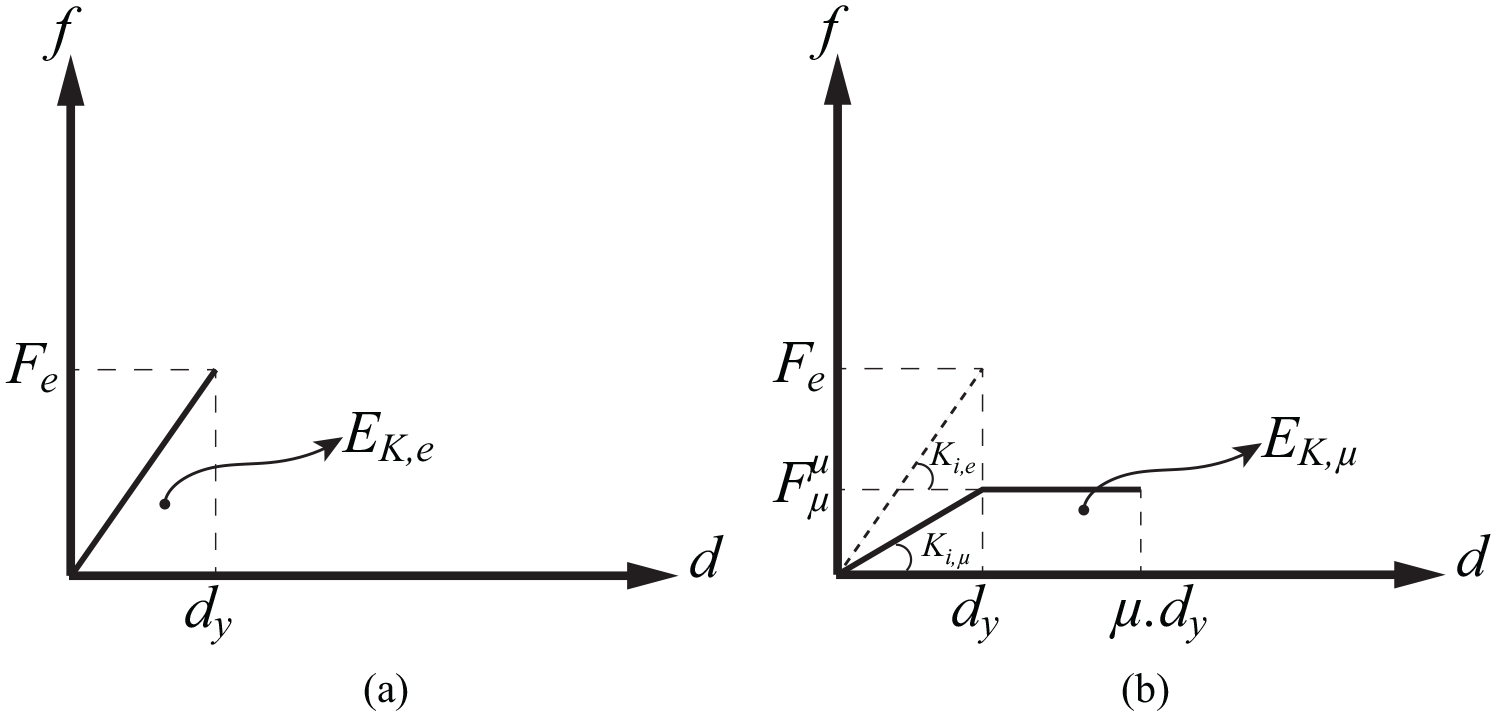
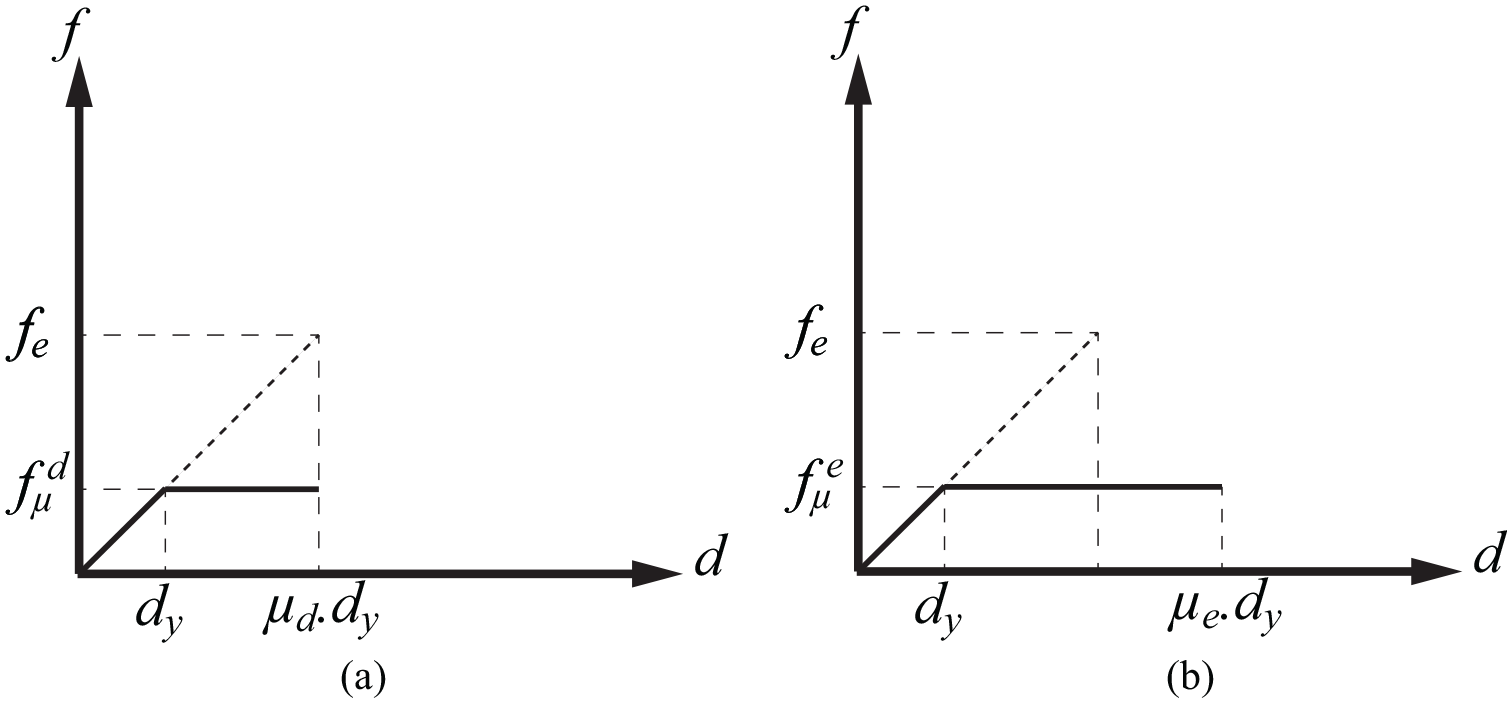
Figures schematically show force–deformation curves for structural systems exhibiting: (a) elastic behavior and (b) elastic-perfectly plastic behavior.
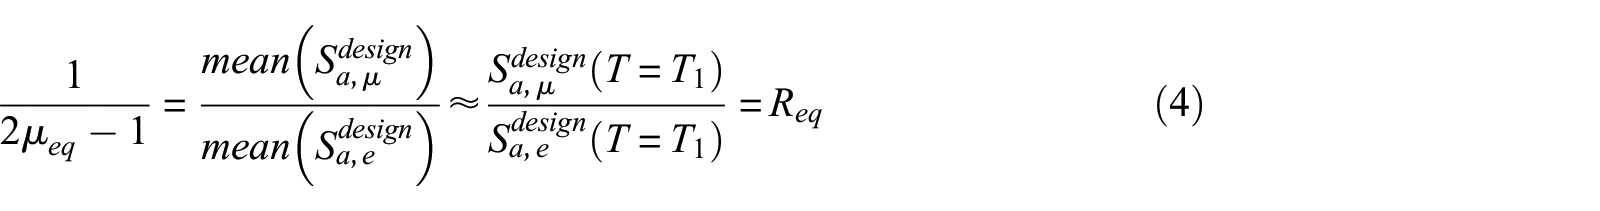
For structures designed using the building code’s ductile spectra (Figure 1b), the ductility factor of the equivalent elastic-perfectly plastic structure,

where,
This equivalent ductility factor,
To obtain earthquake demands on a structure, response spectra are obtained for both horizontal components of the earthquake recorded at the closet measuring station/accelerometer to the assessed structure. It should be noted, the response spectra are derived from the responses of a linear/elastic single degree of freedom (SDOF) structure and thus should not be directly compared with ductile design spectra defined by building codes. Therefore, measured response spectra should be scaled down to be comparable with the ductile design spectra, as shown in Figure 3.
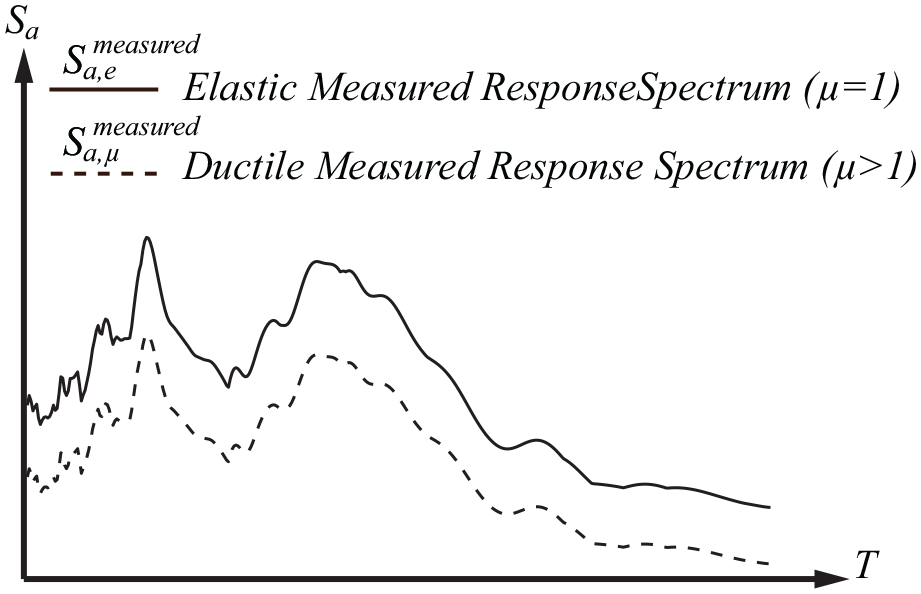
Compares schematically the measured response spectra for elastic and ductile structures.
Inelastic strength demands can be estimated from elastic strength demands using strength reduction factors (Miranda and Bertero, 1994),

where

where

This article defines two boundaries for the strength reduction factor,

Figures schematically compare force-deformation curves for elastic-perfectly plastic structural systems with the same: (a) deformation demand; (b) energy absorption capacities of the elastic structural system.
For the lower conservative limit, an important assumption is made about the energy absorption capacity. It is assumed to be identical for both elastic and inelastic structures, as illustrated in Figure 4b. This leads to the lowest values for the strength reduction factor. Consequently, it results in the highest possible strength demands and measured spectral responses for the inelastic structure:

The small strength demands from Equation 9 result in risk-taking high seismic ratings while the conservative large strength demands from Equation 10 result in conservative low seismic scores for the assessed earthquake-affected structures using the method proposed in this article. Adopting a conservative

Figure 5 compares the strength reduction factor,

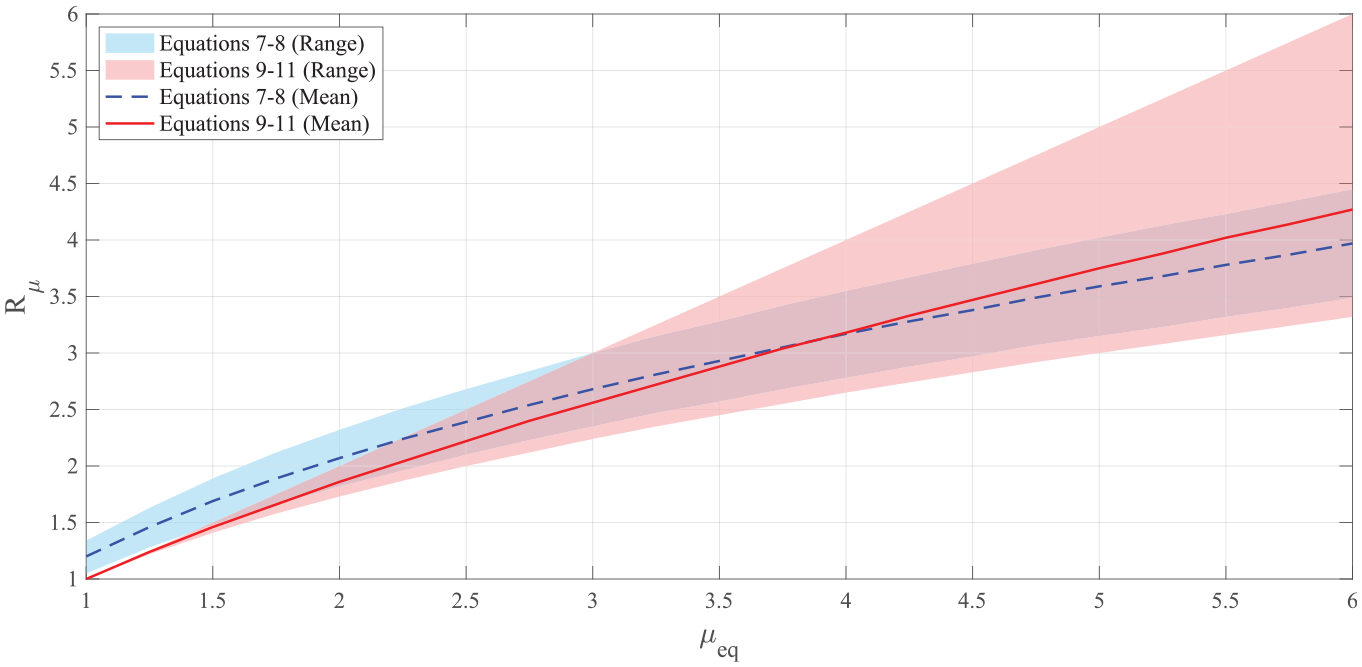
Comparison of strength reduction factor changes for structures with ductility factors varying between 1 and 6.
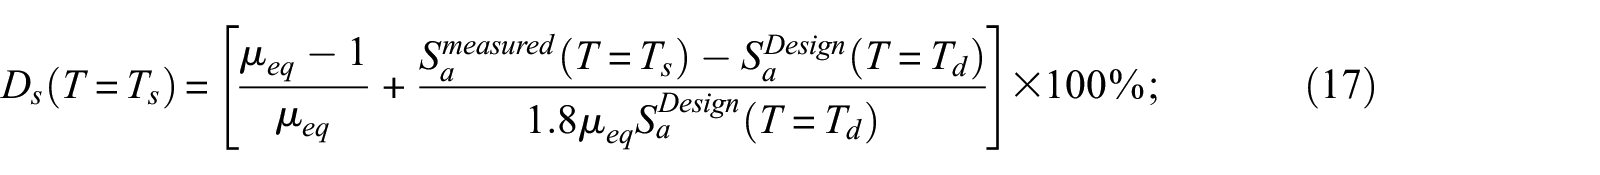
After each seismic event, the
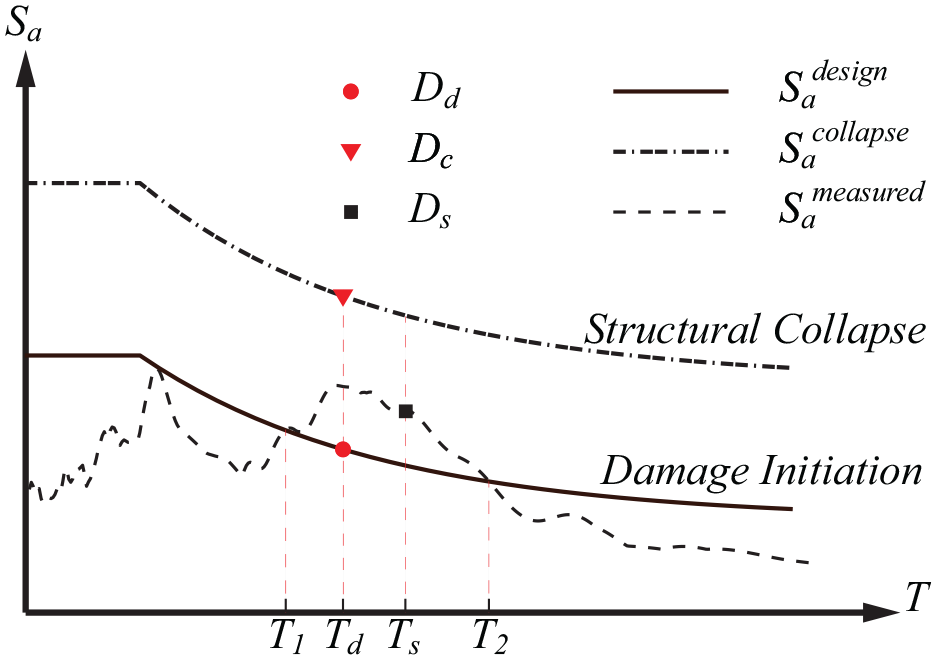
Shows schematically the damage assessment approach using spectral analysis.
Stiffness reduction is the most common structural damage caused by earthquake, negatively affecting seismic performance of earthquake-affected structures. Figure 7 compares equivalent/secant stiffness reduction at two key levels of ultimate limit state design (ULS) and collapse for elastic and elasto-perfectly plastic structures. In Figure 6, the terms of
Figures schematically show the initial stiffness values and their changes up to the point of structural collapse for (a) elastically designed structures
For elastic structures, exactly at design spectral level:

However, for ductile structures at the same level:

At the collapse spectral level for elastic structures, these values are defined:

Similarly, ductile structures yield:

To obtain the stiffness reduction imposed to a structure with period of
where
Case studies on three earthquake-affected structures
BNZ building
BNZ building seismic damage history
The BNZ building opened in 2009 in Center Port, Wellington (Figure 8a). The building had a modern structure and won the 2009 Wellington architecture awards. It was a six-story building with reinforced-concrete structure, excluding the roof structure, which was framed with steel and lightweight roofing. The BNZ building was divided into three separate units linked together using pedestrian bridges across two atria. Each of these units is designed as an individual self-bracing and self-supporting structure (Chandramohan et al., 2017; Thomson and Bradley, 2014; Uma et al., 2010). However, Units 2 and 3 were horizontally connected through a floor diaphragm at Level 1, according to the limited structural details available in the BNZ building seismic instrumentation report by GNS Science (Uma et al., 2010).
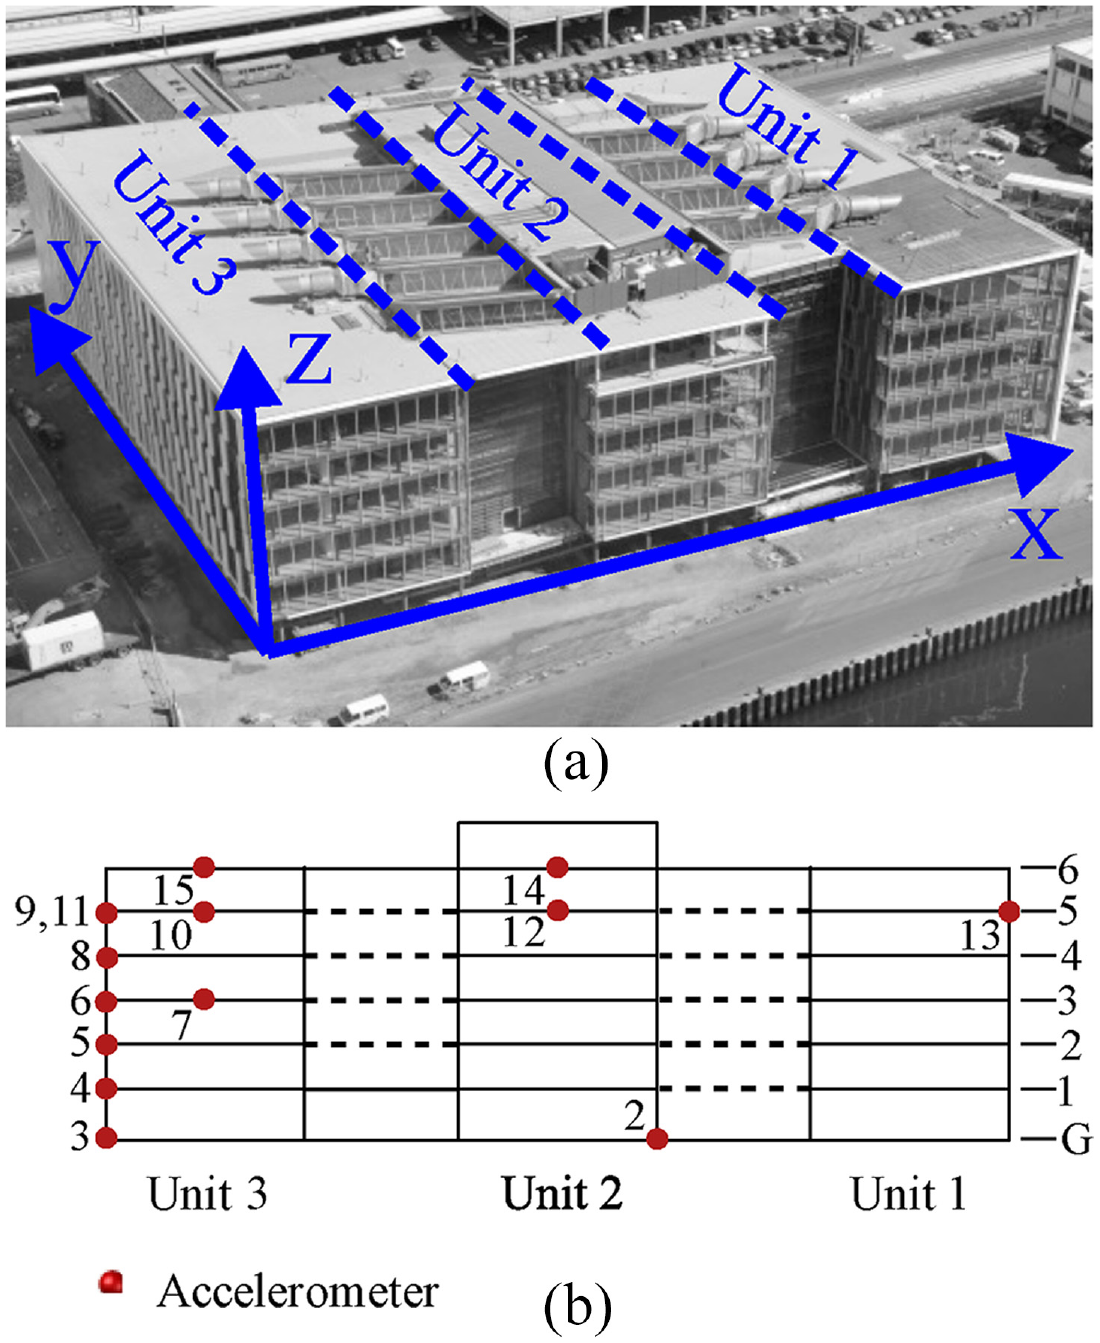
(a) The BNZ Building’s aerial view showing its units and the main coordinates of instrumentation and (b) the locations of the installed accelerometers in the BNZ building units (Uma et al., 2010).
The BNZ building was instrumented as a part of GeoNet monitoring program funded by Earthquake Commission (EQC) in 2010, under which several structures were instrumented to monitor seismic response (Uma et al., 2010). A set of 15 tri-axial accelerometers instrument the BNZ building, including a deep borehole sensor (Sensor 1) and 14 sensors mounted at various levels (Uma et al., 2010). Figure 8b schematically depicts the locations of the installed accelerometers. As can be seen, Unit 3 was effectively instrumented, whereas the other units did not receive sufficient instrumentation for complete or effective SHM.
The performance of the BNZ building was severely affected by three damaging earthquakes between 2013 and 2016. The details of these earthquakes are listed in Table 1.
Details of the earthquakes affecting the BNZ building during 2013–2016 period
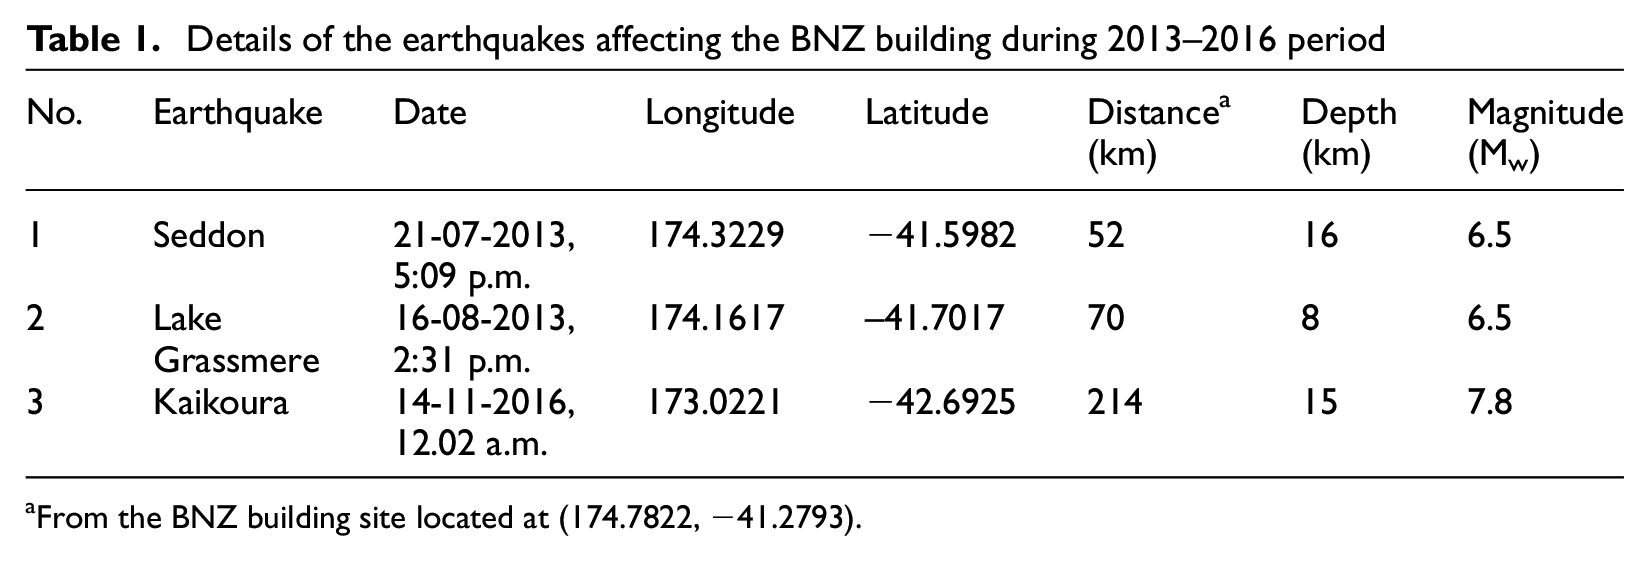
From the BNZ building site located at (174.7822, −41.2793).
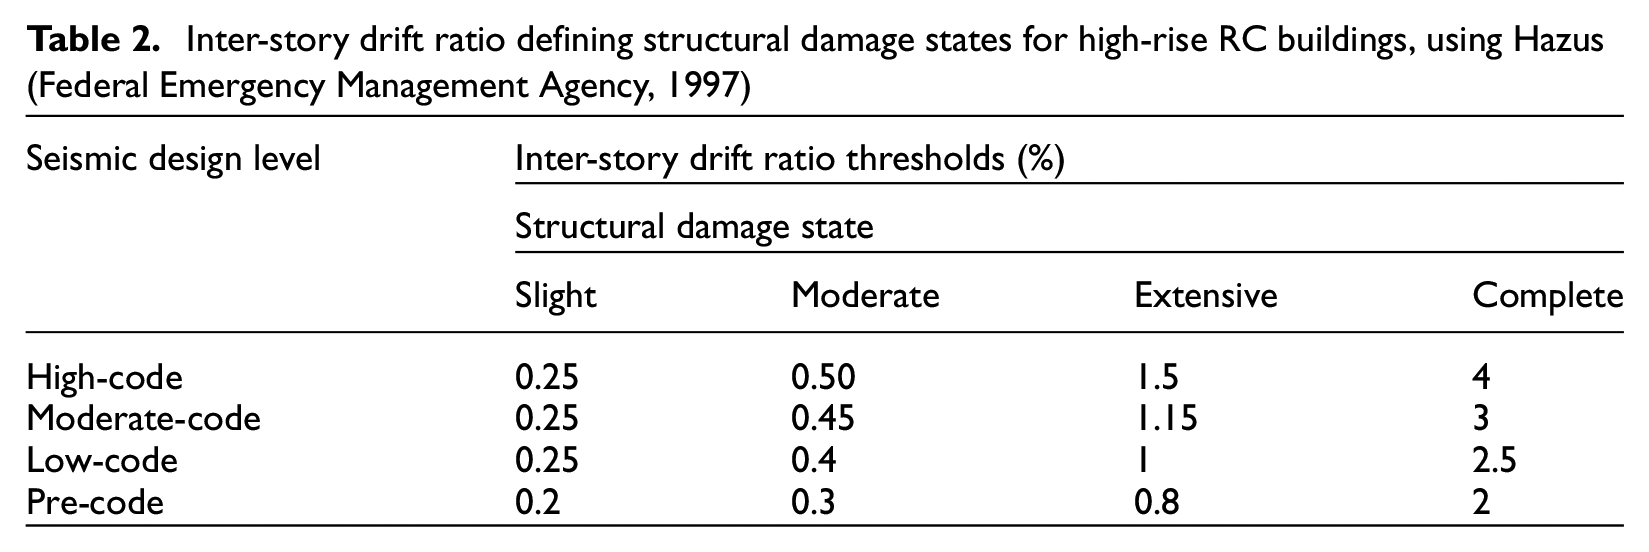
Inter-story drift ratio defining structural damage states for high-rise RC buildings, using Hazus (Federal Emergency Management Agency, 1997)
On 21 July 2013, the 6.5-magnitude Seddon earthquake struck the building and caused its closure for repair (Stuff, 2013). Although only some non-structural damage in top floors due to this earthquake was reported, and the building was scheduled to reopen after about 6 to 8 weeks (Stuff, 2013), the building was closed for approximately 15 months and repair costs exceeded NZ$10M (SCHOUTEN, 2014). Figure 9 shows how the large deformation due to the 2013 Seddon earthquake caused extensive damage to the suspended ceilings and fire sprinkler pipes and systems, which resulted in flooding in the top floors (Dhakal et al., 2016; SCHOUTEN, 2014).
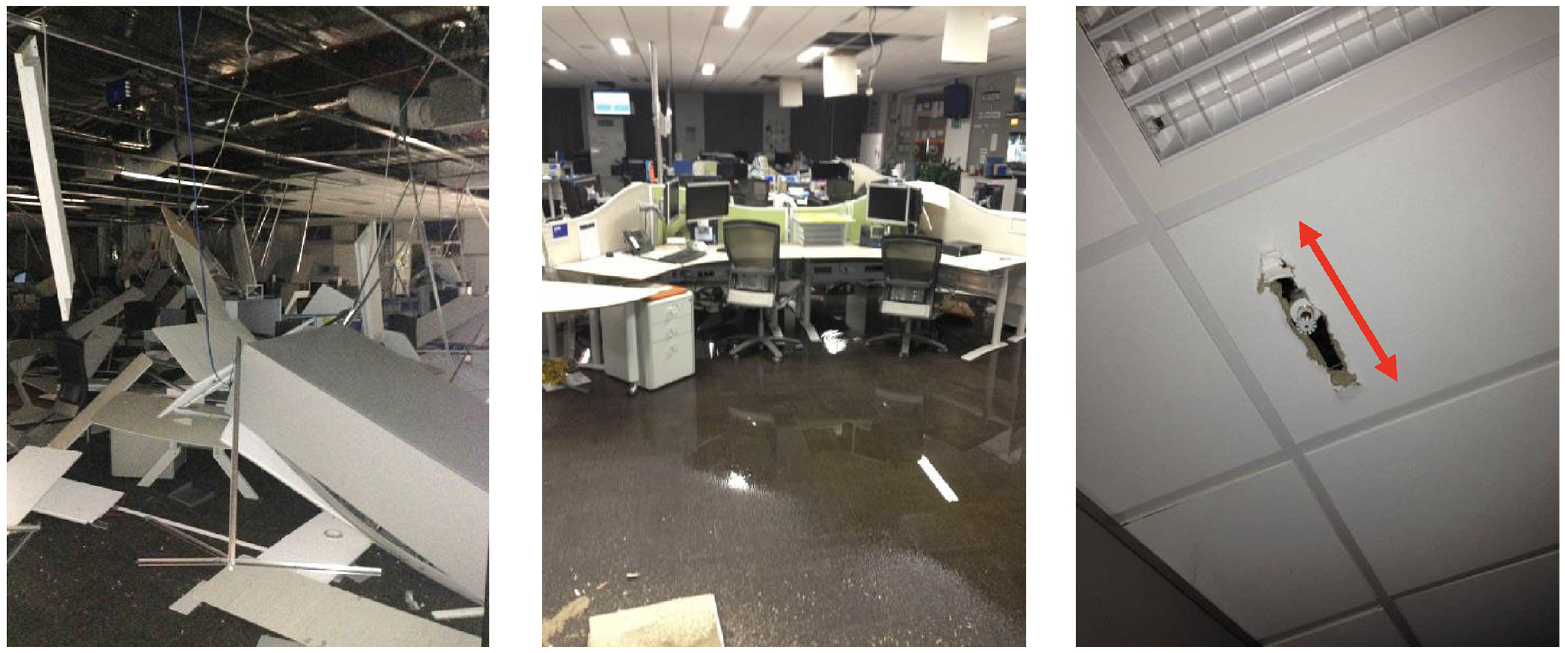
Damage in the BNZ building due to the 2013 Seddon earthquake (Dhakal et al., 2016).
Four weeks after the Seddon earthquake, during the closure period, the 6.5-magnitude Lake Grassmere earthquake shook the building on 16 August 2013. It was reported this event caused no further damage in the BNZ building (Vaughan, 2014). Fortunately, the Seddon earthquake occurred on Sunday, and the Lake Grassmere earthquake occurred during the building repair closure time, both when the building was unoccupied, and thus there was no human injury despite the severe non-structural damage, in particular the considerable fall of ceilings, shown in Figure 9 (Chandramohan et al., 2017).
Approximately 2 years after building reoccupation, the 7.8-magnitude Kaikoura earthquake hit the BNZ building on 14 November 2016. Due to this earthquake, the BNZ building sustained severe non-structural and structural damage, including spalled concrete columns and cracks in beams and floor slabs at column joints, ceiling panel fall, and broken glass façades (Chandramohan et al., 2017; Rutherford and George, 2016), as shown in Figure 10. The building was then vacant due to the severity of damage until 2018, when a demolition decision was made (Rutherford, 2018). The demolition process and removal of the bulk of the BNZ building were completed in 2020, as shown in Figure 11 (Chandramohan et al., 2017). From Figure 12, taken during the BNZ building demolition, structural cracks can be clearly seen in an uncovered exterior column, revealing the severe structural damage accumulated in the BNZ building due to the three earthquakes, which only finally appeared after the 2016 Kaikoura event. Fortunately, the 2016 Kaikoura earthquake struck the BNZ building at midnight, so there was no human injury or fatality (Chandramohan et al., 2017).
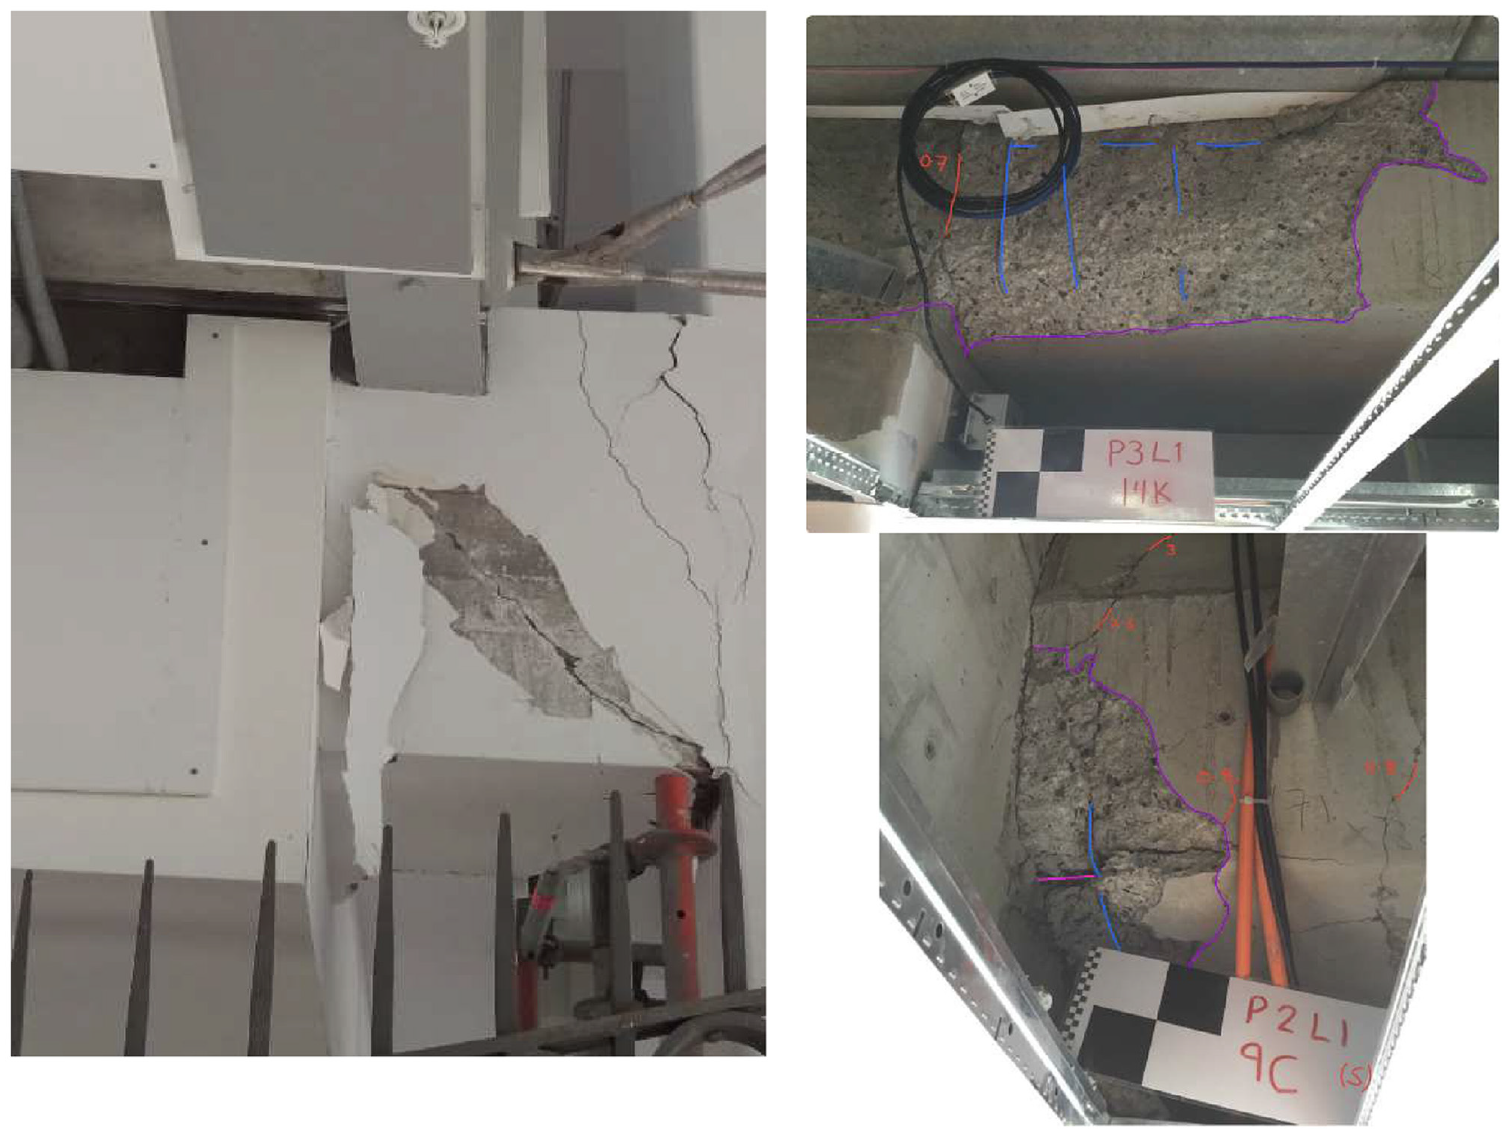
Structural damage of beams in the BNZ building due to the 2016 Kaikoura earthquake (Siddiqui et al., 2019).
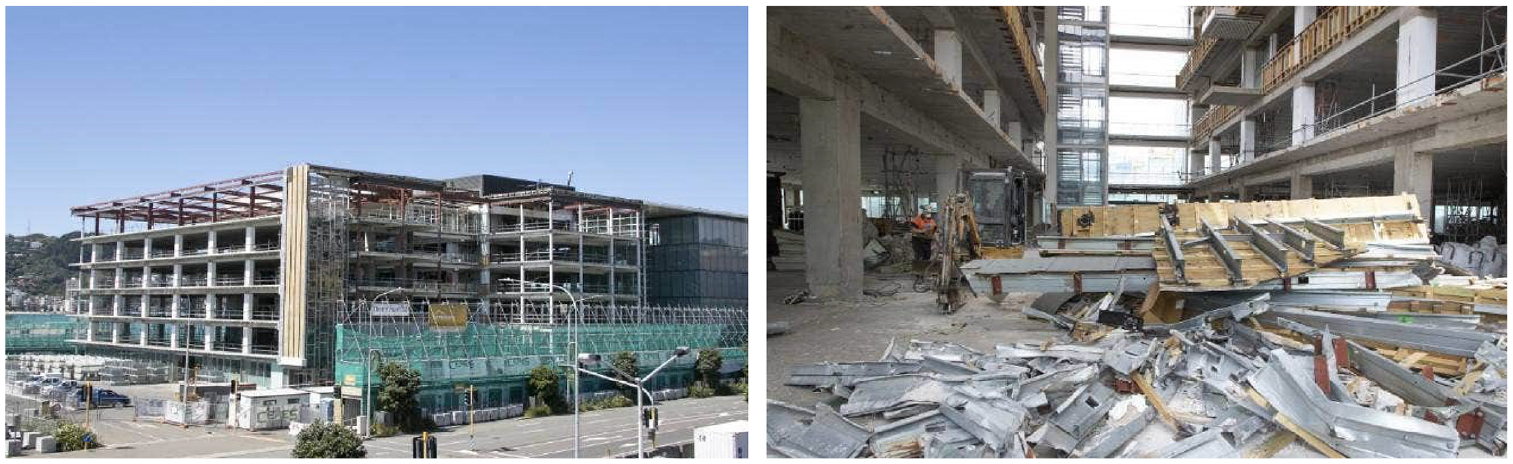
The BNZ building deconstruction (Stuff, 2019).
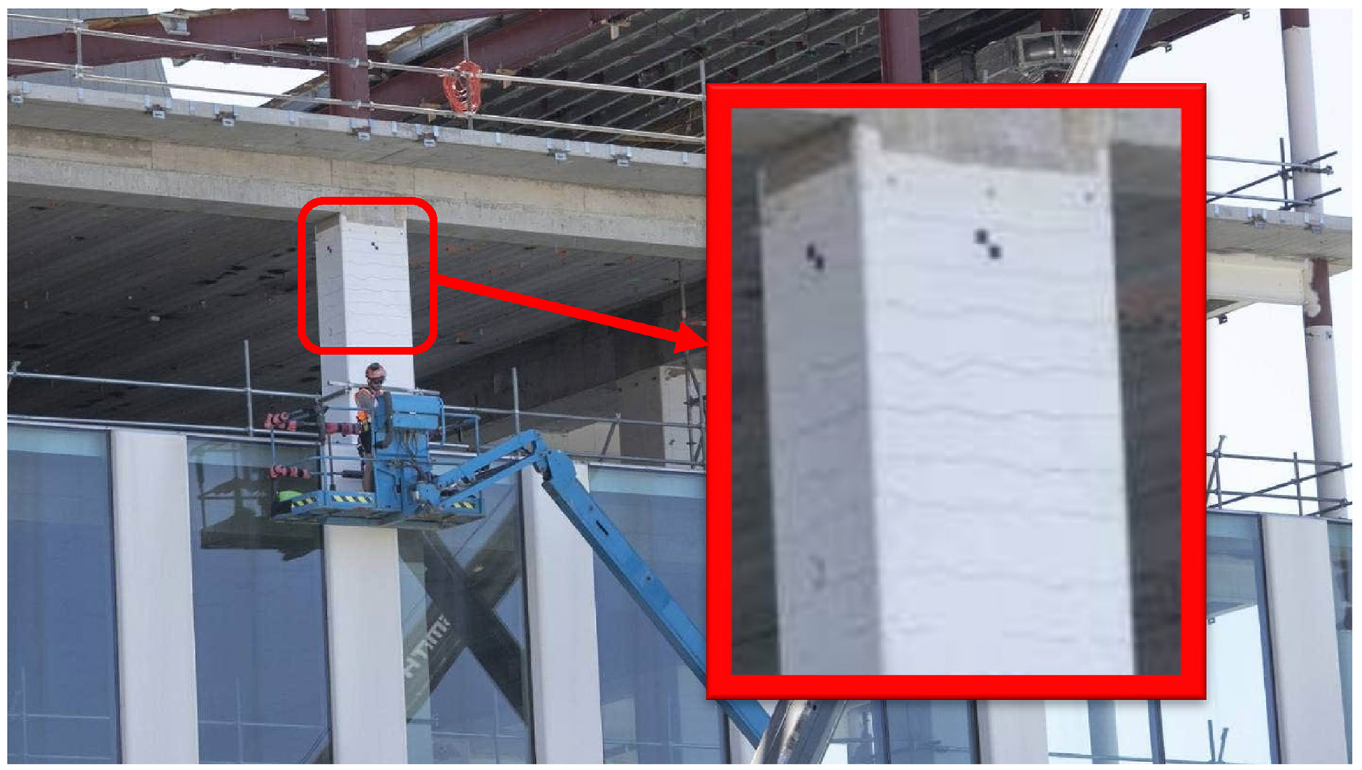
Cracks across an exterior column during the BNZ building demolition, showing the severity of structural damage after the third earthquake (Stuff, 2019).
Spectral assessment BNZ building
The proposed spectral assessment method is applied to the BNZ building. Figure 13 compares the inelastic measured response spectra for horizontal components of the earthquakes at the BNZ building site with the ductile design and collapse spectra obtained according to (NZS 1170.5: 2004) for which the building was designed.
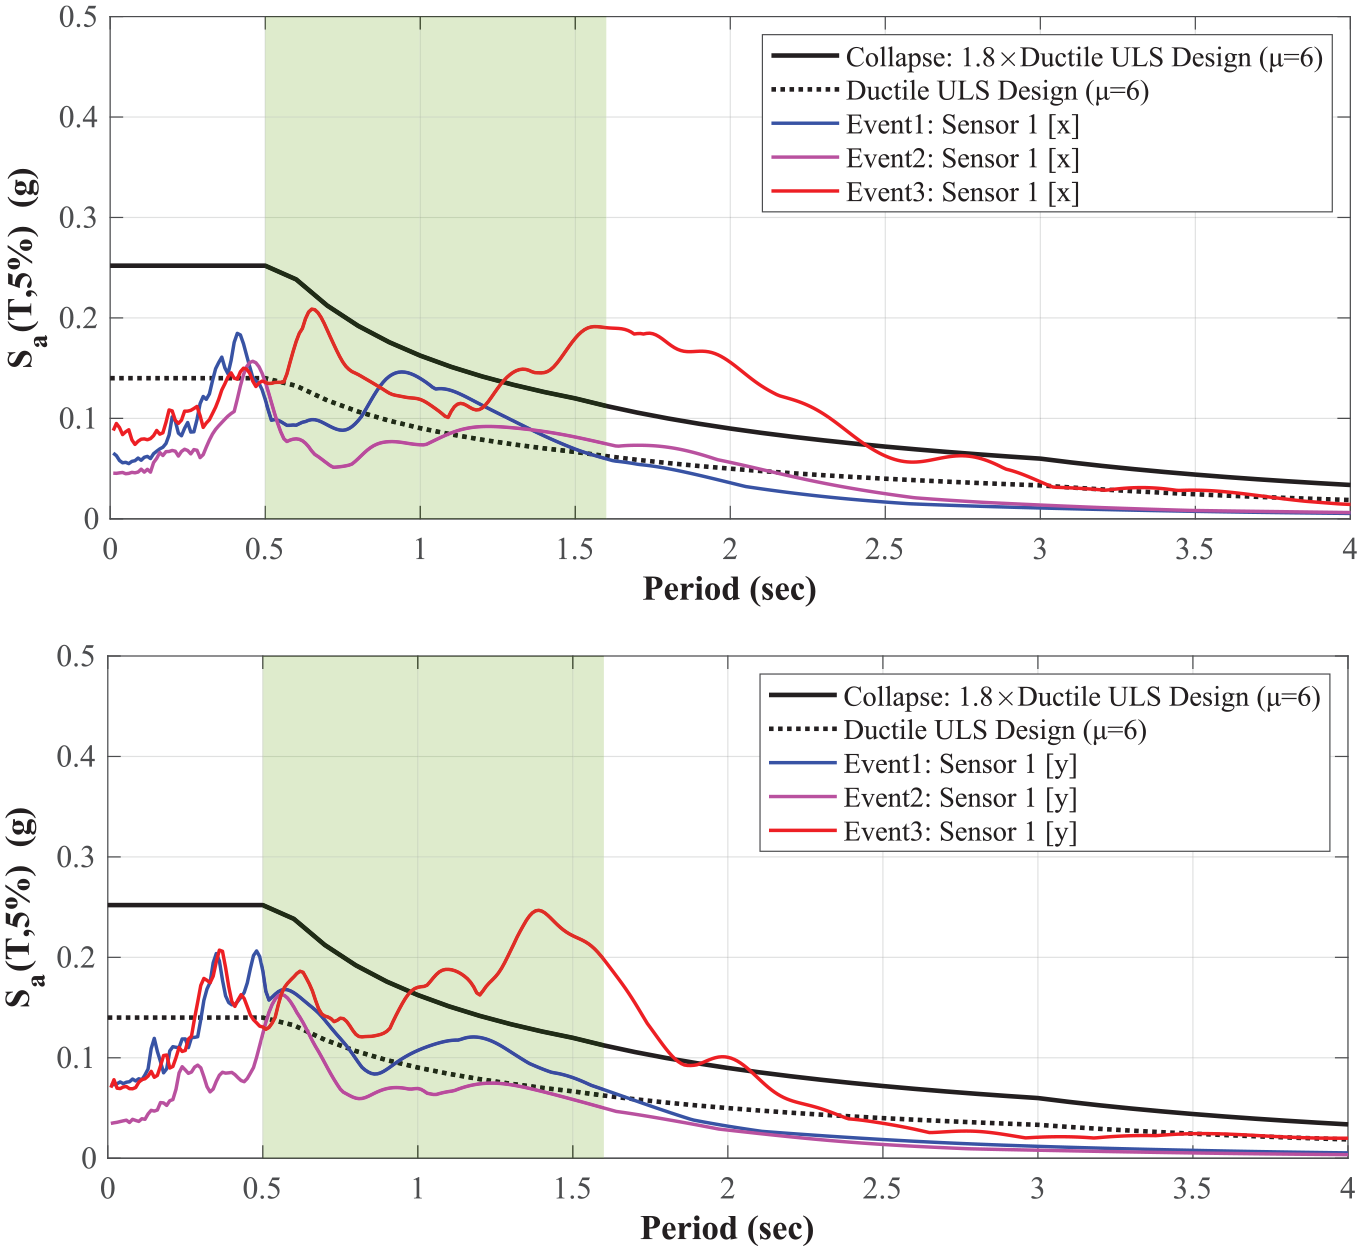
A 5% damped ductile spectra for horizontal acceleration responses recorded by Sensor 1 during the three seismic events affecting the BNZ building along x and y directions, which are compared to the ductile design and collapse spectra according to NZS 1170.5:2004 (Importance level: 2; Site subsoil class: D; Ductility factor: 6 (Siddiqui et al., 2019).
Figure 13 shows the measured spectra due to Event 1 exceeded in all period ranges between 0.7 and 1.5 s for both s and y directions. The green shaded area in the figure shows the building’s possible period,
From elastic and ductile design spectra for the BNZ building, the values of
In the proposed spectral assessment method, it is assumed the strength degradation does not happen until the collapse state. Therefore, structural damage due to Event 1 only increases the vibration period of the structure and potentially decreases the effective/remaining ductility or energy absorption capacity of the earthquake-damaged structure. These uncertainties make spectral assessment difficult and less accurate for Event 2. However, some levels of structural damage is expected for periods bigger that ∼1.2 s, expected for the building already damaged under Event 1. Furthermore, greater Event 2 demands along the x direction could cause greater structural damage with respect to the y direction, as confirmed by Rabiepour et al. (2022).
Figure 13 shows the high demands imposed by Event 3 could potentially cause structural collapse in the BNZ building. There are a few reasons why the BNZ building did not collapse during the 2016 Kaikoura earthquake. First, overstrength design of the building. Second, uncertainty in the permanent and imposed actions for which the building was designed. In particular, all three damaging earthquakes struck the building after working hours which could reduce the seismic loads to some extent. The last but not the least, the building might be designed for vibration periods less than 0.7 s resulting in higher design and collapse capacities. Given the efficient instrumentation in Unit 3 of the BNZ building (Figure 8), maximum inter-story drift ratio (IDR) values for Unit 3 stories are presented in Figure 14.
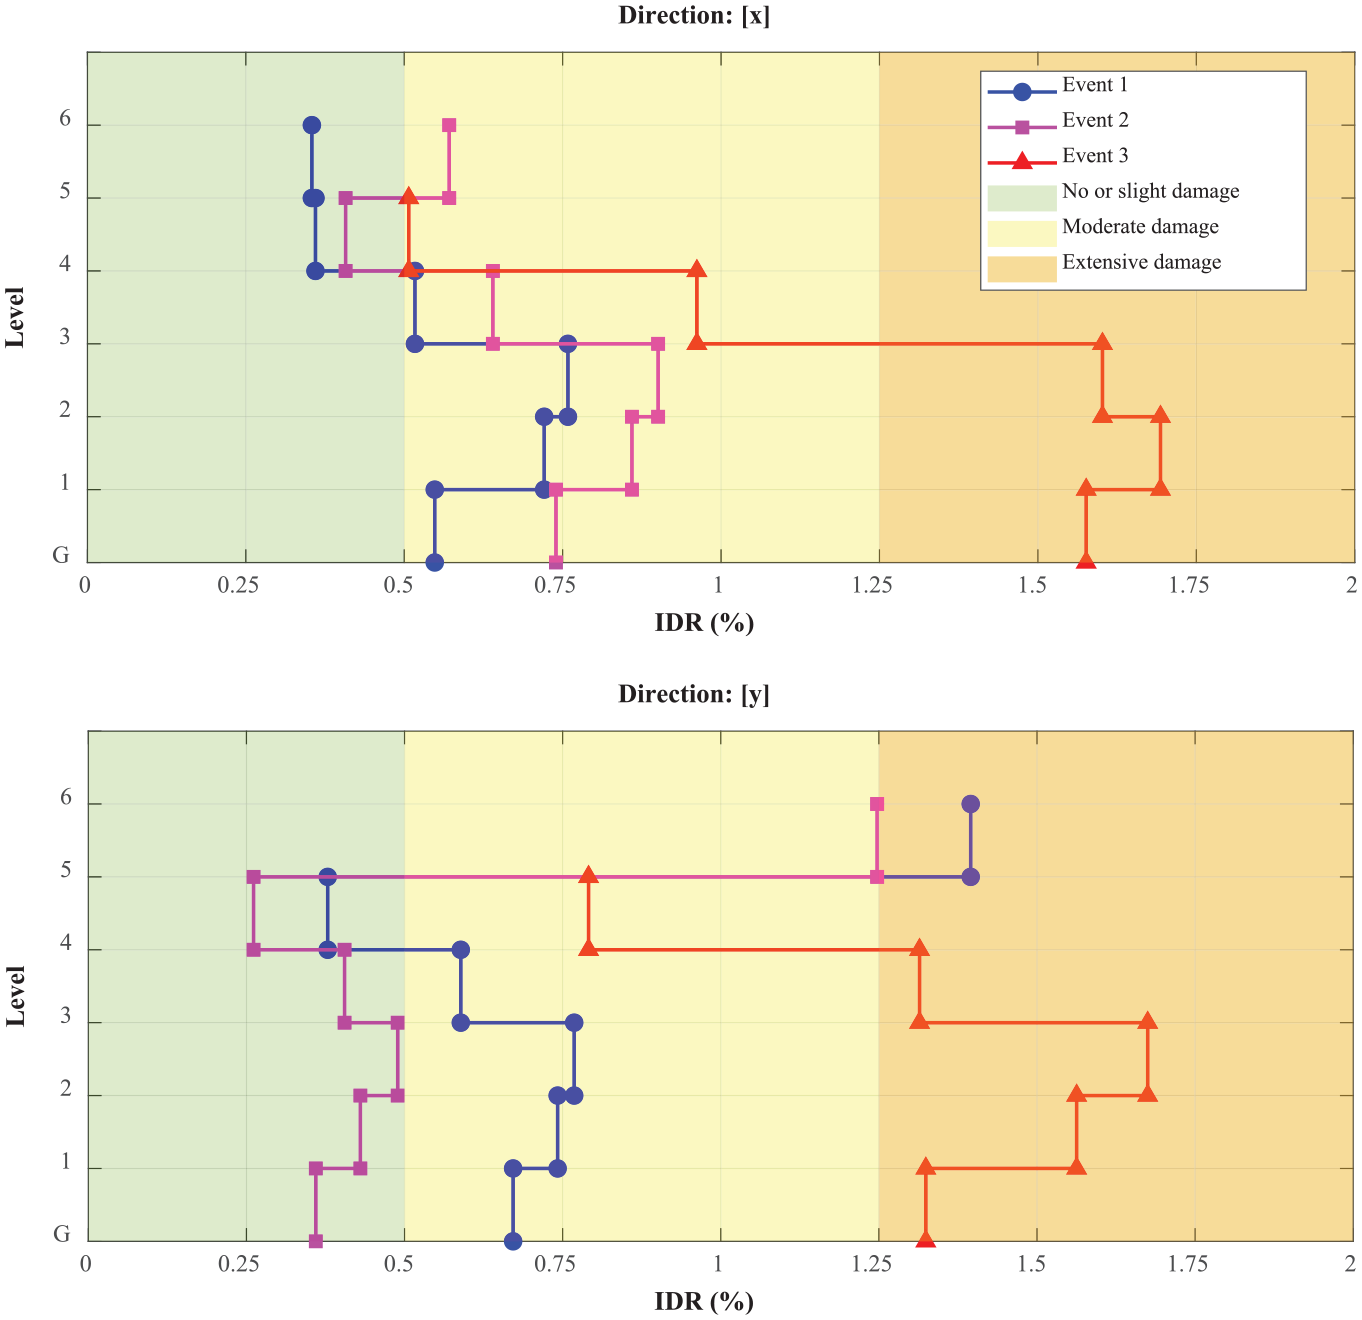
IDR for Unit 3 of the BNZ building across the three events along x and y directions.
Table 2 lists the IDR values defining structural damage state thresholds for RC buildings with different seismic design levels (Federal Emergency Management Agency, 1997). Although the BNZ building was designed based on modern seismic standards, using hollow-core flooring systems made it significantly susceptible to earthquake-induced structural damage expecting even at 0.25% IDR values. Therefore, IDR percentages of 0.5 and 1.25, values between moderate and high codes, are chosen to determine moderate and extensive structural damage states in this article. These regions are shaded in yellow and orange in Figure 14. The green shaded region in this figure shows states with no or slight (expected) structural damage.
The IDR analysis results (Figure 14) reveal the first event would impose moderate structural damage on the building, while post-event inspections reported only minor non-structural damage (Stuff, 2013). However, the measured IDR value shows extensive structural damage for the top story in direction y, which is consistent with the reports regarding the severity of the damage and flood in top floors (Dhakal et al., 2016; SCHOUTEN, 2014). The 2013 Lake Grassmere earthquake was less severe than the first earthquake. The IDR analysis results in direction y (Figure 14) show no or slight structural damage, apart from the top story, as could be expected for the building due to the second event. However, in the x-direction, measured IDR values show the second event likely caused moderate structural damage.
Comparing the IDR values of the first and second events in the x-direction (Figure 14) yields a very interesting conclusion. Measured IDR values due to the second earthquake are much higher than the first earthquake across all stories. This outcome indicates that a less-severe earthquake could cause greater deformation in a degraded building which had lost a significant amount of its lateral stiffness due to a previous event. Therefore, despite reports (Stuff, 2013), the authors expect the BNZ building suffered from significant, undetected or unreported, additional structural damage due to the 2013 Seddon earthquake.
Spectral analysis results (Figure 13) show the third event, the 2016 Kaikoura earthquake, was much more destructive to the BNZ building. Measured IDR results (Figure 14) confirm this outcome and show most building stories experienced extensive structural damage in both directions, which would need more than 50% of total construction costs to be repaired (Wilson et al., 1985). It should be mentioned, a hollow-core flooring system was used in the BNZ building (Siddiqui et al., 2019) which is a design susceptible to earthquakes and studies show structural damage is expected to this kind of flooring systems when the IDR values exceeds 0.25% (Buker et al., 2022).
BNZ building implications
The sensor instrumentation system installed in the BNZ building enables a more accurate and informative post-earthquake assessment and advanced reliable SHM methods. As carried out here, a directly measured IDR analysis can be employed to quantitatively assess building performance after seismic events, which is faster and more reliable than the routine post-event visual inspections, particularly for large and complex structures like the BNZ. Furthermore, the hysteresis loop analysis (HLA) SHM method has been effectively used to evaluate structural damage in the BNZ building (Rabiepour et al., 2021, 2022, 2023), corroborating the IDR and spectral analysis findings in this study.
QM complex
QM complex seismic damage history
The Queensgate Mall (QG) complex redevelopment and expansion began in 2002. Located in Lower Hutt, New Zealand, the QM consists of several structures with heights between ∼8 m and ∼20 m. A variety of lateral load resisting system, including steel braced and RC shear wall systems were used in construction. Figure 15 shows different zones in the QM complex plan. All information for the QM complex is available for free through the open online archive of Hutt City Council (HCC, n.d.).
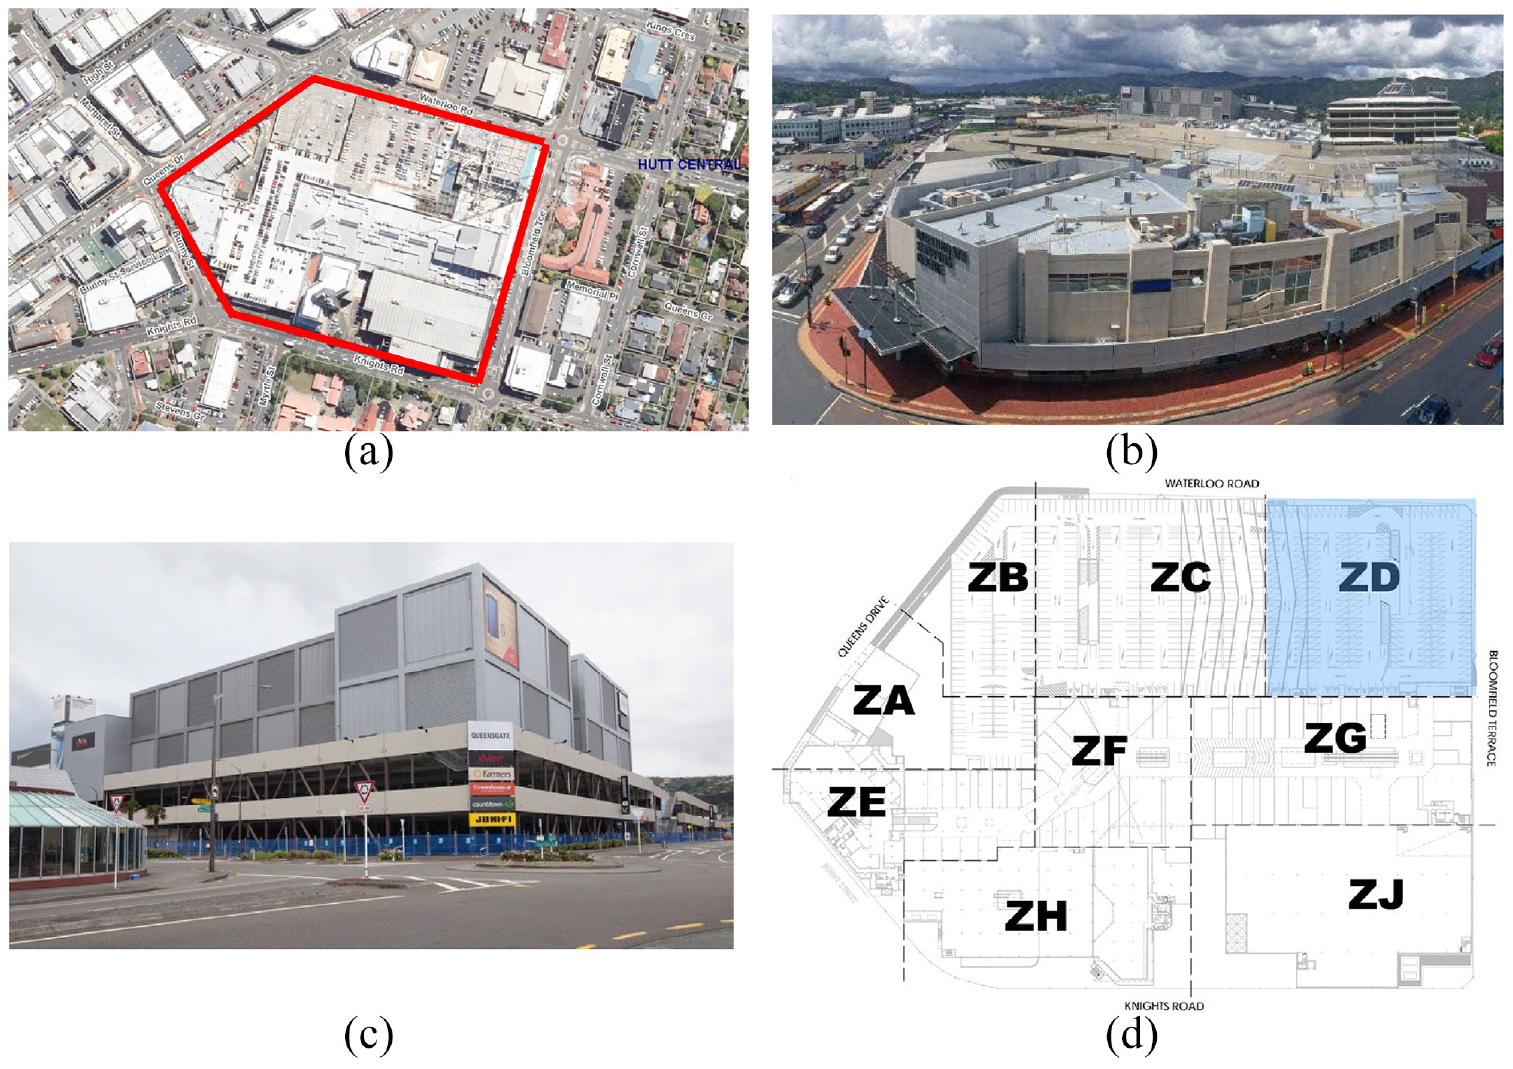
Figure shows: (a) Aerial view of QM complex; (b) South-West view of QM complex (Winter, 2018); (c) North-East view of QM (Nightingale, 2016); (d) construction zones of QM (Westfield (New Zealand) Limited, 2002).
The QM building was struck by the same three earthquakes as the BNZ building from 2013 to 2016 (Table 3). Since the QM building was not instrumented, the ground acceleration measured at the Lower Hutt Emergency Management Office (LHES) station is used to quantify the ground shaking impacts on the QM building. The LHES station was the closest station to the QM buildings, located 400 m away.
Details of the earthquakes affecting the QM building during 2013–2016 period

From the QM building site located at (174. 9069, −41.2097).
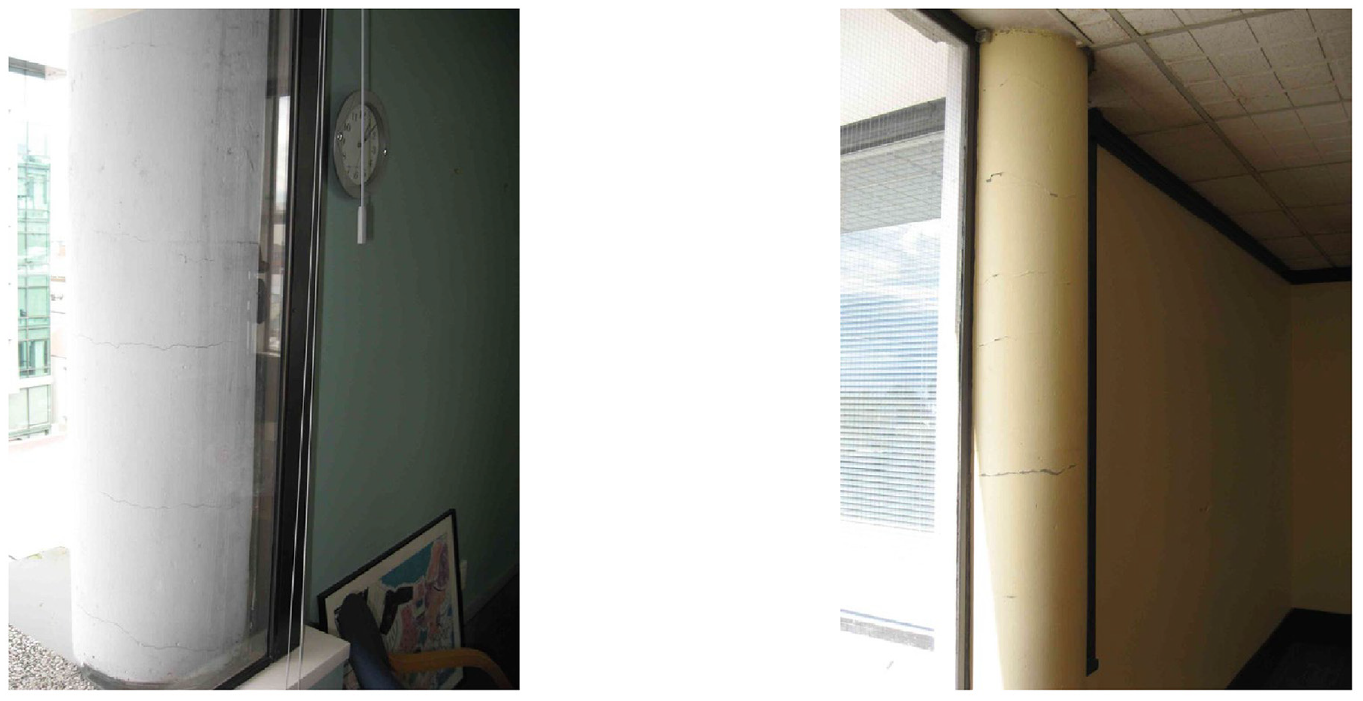
No structural damage report is recorded for the QM complex under the first two seismic events. The third event, the 2016 Kaikoura earthquake, caused significant structural damage to the complex leading to building closure. The severity of structural damage observed after the event across Zone D on the North-East part increased the fear of structural collapse imposing significant life safety risk to neighboring properties and public spaces (Boyack, 2016) and led to the demolition decision in zone D as shown in Figure 16.
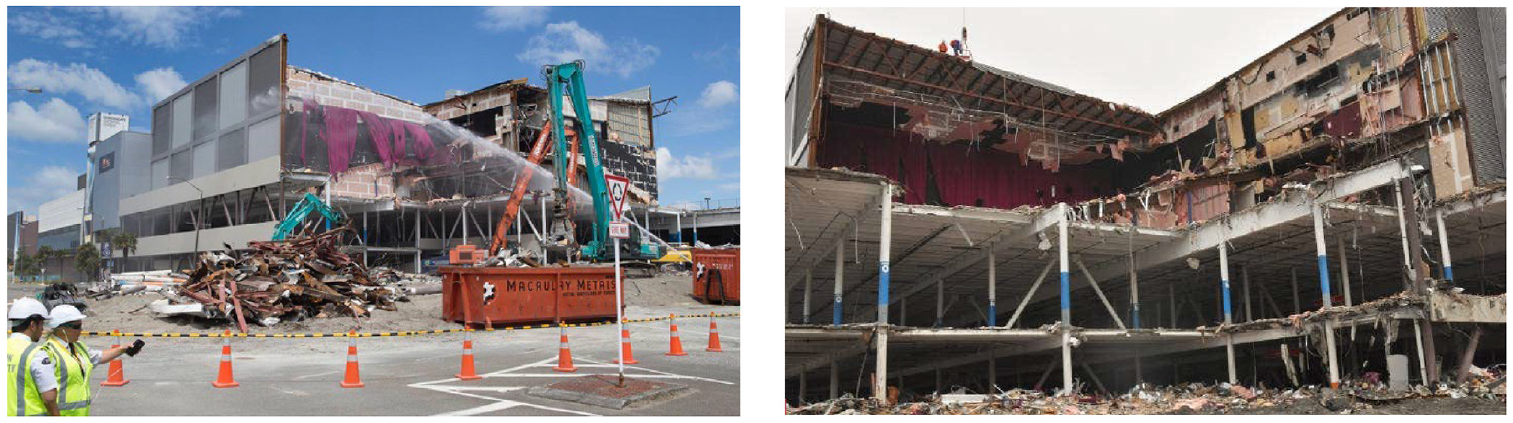
Figures show the demolition of zone D after the 2016 Kaikoura earthquake (Boyack, 2016; Herald, 2017).
Reports for the QM complex after Event 3 show confusion between engineers (Boyack, 2016). The initial seismic assessment (ISA) released 2 days after Event 3 only reported minor superficial damage in zone D, without any specific safety cordon (Boyack, 2016). However, 5 days after Event 3, a more detailed report stated the mall was problem-free, except the cinema and nearby carpark in zone D, the latter of which was added to the original construction in a 2002 extension (Boyack, 2016). Most importantly, it was also reported that the problems with the bracing systems in zone D could cause collapse under likely aftershocks. Thus, cordoning off the damaged areas of the mall and limiting access were recommended. Eventually, urgent demolition was recommended to the owner, which began 5 December 2016 (Boyack, 2016). Moreover, 50 shops were classified as earthquake-prone buildings in 2018, requiring strengthening costing “a few million” dollars (Hunt, 2018).
QM complex analysis
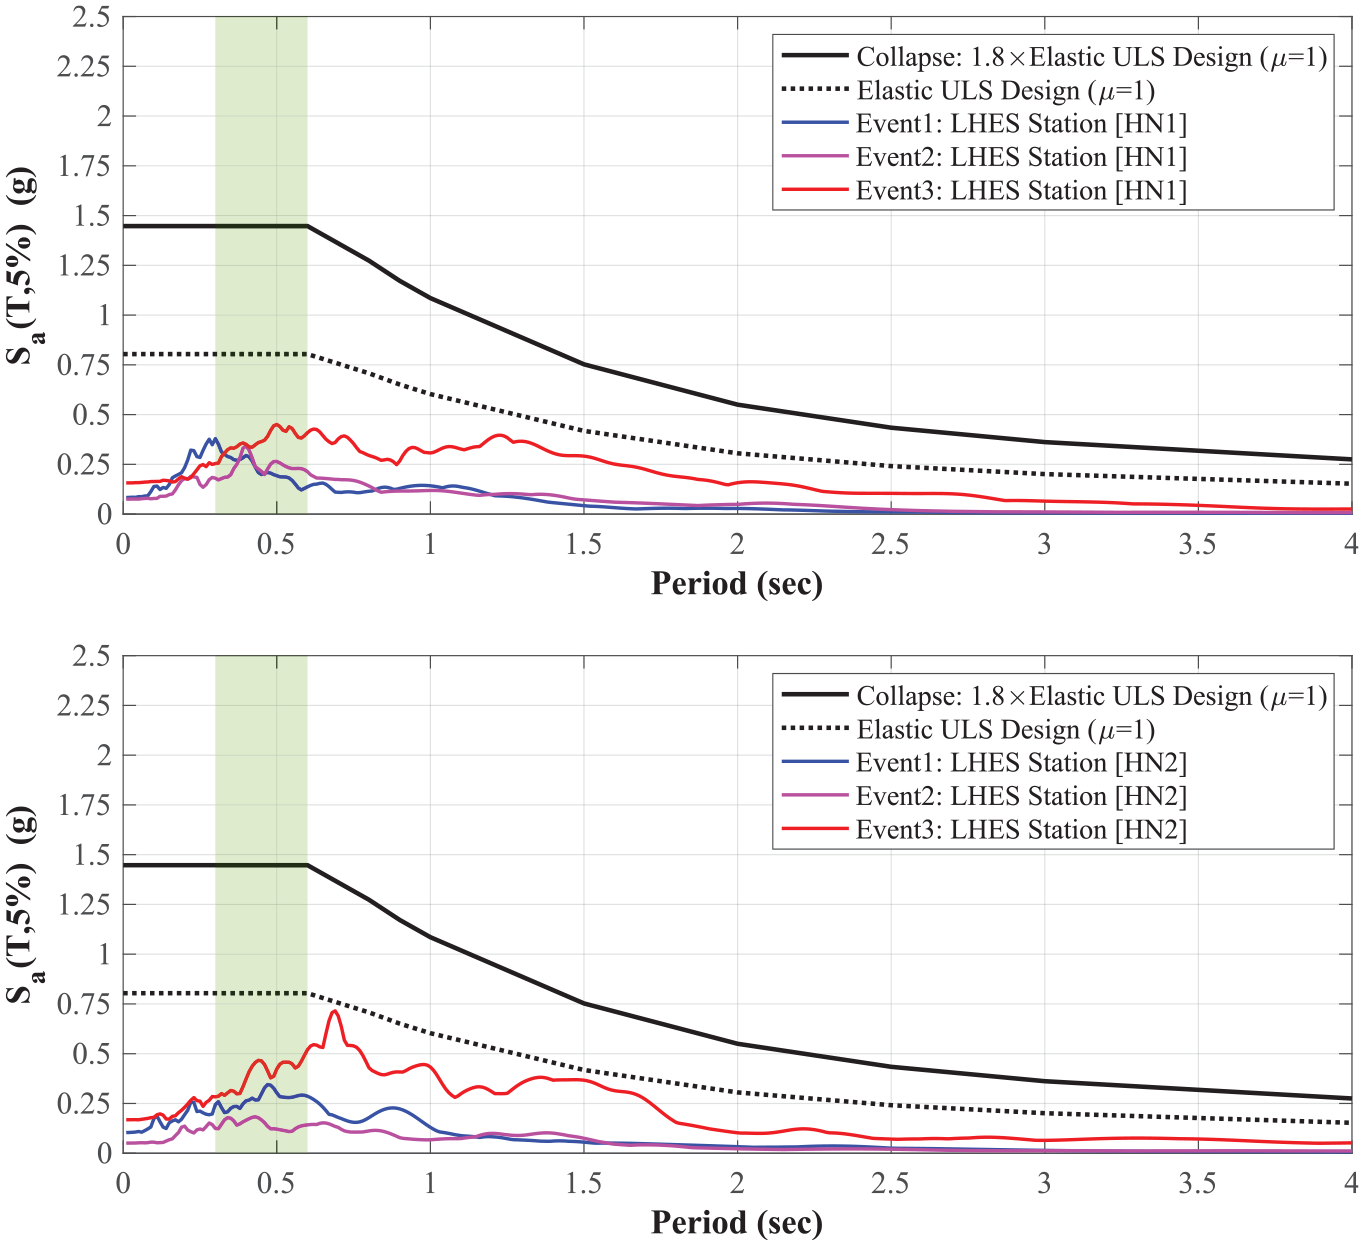
The proposed spectral assessment method is applied to the QM complex. Figure 17 compares the inelastic measured response spectra for horizontal components of the earthquakes recorded at LHES station with the ductile design and collapse spectra obtained according to the NZS 4203:1992 (NZS 4203:1992) for which the complex was designed in the 2002 redevelopment. The structural design calculation report available for zone J of the complex shows the building was seismically designed for vibration periods
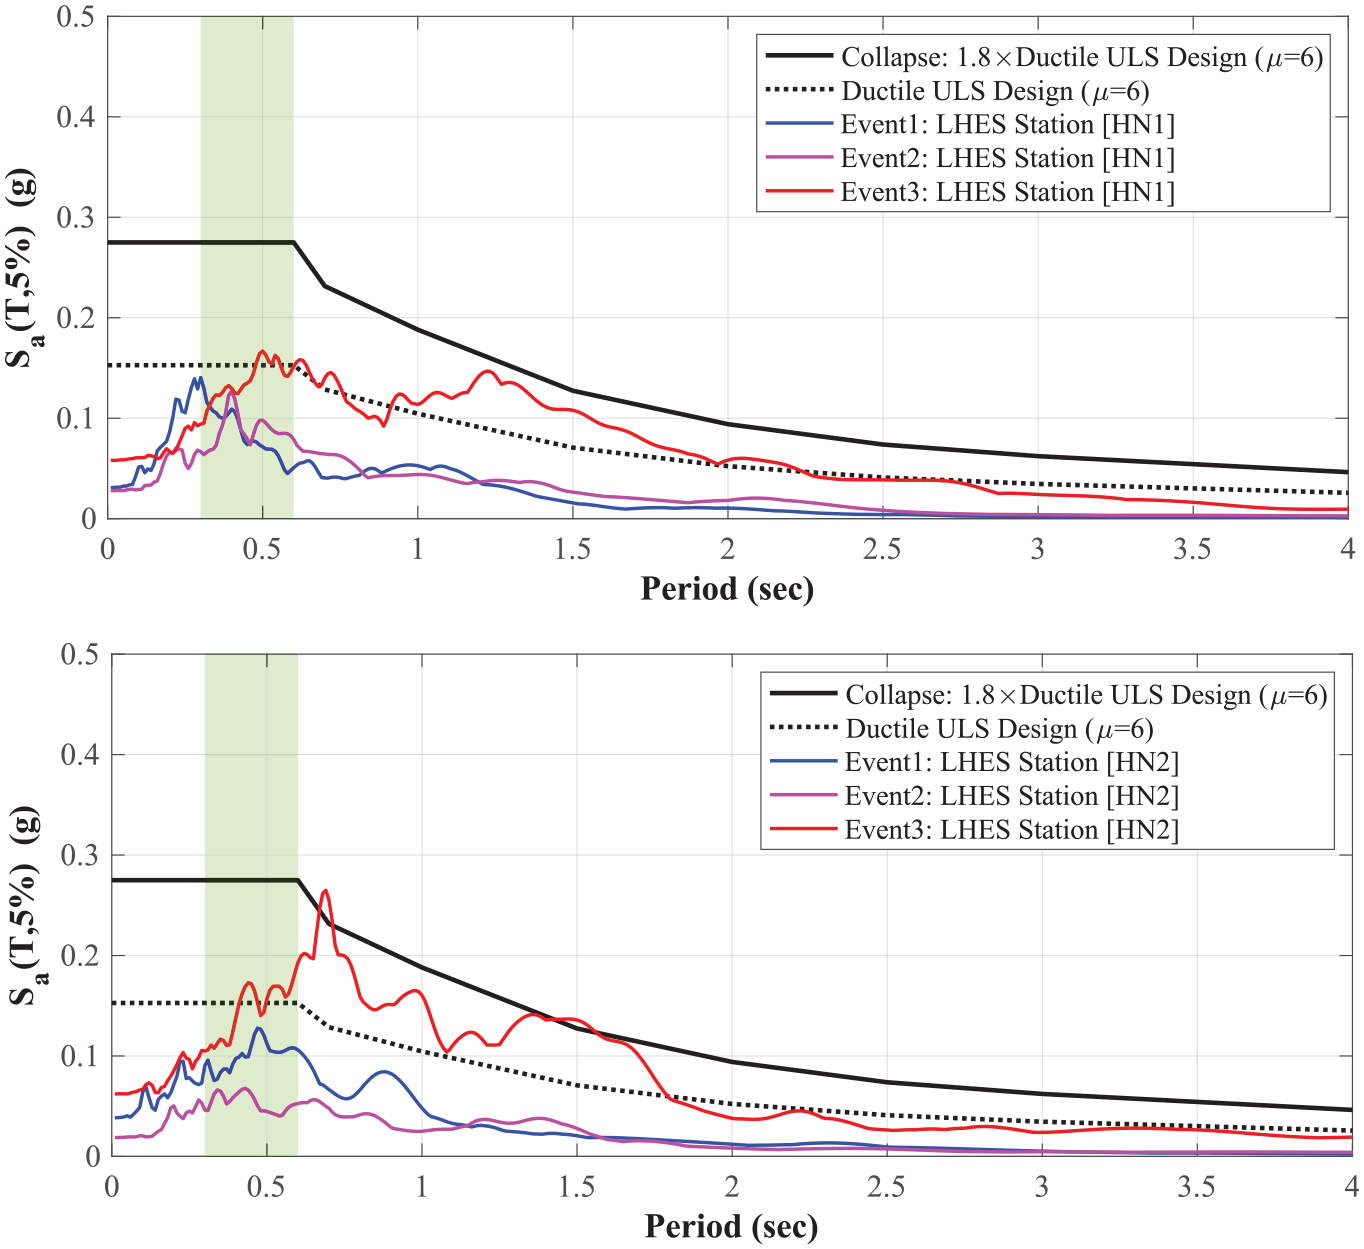
A 5% damped ductile spectra for horizontal acceleration responses recorded at LHES station during the three seismic events striking the QM building along HN1 and HN2 directions, which are compared to the ductile design and collapse spectra according to NZS 4203:1992 (NZS 4203:1992) (Building Category: I; Site subsoil class: Flexible or deep soil sites; Ductility factor: 6).
Figure 17 shows the first two events demands were lower than the design-level spectra. Thus, no structural damage was expected in the QM complex due to the 2013 earthquakes. The 2016 Kaikoura earthquakes imposed significant demands, exceeding the seismic actions for which the building was designed. Therefore, severe structural damage was expected due to the third seismic event, as reported through the media (Boyack, 2016).
From elastic and ductile design spectra for zone J of the QM complex, the values of
The assessment above is valid for zone J where the structural height was ∼8 m. The height of the building was ∼20 m for zone D, resulting in longer vibration periods compared to zone J (
QM complex implications
All assessments for the non-instrumented QM complex were carried out using the ground motions recorded during the three seismic events at Lower Hutt Emergency Management Office (LHES) station alone, and which are freely available via the GeoNet database (GeoNet, n.d.). This assessment validates the spectral-based approach proposed in this article, emphasizing its role as a complement to traditional visual inspections in providing rapid, objective, and accurate post-earthquake evaluations. The lack of efficient building instrumentation prevented this benefit, but the analysis clearly shows its potential value.
CTV building
CTV building seismic damage history
The CTV building was a six-story RC structure designed and constructed in 1986 in Christchurch, New Zealand (Seibel, 2022). The sudden collapse of the CTV building with 115 deaths became the main symbol of the Lyttelton earthquake on 22 February 2011. The collapse and subsequent fire in the building ruins (Figure 18) were responsible for many injuries and about 62% of the total 185 fatalities for this event (Pomonis et al., 2011; Seibel, 2022).
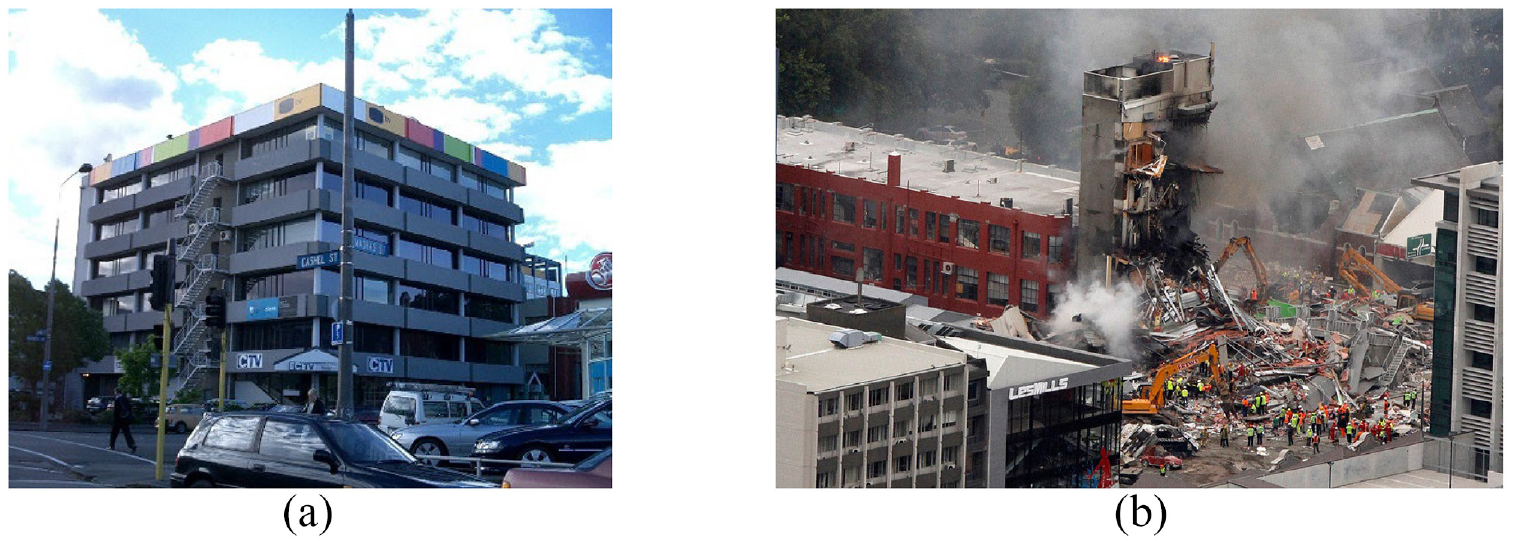
The CTV building: (a) prior to the February 2011 earthquake; (b) collapsed and caught fire after the February 2011 earthquake (Pomonis et al., 2011).
Previously, on 4 September 2010, a sequence of earthquakes struck Christchurch (Seibel, 2022). Three key seismic events affected the CTV building’s seismic performance, starting from the main shock on 4 September 2010 to 22 February 2011, and are listed in Table 4 (Seibel, 2022). Since the CTV building was not instrumented, the ground acceleration measured at the Christchurch Cathedral College (CCCC) station is used to quantify the ground shaking impacts on the CTV building. The CCCC station was the closest station to the CTV building, located 700 m away.
Details of the significant earthquakes affecting the CTV building during 2010–2011 period
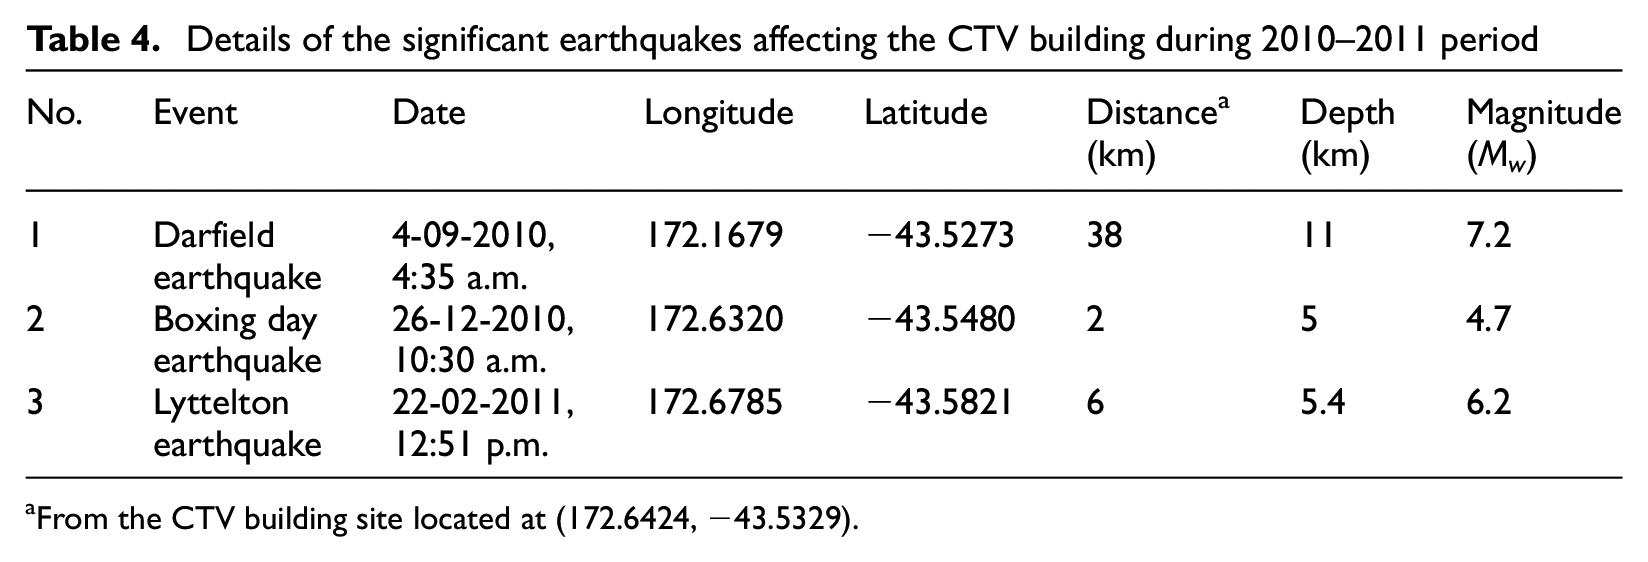
From the CTV building site located at (172.6424, −43.5329).
One day after the main shock, on 5 September 2010, Christchurch City Council inspectors issued a green placard to the CTV building after a level 1 rapid assessment (L1RA). The building was then inspected by a group of three senior council building officials for the level 2 rapid assessment (L2RA) and received the second green placard on 7 September 2010 (Seibel, 2022; Stuff, 2012). Green placards indicate there is no restriction on the use or occupancy of the building (Seibel, 2022). Weeks later, on 6 October 2010, the consulting engineer employed by the building manager identified non-structural and minor structural damage, including cracks in columns (Hyland and Smith, 2012; Stuff, 2012). Therefore, even the presence of minor damage was unnoticed for ∼4 weeks after the event.
Following the Boxing Day aftershock, similar inspections were conducted (Seibel, 2022). On 27 December 2010, a building inspection team from Christchurch City Council (CCC) conducted another level 1 rapid assessment for the CTV building. Moreover, a building inspection carried out by the Urban Search and Rescue Service (USAR) stated the team did not discover any apparent structural damage (Canterbury Earthquake Royal Commission, 2012; Seibel, 2022).
After the Boxing Day earthquake, the CTV building occupants were alarmed by additional visible damage and cracks, some of which may have existed before the Boxing Day earthquake. The visible damage was so worrying they prompted the manager of the tenant relationship services of the CTV building to call the Christchurch City Council (CCC) with a re-inspection request for the CTV building on 05 January 2011. Their re-inspection request was withdrawn 2 days later, on 07 January 2011, after a telephone conversation between the building and the tenant relationship service managers (Seibel, 2022).
The building manager noticed the additional damage to the CTV building due to the Boxing Day ground shakings. However, the building manager underestimated the damage extent based on comments from the consulting engineer employed to inspect the building in October after the first event. The inspector had identified minor damage, and indicated cracks could widen as “just a normal part of flexing” and “there was no concern basically” (Seibel, 2022). Based on this assessment, the manager arranged to have the identified damage in the CTV building repaired by a company specializing in concrete-structure repairs. This firm inspected the CTV building in the first half of February 2011, and preparations were still in progress when the Lyttelton earthquake struck the CTV building and caused its fatal collapse (Seibel, 2022). Therefore, there were ∼5 months between the extreme and unexpected Darfield earthquake and the first decision to repair the building, including a major aftershock and several minor aftershocks, all of which may have increased the underlying structural damage. These ∼5 months also include multiple missed opportunities to identify any major damage.
The Canterbury Earthquake Royal Commission (Canterbury Earthquake Royal Commission, 2012) and the New Zealand Department of Building and Housing (Hyland and Smith, 2012) launched separate full-scale investigations into the collapse of the CTV building. Both reports left no doubt there were significant errors in the CTV building design, which reduced its collapse capacity and played a crucial role (Seibel, 2022). However, the Royal Commission also included in its final report the failure of public authorities to properly supervise building design and construction, and to efficiently inspect the building after the main shock and subsequent aftershocks prior to the collapse, all of which might explain the severity of a building failure resulting in many injuries and deaths (Canterbury Earthquake Royal Commission, 2012; Seibel, 2022). A detailed review on the factors contributing to the CTV building collapse, including the deficiency of the post-earthquake evaluations received by the CTV building after each event, can be found in a recently published study (Seibel, 2022).
CTV building analysis
The proposed spectral assessment method is applied to the CTV building. Figure 19 compares the inelastic measured response spectra for horizontal components of the three damaging earthquakes recorded at CCCC station with the ductile design and collapse spectra obtained according to the NZS 4203:1984 (NZS 4203:1984) for which the building was designed. The Canterbury Earthquakes Royal Commission investigated the design earthquake loading of the CTV building comprehensively (Canterbury Earthquake Royal Commission, 2012). In design of the CTV building, the vibration period of the structure was taken
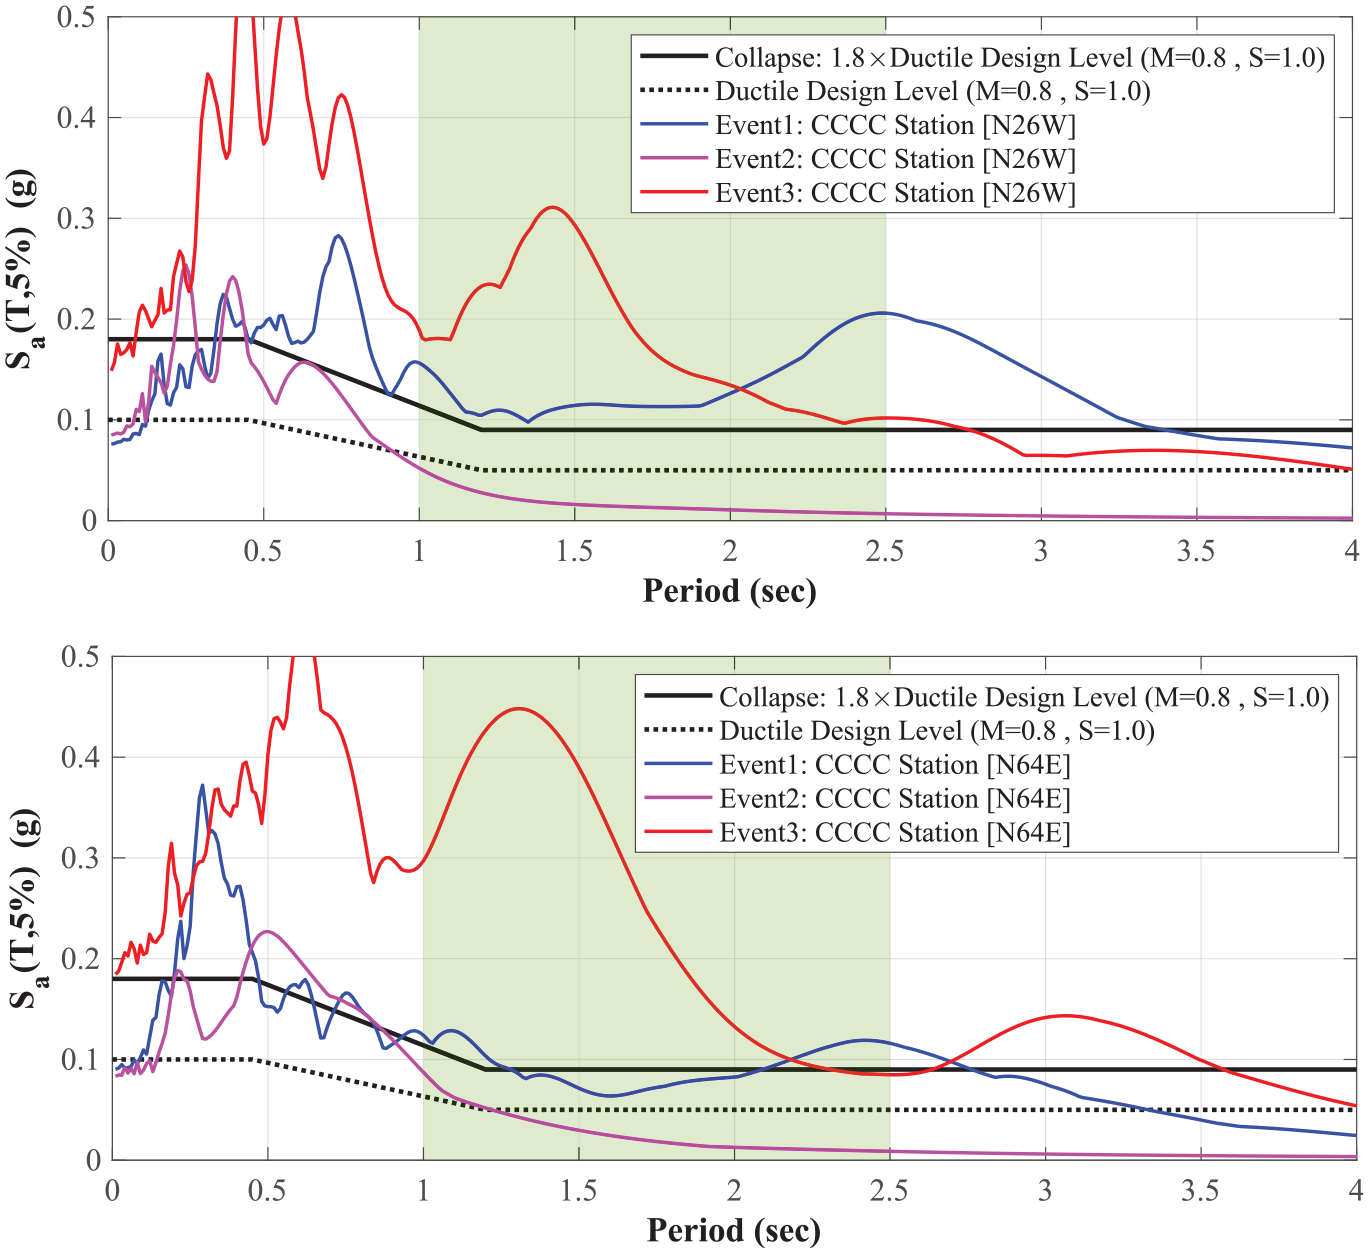
A 5% damped inelastic spectra for horizontal acceleration responses recorded at CCCC station during the three seismic events affecting the CTV building along N26W and N64E directions, which are compared to design and collapse spectra according to NZS 4203:1984 (NZS 4203:1984) (M: 0.8; S: 1.0 (Canterbury Earthquake Royal Commission, 2012)).
Figure 19 shows the measured inelastic response spectra exceeded the collapse spectrum for both directions. From elastic and ductile design spectra for the CTV Building, the values of
Figure 20 shows cracks propagated in the CTV building columns due to the 2010 Darfield main shock (the first event). The photos were taken during the level 2 rapid assessment after Event 1 (Hyland and Smith, 2012). The resemblance between these cracks and those observed and uncovered in the exterior columns of the BNZ building during the demolition (Figure 12) provide further evidence showing the severity of structural damage in the CTV building due to the first event.
Cracks across the exterior columns of the CTV building after the 2010 Darfield main shock (the first event), showing the severity of structural damage (Hyland and Smith, 2012).
Event 2 demands were well below the spectral design level along both directions, and thus no significant structural damage was expected. The spectra of the third event are significantly beyond the collapse spectral level in the period range of interest, for both directions. Thus, the collapse of the CTV building seems to be inevitable, even if the building had not already experienced structural damage during the first two earthquakes. These statements would apply to a well-designed building, where the erroneous design of the CTV building with lower capacity than the standard demanded (Canterbury Earthquake Royal Commission, 2012; Hyland and Smith, 2012; Seibel, 2022) would intensify earthquake-induced damage and consequences. Hence, based on the spectral analysis presented, the structural damage due to the main shock could be more severe than determined by the visual inspection.
There is a key clue confirming the spectral analysis results presented here and show the CTV building experienced significant structural damage due to the first earthquakes. First, the numerous complaints of CTV building occupants regarding the visible damage in the building after the second earthquake, as well as noticeable shaking in mild aftershock. Both these facts indicate a significant loss of stiffness due to Event 1.
The second earthquake caused such worrying cracks and visible damage to the CTV building, they prompted the occupants to request the CCC re-inspect the building again (Canterbury Earthquake Royal Commission, 2012; Hyland and Smith, 2012; Seibel, 2022). The spectral results (Figure 19) show the second earthquake spectra is significantly under the design spectrum, and thus the second earthquake was expected to create smaller deformations and no structural damage. This expectation was not consistent with these observations, which should have been a key clue.
The visible damage and widened cracks after the second earthquake could thus be a meaningful sign for more significant building deformations than expected for the first event. Thus, one interpretation is when the second earthquake struck the CTV building, the first event had already damaged the building severely. Hence, after Event 1, a less-severe earthquake (the Boxing Day aftershock) could cause more extensive deformations than expected in a structurally degraded building. Equally, such unexpected damage after the second event could have, with this analysis approach, prompted a more serious search for unexpected damage, and potentially led to a different outcome.
CTV building implications
All evaluations for the non-instrumented CTV building were carried out using the ground acceleration values recorded during the three seismic events at the CCCC station alone, and which are freely available via the GeoNet database. This evaluation validates the spectral-based assessment proposed in this article. Moreover, it shows while building collapse may have been inevitable, employing a rapid, objective, and accurate post-event evaluation method, instead of traditional visual inspections, could have prevented the issuing of green placards, saving lives.
Discussion
Visual inspection and quantified post-earthquake evaluations: mission impossible and urgent need
Most post-earthquake safety evaluations of buildings over the past decades (Çelebi, 2019) have been conducted using the ATC-20 guidelines (ATC, 1989, 1995, 1996). These visual-inspection-based procedures tag affected buildings with either green, yellow, or red placards designating the inspected building as apparently safe, restricted for use, or unsafe, respectively. These evaluations are typically conducted at three different levels: (1) rapid evaluation (Level 1 rapid assessment), commonly taking less than half an hour; (2) detailed evaluation (Level 2 rapid assessment), generally advised after rapid evaluations and taking a few hours; and (3) engineering evaluation (Detailed engineering evaluation), conducted by structural engineers employed by the building owners, which can take several weeks and are suggested when visual inspections fail to provide a confident decision about structural damage in the affected building (Galloway et al., 2014; Mitrani-Reiser et al., 2016). In New Zealand, post-earthquake building evaluations were based on the ATC-20 procedure (ATC, 1989). The evaluation process was described in the specific guidelines provided by the New Zealand Society for Earthquake Engineering (Galloway et al., 2014).
However, visual inspections are costly, time-consuming, labor-intensive, and dangerous (Spencer et al., 2019). Their performance is highly dependent on well-trained inspectors, making evaluations variable and sometimes unreliable due to human error and limitations (Spencer et al., 2019; Wang et al., 2021). Moreover, visual inspections provide only qualitative information on structural damage, such as light, minor, moderate, and severe. The meaning of these terms can vary significantly according to the judgment of the person employing them, which (further) makes visual inspections highly subjective and inconsistent (Carreño et al., 2010).
When a strong earthquake strikes a large urban area, many buildings should be evaluated as soon as possible. In such situations, the number of required experienced inspectors is likely insufficient, pushing city council officials to use non-experts for post-earthquake inspections, leading to poor evaluations, as happened after the Christchurch earthquake series (Carreño et al., 2010; Galloway et al., 2014). Furthermore, invisible structural damage hidden under building fireproofing and finished surfaces can cause inspectors to underestimate damage, and (in consequence) overestimate building performance and issue green tags, endangering the safety of the building’s subsequent occupants. In contrast, uncertainties in structural damage severity can push inspectors to take very conservative decisions and issue red tags, imposing time-consuming, expensive, and unnecessary further inspections on building owners and waste time and money (Çelebi, 2019). The significant variability between these extremes further shows the overall process is problematic.
Investigations carried out by Royal Commission after the CTV building collapse (Canterbury Earthquake Royal Commission, 2012) reveal inspectors engaging in Levels 1 and 2 of rapid assessment after the Darfield main shock, which severely and unexpectedly struck the city on 4 September 2010, and after the 2010 Boxing Day aftershock, were not expert in the post-earthquake evaluation of buildings (Canterbury Earthquake Royal Commission, 2012; Hyland and Smith, 2012; Seibel, 2022). The outputs of all these visual inspections were a green placard putting no restriction on use or re-occupancy of the CTV building since no apparent structural damage was observed (Seibel, 2022).
One month after the main September 2010 shock, the only detailed engineering assessment of the CTV building, in early October 2010, remained visual inspection with only qualitative criteria and no quantified structural analysis (Canterbury Earthquake Royal Commission, 2012; Hyland and Smith, 2012; Seibel, 2022). This evaluation was the first time the presence of non-structural and minor structural damage, including column cracks, was reported, and only arrived after 1 month. However, the structural damage severity remained significantly unknown to the inspector and the building manager since they did not revoke the green placards, and the first steps to repair the column cracks took 5 months after the main shock in February 2011 (Seibel, 2022). In contrast to the visual-based evaluations, this research, employing a simple spectral analysis methodology, shows the structural damage to the CTV building due to the Darfield main shock was extensive enough to ensure no green placard was issued. Such a choice would have saved lives in February 2011.
For the CTV building during the Canterbury earthquake series, the significant increase in requests for post-earthquake building evaluations and the proximity to the post-Christmas and New Zealand summer holidays, caused a shortage of experienced inspectors and the time for inspections, forcing the Christchurch city council (CCC) to employ non-experts for some post-earthquake rapid assessments (Galloway et al., 2014; Seibel, 2022). The use of non-expert inspectors and overlooking the re-inspection request of CTV building tenants after the Boxing Day 2010 aftershock demonstrate the importance and need for reliable quantified post-earthquake assessment methods. Methods, like the spectral-based assessment method proposed in this article and/or advanced SHM methods (Rabiepour et al., 2021, 2022; Zhou et al., 2017), with results available effectively immediately after significant earthquakes can provide greater insight and help prioritize further analysis, inspections, and decisions, while improving subsequent safety.
For the BNZ building, employing simple spectral and IDR analysis show the BNZ building was severely damaged by the first seismic event. In contrast, visual inspections reported no structural damage for this event or the second event (SCHOUTEN, 2014; Stuff, 2013). Structural damage was only identified by standard inspection after the third earthquake, when the widened cracks and visible damage related to large deformation were undeniable and interpreted as extensive structural damage (Chandramohan et al., 2017).
While post-earthquake assessment for the QM complex was comparatively more successful, it should be noted the ISA published 2 days after the 2016 Kaikoura earthquake reported superficial minor damage. However, the more detailed later assessment reports found the severity of structural damage might cause structural collapse in likely aftershocks. This delay between assessments over 5 days is enough to result in catastrophe in seismically active regions, where a large earthquake can trigger multiple major aftershocks.
Delayed and inaccurate post-earthquake evaluations for the actual structures studied in this article show how much conventional inspections can be unreliable, with significant economic and social consequences. It is important to note modern and efficient networks for free-field seismic and structure monitoring in New Zealand, via the collaboration of GNS Science and Earthquake commission EQC (Uma and Beskhyroun, 2019), create the unique opportunity for this analysis challenging the reliability of current standards-based post-earthquake inspections. They also provide the framework within a larger effort to instrument critical buildings and infrastructure could be undertaken to improve New Zealand’s seismic resiliency. Such a more complete monitoring and SHM framework would provide a template, generalizable to other seismically active areas internationally, if it were economic to implement.
Spectral assessment method: present and future
A spectral assessment method as a supplementary tool to traditional visual inspections for post-earthquake structural assessment is proposed in this article. The challenges inherent in obtaining comprehensive datasets due to privacy concerns, logistical limitations, and particularly in the absence of detailed visual inspection reports allowed us to verify the proposed assessment method for only three actual earthquake-affected structures in New Zealand. Further case studies can help to verify the proposed method, find its likely deficiency, and thus ensure it remains reliable under future seismic events. This task is beyond the scope of this article and underscore the necessity of a global collaborative effort in future research of this field. By engaging researchers worldwide, we can gather a broader range of case studies, facilitating thorough verification and refinement of the method. The authors believe, such contributions are crucial for developing reliable and universally applicable post-earthquake assessment techniques.
The effectiveness of the proposed spectral assessment method depends on the availability of key parameters concerning design earthquake actions for assessed structures, as prescribed by seismic codes. Two essential pieces of information are critical to the application of the proposed method: the ductility factor for which the structure was designed, and the height of the structure, which indicates the building’s vibration period range. However, it is worth noting that while these data points are essential, the accuracy and reliability of the proposed spectral assessment method would be further enhanced with the availability of more comprehensive seismic design information for the assessed structures.
Using earthquake responses recorded at stations not exactly at the same location of the assessed structures can affect adversely on the proposed method accuracy. The closer stations would provide more accurate assessments. The impacts of the distance between the station and the assessed building and the different subsoil conditions can be partially addressed using attenuation relationships and the known ratio between the earthquake spectra defined for different subsoil classes in seismic codes. However, the authors recommend a simpler approach at this stage and suggests a denser monitoring network could offer a more robust solution in the long run and in practice.
Uncertainties in design parameters, including period, damping and overstrength factor, can also negatively impact the reliability of the assessment. Availability of the structural design calculation set for the assessed structures prior to event can significantly mitigate the uncertainties associated with overstrength factor and fundamental period for which the assessed structures are designed. To include and mitigate the influence of uncertainties with the period of vibration, a series of spectral analysis can be carried out over a likely vibration period range estimated based on the height of the assessed structures instead of a single assessment for a single specific period. Consequently, rather than reporting a singular value for structural damage assessment, a probability of the expected structural damage level can be reported. Such a probabilistic approach can be adopted to address the uncertainties associated with the damping, which can be the scope of the future work with more verification cases.
In the study of structural collapses, literatures indicate that spectral analysis had been a key tool for researchers and engineers. However, there is no consensus on the optimal approach to its application. Commonly, the method involves comparing an earthquake’s measured elastic response spectra with the building’s elastic design spectra, as adopted in various studies (Galloway et al., 2014; Goldsworthy, 2012; Kam et al., 2011; Ozturk et al., 2023). This standard approach, though, tends to overlook a critical factor: buildings are designed for ductile seismic performance, which significantly influences the onset of structural damage and the levels at which collapses occur. The comparison of elastic spectra, while disregarding ductility, can be useful for illustrating the extent of significant structural damage or collapse caused by exceptionally large earthquakes, those that exceed the collapse threshold. However, its effectiveness diminishes in situations involving earthquakes of medium to severe intensity, particularly those near the design level.
For instance, Figure 21 compares elastic measured response spectra with the elastic design spectra for the QM complex. All three measured spectra are well below the design spectra for both directions, contradicting the post-earthquake observations of potential damage (Boyack, 2016). As expected, for mid-to-severe earthquakes close to design levels when the ductility is ignored, the elastic spectral analyses result in outcomes showing nothing special structural damage. Thus, elastic spectral analysis can be misleading in this usage, and its inaccurate assessments can impose high risks to the earthquake-affected building owners and users.
A 5% damped elastic spectra for horizontal acceleration responses recorded at LHES station during the three seismic events striking the QM building along HN1 and HN2 directions, which are compared to the elastic design and collapse spectra according to NZS 4203:1992 (NZS 4203:1992) (Building Category: I; Site subsoil class: Flexible or deep soil sites; Ductility factor: 1).
Combined actions for a successful post-event evaluation strategy
A successful post-earthquake evaluation approach needs to be developed meeting the requirements of all stakeholders, including central and local government, property owners, tenants, bankers, insurance firms, and engineers. Combined decisions and actions by these groups, pre- and post-event, can do much more to efficiently mitigate future earthquake impacts on communities and businesses, enabling more resilient cities and buildings (Hopkins, 2019). This section addresses how this outcome might be achieved.
Reliable SHM and quantified methods as complement tools for the traditional visual inspection approach is an urgent need for reliable post-earthquake evaluations requiring instrumentation in buildings and efficient earthquake monitoring networks. Governments and engineers can update safety provisions and standards, recommending or even mandating SHM instrumentation for post-earthquake assessment of buildings, as happened in Los Angeles in the United States (Sun et al., 2019). In particular, such mandates should be considered for high-importance buildings, where damage or closure can result in significant further loss of life and economic impact. Such updates and mandates are not unprecedented, when considering how standards were updated years ago to mitigate fire risks by installing fire alarms and sprinkler systems.
The cost of SHM instrumentation for large and high-importance structures, such as the BNZ building, are much lower than the costs for fire system installation, and increasingly falling. However, property owners may still be reluctant to instrument the building because of its cost. Here, governments and insurers, benefiting from rapid and accurate post-earthquake evaluations, could take the lead and define guidelines and programs facilitating SHM instrumentation, where the GeoNet structure instrumentation program funded by the NZ Earthquake Commission (EQC) is a good first example of government intervening in this (potential future) market to show value.
Government funded or subsided instrumentation programs, including public–private partnerships, also provide excellent opportunities for engineers and researchers to develop even more accurate and reliable SHM methods. Such market priming would enable a market of algorithms and methods with proven capabilities, as well as the potential to reduce insurance costs. Finally, continuous building monitoring in this fashion, opens further opportunities to optimize building use and other building services.
Recommendations
The outcome of this analysis and review yields the following summary set of recommendations for the field to consider for the future:
Conclusion
This article introduces a simple spectral-based post-earthquake assessment method. The performance of the introduced method is validated against three actual earthquake-affected structures in New Zealand. The article shows how inaccurate a routine and accepted elastic spectral analysis approach can be in evaluating and assessing the likelihood of earthquake-induced structural damage. This study also critiques the insufficiency of the visual-based post-earthquake evaluations after earthquakes to highlight the importance and need for reliable rapid quantified post-earthquake evaluation methods delivering helpful information for optimum decisions and actions which can save time, cost, and lives.
Footnotes
Acknowledgements
The authors extend their deep gratitude to the GNS Science & GeoNet team, with special thanks to Dr Muriel Naguit, for their outstanding support and assistance in responding to our inquiries regarding the GeoNet database.
Declaration of conflicting interests
The author(s) declared no potential conflicts of interest with respect to the research, authorship, and/or publication of this article.
Funding
The author(s) received no financial support for the research, authorship, and/or publication of this article.