
Abstract
Passive thermography is an efficient method to inspect fatigue damage of large-scale structures such as wind turbine blades under cyclic loads. Quantitative damage evaluation often requires the damage region to be segmented from the thermal image, which challenges conventional image process techniques, especially when the structure is moving, and the thermal background is changing. This study proposes a model based on deep learning and thermography to automatically segment complex dynamic background of images taken from a wind turbine blade during cyclic loading and subsequently segment the fatigue blade damages. An automated background segmentation algorithm is developed to isolate the blade from the background using six state-of-the-art deep learning models. The most accurate model is then chosen and improved for the second step of damage segmentation, achieving a level of accuracy comparable to that of human observation, even with fewer images in the training process. The proposed background and damage segmentation methods have recall of 99% and 82%, respectively, indicating that the proposed approach is accurate, efficient, and robust.
Keywords
Introduction
The rapid energy transition towards more renewables requires larger and more wind turbines to be installed and operating continuously with minimum downtime. Rotor blades are one of the crucial components in a wind turbine which convert wind power into electrical energy.1,2 Structural damages on wind turbine blades during operation can lead to high maintenance costs, power generation loss, and potential threats tohuman safety and the environment. 3 Therefore, it is necessary to carry out efficient damage inspection to reduce the risk of structural failures and increase structural reliability.
The conventional ways to inspect wind turbine blades normally require a professional team that uses rope and basket access techniques to perform inspection manually. However, these tasks are labor-intensive and time-consuming. Moreover, the inspection procedure requires the wind turbines to be out of service, resulting in extra operative costs due to the loss of power production. There is a significant need for more efficient in-service blade inspection methods without compromising the accuracy of damage detectability.
Recent studies4,5 carried out damage detection of large composite structures by deploying sensors including acoustic emission sensors and strain sensors. However, these approaches still have several challenges such as various nonuniformly distributed environmental effects among other matters, labor work involved in the sensor installation, and the potential risk of getting lightning strikes. Consequently, wind turbine owners prefer sensorless non-contact solutions for damage inspection of large-scale wind turbine blades in the field.
Among several non-contact damage inspection methods, infrared thermography shows its capability to inspect large areas fast by capturing thermal images of the object’s surface without interrupting the running operation of the power system. In general, damaged areas alter the temperature distributions on the surface that are measured by infrared cameras. Infrared thermography works on two basic principles: active and passive. In active thermography, external sources such as flash and halogen lamps are used for heating up the test specimen making the technique less usual for operating wind turbines. On the other hand, passive thermography utilizes the heat released by a specimen in response to mechanical loading. This method has been widely used to inspect potential damage in wind turbine blades on site when a turbine is in operation.
Two early laboratory studies4,6 applied a passive thermography technique to inspect a 14.3 m-long wind turbine blade under cyclic loading to mimic operational fatigue loads. Thermal images of the blade were taken from afar by a fixed-position camera and the thermal footprints generated by blade damages were identified. These experiments developed an image processing (IPs) technique, named AQUADA, to automatically detect and quantify fatigue blade damages in one single step.
Although this method overcomes some shortcomings of the conventional thermographic inspection method for large-scale structural applications, there is still a challenge of how to inspect damages in different locations of large-scale structures like wind turbine blades in a single thermal video? To this end, the thermal camera cannot be placed in a fixed position as done in the previous studies but should be moved around to inspect different areas. However, images captured by a moving camera have a relatively complex background. If the damages are extracted from the entire image, the complex background will cause considerable interference. Therefore, the extracted damage features do not accurately reflect the actual state of the blade damages, and so, it is necessary to perform background segmentation on the blade image. There are a few challenges associated with automatic background segmentation using IPs in one single step and they are elaborated as follows:
Thresholding-based segmentation methods are affected dramatically by unavoidable varying environmental temperatures from image to image as the thermal camera moves around the blade. Therefore, a fixed threshold value cannot be held over all the images, and it needs to be determined by trial and error based on the image content.
Using edge detection techniques to automatically isolate blade edge lines from the background is a nontrivial task since the blade does not occupy a fixed position in the images taken from a moving camera. These algorithms detect lines based on a series of parameters determining the location and orientation of lines in images. Therefore, the blade edge line detection should be done dynamically based on each image’s content.
Therefore, it is urgent to develop a robust and effective segmentation model that is adaptable to varying illumination conditions and camera distance. Recent developments in Artificial Neural Network and, in particular, deep learning have offered new possibilities to tackle complex problems in image analysis. One such algorithm is the Convolutional Neural Networks (CNNs), which are considered one of the deep learning derivatives used for pixel labeling problems or segmentation.
CNNs are trained through their convolutional layers using kernels to extract low-level features of the input image at initial layers and high-level features at higher levels, see Figure 1. One kernel slides along the input array and generates a subarray with the same size as the kernel. The hyperparameter stride defines the number of kernel’s pixels sliding at a time across the image’s width and height. 7 An element-by-element multiplications (i.e., dot product) is performed between the subarray and the kernel. The multiplied values are summed to produce one element of the output array. The rectified linear unit 8 (ReLU) is then used to apply an “elementwise” activation function to the output produced by the previous layer. The pooling layer summarizes data by choosing the local maximum in a kernel moving along the spatial dimensions of the input. 9 A fully connected layer which is similar to the traditional Multi-Layer Perceptron neural networks 10 is used to translate those feature maps obtained from the previous layers to the given output phases. Finally, the softmax layer as the final layer of CNN architecture is used to produce a categorical probability distribution. 11
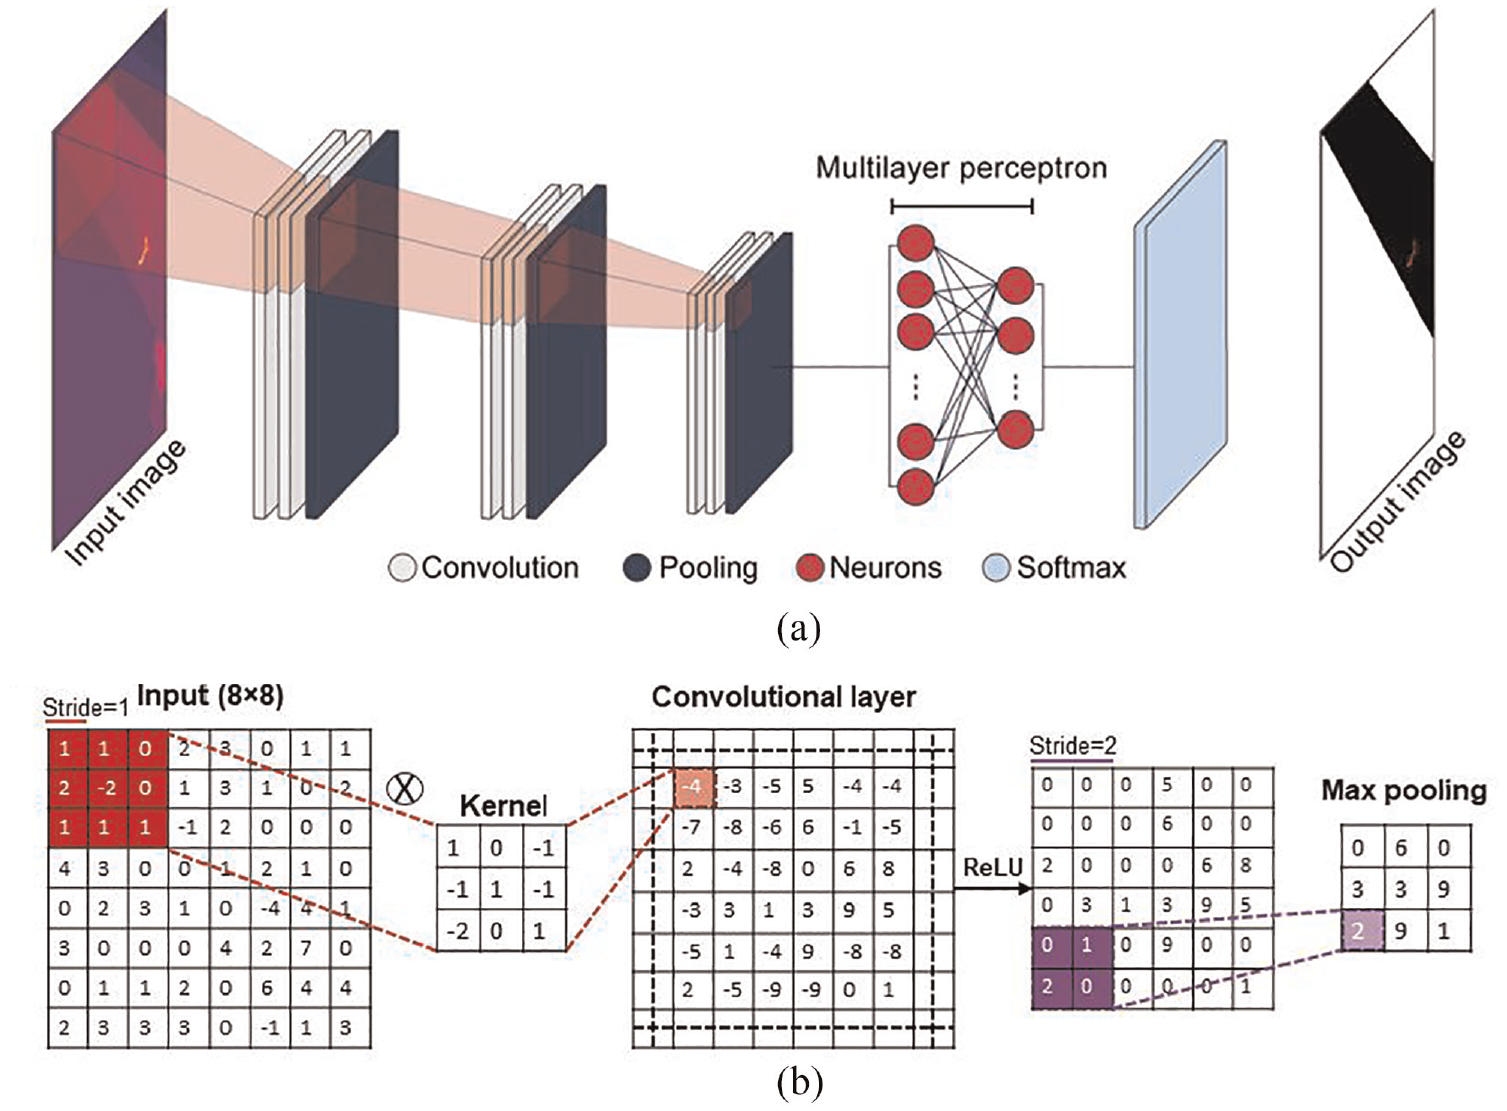
(a) Schematic CNN architecture and (b) example of convolution and pooling.
Considering the successful application cases of deep learning in many image recognition fields,12–18 this paper proposes a novel two-step method based on deep learning to automatically extract deep image features layer by layer to achieve efficient and accurate segmentation of fatigue damages from thermal images of a laboratory wind turbine blade under cyclic loading. In the first step, a background segmentation is performed on the images to eliminate the influence of the background object on the damage segmentation task; in the second step, the blade, which is separated from the background, is analyzed to extract the damage features automatically. The main contributions of this paper include:
A deep learning-based model is proposed to automatically segment complex thermal backgrounds and characterize fatigue damages from passive thermography in large composite structures such as wind turbine blades subject to cyclic loading in the laboratory.
This proposed method is a significant leap forward to enhancing the capability of thermography, potentially changing the current way in which the thermal imagery is processed and interpreted. A comprehensive dataset is created that includes images captured under a wide range of background settings, varying illumination conditions, and different camera distances. This dataset has been utilized for training, validating, and testing the model that can automate the entire process of background and damage segmentation, no matter the prevailing circumstances.
The rest of the paper is divided into four sections. First, an overview of the applied methodology is described. This is followed by the blade specimens and full-scale structural test setup. Subsequently, the results of the study are presented and discussed to demonstrate the effectiveness of the proposed method to automatically segment fatigue damage sites in the presence of a complex thermal background from one single thermal video, and finally, conclusive remarks are summarized.
Proposed methodology
An overview of the methodology used in this study is shown in Figure 2. At first, a dataset of thermal blade images taken by a thermal camera rotating along the blade was built and used as a background segmentation dataset. The dataset was divided into training, validation, and test datasets. Next, six popular pre-trained deep learning models including Segnet, VGG-Segnet, Resnet50-Segnet, Unet, VGG-Unet, and Resnet50-Unet were explored to evaluate their background segmentation performance. The best model with the highest accuracy was selected for the second part of damage segmentation. Background segmentation aims to remove irrelevant background image information from complex content, and damage segmentation aims to extract the image pixels of fatigue damages detected from thermography. The dataset and the developed model in the first step were used in the second step; therefore, the proposed method can segment the damages of the isolated blade.
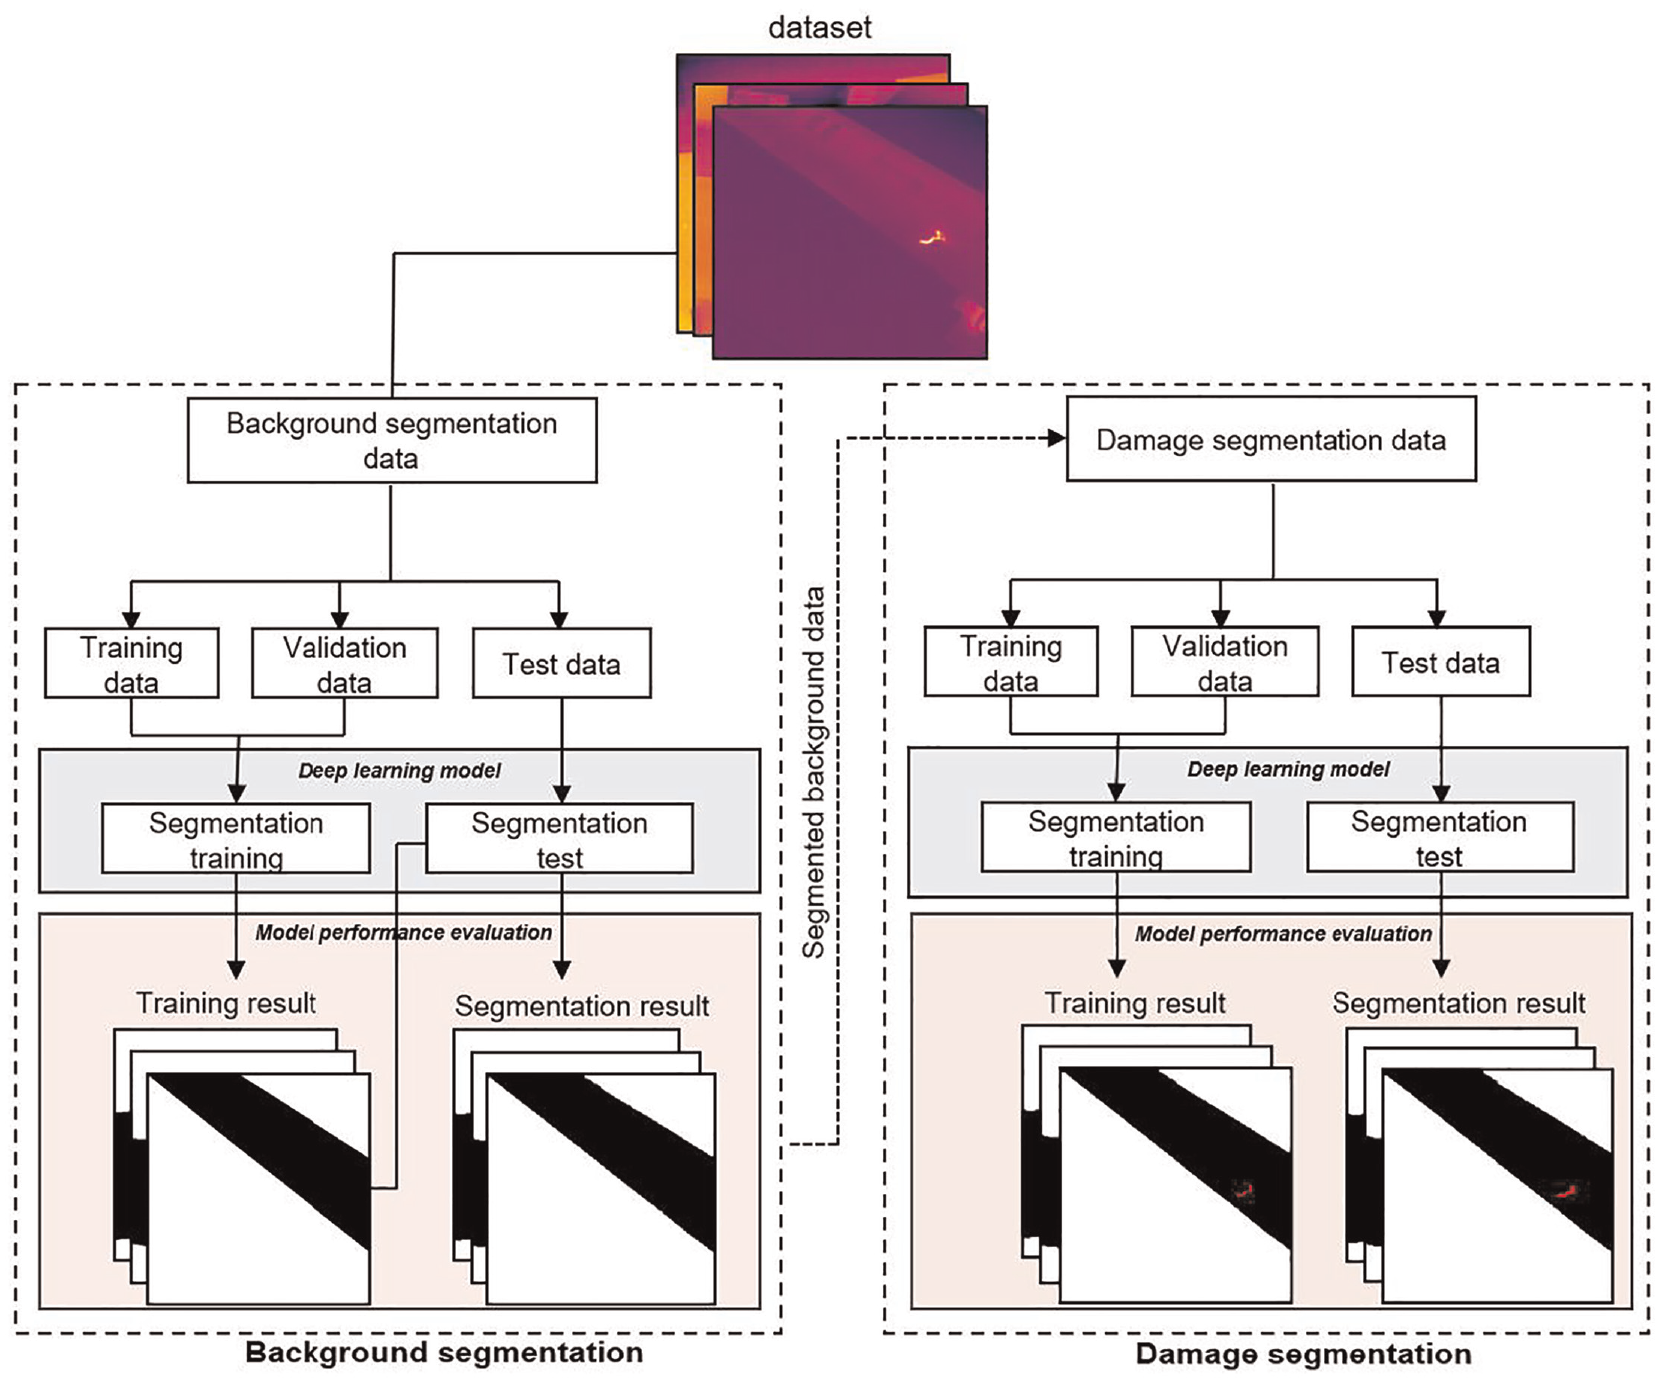
An overview of the methodology used in this study.
Background segmentation dataset
The background segmentation dataset consisted of 1023 raw images with 640 × 480 pixels resolutions. Among the 1023 images, 998 images were used for the training and validation process (with a fraction of 95% and 5%, respectively), and 25 images were used for the testing process. To enhance IPs efficiency, all training, validation, and testing images were cropped into 384 × 384 images and then cropped into smaller images of 192 × 192 pixels resolution as a pre-processing step after annotating each image; in other words, each 384 × 384 images was divided into four sub-images (2 × 2). However, if smaller images than those selected here were used, the network may catch any elongated features.
Ground truth
The CNN models used in this study require supervised learning, thus they need to get a blade image dataset as input with their corresponding ground truth as output. Background segmentation was done based on Hough transforms algorithm and the blade damage was segmented within the detected blade using the multilevel thresholding technique. The details of each are provided below in the following subsections.
Background segmentation
The Hough transforms algorithm was performed to detect lines in images to identify two edge lines of blades. The captured images were initially blurred by a Gaussian function, a commonly used method to reduce the influence of Gaussian noise in images. This noise was added to the captured images when the camera temperature increased. The smoothed images were then processed by the Canny edge detector as an edge map, which uses non-maximum suppression, threshold filtering, and weak edge tracking to clear the primary edge map. Finally, the edge map would be a binary map, where pixels with one value represent edge points. Hough transform 19 was then performed to map edge points to Hough space (ρ,θ), as follows 20 :

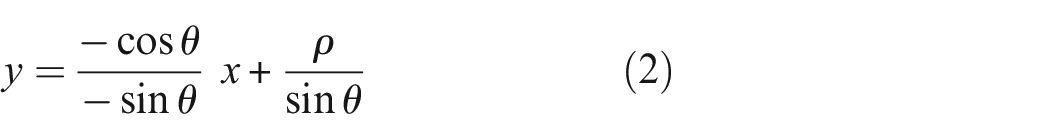
where the coordinate of the edge points has been shown by x and y. The (ρ,θ) pair jointly describes a straight line passing through the edge point (x,y). ρ is the distance from the origin to the line, and θ is the angle. By quantizing the Hough space and accumulating the (ρ,θ) pairs produced by all the edge points, the accumulation matrix can be obtained. The first few (ρ,θ) pairs with the largest cumulative number are selected and transformed inversely to the image space as the detected lines, which can be written as 20 :
Once two edge lines of blades were detected by Hough transforms algorithm (see Figure 3(b)), the morphological operation of closing was applied to eliminate redundant detected features (Figure 3(c)). Finally, the flood fill algorithm was used to fill the area within the boundaries of the detected edges (Figure 3(d)). In this manner, a binary image of the blade was obtained, in which the blade portion and the background portion had different values. The binary image was used as the mask of the original blade image and the two images were superimposed. The background portion of the original blade image became black, while the blade portion remained unchanged, see Figure 3(e). The main advantage of the Hough transform technique is its tolerance to the pixel absence in feature boundary descriptions and its insensitivity to noise. However, in this application, as the camera moves, the location and the orientation of blade edges in the sequential images are often changed, making parameterizing edge lines challenging.
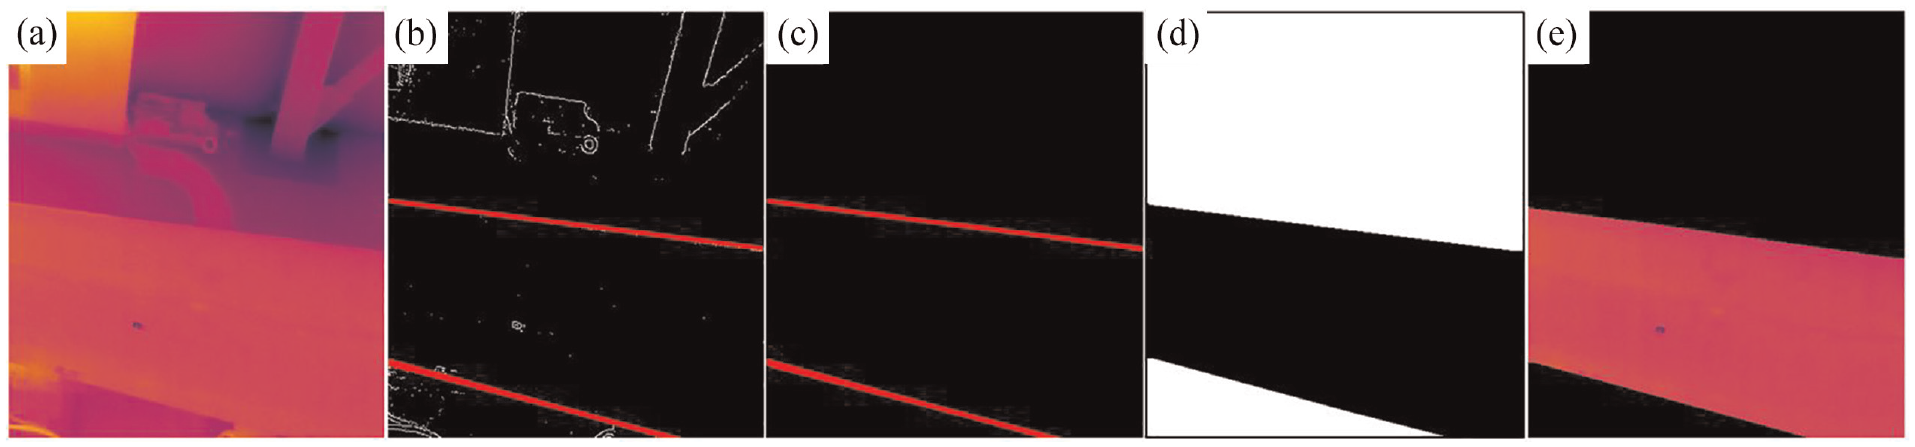
Typical background segmentation steps using Hough transforms algorithm, (a) raw image, (b) blade edge line detection using Hough transforms algorithm, (c) noise removal using morphological operation, (d) filling the area between edges using flood fill algorithm, and (e) background removal.
Damage segmentation
Thresholding is a technique that classifies the grayscale image pixels based on their intensity level (I). The optimal threshold value (th) is selected in a manner by the following
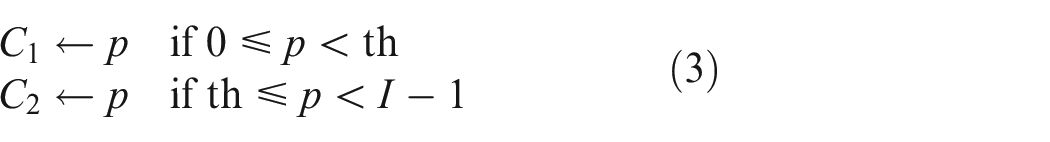
where p indicates one of the grayscale image’s pixels which can be represented in I grayscale levels I = {0, 1, 2, 3,…, I − 1}. C1 and C2 represent the two different classes separated using pixel p, and th indicates the threshold.
The concept of bi-level thresholding can be extended to multilevel thresholding that uses multiple threshold values to create an output image with multiple groups using21,22:
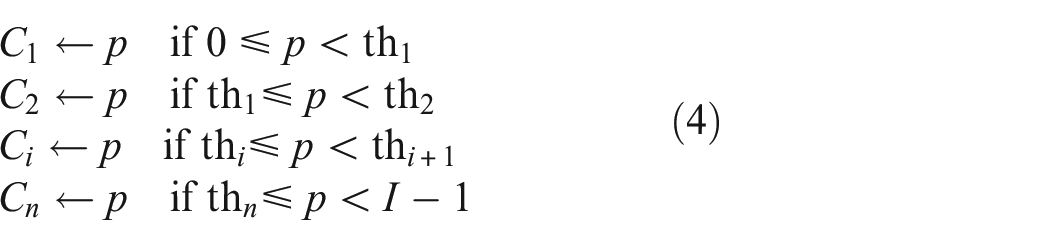
where {th1, th2,…, th k } are the various thresholds. The objective is to choose the th values that appropriately classify the different regions in an image. In this study, multilevel thresholding and morphological operations were used to segment damage within the separated blades. The optimum separability point of phases was determined for every image using histogram thresholding based on the visual comparison between ground truth and its corresponding original image. In this manner, the blade, background, and damage portions were set to black, white, and red, respectively. This approach had the advantage of flexibility and producing robust performance. At the same time, some drawbacks to this method should be noted. First, the threshold value often varied from one image to another since the rotating camera made varying illumination in the images. The thermal images and their corresponding histograms in Figure 4(a) to (d) exemplify this situation. Second, the bright pixels in the image that were not part of the damage lines could also be detected as a damage portion. These indicate that the threshold value should be calculated dynamically based on the image content and that experimentally selecting a value is not appropriate for a robust autonomous vision system.
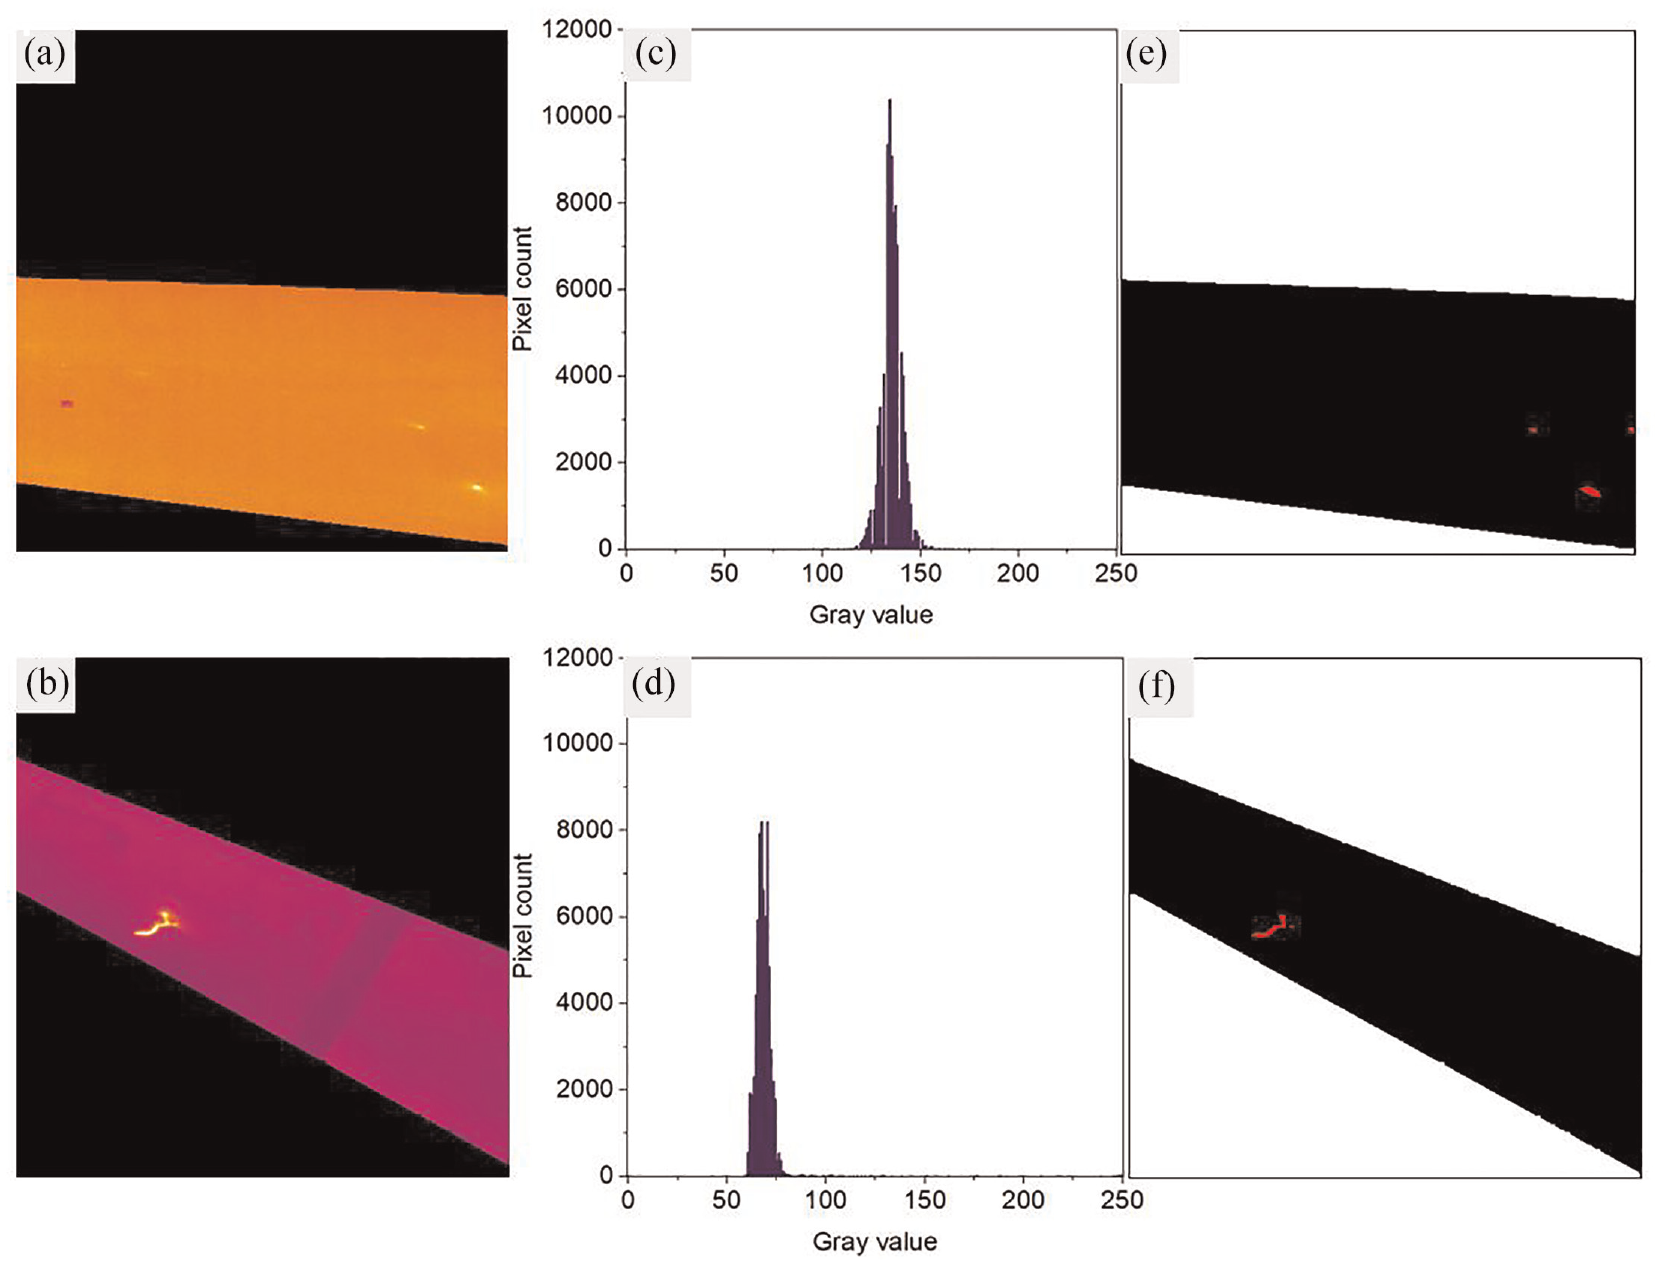
Typical multilevel damage segmentation, (a) and (b) images after background removal, (c) and (d) their corresponding histograms, and (e) and (f) segmentation using multilevel thresholding, where the damage pixels of ground truths were set to red.
CNN architecture
Identification of the blade from the background is necessary to neglect other thermal abnormalities outside of the blade. In this research, pre-trained CNN schemes, including Segnet, 23 VGG-Segnet, 24 Resnet50-Segnet, 25 Unet, 26 VGG-Unet, and Resnet50-Unet were employed to evaluate their background segmentation performance. After segmenting the background, a comparison was executed with corresponding ground truth and based on the evaluation metrics used in this study to verify the merit of the considered CNN schemes. The VGG-Segnet and VGG-Unet considered the VGG16 scheme as the encoder section. ResNet is a superior architecture to VGG because it is based on the idea of shortcut connection, which acts as gradient superhighways, guaranteeing the number of the network’s layers is increased without decreasing in network performance compared to its counterpart with fewer layers. This solves the problem of vanishing gradients.27,28 To execute a reasonable assessment, each CNN was allocated with similar parameters as initial weights=Imagenet, epoch=500, optimizer=Adadelta, batch size=256, training dataset size = 998, testing dataset size = 25, and with max pooling between convolutional layers.
Confusion matrix
A confusion matrix 29 is a concept of machine learning which contains information about actual and predicted segmentation done by a segmentation system. Figure 5 presents the basic form of a confusion matrix for a multi-class segmentation task, where the A1, A2, and An, are the number of classes and Lii represents the total number of pixels segmented as Ai that actually belongs to class Ai, that is, true positives (TPs). Similarly, Lij represents the number of false negatives (FNs).
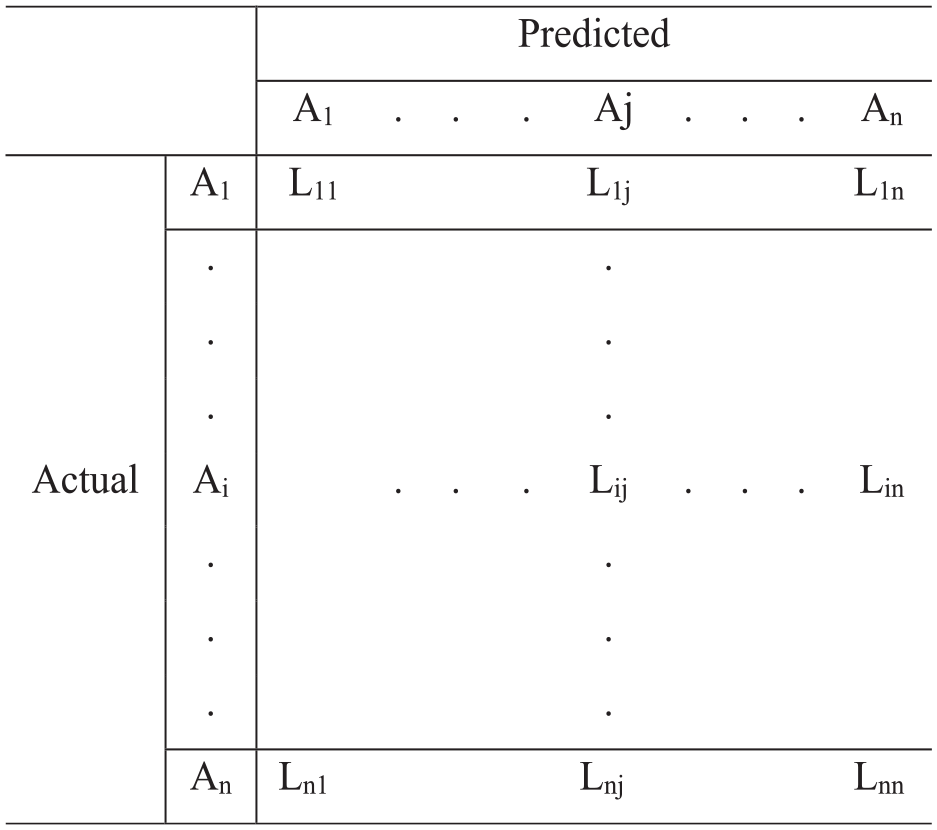
A basic form of a confusion matrix for a multi-class segmentation task with the class of A1, A2, and An, where Lij represents the total number of pixels segmented as Aj that actually belongs to class Ai.
Several measures of segmentation performance can be defined based on the confusion matrix. Some common measures are given and used in this study for both background and damage segmentation steps as following30,31:


where, TP represents the number of correctly segmented background/damage pixels, as relevant pixels. False positive (FP) is the number of non background/damage pixels that wrongly segmented as background/damage ones. FN is the number of background/damage pixels wrongly segmented as non background/damage pixels.
The model’s performance for the testing dataset was evaluated after completing the training and validation phase and was compared using Precision, Recall, and F1 score (F1). In addition, the accuracy score and relative error were also employed for background segmentation, Equations (8) 32 and (9). 33 However, the accuracy was not used for damage segmentation since the true negatives outweighed the TPs significantly. 34

Overfitting of background segmentation training
In deep learning, overfitting is when the proposed method only memorizes the training data with limited generalizability, which means it cannot recognize new data. 35 Training and validation accuracies are both functions of the number of training epochs. Before the best epoch point, training and validation accuracies both increase with increments of epochs. When the training accuracy still increases while validation accuracy declines with an increment of epoch, a situation of overfitting occurs. The optimal number of epochs for training is where the validation’s error has its global minimum. The algorithm of the proposed method was further modified to output the best epoch during training based on early-stopping regularization, which prevents overfitting by automatically stopping the model’s training when the validation accuracy stopped improving.
Computing system
The network training and evaluation were programmed in Python 3.8.2. The Keras, an open-source neural network library written in Python, running on top of Tensorflow, and, in particular, the keras-segmentation library was used. All the simulations were accomplished through high-performance computing services on six cores of one of the Graphics Processing Unit nodes called Tesla V100 provided by the Denmark Technical University Computing Centre.
Specimens and test setup
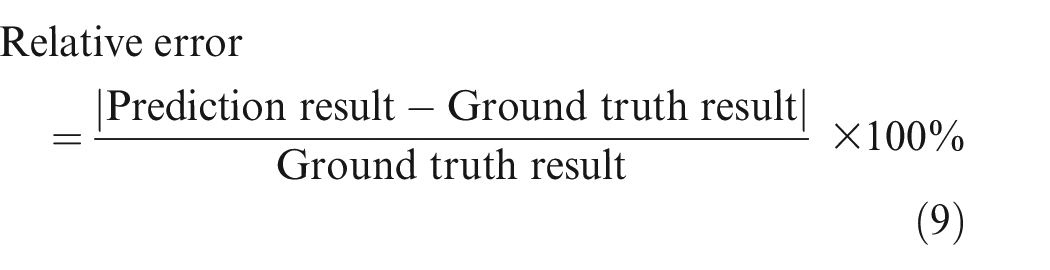
A 14.3-meter-long wind turbine blade has been loaded cyclically during a full-scale structural fatigue test in previous studies.4,6 Five artificial damages were introduced into the blade to trigger progressive damages under cyclic loading. The artificial damages were made by cutting the blade using a grinder with a diamond disc with a thickness of 2 mm. The damages initiated from these artificial damages during the fatigue test. More detail about the damages design can be found in Chen et al. 4 Figure 6 shows a summary of the test specimens and all damage sites.
A 14.3-meter-long full-scale composite wind turbine blade is under experimental investigation in this study with artificially introduced damages shown as red lines and progressive damage occurring during the fatigue test shown in yellow blocks.
The blade was tested under fatigue cyclic loading. The cyclic loads were applied through an in-house developed bi-axis fatigue exciter. A thermal camera FLIR A655SC was used to take thermal videos from about 7.5 m above the blades during the fatigue test. A regular optical camera is placed at the same location to provide ground truth images for comparison.
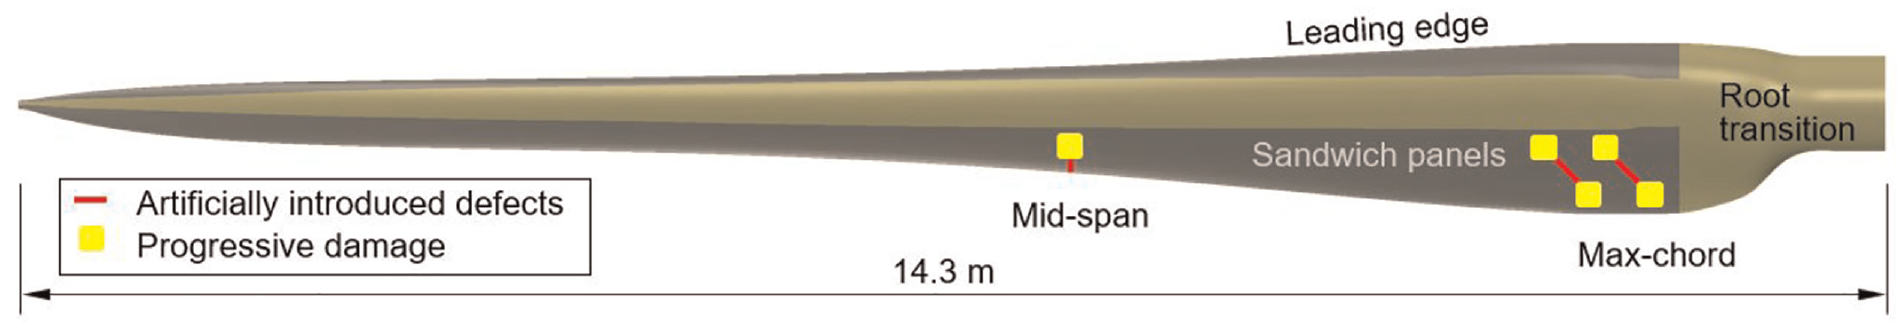
The thermal camera had an uncooled microbolometer detector with a resolution of 640 × 480 pixels and a pitch of 17 µm. The accuracy of measurement was ±2°C or ±2% of the reading. The thermal sensitivity measured by noise equivalent temperature difference is <30 mK. The field of view is 25° × 19°. All thermal videos were taken while the blade was subject to cyclic loading, allowing the thermal features to be distinct from the surroundings due to friction of materials along and inside the damage. The thermal video was taken when the thermal camera was placed in a fixed location on a tripod but rotated to take thermal images of different regions of the blade, resulting in a dynamic background in the videos. The purpose of taking this dynamic thermal video was to inspect all the damage sites distributed from the root and the mid-span of the blade in one single thermal inspection. Figure 7 shows two thermal image frames taken from the root and mid-span of the blade along with their corresponding optical images of the progressed damage showing that the complex geometry of the progressed damage is well captured by the thermal image.
The thermal and optical images of the blade when the focus of the thermal camera moves from the blade root towards the blade tip; (a) and (c) the original thermal images taken from root region and the mid-span of the blade along, and (b) and (d) their corresponding optical images, respectively, indicating the thermal image effectively captures the complex geometry of the progressive damage.
Results and discussions
Performance of different CNN models
The total of 1023 original thermal images (with 640 × 480 pixels resolutions) were used for automated background segmentation, where 948, 50, and 25 images were used to generate training, validation, and test dataset, respectively. Each image’s dataset was initially cropped into smaller images of 384 × 384 and subsequently cropped to 192 × 192. This process generated a total of 3792, 200, and 100 cropped images in each respective set. Six pre-trained deep learning models were explored, including Segnet, VGG-Segnet, Resnet50-Segnet, Unet, VGG-Unet, and Resnet50-Unet, to evaluate their background segmentation performance. The output of each network reported a binary mask, which was used to exclude the background. These masks were then used for segmenting the damages. Figure 8 shows the categorical accuracy of training, validation, and test procedures along epochs for the models to show the increase in accuracy. In all curves, the accuracy became flat before epoch 500, meaning that this value can ensure training against underfitting. Table 1 compares the segmentation results between all models based on the performance metrics in Section “Confusion matrix.” As observed, the VGG-Segnet/VGG-Unet and Resnets are more effective in achieving accurate results compared to Segnet and Unet, as these architectures consist of more convolutional layers to help the model learn high-level features and improve the result. On the other hand, the VGG-Segnet and Resnet50-Segnet results are closer to the ground truth than others, indicating that these networks can produce more valid segmentation results for the new and unseen images. However, the Resnet50-Segnet requires less training time to achieve the desired accuracy, taking about 154 epochs, while the VGG-Segnet requires 355 epochs (i.e., almost two times longer) to achieve similar result. As a result, the Resnet50-Segnet is selected for background segmentation step.
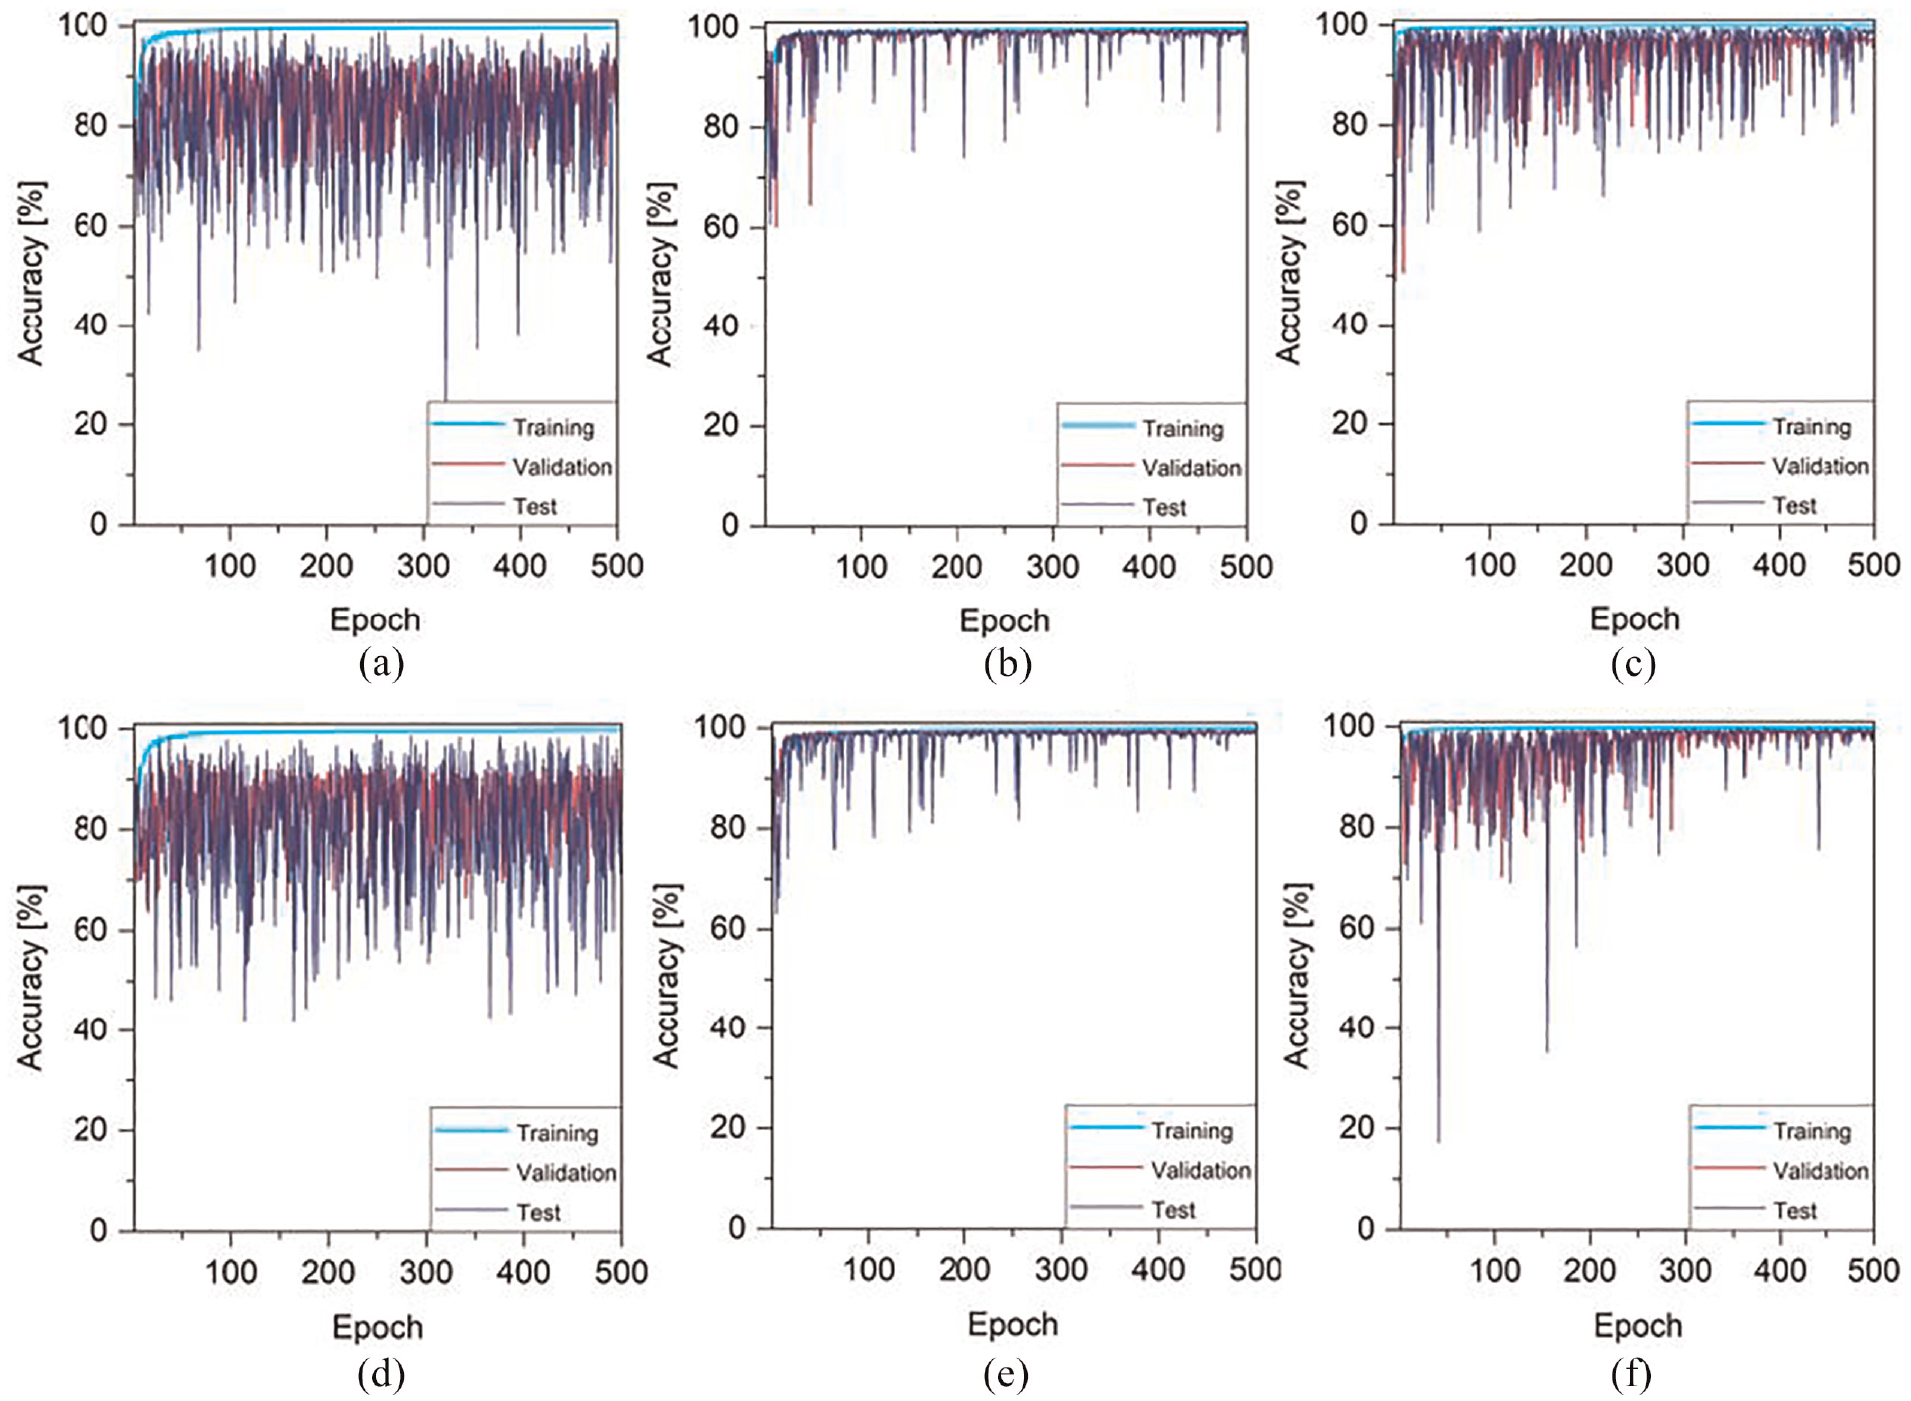
The accuracy of (a) Segnet, (b) VGG-Segnet, (c) Resnet50-Segnet, (d) Unet, (e) VGG-Unet, and (f) Resnet50-Unet, over the course of training. The accuracy is measured for each model on both the training and validation datasets, as well as on a testing dataset.
A summary of the models’ performance.

Effect of batch size
Many hyperparameters have to be tuned to train a CNN network for segmenting images efficiently. These hyperparameters directly impact the network’s performance along its time to convergence. One of the main hyperparameters is the batch size, 36 which is the number of images used in one epoch to train the network. Adjusting this hyperparameter too large can make the network take too long to achieve convergence (no more gain in accuracy); On the other hand, if it is too small, it makes the network bounce back and forth without achieving acceptable performance. At first, the batch size was set to 256, and herein, the effect of three other different batch sizes (32, 64, 128) on F1 score (as the weighted average of Precision and Recall) and processing time of the Resnet50-Segnet was investigated. Considering Figure 9, the F1 score of 128 batch size for both blade and background is as accurate as that of 256 but reduces the processing cost by nearly two times. The rest of this study used the 128 as batch size value.
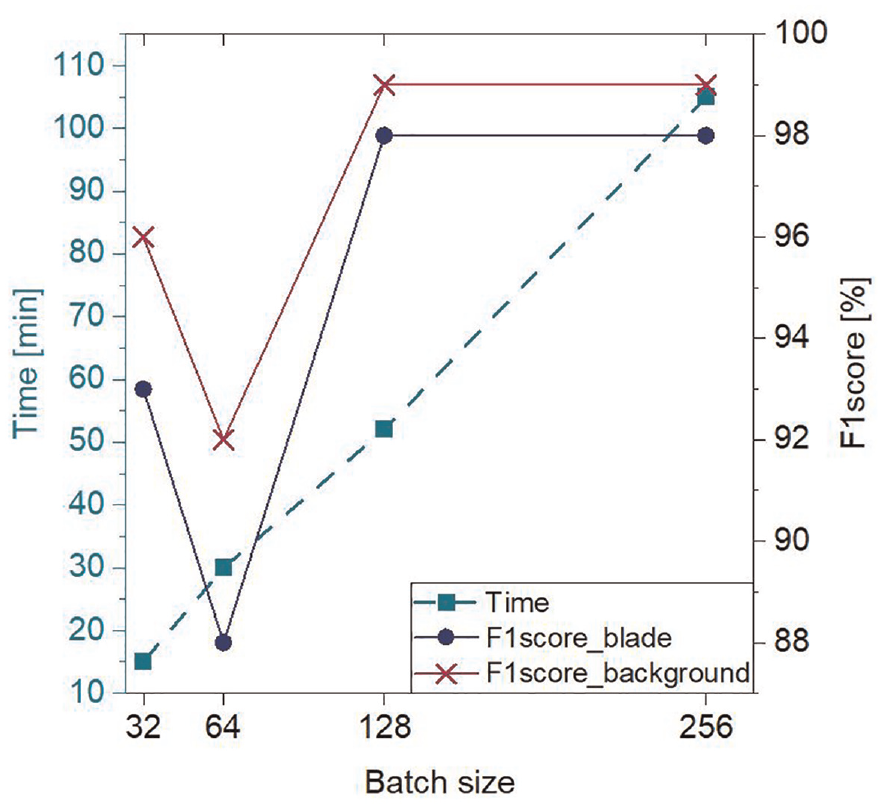
Effect of different batch size (32, 64, 128, and 256) on F1 score and processing time to optimize the training process and improve the efficiency of the segmentation model.
Effect of training dataset size
To estimate the required number of training images, a parametric study was conducted on datasets consisting of 240, 484, 968, 1936, and 3992 cropped images, each with a 192 × 192 pixel resolution, obtained from 60, 121, 242, 484, and 998 original images, respectively. Each dataset was selected to contain all imaging conditions, while the same test set was used for segmentation. As shown in Figure 10, even with a small training dataset of 240 (6% of the entire data) and 484 (12% of the entire data), the Resnet50-Segnet network produced results with an accuracy of over 88% for both blade and background segmentation. The accuracy of the network increased with the size of the training dataset and nearly stabilized with 968 training images (28% of the entire data), demonstrating the method’s efficiency with a relatively small training set. Thus, the number of training images was reduced to 968 cropped images, as this reduction does not lead to a substantial loss in the accuracy of the segmentation.
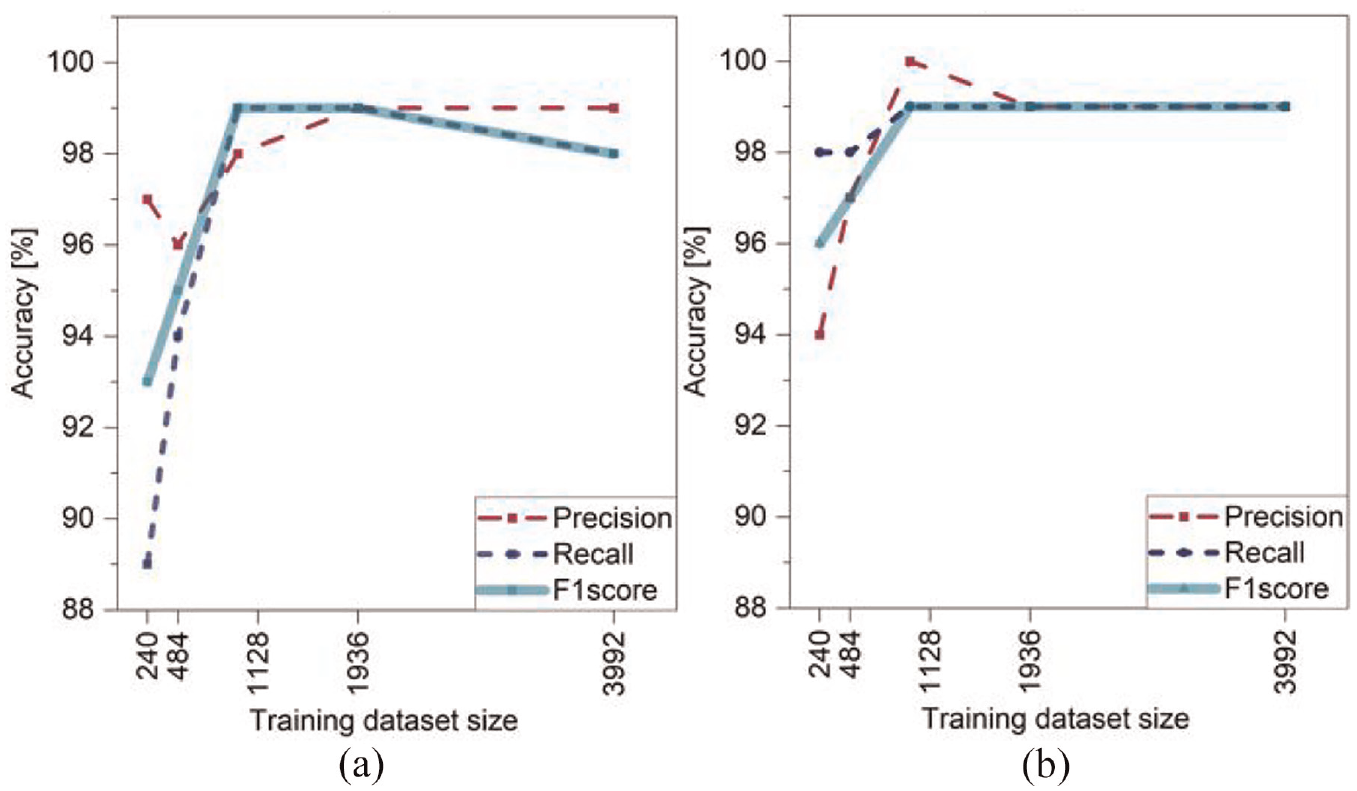
Parametric study on training dataset size based on precision, recall, and F1 score for; (a) blade segmentation and (b) background segmentation.
Figure 11 depicts the (a) original thermal image, (b) the ground truth, (c) the Resnet50-Segnet result, and (d) the background removal result for four unseen images captured under various illumination conditions and camera distances, where the camera distance is closely linked to the blade’s position in the image frames. As Figure 11 demonstrates, the proposed method accurately isolates the blade and removes complex backgrounds in images, while remaining robust to changes in illumination conditions and camera distance.
Test result of automated background segmentation: (a) original image, (b) Ground truth, (c) the proposed model segmentation, and (d) the background removal result.
Automated damage segmentation
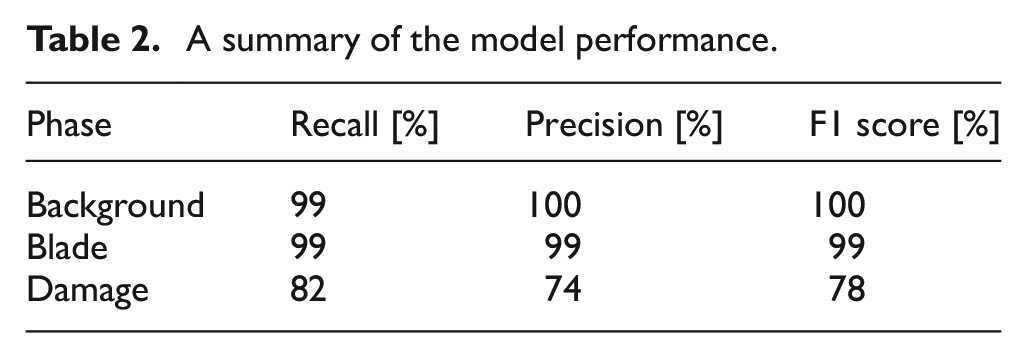
The dataset for the damage segmentation step was built using the 968 training and validation background removal images generated in the previous step, along with the test results. For the Resnet50-Segnet damage segmentation, the same parameters were assigned as those for Resnet50-Segnet background segmentation, including initial weights = Imagenet, epoch = 500, optimizer = Adadelta, batch size = 128, and max pooling between convolutional layers. To evaluate the performance of the damage segmentation model over test dataset, the data in the confusion matrix was used (Table 2 and Figure 12), where the following conclusions can be drawn: (1) the test results are approximate to the ground truths, which means that the proposed damage segmentation method correctly segments actual pixels of each phase as many as possible. (2) The blade and background have higher recall and precision which can be attributed to fewer FN and FP errors, respectively, in identifying these two phases’ pixels through the test images. This is because these phases constitute a significant proportion of the utilized images and are therefore easier to predict. (3) The number of damage pixels that were falsely predicted as background ones or vice versa is zero, since there are no transition regions between these two phases. (4) The damage phase obtained the lowest precision among the other phases. This inferiority is due to high FP error, that is, 0.10% of the “blade” (the second most populated phase) was predicted as damage.
A summary of the model performance.
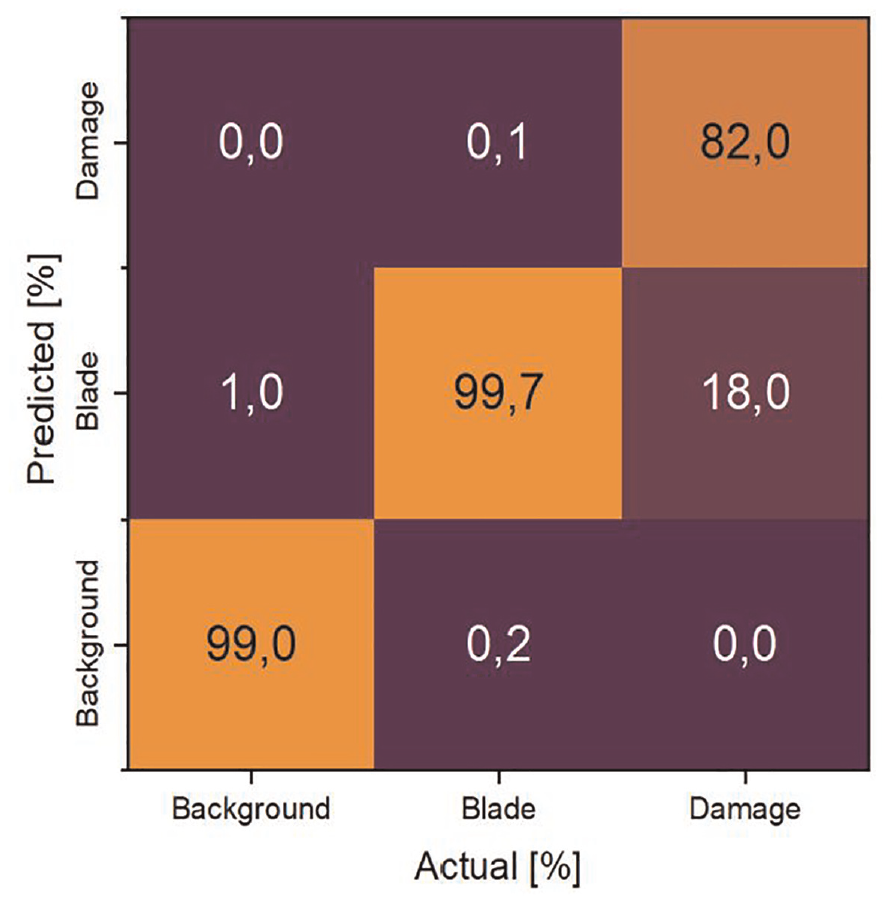
Confusion matrix to compare the actual labels against the predicted ones of the test dataset, where the diagonal cells from top right to bottom left represent the percentage of correct predictions, while off-diagonal cells represent incorrect predictions.
Figure 13 is used to demonstrate the extent to which the model overestimated or underestimated each phase over the test images by providing a visual representation of the proportionality between the FP and FN errors based on ground truth pixels against predicted ones. Upon observation, the data for background and blade segmentation fall approximately on the ideal line, where the FP and FN errors are zero, indicating exceptional segmentation quality for these phases by the model.
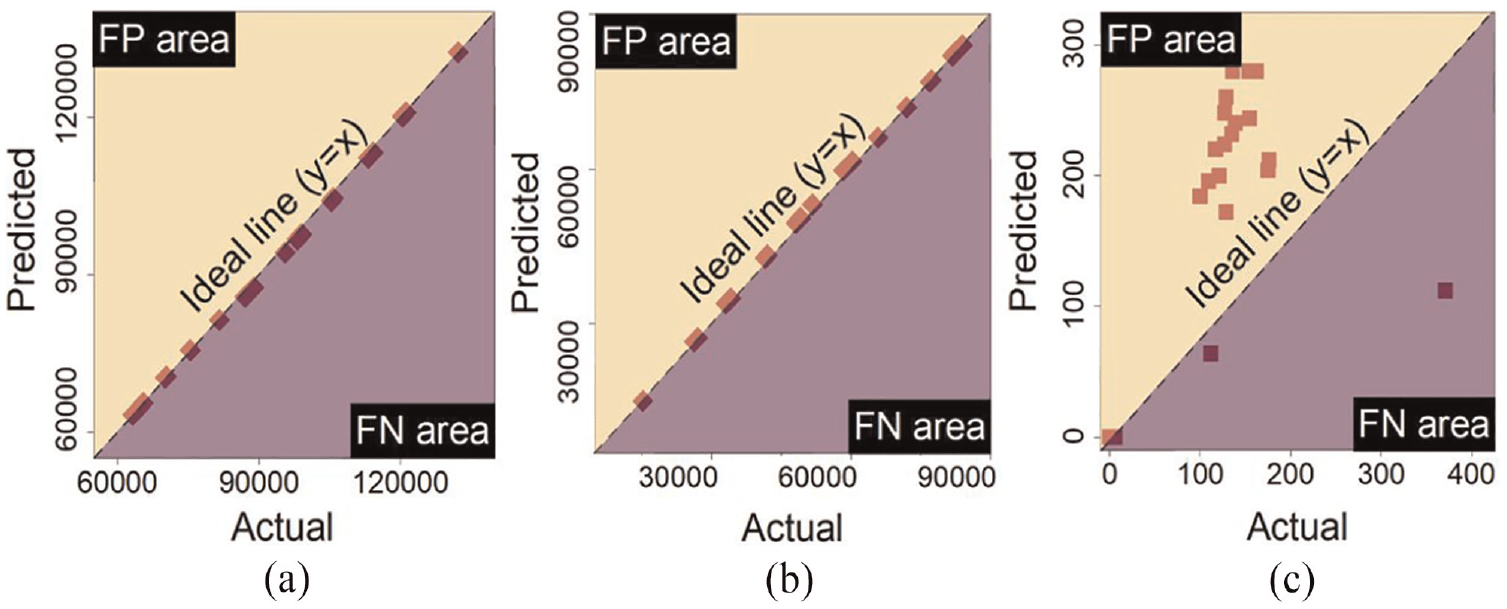
Actual values against the predicted values by the model in each phase over the test data in red marks to indicate where the model either overestimated or underestimated the actual value using the proportional of the data located in the false negative or false positive area. The ideal line y = x, is dashed black. (a) Background, (b) Blade, and (c) Damage.
The damage segmentation data is predominantly located in the FP area, indicating that the model overestimated this phase. This overestimation may be explained by one of two factors: (1) either due to blurring from motion or errors around damage boundaries, the damages were detected thicker than they are, or (2) non-damaged thermal features on the blade were being falsely segmented as damaged ones by the model.
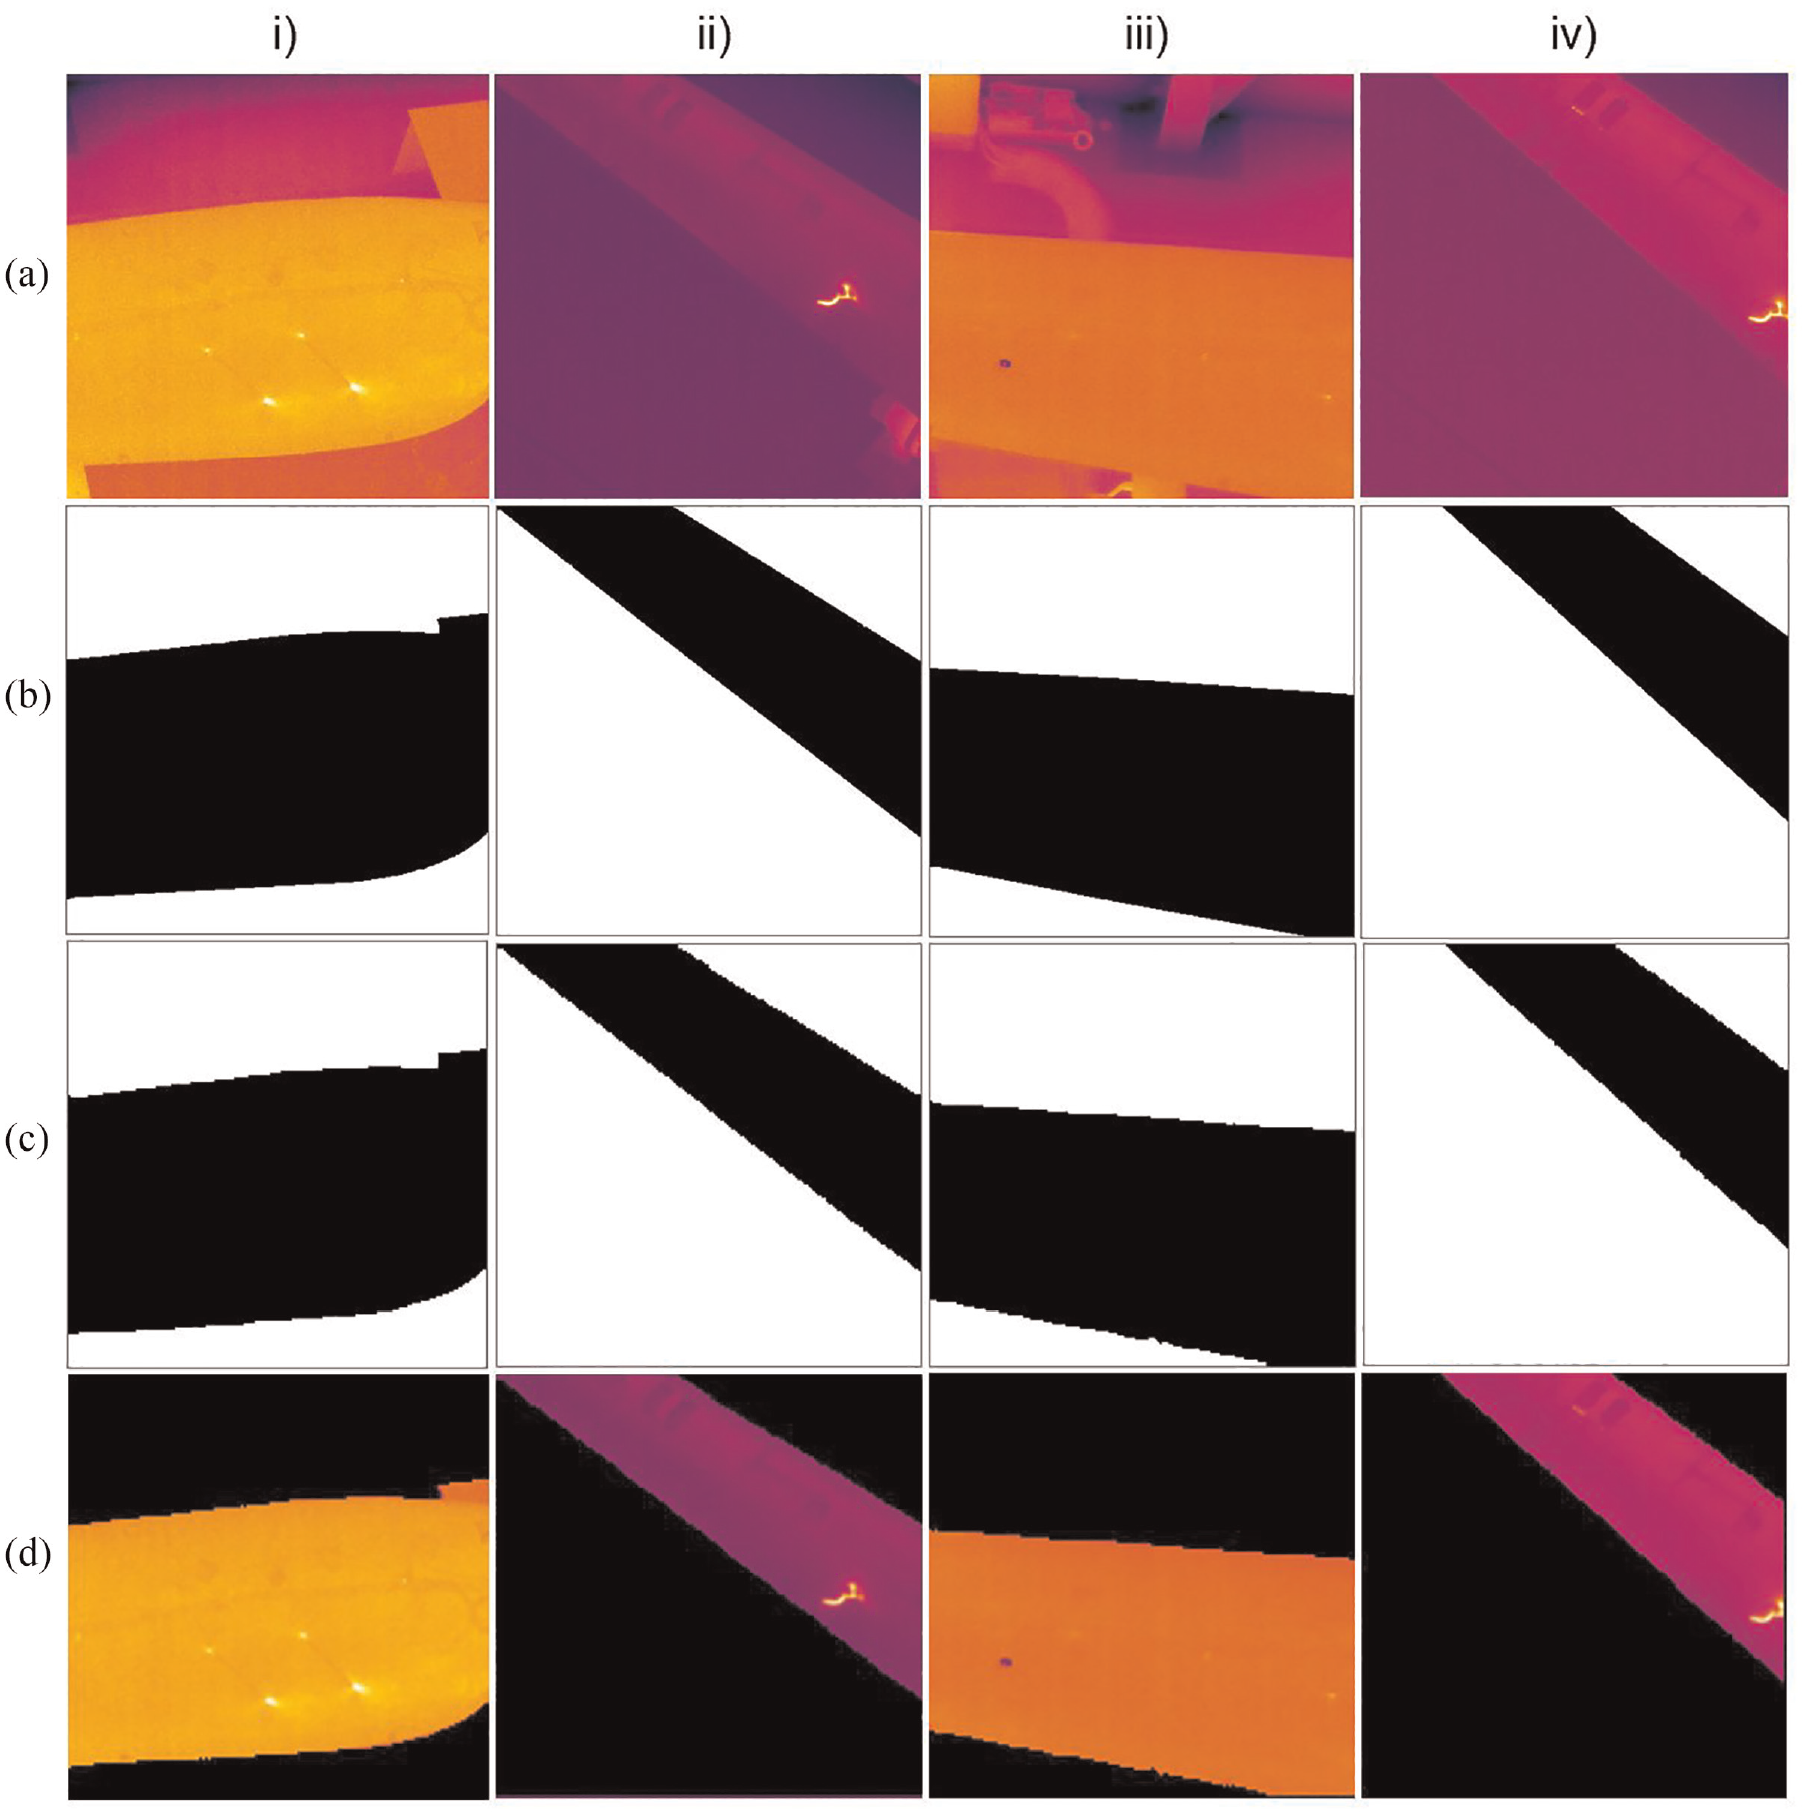
Figure 14 provides a comprehensive overview of the model’s performance on four different test images, including: (a) original thermal images, (b) the corresponding background removals, (c) the ground truths, and (d) the proposed model results. These images offer a clear understanding of our framework’s functionality. The results show that: (1) the model was not able to detect very small damages, as Figure 14(d-iii), since small damage features have less chance to be recognized by the network during training as the input image gets smaller while the image passes through the network. 37 (2) the model was not prone to falsely segment the non-damage’s thermal features on the blade as damage features (see Figure 14(a-iv)). This suppresses the CNN-based segmentation models compared to the thresholding segmentation methods in which these methods are based on small convolutional kernels combined in a deep architecture, enabling them to consider both color and texture simultaneously. 38 (3) The model segmented damages thicker due to blurring from fast motion and errors around damage boundaries (see Figure 14(b-ii) and (d-iv)). (4) The performances of the proposed method were not susceptible to the varying illumination and distance between the blade and the camera. (5) The detailed damage geometry in Figure 7 agrees with the result of the automated damage segmentation model (see Figure 15). This indicates that the automated damage segmentation model was effective in identifying and segmenting areas of damage within the material, with a reasonable level of agreement between the detailed damage geometry observed in the optical images and the outcome of the model. This suggests that the automated damage segmentation model has the potential to be an accurate and reliable tool for detecting structural damages efficiently in a range of applications.
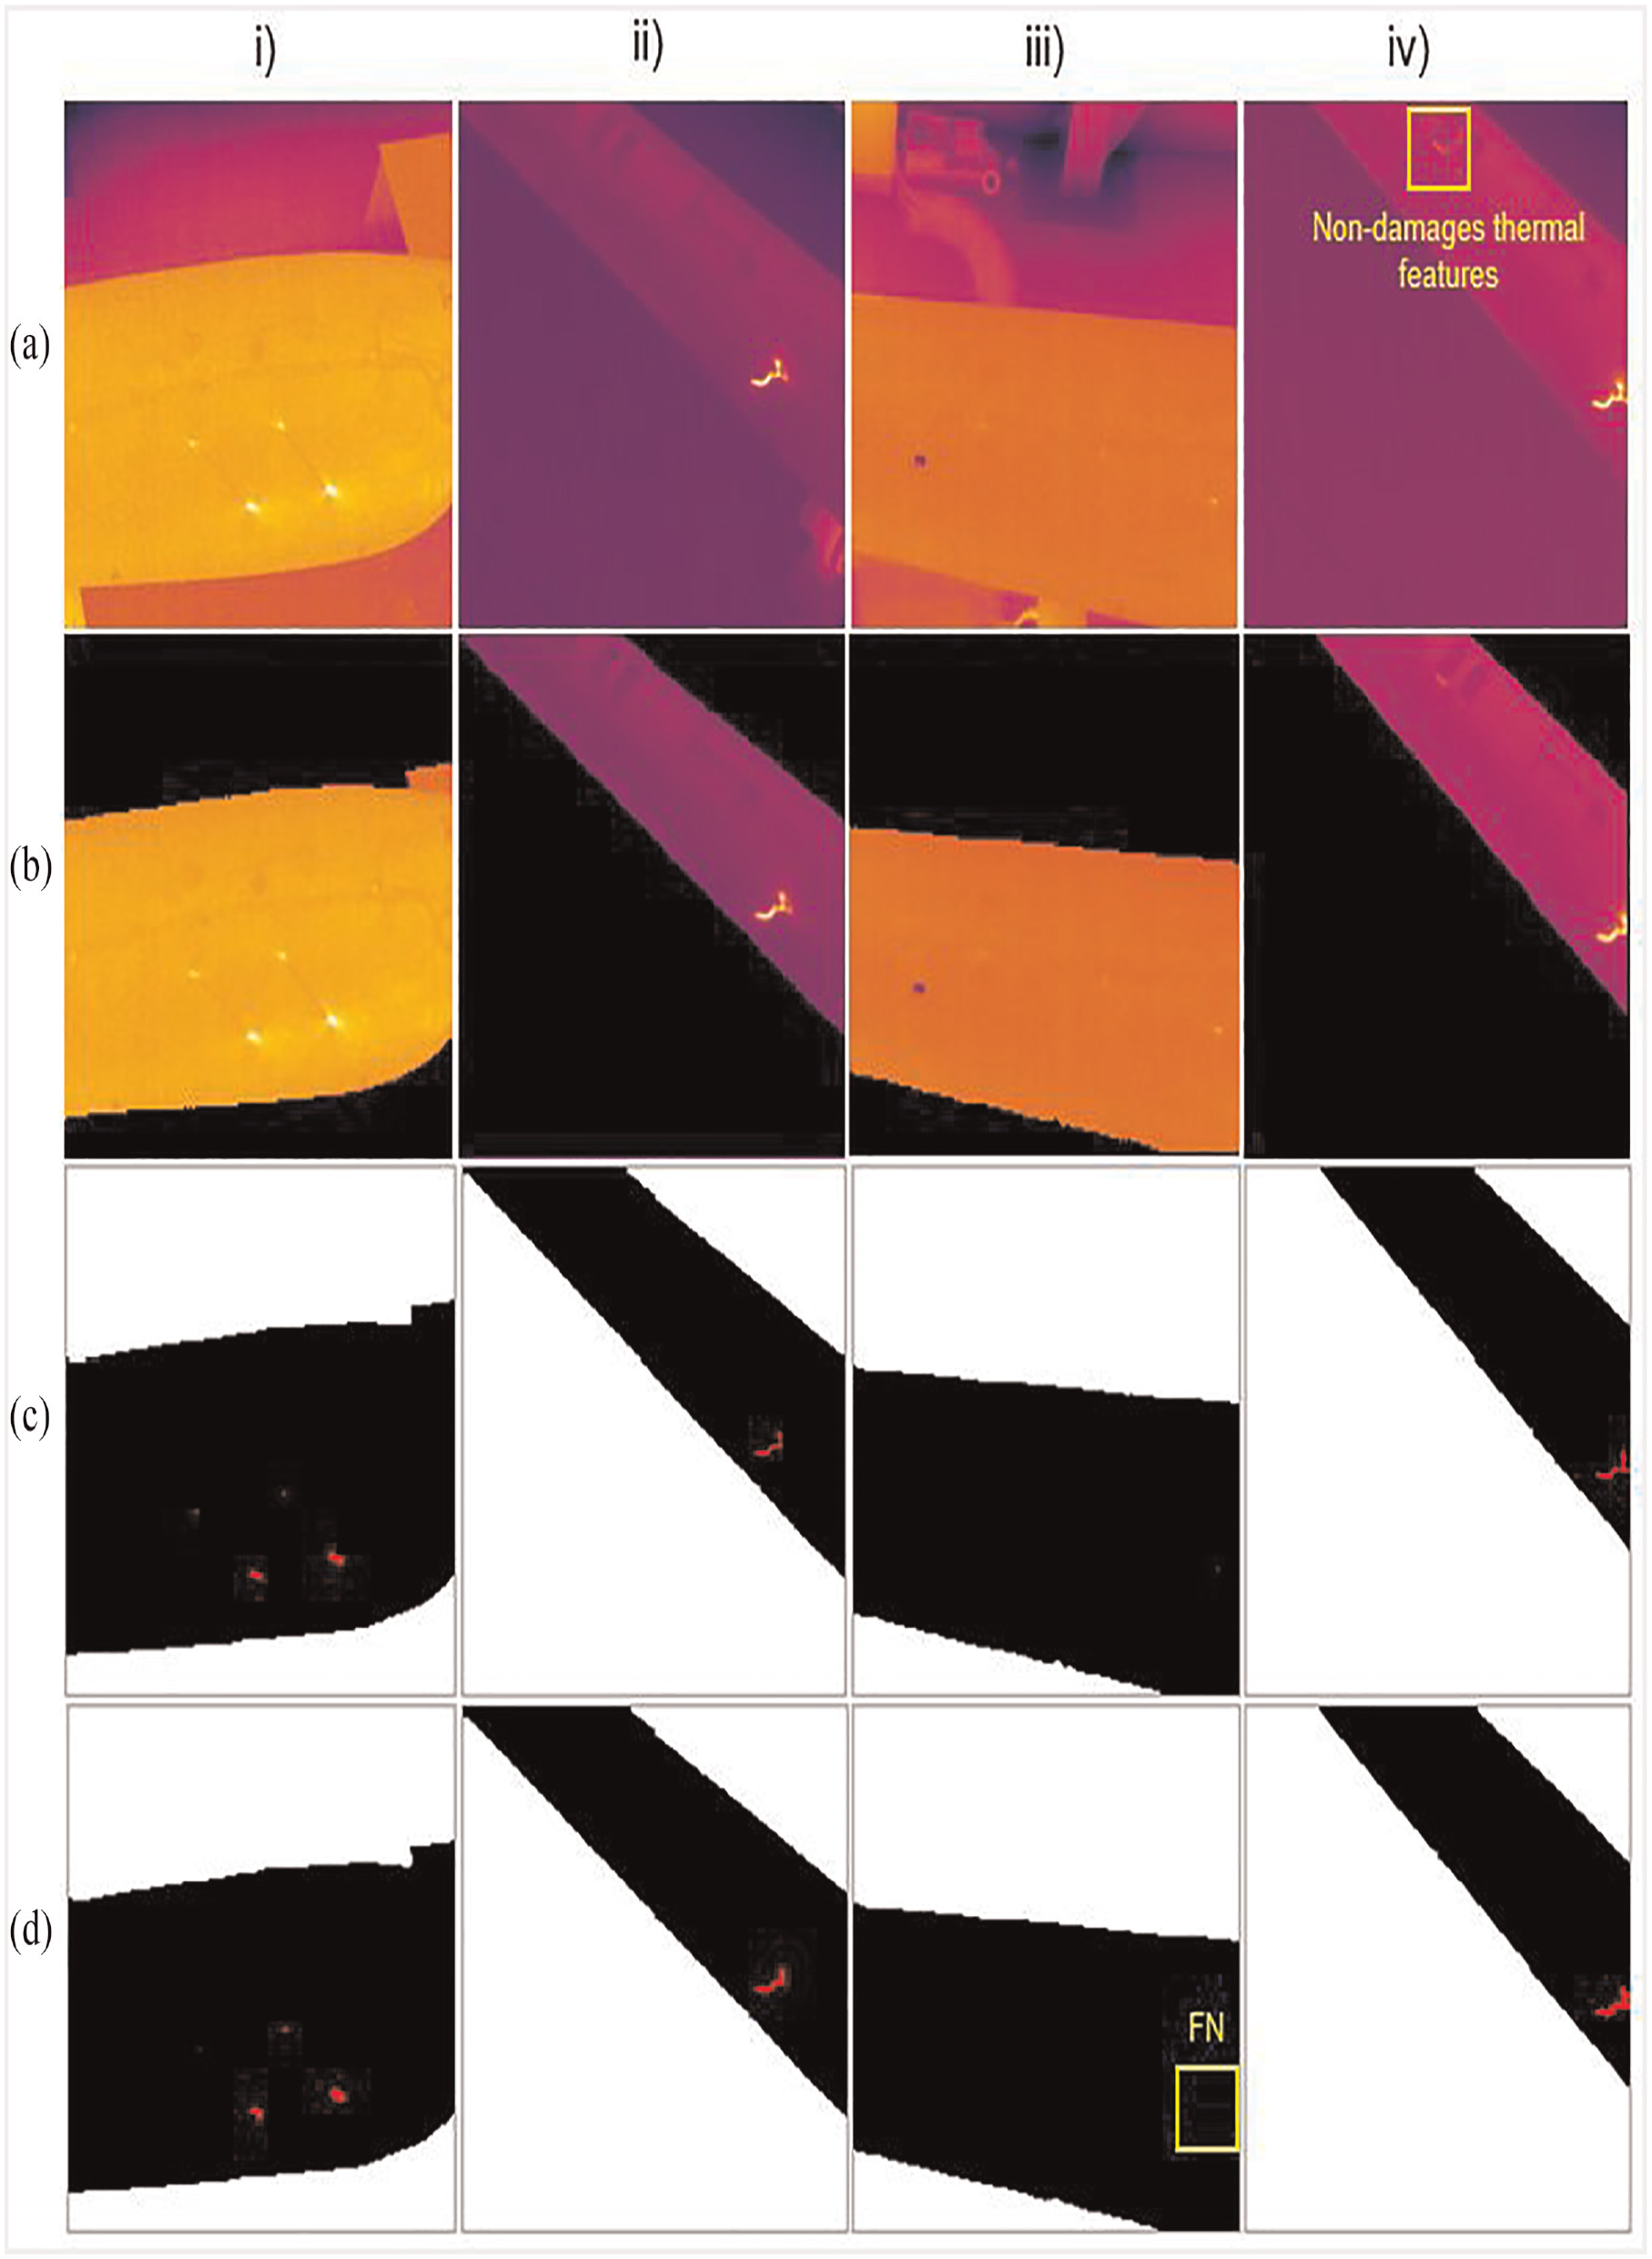
Test result of automated damage segmentation: (a) original image, (b) background removal, (c) ground truth, and (d) proposed model result.
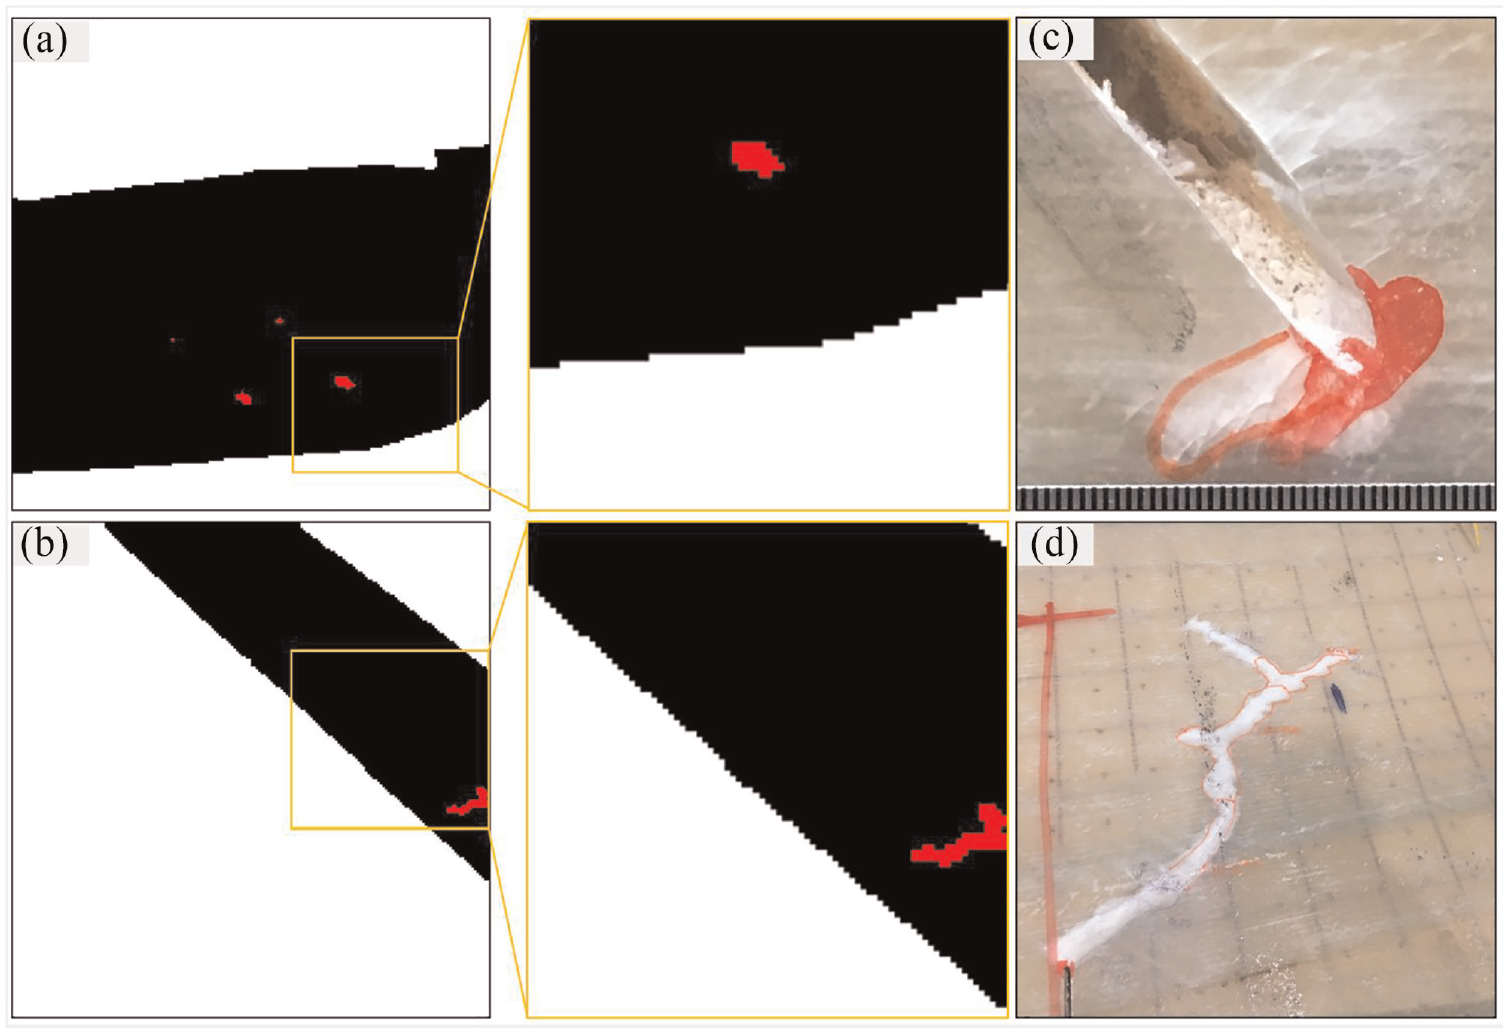
Test results of the proposed model indicating the geometry of damage in optical images preserved by the automated damage segmentation model. (a) and (b) proposed model results, (c) and (d) crack geometry from optical camera.
Conclusions
This study proposes a novel deep learning-based inspection method using passive thermography to automatically segment complex background of thermal images taken from a laboratory wind turbine blade under cyclic loading and eventually segment the blade damages. This method does not require manual selection of image features and it improves the accuracy of segmentation by using the feature extraction capability of deep learning models. The performance of the trained model was evaluated on test images and the main findings are:
The performance of the proposed model is not affected by other objects with higher temperature responses in the image’s background. Therefore, the model can remove the complex thermal background with a recall rate of 99%.
The model is not sensitive to the camera’s distance; thus, it can isolate the vibrating blade even if the blade doesn’t have a fixed position in the sequential images.
The model does not segment other hot spot features in the blade as damage features since it considers both intensity and texture.
Very few images are required to train the network with reasonable accuracy as the model effectively identifies the features which contain discriminative information.
The accuracy of the damage segmentation results may be affected by blurring caused by blade motion, potentially leading to an overestimation of the damage size, where a recall of 84% is achieved.
To tackle the last finding, a damage detection step could be added before the damage segmentation. By detecting the damaged areas beforehand, the segmentation method can focus only on those areas rather than on the non-damaged regions. Alternatively, a thermal camera with a higher frame rate can be used to capture the motion more accurately. This could be the topic of our future research. Nevertheless, the proposed method shows great potential for automatic passive thermographic in-field inspection of wind turbine blades under complex background, which potentially does not require stopping the normal operation of the wind turbines. It should be noted that, in this study, the developed algorithm extracts damage features from the seen operating condition, which means that both the training and testing images follow the same statistical characterization. However, it is crucial to evaluate the performance of the model on unseen operating conditions to ensure its robustness and applicability in real-world scenario. To achieve this goal, our future work aims to enhance the generalization ability of the proposed framework.
Footnotes
Declaration of conflicting interests
The author(s) declared no potential conflicts of interest with respect to the research, authorship, and/or publication of this article.
Funding
The author(s) disclosed receipt of the following financial support for the research, authorship, and/or publication of this article: This study is supported by the QualiDrone Project (Intelligent, autonomous drone inspection of large structures within the energy industry, 64020-2099) and the AQUADA-GO project (Automated blade damage detection and near real-time evaluation for operational offshore wind turbines, 64022-1025) through the Danish Energy Technology Development and Demonstration Program (EUDP) of Denmark, and by the AINDT project (AI-based NDT for reduced service costs for wind turbine blades) through the Innovation Fund Denmark (0224-0011A).
Supplemental material
Supplemental material for this article is available online.
References
Supplementary Material
Please find the following supplemental material available below.
For Open Access articles published under a Creative Commons License, all supplemental material carries the same license as the article it is associated with.
For non-Open Access articles published, all supplemental material carries a non-exclusive license, and permission requests for re-use of supplemental material or any part of supplemental material shall be sent directly to the copyright owner as specified in the copyright notice associated with the article.