
Abstract
An integrated system is proposed to visualize subsurface barely visible impact damage (BVID) in composite structures using three-dimensional (3D) digital image correlation (3D DIC). This system uses a pair of digital cameras to record video frames in the field-of-view (FOV) of the structure’s surface, capturing the wavefield generated via chirp excitation in the near-ultrasonic frequency range. Significant pitfalls of previous efforts of damage imaging using two-dimensional DIC have been largely mitigated. First, 3D DIC enables capturing out-of-plane displacements, which are much larger in amplitude versus in-plane displacements that a single camera would be limited to sensing, thus increasing the signal-to-noise ratio. This enhancement in turn increases the sensitivity of the stereo-camera system. Second, a total wave energy (TWE) damage imaging condition is proposed to visualize the local damage region. The monogenic signal obtained via Reisz transform (RT) is employed to compute the instantaneous amplitude, with which the local wave energy can be calculated spatially over time. Since a high displacement amplitude and thus high wave energy will occur in the damage region due to the local resonance, the proposed TWE imaging condition can relax the Nyquist sampling requirement, unlike guided-wave-based structural health monitoring techniques which require fully reconstructing the wavefield and wave modes through sampling that satisfies the Nyquist criterion. As such, a much lower camera frame rate is adequate for the proposed system. Consequently, the maximum spatial resolution of the camera for a given FOV can be achieved at the expense of a reduced frame rate. With the maximized pixel resolution and reduced frame rate for employing the TWE imaging condition, composite structures can be inspected or monitored with a larger FOV. As a result, there is no longer any need to apply signal enhancement techniques, such as sample interleaving, image stitching, or averaging, to increase the effective performance of the camera. Rather than needing thousands of repeated videos for minimizing the incoherent noise, only a single stereo-video with a few seconds of sampling duration is necessary for damage imaging. The use of a powerful piezo-shaker also increases the wave signal amplitude and further enhances sensitivity without permanent adhesion. To demonstrate this stereo-camera concept with the TWE imaging condition, the system was used to image damage in two carbon fiber reinforced polymer composite honeycomb panels, which had been subjected to low-velocity impacts (2 J). For each panel, two excitation configurations were used to verify the robustness of the system. Initial damage maps produced for a 100 × 100-mm FOV using a three-second stereo-video show accurate damage imaging ability that is independent of excitation location and comparable to benchmark damage images computed from laser Doppler vibrometer data and those gathered from ultrasonic and X-ray computerized tomography scans. This efficient and reliable integrated system demonstrated high potential for in-time damage inspection on composite aircraft and other critical structures.
Keywords
Introduction
The use of carbon fiber reinforced polymer (CFRP) composites and composite honeycomb structures in the aerospace and automotive industry has been growing steadily because they offer high stiffness-to-weight and strength-to-weight ratios, ease of construction, corrosion/chemical resistance, and are non-conductive. However, composite structures are highly vulnerable to impact damage 1 due to the brittle behavior of the matrix and low through-thickness strength. Low-velocity impacts may occur during service, like those from bird strikes, hail, and runway debris, or outside service, like if a tool is dropped during maintenance. These impacts can induce damage unique to CFRP composites, including subsurface delamination and crushed core. This damage can significantly reduce structural integrity but may leave very little evidence on the surface since surface indentations can be too small to be observed. Under low-velocity impact, this subsurface damage is known as barely visible impact damage (BVID). Since traditional visual inspection techniques cannot confidently detect BVID, more robust methods of BVID inspection are needed to ensure safety and reduce inspection time and cost.
There has been significant interest in ultrasonic guided-wave-based techniques for practical nondestructive inspection (NDI) and structural health monitoring (SHM) to monitor critical structural components in aircraft and spacecraft and reduce the risk of catastrophic failure due to damage like BVID.2–6 These techniques are based on the interaction of guided (Lamb) waves with boundaries and geometric/material discontinuities as they propagate in plate-like structures. Guided waves are able to propagate across the structure without significant attenuation, 7 which makes these techniques appropriate for large-scale inspection. Thus, they can be utilized to interrogate large, thin structures, like aircraft skins.
BVID in composites creates discontinuities in mechanical properties. When guided waves propagate over the damaged area, the BVID generates wave reflections/refractions to produce new localized wave modes and, subsequently, local resonance vibrations from wave energy trapped within damage boundaries if the appropriate signal frequency content is applied. By either measuring the guided waves with a sensor array or reconstructing the wavefield in the region of interest (ROI), signal or image processing techniques can then be applied to extract this information hidden within the signals by looking for evidence of geometric discontinuities. Guided-wave-based inspection techniques can be used to not only detect and isolate damage, but also uncover details about the location, size, and severity of any hidden damage that may be present. Ultimately, the goal of most guided-wave-based structural health monitoring (GWSHM) techniques is to produce a damage map to visualize any hidden damage within the structure. An up-to-date review of GWSHM for aircraft applications is provided in the study by Philibert et al. 8
GWSHM techniques can be broadly classified as active or passive. Active techniques use a well-controlled artificial actuation source with a dedicated power supply to excite ultrasonic guided waves throughout the ROI, while passive techniques use guided waves that emanate from an impact source 9 or acoustic emission,10,11 or from ambient disturbances generated naturally from turbulent flows. 12 For both sensing methods, the wavefield can be measured using either contact (i.e., a network of piezoelectric (PZT) sensor arrays13,14) or fully non-contact means (i.e., air-coupled transducers, laser Doppler vibrometer (LDV)15–20). Contact methods like PZT arrays add parasitic mass to the structure and can even reduce structural integrity. Additionally, the resolution of the system is dependent on the number of sensors attached to the structure, and indirect estimation of the damage location typically involves computationally intensive algorithms.
Non-contact methods are often preferred because they require no connection to the structure, so a single system may be applied to multiple structures or applications. The scanning LDV is generally considered the most accurate non-contact method for remotely investigating full-field ultrasonic guided-wave propagation; however, it is limited to point-by-point sensing. 21 This process of measuring one point at a time can be extremely time-consuming, especially at the spatial resolution required to adequately reconstruct the full wavefield. Also, the physical excitation must be repeated for each sensing event, so slight changes in the excitation and/or the system itself over the repeated sensing cycles can lead to significant consistency issues.
To overcome limitations with resolution and sensing time, a method that can concurrently capture the entire ROI is desired. Optical methods offer a solution to these limitations since digital cameras can instantaneously image a surface with an array of sensors (pixels). Optical laser-based sensing methods, such as interferometric techniques like Moiré interferometry, holographic interferometry, speckle pattern interferometry, and sherography, enable remote full-field measurement of surface deformations and deformation gradients. 22 However, they generally require a coherent light source and very carefully controlled laboratory conditions, which limits their practicality for NDI/SHM.
Digital image correlation (DIC) is a non-interferometric optical technique that is well-developed and has been used extensively as a practical and reliable tool for full-field measurement of contour or surface deformations in the field. DIC extracts displacements from images of a structure’s surface by comparing images captured before and after deformation. Compared to other techniques, it is less sensitive to ambient factors, and white light can be used for illumination instead of a coherent laser source. Also, unlike other interferometric techniques (which often present results in the form of fringe patterns), phase analysis of fringe patterns and subsequent phase unwrapping processes are not required. These significant advantages over interferometric optical techniques and the reliability and practicality of the method make DIC suitable for in-field NDI/SHM applications and a prime candidate for guided wavefield measurement (Table 1).
Comparison of popular SHM and NDI methods for aerospace structures.
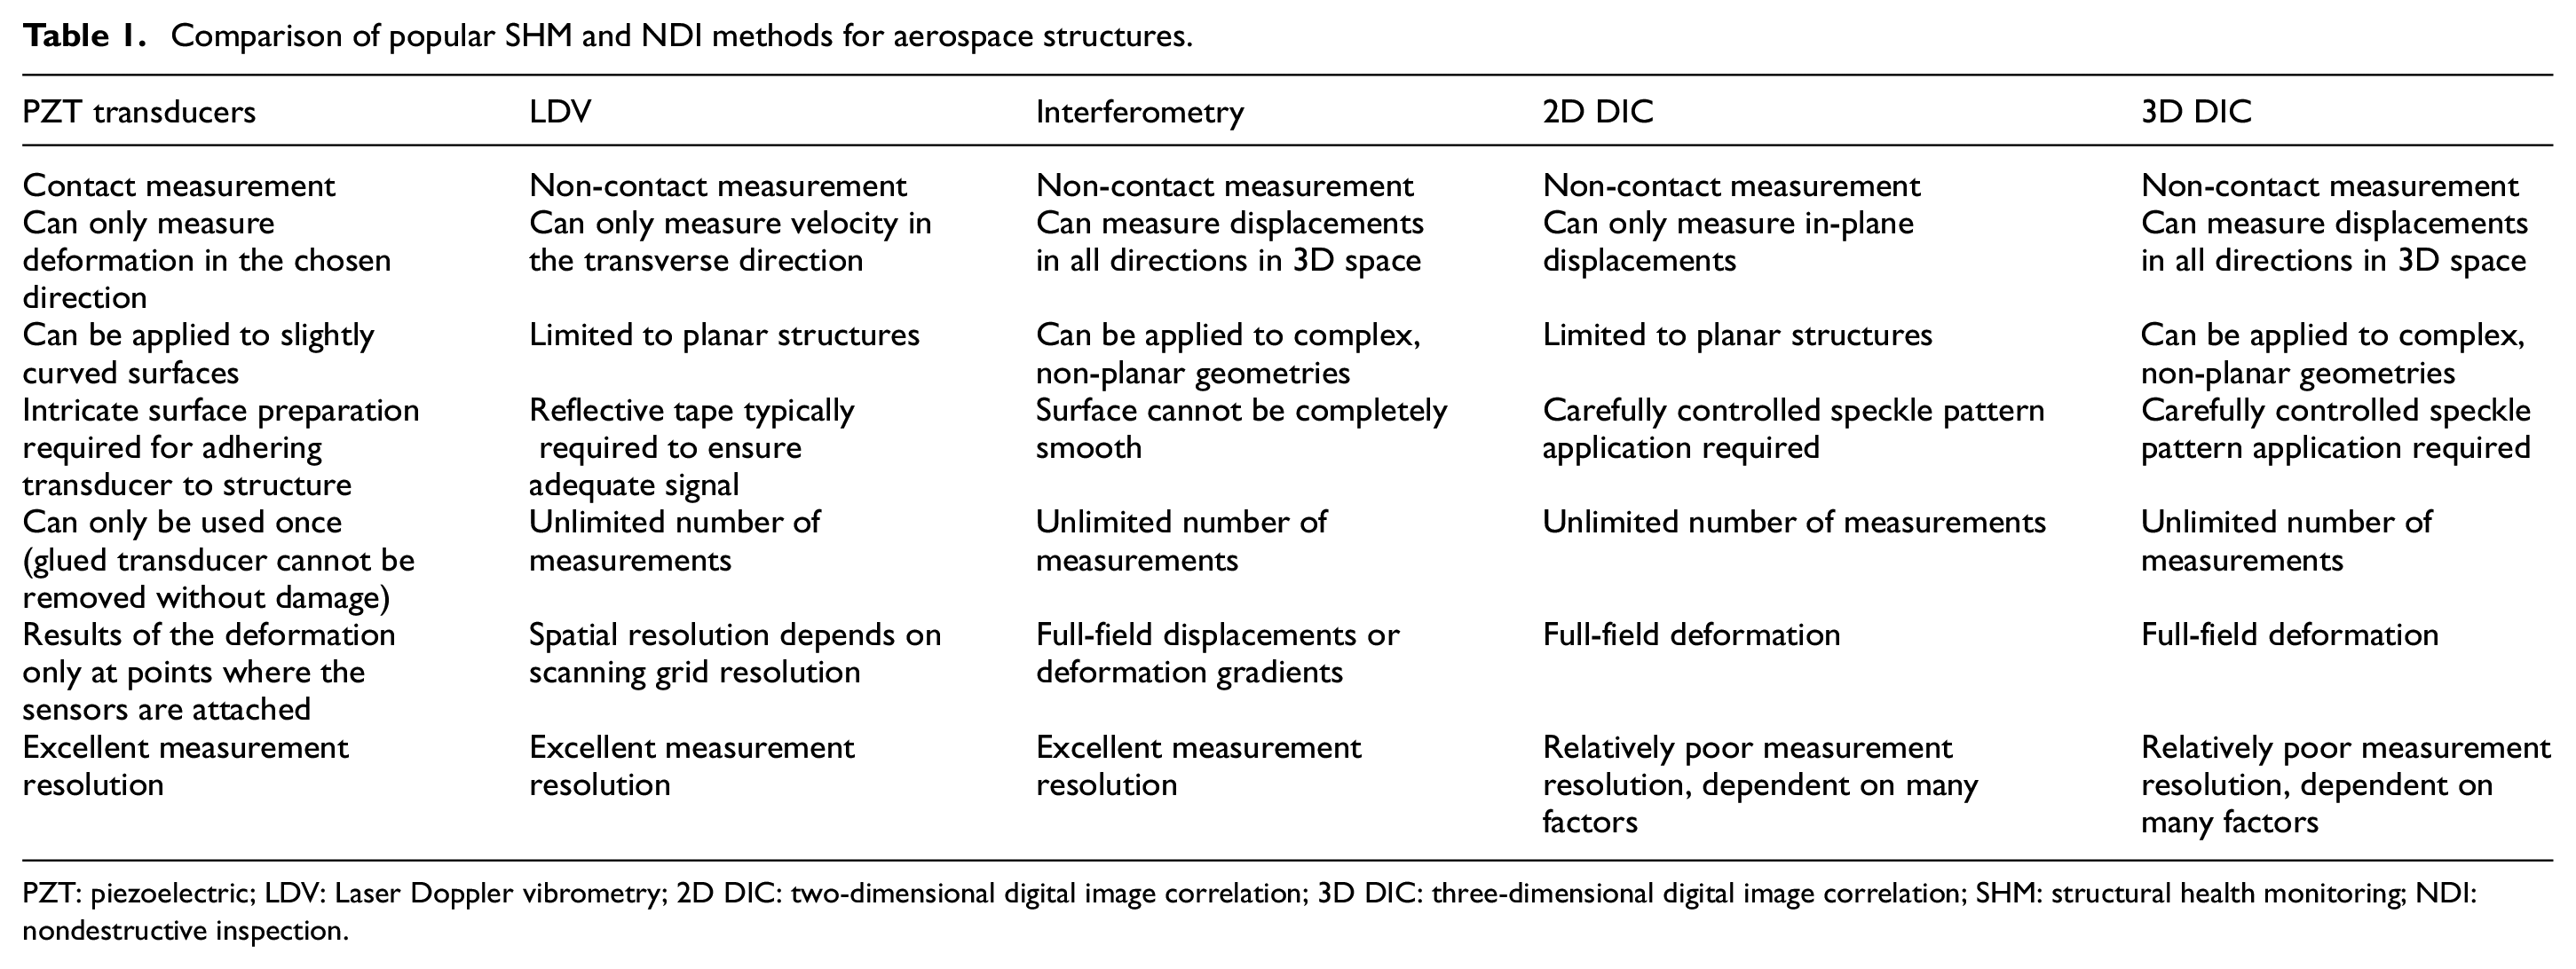
PZT: piezoelectric; LDV: Laser Doppler vibrometry; 2D DIC: two-dimensional digital image correlation; 3D DIC: three-dimensional digital image correlation; SHM: structural health monitoring; NDI: nondestructive inspection.
The DIC system also has some limitations that should be noted. First, the accuracy of the system depends on natural lighting conditions. For recording at high sampling rates, it is also necessary to apply artificial lighting to ensure there is sufficient lighting at high shutter speeds. Second, the current need for an artificial black-and-white speckle pattern limits most applications to laboratory environments. Third, the DIC algorithm can be computationally expensive. Lastly, a significant amount of storage is required to archive recorded images and obtain displacement results. Future work has already been planned to mitigate the latter three limitations.
For DIC, a speckle pattern (random black and white intensity pattern) applied onto the surface acts as the carrier of deformation information to acquire reliable and accurate matching of subsets (or localized windows). The algorithm matches these subsets in the deformed speckle images to a reference undeformed speckle image by comparing the grayscale intensity changes to track the subset movement and obtain the local deformation. Generally, the speckle pattern used is generated using one of three methods: illumination of the surface with a laser (laser speckle pattern), applying artificial (painted) random speckles, or using the natural texture of the object surface. 23 Laser speckle patterns are used with the interferometric techniques mentioned above and suffer from the same limitations. Artificial speckle patterns are typically used for DIC since they provide the best control over speckle size and contrast. However, practical application is limited due to the need to apply an artificial speckle pattern. This paper uses DIC with artificial speckle patterns, but a printed speckle pattern is implemented that can be quickly and easily applied and removed.
Natural textural patterns for optical vibration measurement have been explored. For example, Kumar et al. 24 integrated several robust feature detection methodologies as a substitute for applied artificial speckles on large structures. Bhowmick et al.25,26 gathered continuous vibration data from real videos by tracking the edges of structural components. However, these efforts have been limited to gathering large-scale low-frequency vibration from a few points or lines using edges and other image features. Future efforts by the authors will explore natural features as a means for continuous wavefield analysis for damage imaging to reduce the need for surface preparation.
Though the first known use of image processing dates to the 1960s, the measurement of surface deformation using DIC began in 1982 when Peters and Ranson 27 established a foundation for extracting full-field displacement measurements from digitized two-dimensional (2D) images of a planar specimen undergoing in-plane deformations. This marked the first use of computer vision for measuring 2D deformation and deformation gradients. Chu et al. 28 expanded on this idea and developed the mathematical theory of DIC, performing several validation experiments to demonstrate the viability of the proposed methodology. Advances in DIC up to the early 2000s have been summarized by Sutton et al., 29 a review of 2D DIC was provided by Pan et al., 30 and recent advances and applications of DIC have been reviewed by Sutton et al. 31 and Pan. 32
While 2D DIC provides an accurate method of reconstructing full-field in-plane deformation and deformation gradients, its application is limited to planar surfaces under strictly controlled conditions and is very susceptible to out-of-plane displacement. 33 To overcome these limitations of 2D DIC for practical engineering measurements, Luo et al. 34 and Chao et al. 35 extended 2D DIC to three-dimensional (3D) DIC in 1993 for making full-field 3D displacement and strain measurements. Based on the principle of binocular stereovision, 3D DIC uses two synchronized cameras to measure all three components of surface displacement through triangulation. First, the stereo-camera system must be calibrated to determine the intrinsic and extrinsic parameters of the system. After these parameters are known, subsets of the speckle images from each camera are correlated with each other based on the projections of the subsets into three-dimensional space and the triangulation principle. This type of correlation provides the estimated location of the 3D surface coordinates in the world coordinate system. Through this stereo-correlation process, 3D DIC techniques can simultaneously measure both in-plane and out-of-plane deformations based on the distance between the reconstructed 3D coordinates of the deformed and initial reference states. Additionally, since surface points are constructed in three dimensions, 3D DIC is not limited to flat plates. Stereovision enables 3D DIC to be applied to more complex geometries for full-field sampling of non-planar structures. Due to these useful capabilities, 3D DIC is generally considered more useful and practical than 2D DIC for real applications.
It is worth noting that the employment of two cameras and the stereo matching needed to correlate corresponding images from the cameras increases the computational load by approximately three times that of 2D DIC. However, the time required for data collection is significantly shorter than for other methods. The DIC algorithm is the only main limiting factor. It is envisioned that this limitation will diminish with time as integrated chip technology advances. Also, the accuracy of out-of-plane displacement measurements is typically less than that of in-plane measurements and is highly dependent on stereo calibration. Recently, significant research efforts have been devoted to making 3D DIC more accurate, versatile, and computationally efficient. To increase accuracy and computational efficiency, work has been done on improvements to the 3D DIC correlational algorithm36,37 and the calibration technique itself.38,39 To expand the full-field capabilities of 3D DIC, multi-camera DIC systems have been implemented to enable displacement measurements over much larger areas.40–47 Others have suggested and demonstrated the use of a single camera for 3D DIC using filters and/or mirrors to reduce hardware costs and solve synchronization problems.48–56
Advances in computing and digital imaging technology have enabled DIC to extend from static or quasi-static to dynamic applications. High-speed 3D DIC (HS-3D DIC) techniques, which typically use two synchronized high-speed cameras, have been developed and extensively explored. Recently, HS-3D DIC has been applied to areas including the measurement of low-frequency vibration, shock response of materials,57,58 and full-field modal analysis for characterizing the behavior of structures.59–63 However, modal-based SHM methods with DIC are limited to large areas of damage and are not suitable for localized damage like BVID. While GWSHM could provide a solution to this, there has been little exploration into this application of DIC near the ultrasonic range (>20 kHz). This is likely because cameras with extremely high spatial and temporal resolutions are required to effectively capture unaliased signals at these ultrasonic frequencies. Though high-speed cameras do not yet possess the data rates necessary for the full reconstruction of ultrasonic waves, high-speed cameras have a very high potential to become the most viable means to accomplish ultrasonic guided-wave-based damage imaging over a wide ROI in-time. This is due mostly to the ability of cameras to simultaneously and instantaneously sample an array of points in their field-of-view (FOV), where each pixel could be considered a sensor. With more sensors used to collect the wave signal, more detailed damage information can be derived. Thus, the resulting images can provide the best means to reconstruct the wavefield with the most spatially continuous information regarding the wave propagation phenomena to not only detect the existence of damage but also visualize the shape and location of any damage present.
In 2019 in the authors’ laboratory, Chang and Yuan 64 became the first to develop a high-speed camera system with DIC that successfully imaged local subsurface damage through the reconstruction of the scattered guided wavefield (created by the wave-damage interactions) recorded on the surface of the structure near the ultrasonic frequency range. Though a major step for this technology, the application was limited to a plastic (high-density polyethylene) sheet with surrogate damage in an effort to reduce the sensitivity requirements for full, unaliased wavefield reconstruction (due to slower wave speeds). Additionally, two techniques were implemented to artificially improve both the temporal and spatial resolutions of state-of-the-art high-speed cameras respectively. Among them are sample interleaving (to increase effective sampling frequency) 65 and image stitching (to increase effective camera resolution). 66 Both techniques are straightforward, intuitive, and have been used extensively for increasing effective temporal and spatial sampling frequency. However, sample interleaving requires careful synchronization control and repeated sampling, where slight excitation or structural changes can cause misalignment. Image stitching also significantly increases data collection time, and spatial misalignment between images can cause severe grid-like artifacts in the resulting damage image. These artifacts, shown in Figures 1(c) and (d), appear as grids that lowered the quality of the damage images. Despite these artifacts, image stitching was necessary with the current state-of-the-art because this method used 2D DIC, which limited measurement to the weaker symmetric S0 and anti-plane SH0 wave modes. With 7 × 7 image stitching, five-fold sample interleaving, and ten-time averaging, a total of 2450 separate video measurements were taken to overcome hardware limitations instead of capturing the full field in one shot. This significantly increased the time required for data collection and makes this method impractical in its current implementation.
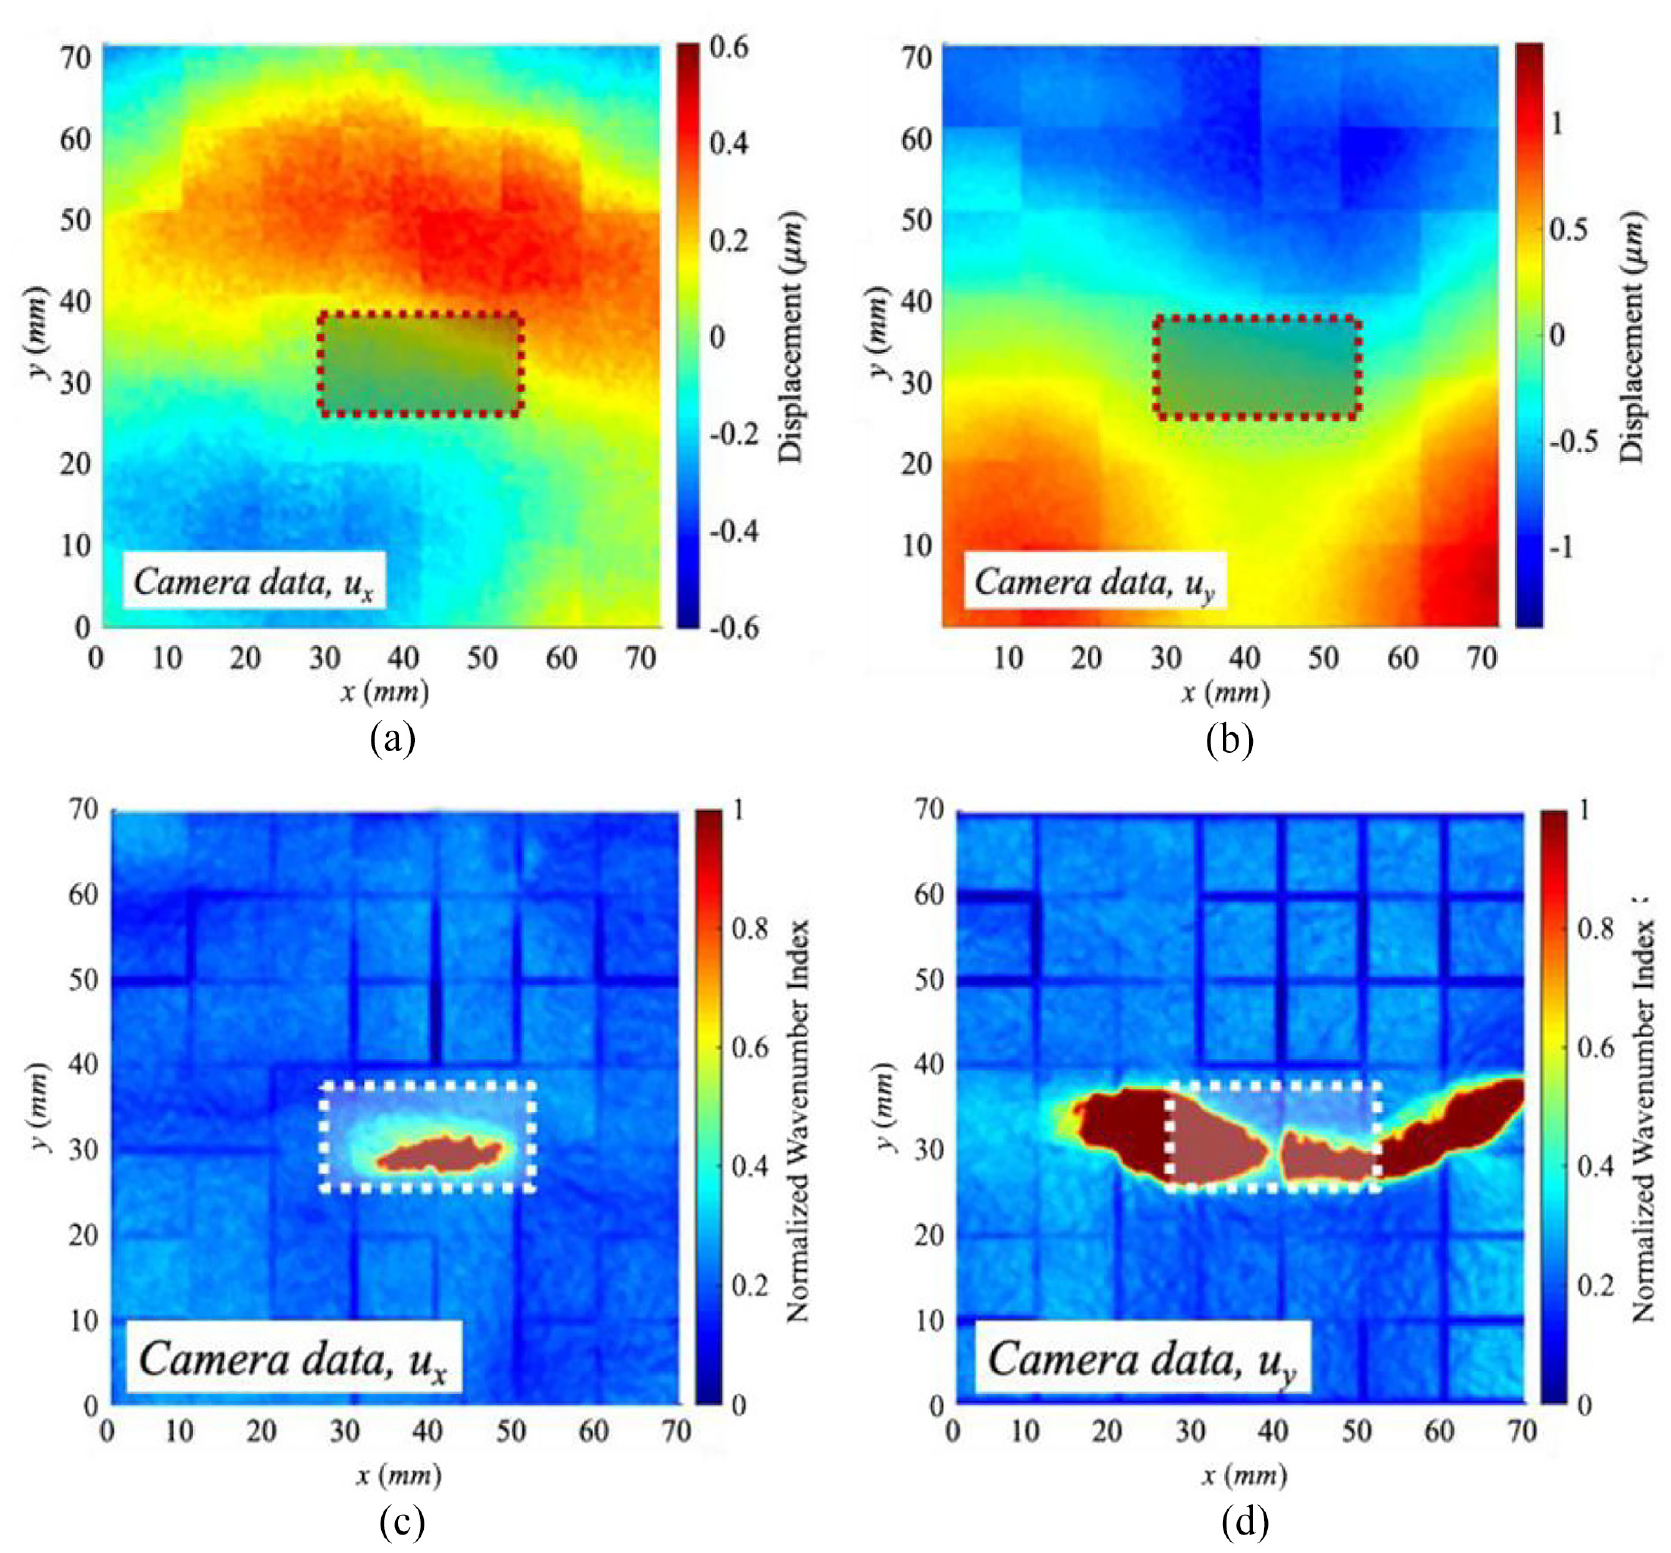
Wavefield snapshots at 800 ms for the wavefield reconstructed using (a) ux and (b) uy, and respective damage images produced using the reconstructed wavefield using (c) ux and (d) uy, by Chang and Yuan. 64 Here, ux and uy correspond to the displacement in the x and y directions respectively.
To overcome the limitations of the system developed by Chang and Yuan, 64 an integrated 3D DIC system has been developed and is demonstrated in this article for BVID imaging using guided waves, without the need to fully reconstruct the wavefield. A damage imaging condition based on the total wave energy (TWE) is implemented, which is sensitive to the presence of local resonance at the location of any existing damage. With the TWE imaging condition, there is no need to identify wave modes, which simplifies signal processing and improves robustness. Most significantly, as long as there is a sufficient number of video frames to capture the local resonance during the appropriate frequency portion of the wavefield generated from a chirped excitation, there is no need to sample above the Nyquist frequency. The absence of the Nyquist requirement significantly lowers the required frame rate of the cameras so sample interleaving is not needed. Additionally, the resolution of the cameras can be maximized by lowering the frame rate. This increases the potential FOV area and eliminates the need for image stitching, producing a clearer image. Since undersampling is acceptable, averaging can be replaced with a longer excitation and recording time to produce more samples contributing to the total energy. Together, these improvements make the process simpler by that the collection of a single stereo-video is sufficient for damage imaging, rather than recording thousands of videos to make it possible to fully reconstruct the wavefield. This reduces the data storage needed, shortens the time required for post-processing, and significantly lowers the required sampling time from many hours to a few seconds.
Additionally, the implementation of two high-speed cameras for 3D DIC in this paper enables the full-field sampling of both in-plane and out-of-plane components of the wavefield displacement, increasing the signal-to-noise ratio (SNR). The symmetric A0 mode with dominant out-of-plane displacements reduces the strenuous requirement for measurement precision since the A0 mode displacements are typically many times larger in magnitude than in-plane modes. This increase in the magnitude that can be measured increases the SNR so that higher modulus aerospace-grade materials, like composites, can be inspected. The increased SNR also further increases the potential FOV area since less displacement resolution is required.
Methodology for experimental tests
This section will explore the physical experimental setup and the mechanisms of 3D DIC. Two composite honeycomb panel specimens with real impact damage were used for validation of the proposed technique. A piezo-shaker was used to generate a chirp signal in the panels, and the pair of cameras (stereo-camera) captured stereo images of the ROI. A combination of 3D digital image correlation (3D DIC) and other image processing techniques was used to map areas of high TWE corresponding to areas of damage. From this, a damage image was created to visualize the BVID.
Composite honeycomb panels
To verify the proposed system, two CFRP composite honeycomb panels were chosen for system verification. These panels have planar dimensions of 178 × 254 mm and consist of an aluminum honeycomb core sandwiched between two CFRP composite face sheets. The face sheets are 6 plies of TE-1 grade 190 type 35 carbon/epoxy, with a stacking sequence of [+60/0/−60]s, where the 0° direction is parallel to specimen length. Each layer has a nominal thickness of 0.1905 mm. The core is a Hexcel CR III 1/8-5052-.0007 lightweight aluminum core with a thickness of 25.4 mm. Details on material properties can be found in the study by Leone et al. 67
There are also epoxy caps on the ends of the panels as shown in Figure 2. Each panel has been subjected to a controlled, 2-J impact, which has created subsurface damage in the form of delamination, appearing between some layers (Figure 3). These impacts have created a dent with a depth of 0.51 mm for panel A and 0.56 mm for panel B, as shown in Figure 3. Though these dents can barely be felt by running a finger over the surface, there is no visual evidence of impact.
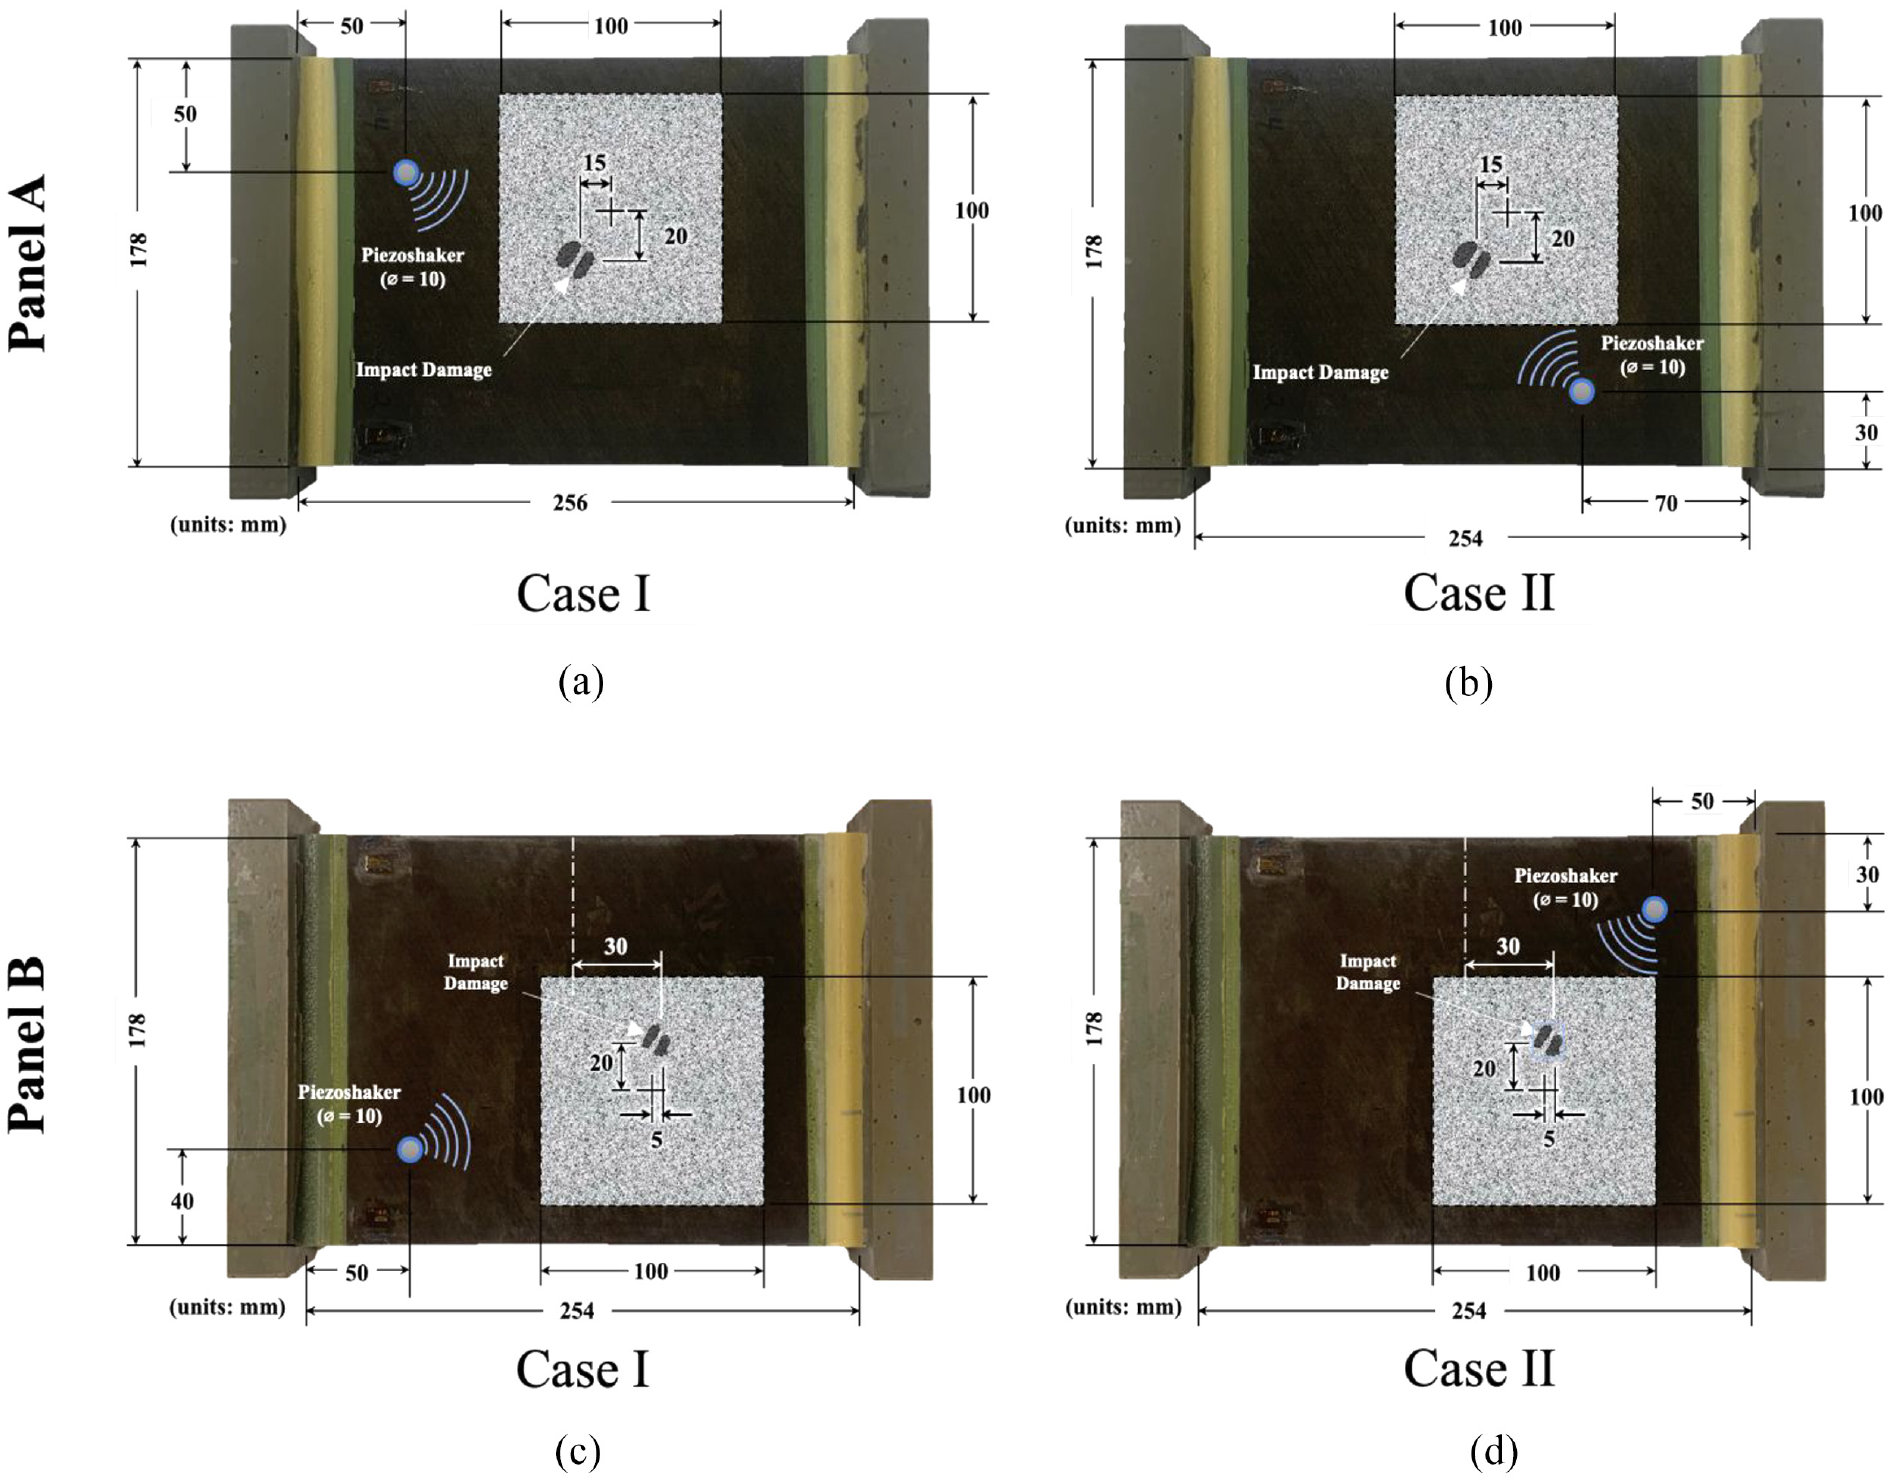
The dimensions and layout of the two composite-honeycomb panels with subsurface BVID used for validation. In the top row, panel A was excited by a piezo-shaker at two different locations: case I (a) and case II (b). In the bottom row, panel B was excited by the piezo-shaker at two different locations: case I (c) and case II (d). The grayscale, speckled region represents the area covered by the adhered speckle pattern, which is the FOV of the cameras.
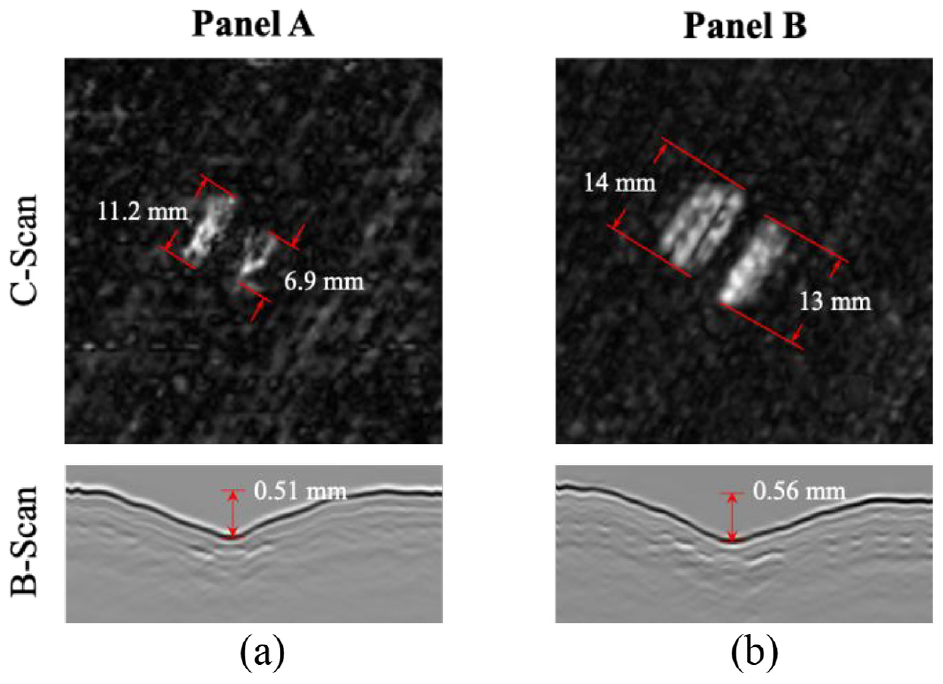
UT c-scans of the damage located at each impact location on the surface of (a) panel A and (b) panel B. The scan region shown corresponds to a 50.8 × 50.8 mm region centered around the impact damage markers in Figure 2. Below are b-scan images, showing an exaggerated view of the depth of the indentations created from the impact.
The surface on one side of each panel was subjected to a controlled, 2-J impact to create BVID and internal ply delamination. To create the impact, an impactor with a mass of 1.67 kg was dropped from a height of 12.2 cm onto the panel in the drop column shown in Figure 4. The impactor had a semi-spherical tip with a diameter of 25.4 mm, and a peak force of around 1100 N was measured from the load cell within the impactor for both impacts.
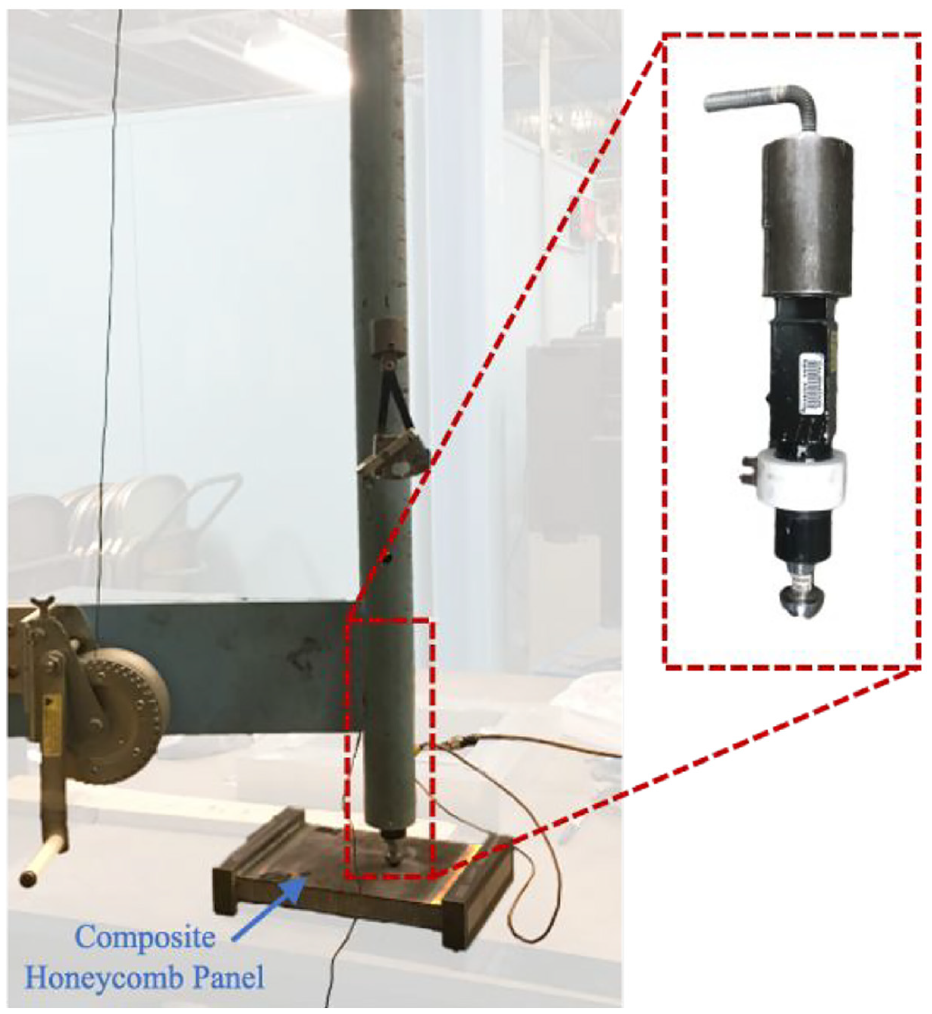
Impactor setup with a drop column containing the weighted impactor used to make controlled low-velocity impacts on the surfaces of the panels. The impactor has a semi-spherical tip with a diameter of 25.4 mm.
The impacted areas of the composite panels were scanned using ultrasonic testing (UT). An Olympus submersion transducer (Shinjuku, Tokyo, Japan) and a Panametrics Model 5055 PR-101 pulser receiver (Waltham, Massachusetts, USA) operating at 10 MHz were used to produce a c-scan of the damage region. A column of water and a balloon attachment were used to ensure coupling between the transducer and the wetted specimen, without submerging the panel. The scans took data samples every 0.254 mm in a 50.8 × 50.8-mm square, producing images with a 201 × 201-pixel resolution.
Figure 3 shows ultrasonic c-scan images of the resulting damage in each face sheet. In each panel, two separate regions of delamination were observed. In panel A, the largest was measured to be 11.2 mm in length, and a smaller delamination was measured to be around 6.9 mm. In panel B, the largest was 14 mm and the smallest was 13 mm.
To further verify baseline scans and provide a clearer image of the delamination and cracking, X-ray computerized tomography (CT) scans were performed on the two panels. The results are presented in Figure 5. The white represents the aluminum honeycomb structure and adhesive, the gray represents the composite structure, and the black indicates the absence of material. The size and shape of delamination closely match that found in the UT c-scans. The CT scans make it clear that delamination propagates across layers through cracking, which appears as jagged black lines running through the gray composite.
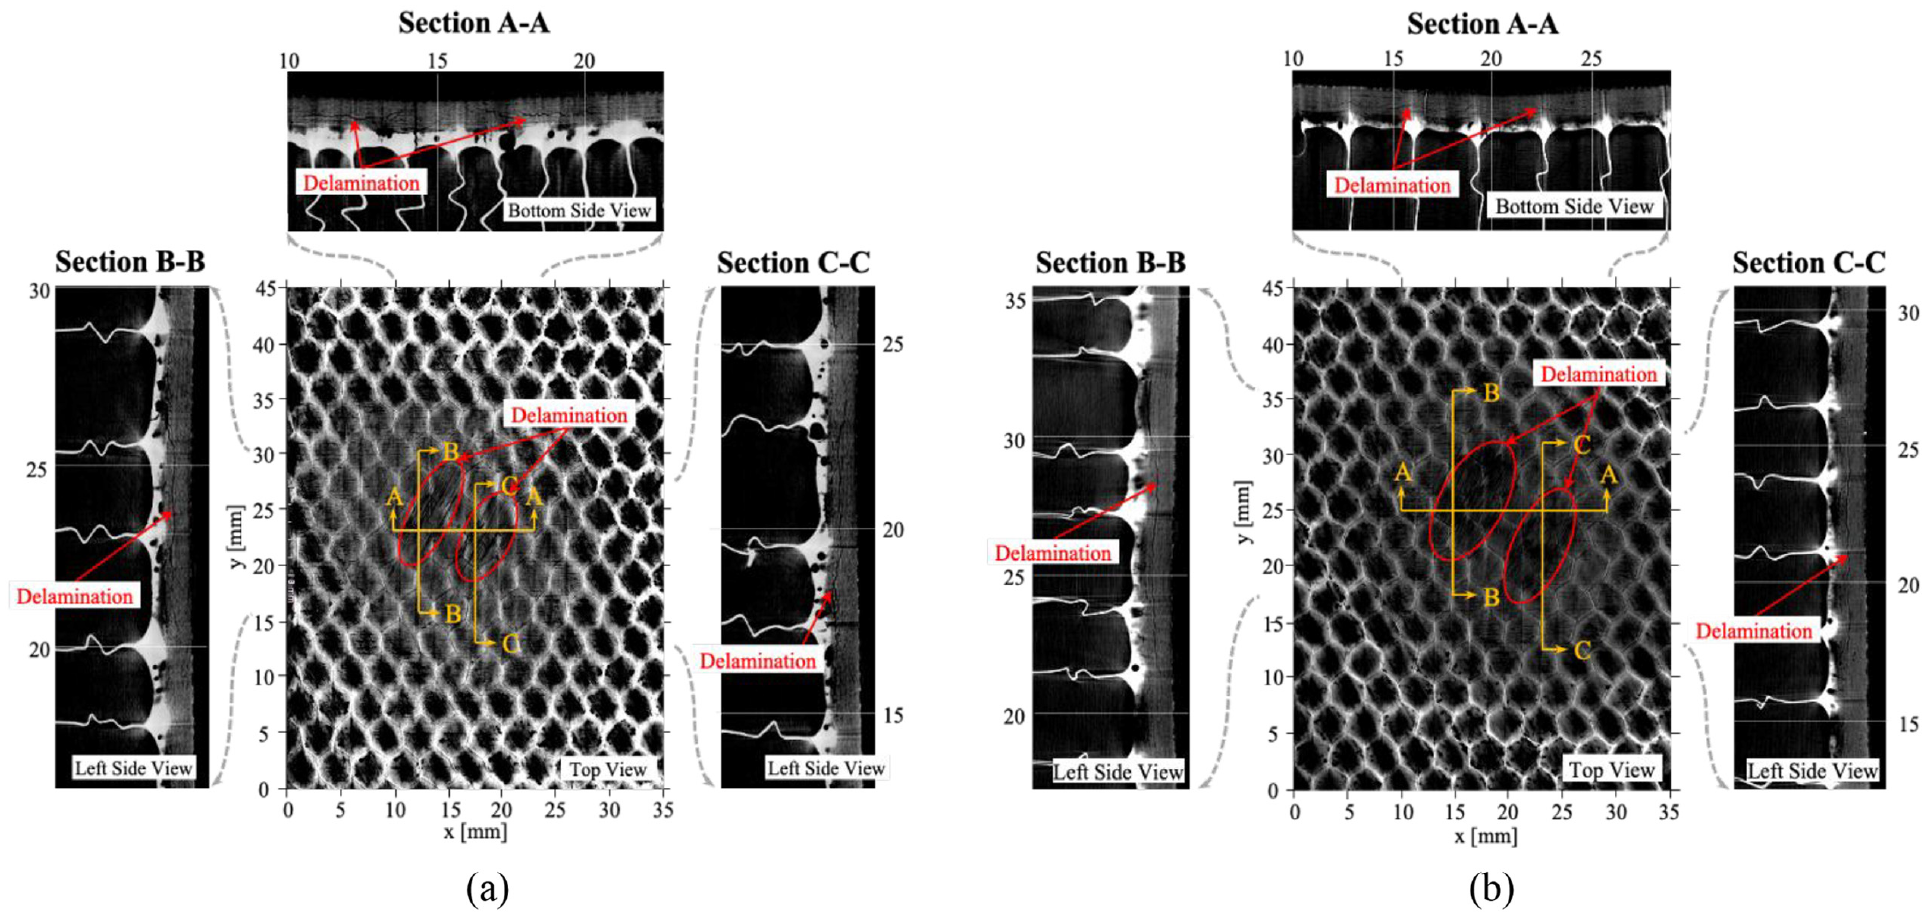
X-ray CT scans of the impacted area of (a) panel A and (b) panel B. The center image shows a view of the delaminated regions in a slice parallel to the surface. The section views on the side represent a slice through the thickness, viewed from the left or bottom side. Delamination that spans through multiple layers is barely visible in the section views and appears as jagged black lines running through the gray composite.
Guided wave excitation
To excite an interrogating guided wave across the surface of the CFRP composite-honeycomb panel, a high-power isi-sys PS-X-04 piezo-shaker (Kassel, Hessen, Germany) was used. The high-power piezo-shaker can provide a much larger displacement than the PZT element used in the study by Chang and Yuan, 64 which increases the SNR and further increases system sensitivity. This was attached to the surface of the panel on the same side as interrogation using a vacuum suction cup attachment and an external Kozyvacu Model TA350 1-stage vacuum pump (Rancho Cucamonga, California, USA). Unlike a traditional PZT element which is permanently adhered to the surface, the vacuum-attached piezo-shaker can be quickly applied and removed without altering the surface. In Figure 2, the blue piezo-shaker circle represents the excitation location and contact area of the PZT element (∅ 10 mm); however, the suction cup attachment encircled this element with a diameter of approximately 56 mm. To promote sonic penetration into the panel, ultrasonic couplant was applied between the piezo-shaker and the panel surface.
Continuous sinusoidal signals were generated using a Tektronix AFG3022C function generator (Beaverton, Oregon, USA) at 3 ± 2 V (unipolar). This signal was amplified to 120 ± 80 V using an isi-sys HPDA-0-180-1C high-power amplifier (Kassel, Hessen, Germany) and sent to the piezo-shaker for excitation. The experimental setup is shown in Figure 6.
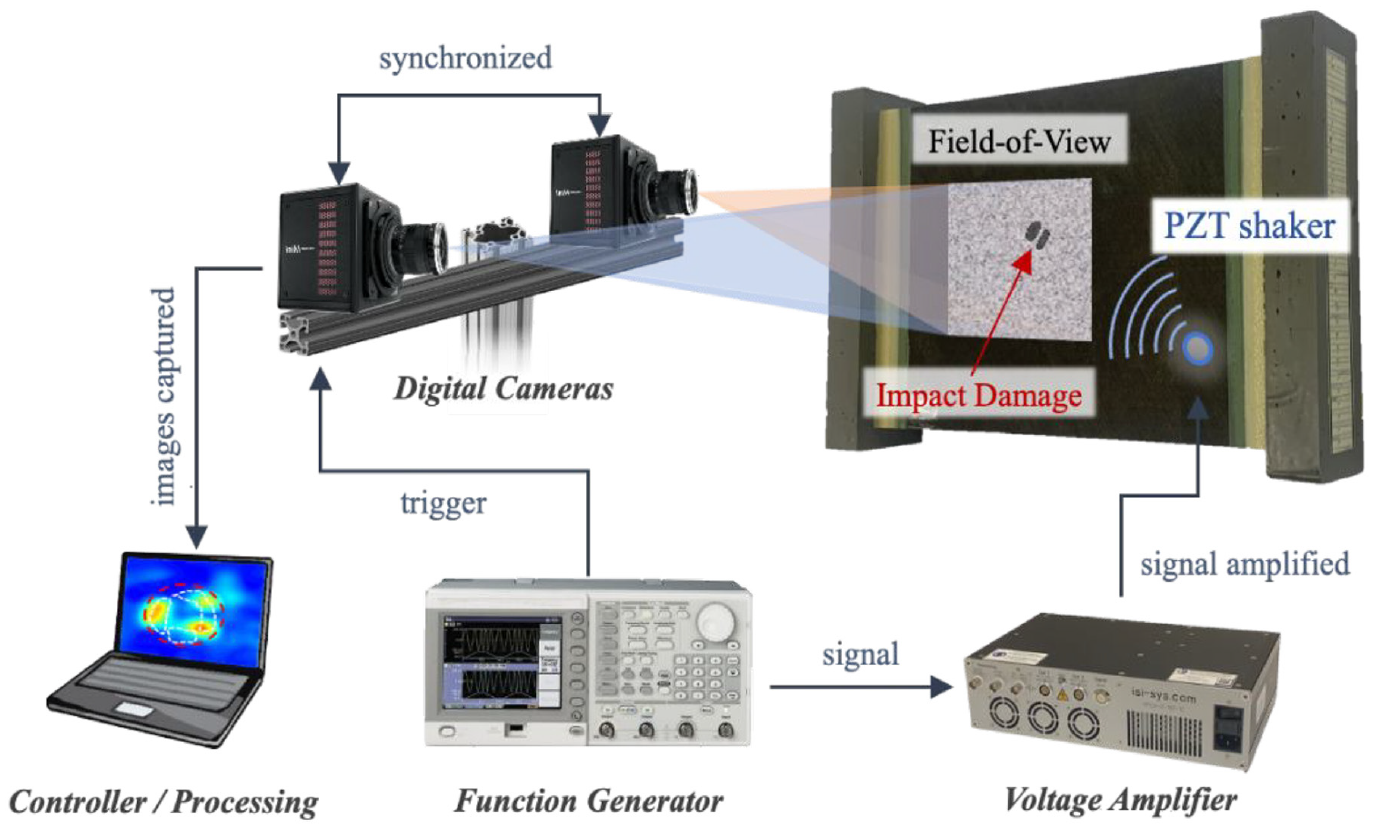
Schematic of the experimental setup of the integrated system including two digital cameras, a function generator/voltage amplifier, and the DIC algorithm and signal processing in the personal computer.
To provide the appropriate frequency content to promote local resonance at the damage location, a chirp excitation was used. This chirp increased frequency from 10 to 20 kHz over a period of 3 s. This broad frequency range was chosen because multiple resonance frequencies were found to fall within this range for many damage scenarios, supported by LDV data and finite element analysis simulations. A long period of excitation was chosen to provide enough time for energy to accumulate within the damage region and for significant resonance to occur during the sweep when the appropriate frequencies were being excited.
Digital cameras
To capture the guided wave with 3D DIC, speckle images of the surface are first captured by two cameras in a stereo setup. For this, two Photron FASTCAM Mini AX-200 high-speed cameras (Fujimi, Chiyoda-Ku, Tokyo, Japan) were used. Each camera has a maximum resolution of 1024 × 1024 pixels at 6400 frames per second (fps). Each camera was equipped with a Nikon AF-S VR Micro-Nikkor 105 mm f/2.8 G IF-ED lens (Minato, Tokyo, Japan). Three Zaila Daylight light-emitting diode (LED) fixtures (Altadena, California, USA) were used to provide adequate lighting. Substantial light was needed for two main reasons: (1) to accommodate a small aperture so that the depth of field is wide enough to have the FOV in focus with the cameras angled and (2) to account for the fast shutter time, which should be less than half of the excitation cycle (e.g., <0.5/excitation frequency) to effectively capture the surface displacement with minimal blur. In this study, a shutter speed of (1/60000)s was used, which is one-third of the excitation cycle at the maximum excitation frequency of 20 kHz. Each camera was positioned approximately 8° from the composite surface normal. A larger angle would have provided a higher out-of-plane resolution for DIC, but the edges of the image would have been outside of the depth of field and out of focus. The two cameras and the LED fixtures were mounted to a rigid frame to minimize external vibrations.
3D DIC image analysis software
The entire 3D DIC process for damage imaging involves five steps: (1) preparation of the structural surface, (2) calibration of the stereo camera system, (3) measurement by recording images of the ROI in the reference (or undeformed) and deformed states, (4) processing and image analysis through computer software, and (5) visualization of the TWE map. 68
3D DIC is used to extract the 3D displacement data from the raw stereo-camera videos, effectively converting the pixel intensities from stereo-camera videos (IM(x, y, t); M = left, right) to a 3D surface displacement video (u(x, y, t), v(x, y, t), w(x, y, t)). Like 2D DIC, 3D DIC works to extract displacements by comparing images of the surface after deformation with a reference image captured before deformation. This process involves tracking the displacement of a virtual grid of points covering the ROI. To ensure each point being tracked is unique, a small neighborhood of pixels (21 × 21 pixels for this study) centered around the point is tracked. Each neighborhood is referred to as a subset and can be considered a virtual strain gauge, where the result of the DIC algorithm provides the strain at the center of each subset with respect to the original reference image. To support a high resolution, these subsets can overlap each other, so that the step between the centers of the subsets must be specified (7 pixels for this study).
The uniqueness of each subset is assured by applying a random speckle pattern to the plate over the ROI. A speckle size that is four times the pixel size was chosen to avoid aliasing. 69 A speckle pattern generator software from Correlated Solutions Inc., Irmo, South Carolina, USA (CSI) was used to generate a pattern, which was then printed on standard copy paper with a high-resolution (1200 × 2400 dots per inch) laser printer. The paper speckle pattern was carefully applied to the plate with a thin, even layer of white multi-purpose PVA glue. This method provides a quick, temporary, and inexpensive method for speckle application that does not permanently alter the surface. While the effect of the adhesive and paper on the accuracy of measurement was an initial concern, say, if the displacement was not fully transmitted through the adhesive and paper. However, the data showed no observable negative effect from using printed speckles rather than painted speckles. Initial tests showed that printed speckles provided higher DIC accuracy compared to painted speckles because the speckle size could be better controlled to have uniform, non-overlapping, and non-aliased speckles compared to those created with an airbrush technique.
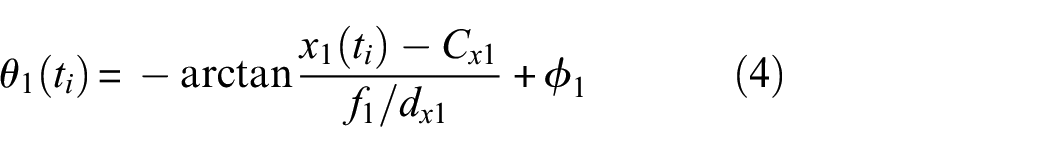
To extract 3D displacements, 3D DIC requires a more advanced system and additional correlation compared to 2D DIC. For 3D DIC, a synchronized image is captured by each of the two cameras at the same time instance for each frame. Thus, each sample consists of an image pair, which is correlated with a reference image pair to extract displacements. These image pairs provide information about the location of subsets in 3D space, like how human eyes support depth perception through convergence and retinal disparity. For this to be possible, calibration is necessary to determine the relationship between points in the world coordinate system and the pixel coordinate system. This involves determining the intrinsic (i.e., distortion parameters, focal length) and extrinsic parameters (i.e., relative camera angles and spacing) of the camera setup. 70 Figure 7 describes the intrinsic relationship of each camera and the extrinsic relationships of the stereo rig. To obtain these parameters, sets of calibration images are taken by the two-camera setup by capturing a target calibration board at various orientations covering the entire ROI. A CSI standard 14 × 10-dot calibration board with 4 mm spacing was used for calibration. These calibration images were then uploaded to VIC-3D by CSI to extract the system parameters. A series of 100 calibration image pairs were taken to account for images where the calibration grid could not be identified. The world coordinate system that is mapped by the calibration is oriented with respect to the orientation of the left camera.
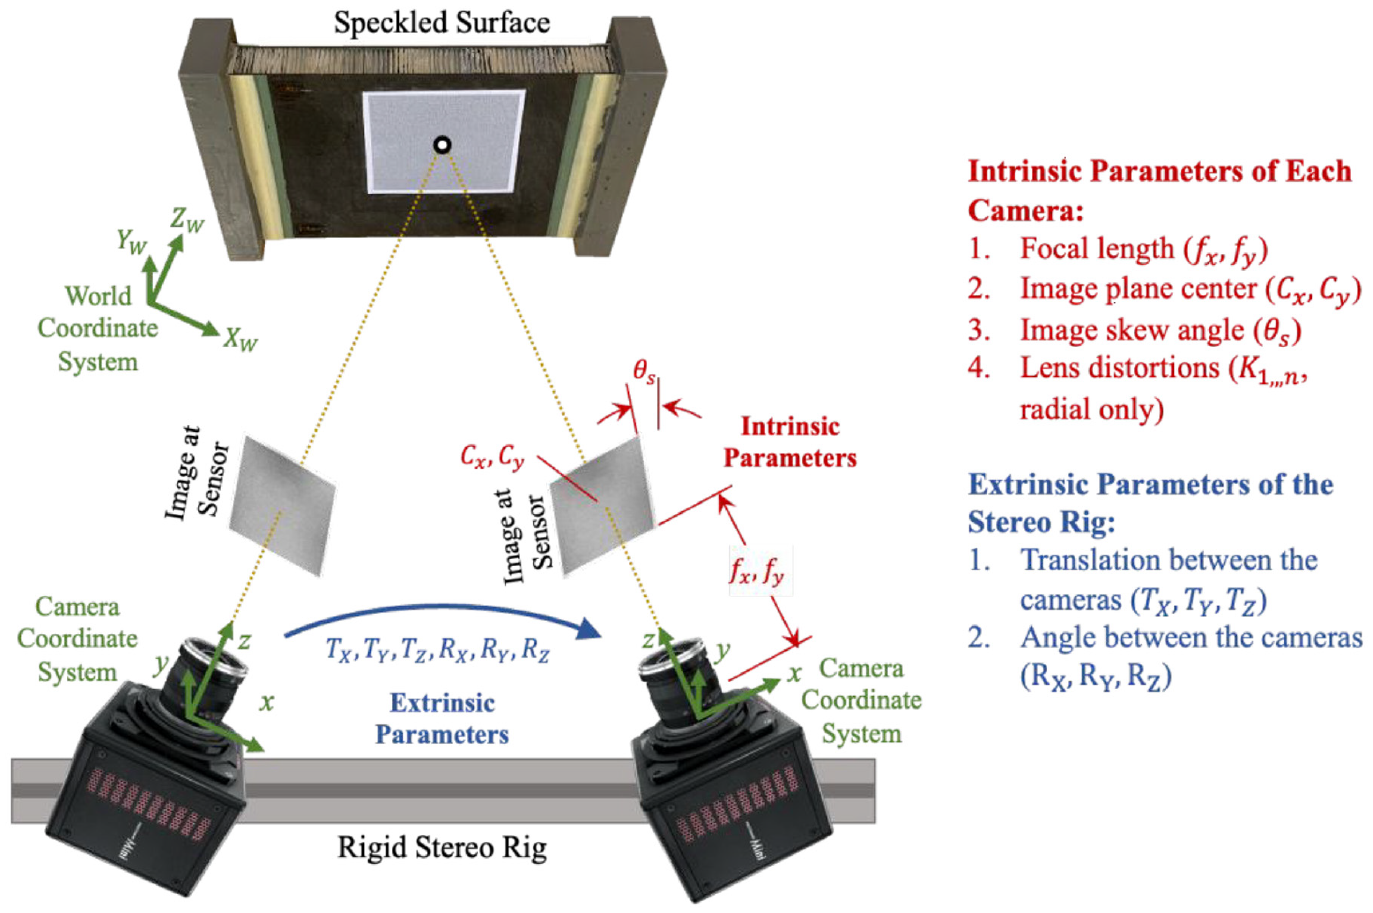
Stereo rig setup for 3D DIC, describing the extrinsic parameters (blue) and intrinsic parameters (red) of the system. In this case, the world coordinate system is defined with respect to the orientation of the left camera.
After calibration, speckle images were taken under the same stereo configuration as used in the calibration to avoid invalidating any calibration parameters. At each time instance (frame), the setup generated an image from each camera sharing the common ROI. After the images were captured in Photron FASTCAM Viewer, they were imported into VIC-3D for DIC analysis to extract the displacements. To extract the 3D displacement from the speckle image pairs, the individual subsets must be matched between images, including any translation and deformation of the subset relative to the reference image and the matching subsets that are translated and deformed in the corresponding stereo image. For this matching process, a subset shape function is used to account for this translation and deformation. 70 To be able to measure subpixel displacements, the pixel grayscale values are spatially interpolated. Through interpolation, DIC can have the ability to resolve displacements of 1/100th of a pixel, though this value is dependent on many experimental factors. 71 After interpolation, subset matching is done by minimizing a correlation or difference function including the pixel intensity information from the reference and deformed images. Both the subpixel information from the interpolation and the displacement and deformation from the shape function are considered in this minimization function.
After the intrinsic and extrinsic parameters have been determined through calibration and each subset has been matched to reference images and correlated to its corresponding stereo image, the surface points corresponding to the center of each subset are mapped in world 3D space through triangulation. The intrinsic parameters of the system allow the center of a subset in the image to be projected into 3D space. With one camera, this cannot help in determining how far the object is from the camera. However, with two cameras using the intrinsic stereo parameters, if matching subsets are projected, the two projected lines will cross somewhere in space. Triangulation locates the unique 3D point where the matching subsets cross, corresponding to the surface’s world coordinate. Consider a specific space point,
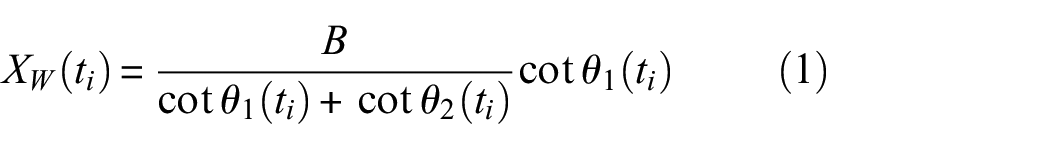
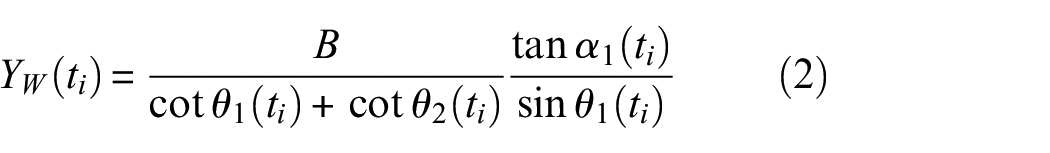
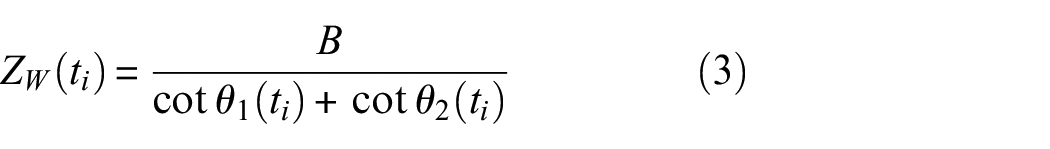
where the angles can be represented as,
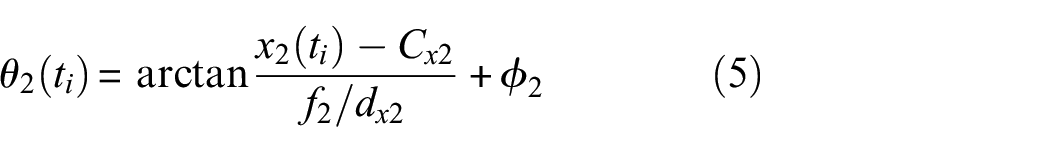
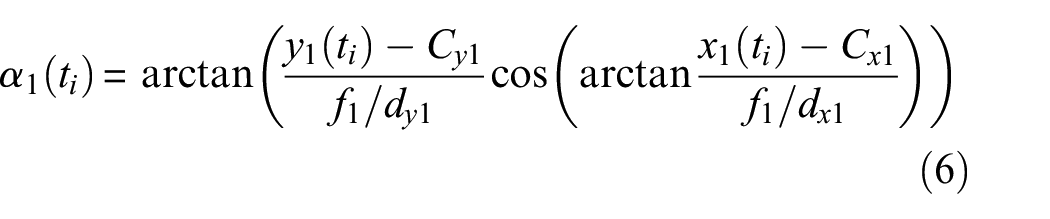
Here,
Due to some error in matching, the lines projected from each corresponding image subset for triangulation will not intersect but will have some intersection error. An assumption is usually made that the calibration is correct and the lack of intersection is caused by a subset mismatch from noise in the images. 73 A minimization process is used that allows the subset location in the images to be varied until the rays intersect, in order to find the optimum triangulated 3D point. All subset matching and triangulation is handled by the VIC-3D software.
The displacement sensitivity, or the displacement that can be accurately determined by the system, is directly related to the pixel size at the surface of the structure, which can be found by dividing the FOV by the number of pixels. For a 1-MP resolution, the out-of-plane displacement resolution is approximately 0.00001 of the FOV. 74 It should be noted that this value is approximate, and heavily depends on a variety of factors, including speckle quality, calibration quality, and lighting. Significant time was spent optimizing the speckle application method, calibration procedure, lens selection, and lighting conditions. When resonance is present, the out-of-plane vibration magnitude is greater than 1 μm. From this, a FOV of 100 × 100 mm was chosen to maximize the area that can be inspected while maintaining the system’s sensitivity to damage.
Video image collection
The high-speed cameras were connected to a personal computer via Ethernet, and Photron FASTCAM Viewer was used to capture and save the speckle images. To maximize the spatial resolution of the images and avoid the need for image stitching, the maximum resolution of 1024 × 1024 pixels was used. However, this limited the frame rate to 6400 fps. The proposed method looks for resonance at the damage location using a “total” approach, considering the entire period of recording. Thus, to collect more information to add to the accuracy of the damage image result, the recording length was increased rather than attempting to increase the sampling rate through sample interleaving, which could add error from delay desynchronization. A synchronized 3-s video was captured simultaneously by each camera and used to generate the damage image. No averaging was used.
Image processing procedures
The displacement data was exported from VIC-3D in a MATLAB® M-File (MathWorks in Natick, Massachusetts) for each sample and imported into MATLAB for signal processing. The displacement data is on the order of 1 μm, thus the system is very sensitive to vibrations from external sources. Without any filtering, low-frequency oscillations overwhelm the signal and hide any evidence of damage. A high-pass filter was applied with a cutoff frequency of 200 Hz, which lowered the intensity of the low-frequency vibrations below the noise level. While this also may remove some temporally aliased signals near intervals of the sampling rate (6.4 kHz), there should be sufficient opportunities for resonance at other frequencies to still provide a quality damage image since there are many resonance modes.
Total wave energy for damage imaging
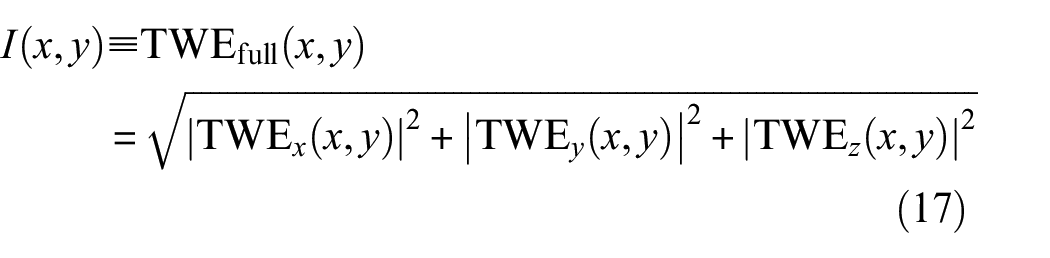
A chirp excitation produced by sweeping the sinusoidal frequency provides a broadband signal interrogation to the structure. When the chirp frequency band embodies the resonance frequency of the subsurface damage, local resonance will occur in the damage region. This resonance through frequency tomography is shown in Figure 8. At this resonance, the wave energy will be “trapped” in this damage region. Thus, to image subsurface damage in the structure, the TWE is used as the damage index, where regions of high TWE will correspond to damage in the structure. The instantaneous wave energy (IWE) will not be consistently high throughout the sweep, but there should be significantly high energy during resonance excitation so that this region stands out while considering the total energy throughout the entire sweep duration. Unlike the wavenumber index imaging condition proposed by Chang and Yuan, 64 the TWE technique does not require the differentiation of wave modes and thus is more robust. As a result of applying this TWE imaging condition, the 3D surface displacement video (u(x, y, t), v (x, y, t), w (x, y, t)) extracted using 3D DIC is converted to a physical domain, I(x, y), representing the subsurface damage image within the FOV.
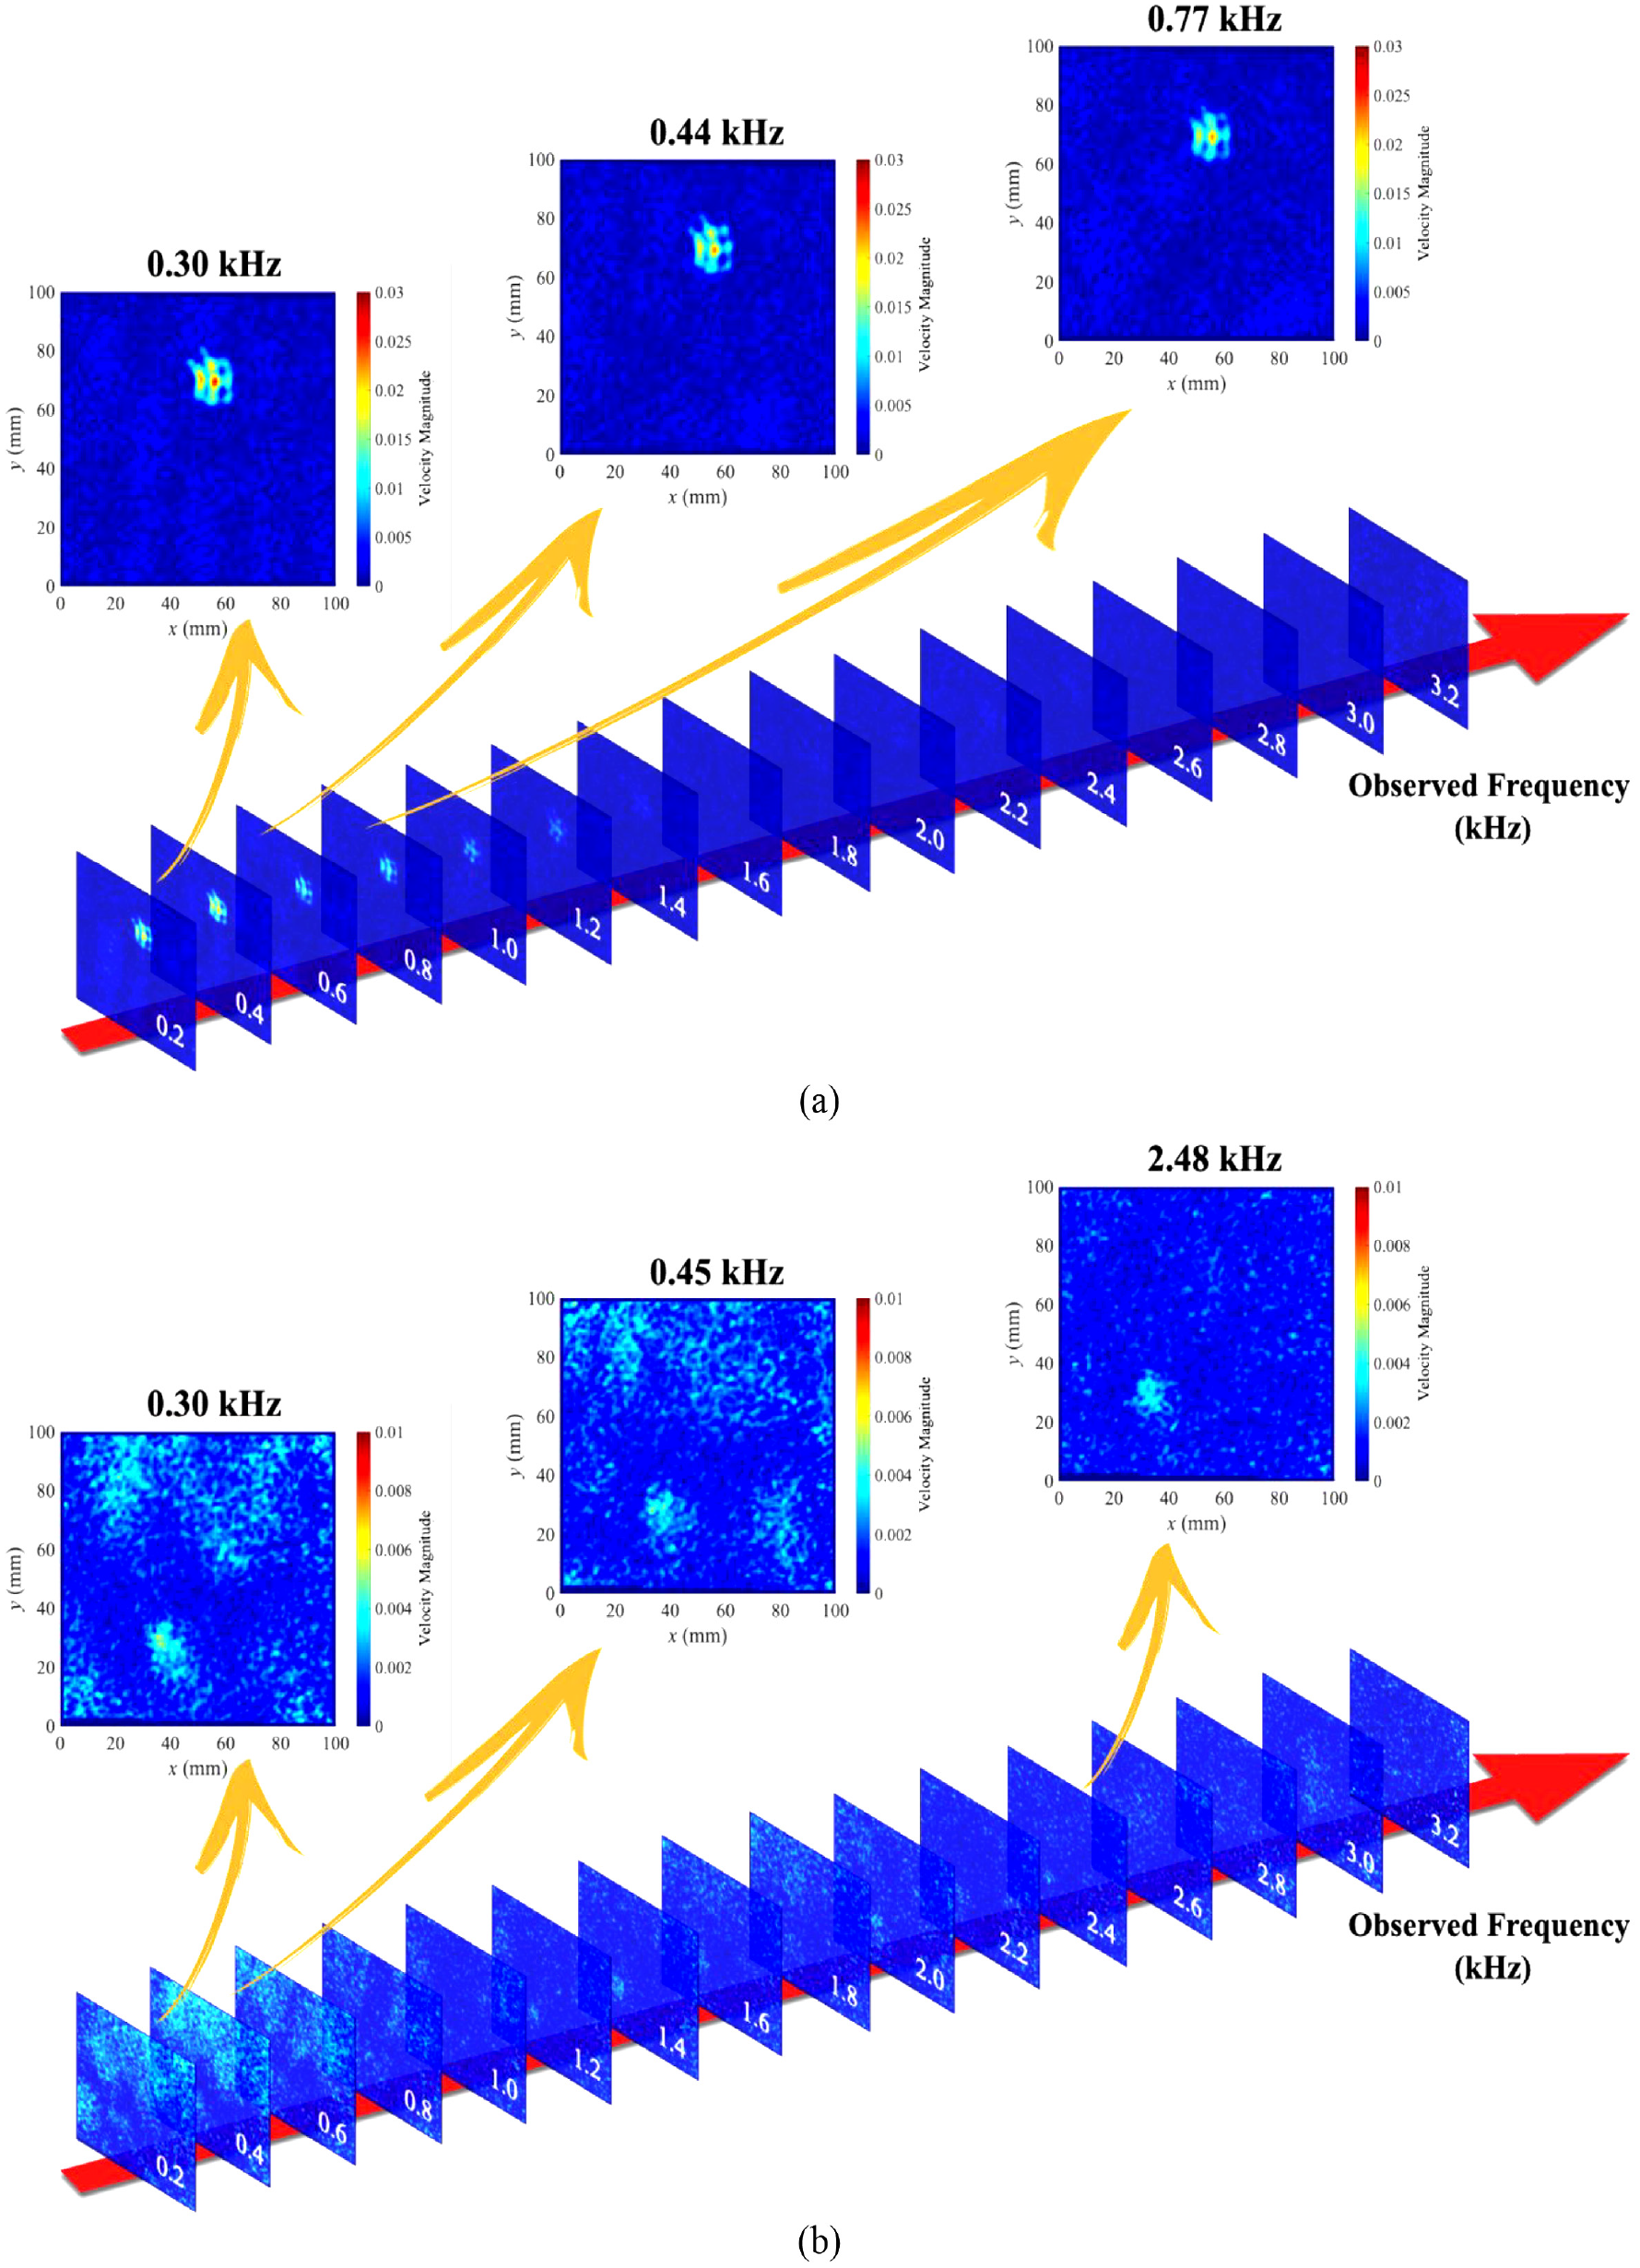
Frequency tomography showing the response in the observed (temporally aliased) frequency domain for (a) panel A and (b) panel B. Frequencies where the signal in the region of damage is high are identified as resonance frequencies. Images are generated using the aliased DIC data with the setup from case I. Note that the colormap in (a) corresponds to a velocity magnitude ranging from 0 to 0.03, while (b) only shows a magnitude range from 0 to 0.01. The observed resonance in panel A within the region 0.2–3.2 kHz is more significant than in panel B.
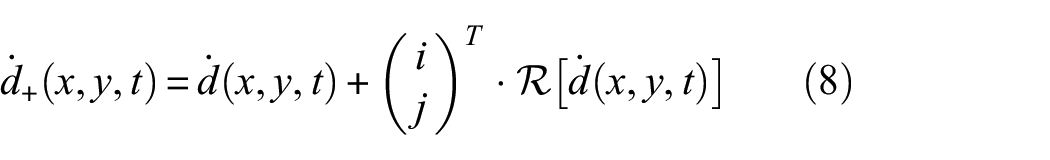
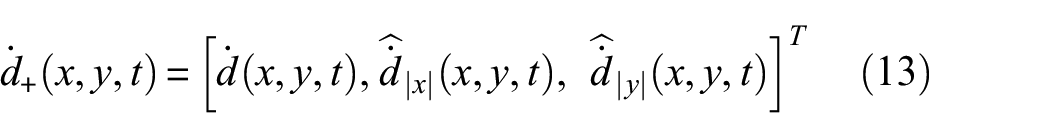
In this paper, a TWE damage imaging condition is proposed for visualizing the hidden BVID damage. The energy is based on the monogenic signal energy via Riesz transform. Physically, the monogenic signal represents the instantaneous wave envelope of the signal. For the local displacement in each direction,

The signal,
The instantaneous amplitude is analogous to the envelope of the monogenic signal, where the monogenic signal is constructed from the real-valued base signal by adding phase-shifted (or quadrature) components to the signal. The real and imaginary parts form the quadrature pair. The monogenic signal,
where
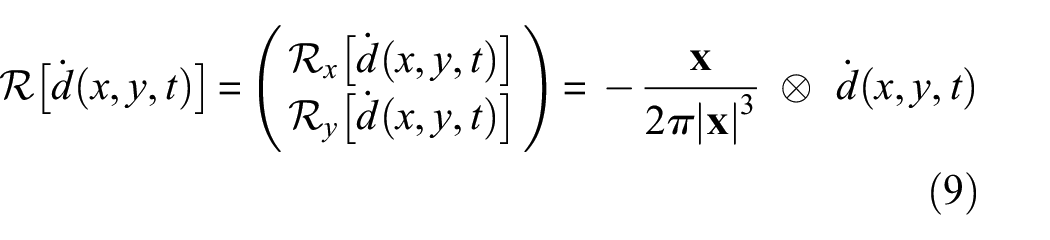
where ⊗ represents the convolution operator and
The RT of the signal can be calculated in the time-wavenumber domain as the product of the RT transfer function in the wavenumber domain and the spatial 2D two-dimensional fast Fourier transform (2D FFT) of the signal, represented by
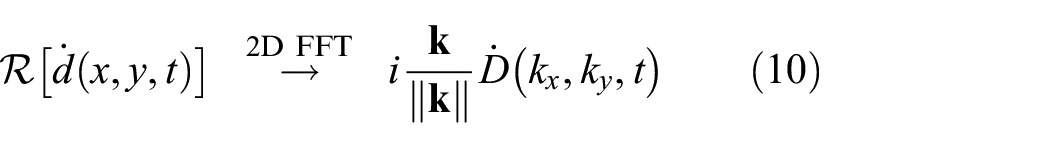
where
In the wavenumber-time domain, the RT of the real wavefield can be deconstructed into x- and y-components,
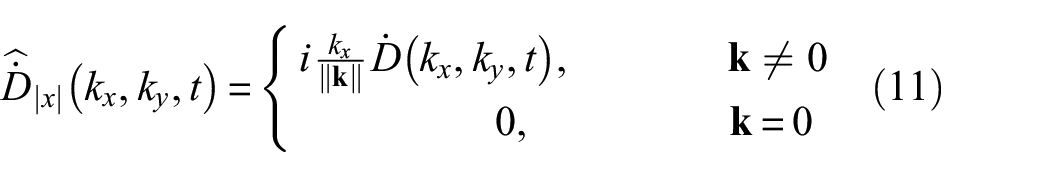
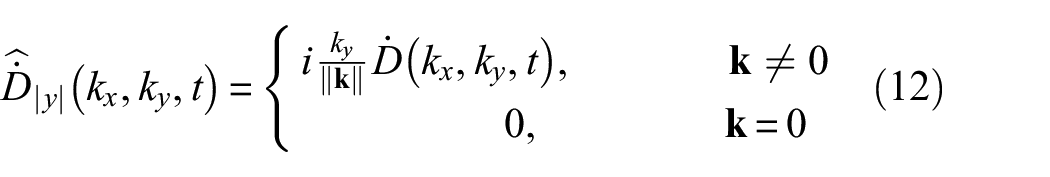
where
Here,
where,
From the local instantaneous amplitude, the IWE is defined as
The TWE is finally calculated by integrating the IWE over time.
where
To demonstrate the advantages of the TWE method, the resulting damage images are compared to the results derived from a simple root mean squared (RMS) of the total displacement.
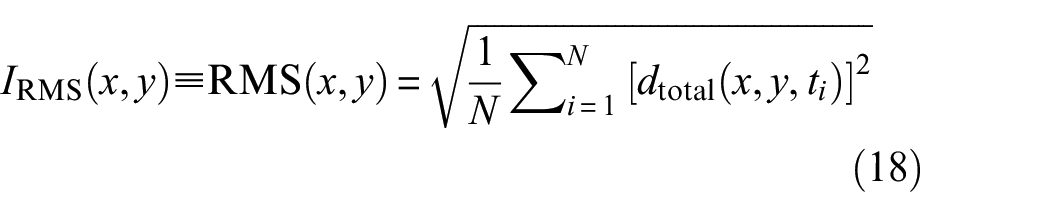
Here,
Damage imaging results
As expected, the damaged regions are highlighted due to higher accumulated wave energy in these areas compared to the remaining ROI. The resulting damage images for a 3-s video at 6400 fps are shown in Figure 9, corresponding to the panels and cases presented in Figure 2. The TWE for each displacement component u, v, and w in the x, y, and z directions, respectively, oriented with respect to the left camera, are presented as TWE
u
, TWE
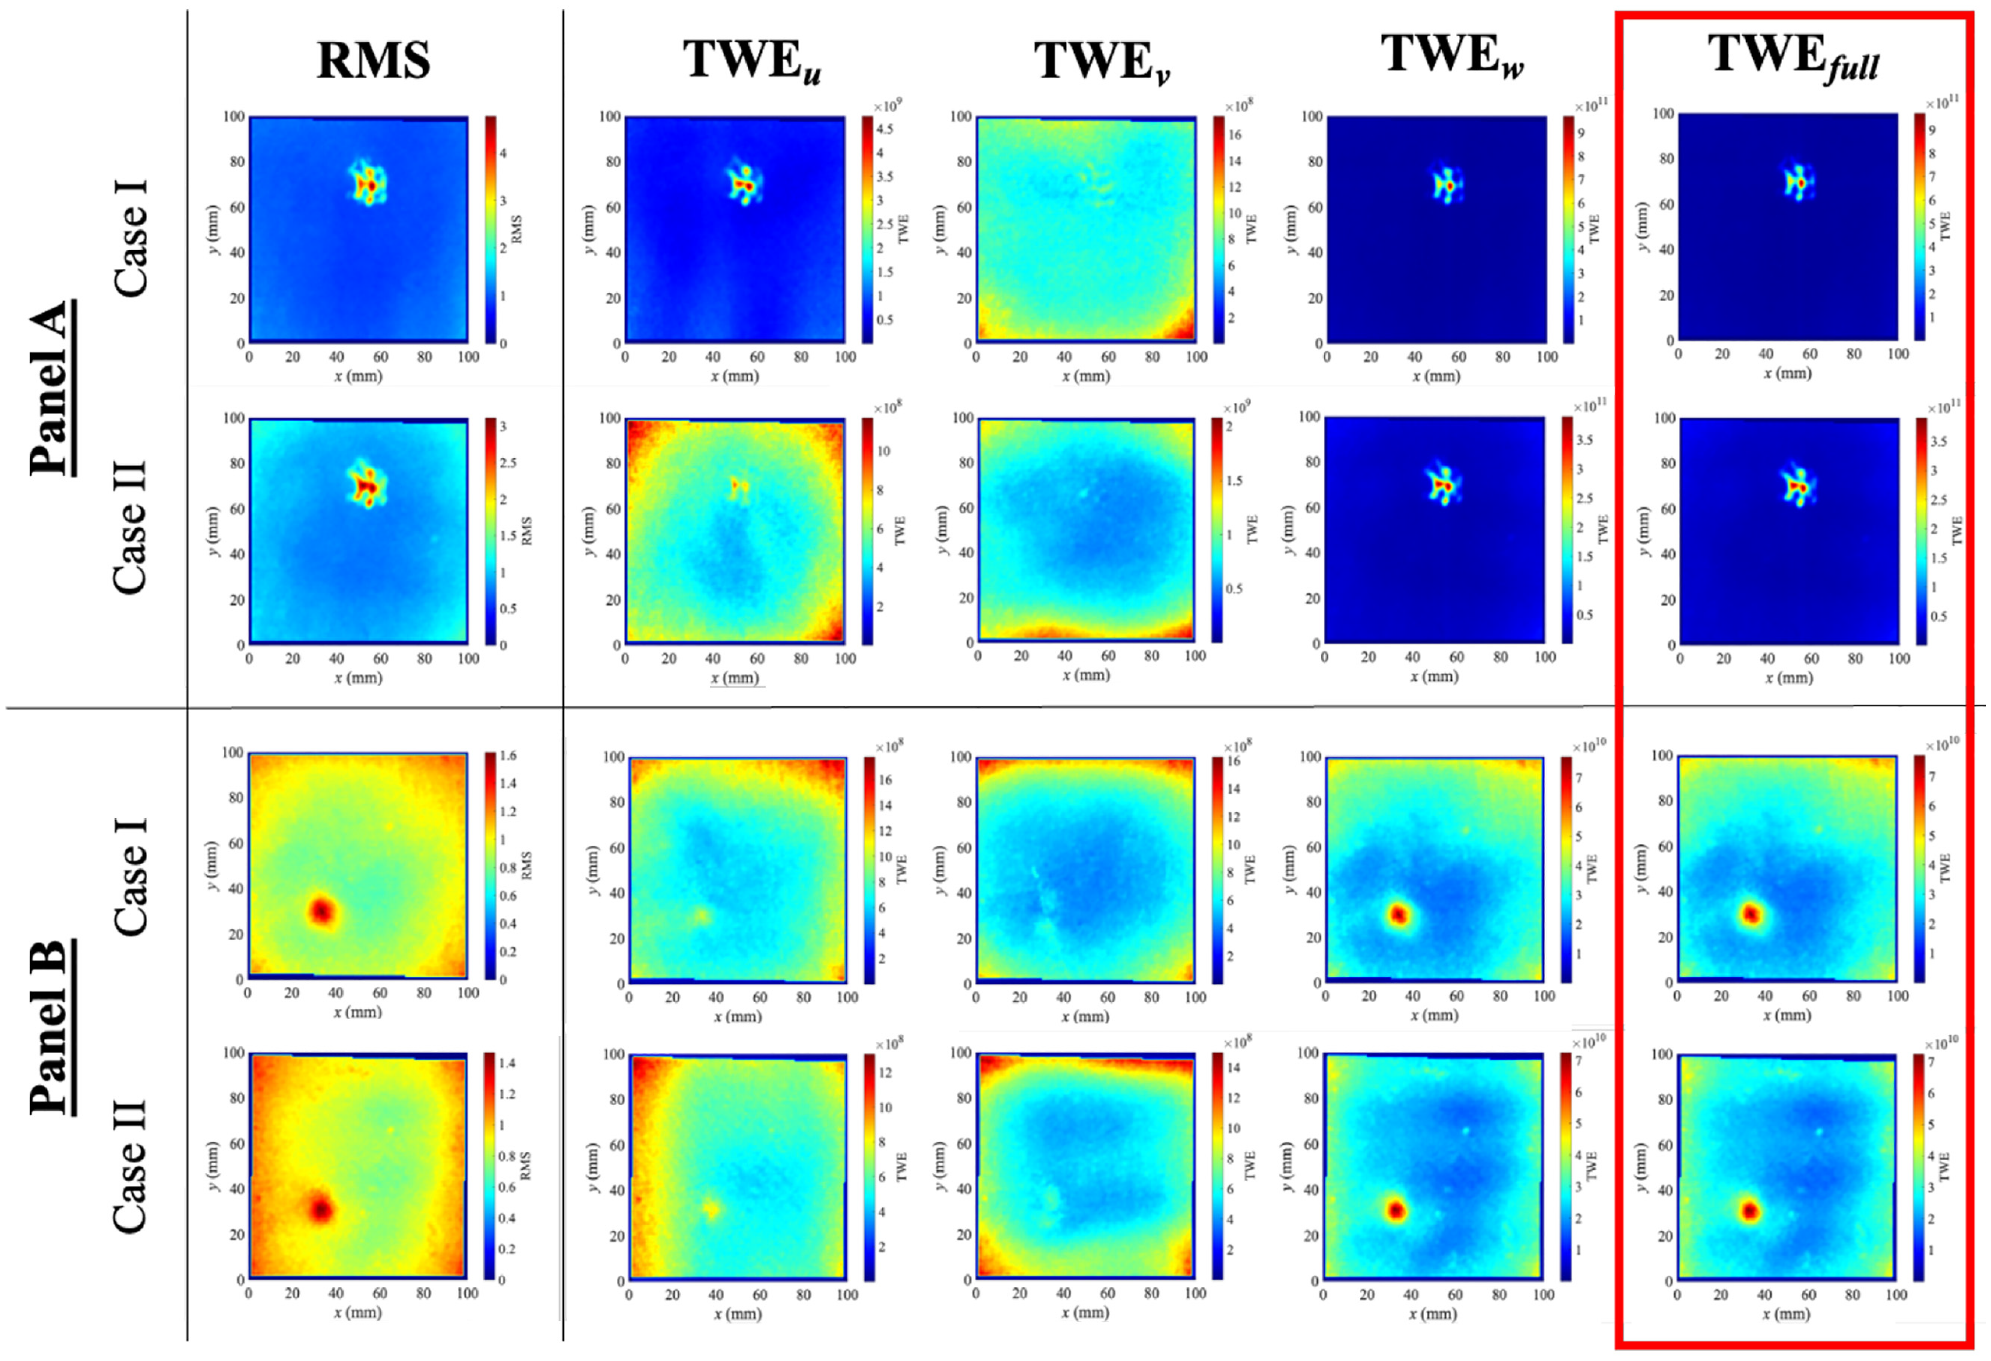
Damage imaging results from a 3-s video using the 3D-DIC setup for both panels and all cases. The results from the RMS of displacement are compared to the total wavenumber energy method. The damage images in the TWE u , TWE v , and TWE w columns correspond to the TWE calculated using the u, v, and w displacement components respectively. The enclosed TWEfull column contains the final damage images, formed from the norm of the TWE components for each case.
In both cases for panel A, the damage image is clearer than that of the two cases for panel B. In panel B, there appear to be some lighting or focusing effects that produced a higher TWE near the edges of the ROI. However, the TWE in the damage region of panel B is approximately one order smaller than that of panel A. It is likely that these artifacts are present in the panel A images, but the TWE in the damage region is large enough for the scale to hide these artifacts. Though each panel was subjected to an impact with the same energy (2 J), the subsurface damage was created differently and has different resonance frequencies. The smaller TWE measured in panel B could be due to different damage outcomes that correspond to different resonance frequencies. It is also possible that more significant resonance could be observed below 0.2 kHz due to aliasing and frequency wrapping and has been filtered out. Despite the discrepancies in the damage images, the damage clearly stands out from the background in all cases for both panels. Also, the locations of high TWE corresponding to the expected damage regions clearly match the expected damage locations described in Figure 2. Additionally, the position of the transducer with respect to the damage location does not seem to have a significant effect on the resulting damage image.
Image verification with LDV
To validate the 3D DIC technique and provide benchmark damage images, a LDV was used to collect the data rather than the cameras for the same setups for the two composite sandwich panels. A 100 × 100-mm grid corresponding to the FOV of the cameras was scanned point by point with a spacing of 5 mm to keep the scanning time reasonable (a few hours). At each location, the piezo-shaker excited the 3-s sweep, and the LDV gathered the local velocity. The LDV was set to sample at 102.4 kHz for the 3-s duration, providing unaliased data. A 200 Hz high-pass filter was applied, but all original frequency content above 200 Hz was preserved since there was no “frequency wrapping” from aliasing. The resulting TWE images are shown in the top row of Figure 10. For comparison, the damage images from 3D DIC are copied from Figure 9 and shown in the second row of the Figure 10.
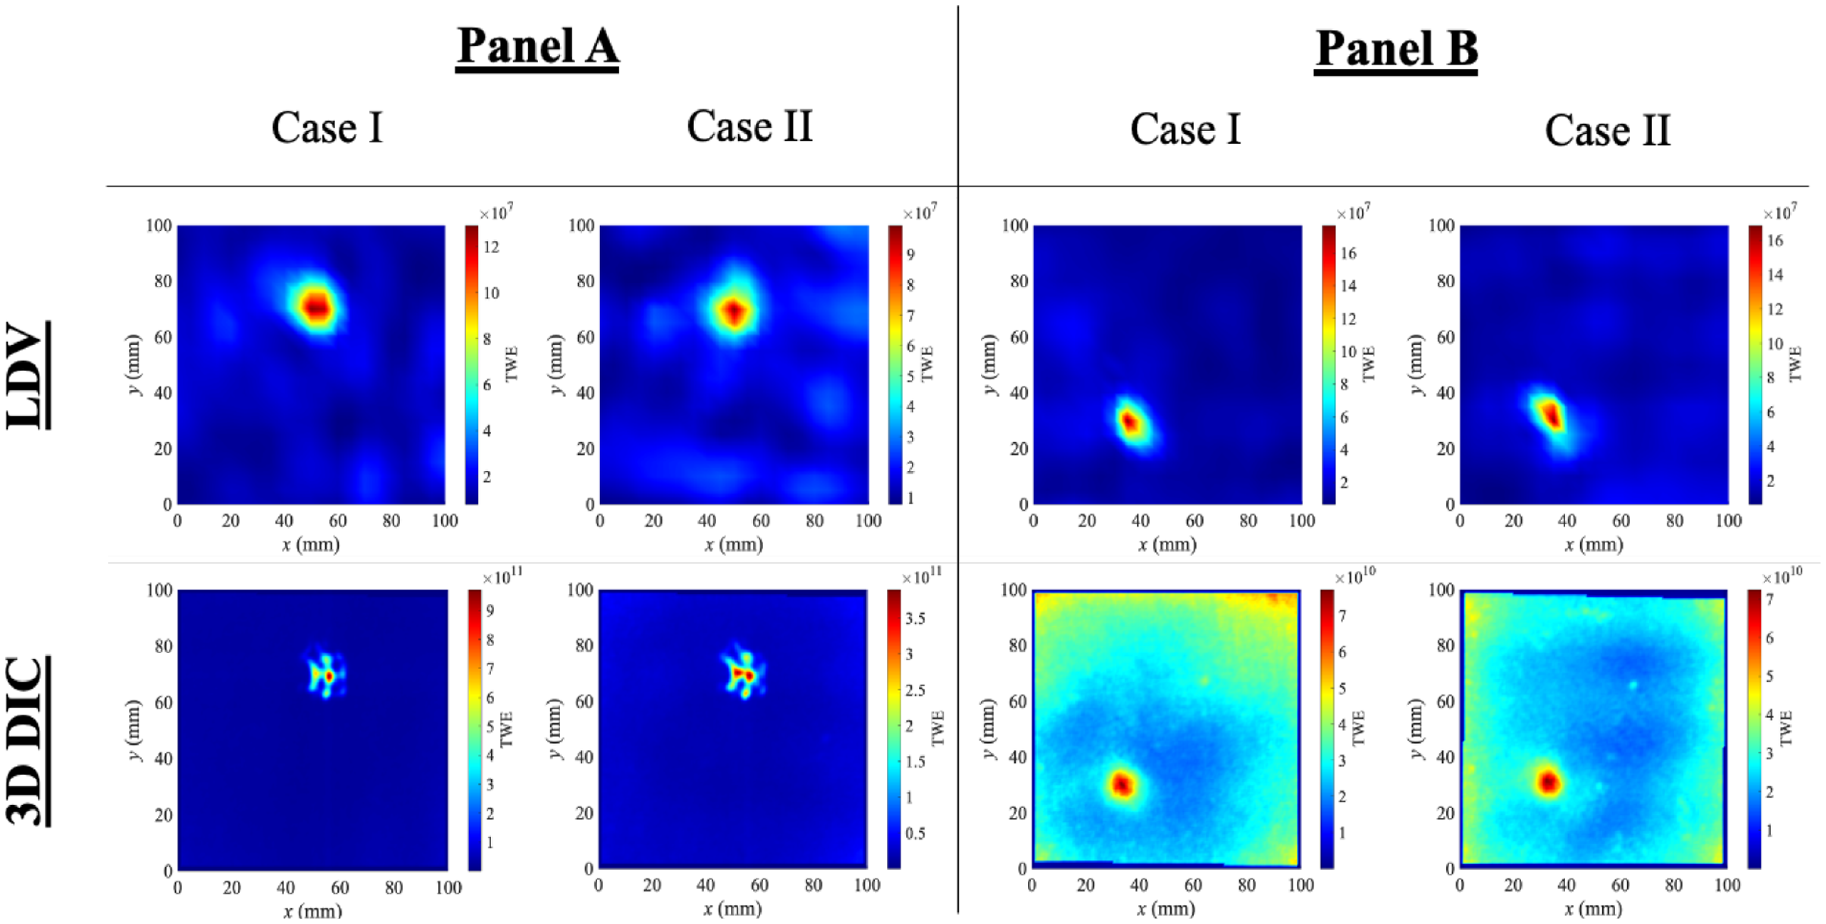
TWE damage images computed using the velocity from LDV are shown in the top row. For comparison, the TWE damage images derived using 3D DIC from Figure 9 are included in the bottom row.
Impact damage images from LDV in Figure 10 provide validation for the damage images generated using 3D DIC. Since the LDV spatial resolution was smaller, there is less damage definition in the LDV images. However, the magnitude of TWE at the damage location for panels A and B are similar in the LDV data, while different in the DIC data. The reduction of TWE seen in panel B from the LDV data could be due to some resonance being perceived to have a frequency below the high pass filter cutoff due to aliasing. Despite this, the proposed DIC method provides damage images comparable to LDV scans and can even offer higher damage definition with a significantly shorter sampling time (3 s compared to around 3 h). It should also be noted that the magnitude of the LDV and 3D DIC damage images should not be compared since the LDV images are derived from the actual velocity, while the 3D DIC images are derived from the product of displacement and frequency.
Summary and conclusions
In this work, an efficient and reliable stereo-camera system is developed using 3D DIC to visualize hidden impact damage in composite structures. The system overcomes significant pitfalls in a pioneering work by Chang and Yuan, 59 who employed a single camera for visualizing surrogate hidden damage in a flexible HPDE sheet using 2D DIC by capturing wave modes together with applying a couple of signal enhancement techniques. First, the use of 3D DIC allows the larger out-of-plane displacement to be captured in addition to low-amplitude in-plane displacements. This increases the SNR since the out-of-plane displacements are approximately one-order magnitude larger than those in-plane displacements, thereby increasing system sensitivity and increasing the maximum FOV of the camera. The required temporal resolution of the cameras is also significantly relaxed with the use of a TWE damage imaging condition, avoiding the need of quantifying the wave modes. The TWE condition uses an RT to extract the local instantaneous amplitude of the wavefield envelope, the square of which is proportional to the wave energy. Through the proposed TWE imaging condition, the 3D surface displacement video (u(x, y, t), v(x, y, t), w(x, y, t)) extracted using 3D DIC is converted to a physical domain, I(x, y), representing the subsurface damage image. Since each time instance contributes independently to the TWE, the TWE condition allows for temporal undersampling (sub-Nyquist) of video frames. This combined increase in sensitivity of the stereo-system allows for a larger, more practical FOV to be inspected in aerospace-grade materials.
Since the proposed technique does not require full wavefield reconstruction fulfilling Nyquist criterion, time-consuming and data-demanding signal enhancement techniques such as image stitching and sample interleaving for improving effective camera performance can be avoided so that only a single stereo-video is required to produce a clearer damage image. This reduces the time required for setup and data collection from many hours to a few minutes. With the TWE imaging condition, there is also no need to identify wave modes or know material properties a priori, which simplifies signal processing and improves robustness. Additionally, the use of a high-powered piezo-shaker further increases the signal magnitude to improve signal quality, and it can be applied and removed rapidly without permanently altering the surface. Initial validation efforts provide damage images showing relatively high contrast between regions of hidden subsurface damage and the background. Results are repeatable, positive identification of damage is independent of piezo-shaker position, and benchmark damage images from LDV support the validity of the TWE damage images from 3D DIC.
This work represents a big step towards developing a vision-based SHM system by visualizing subsurface damage (such as BVID) from videos of surface motion captured with a stereo-camera under operating conditions. While the time required to capture video frames is short, the image processing technique is hindered by the time required to process the 3D DIC algorithm. However, it is envisioned that the time required for this process will be significantly reduced as integrated chip technology continued to improve. Future work will reduce both the setup and processing time currently required is planned. As a first step, an off-axis single camera will supplant the stereo-camera (a pair of cameras) system. If successful, image decorrelation will then be employed as a replacement for the computationally intensive DIC algorithm. This is feasible since this signal wave energy-based imaging condition does not require displacement components to be known or knowledge of wave modes. Only the intensity of change needs to be quantified. Further, a projected speckle pattern will be used together with image decorrelation to replace the need for applying an artificial speckle pattern. This will circumvent the major limitation of DIC since painting or covering most in-service structures and vehicles with speckles may be impractical. Though the FOV in this work is limited to a region (100 × 100 mm) for imaging the localized impact using standing waves, it is also envisioned that the stereo-camera system can scan over the entire structure to capture the video frames at each FOV, followed by a stitching technique for damage imaging of the whole structure.
Footnotes
Declaration of conflicting interests
The author(s) declared no potential conflicts of interest with respect to the research, authorship, and/or publication of this article.
Funding
The author(s) disclosed receipt of the following financial support for the research, authorship, and/or publication of this article: The author, T Bryce Abbott, is grateful for the support from North Carolina Space Grant and the National Institute of Aerospace (NIA), Hampton, Virginia.