
Abstract
Quality assurance of adhesively bonded joints is of vital importance if their benefits are to be exploited across a wide range of industrial applications. A novel lightweight, low-cost, non-invasive embedded sacrificial sensor is proposed, capable of detecting damage within an adhesively bonded joint, which could also be used in a laminated composite structure. The sensor operation uses changes in electrical resistance, increasing as the sensing material area diminishes with damage progression. Initial tests prove the sensor concept by showing that the electrical resistance of the sensor increases proportionally with material removal, mimicking the sensor operation. Thermography is used to verify the current flow through the sensor and that any localised heating caused by the sensor is minimal. Short beam interlaminar shear strength (ILSS) tests show that embedding sensors in a composite laminates did not cause a reduction in material interfacial structural performance. Finally, the in situ performance of the sensor is demonstrated in quasi-static tensile tests to failure of adhesively bonded single lap joints (SLJs) with sensors embedded in the bond line. Prior to crack initiation, an electrical response occurs that correlates with increasing applied load, suggesting scope for secondary uses of the sensor for load monitoring and cycle counting. Crack initiation is accompanied by a rapid increase in electrical resistance, providing an indication of failure ahead of crack propagation and an opportunity for timely repair. As the crack damage propagated, the electrical response of the sensor increased proportionally. The effect of the sensor on the overall structural performance was assessed by comparing the failure load of joints with and without the embedded sensor with no measurable difference in ultimate strength. The research presented in the article serves as an important first step in developing a simple yet promising new technology for structural health monitoring with numerous potential applications.
Keywords
Introduction
Traditionally mechanical fasteners have provided a reliable and repeatable method of joining metallic components, requiring no surface preparations or controlled climatic conditions for manufacture and offering the convenient advantage of being easily disassembled. 1 Mechanical fastening in composite structures is not desirable, as it is necessary to machine holes, which even under highly controlled conditions can cause defects that serve as damage initiators. 2 Furthermore, holes loaded by contact from fasters result in large localised stress concentrations. 3 Aside from the issues associated with machining composites, the mechanical fasteners themselves increase overall weight, which is subvert to the primary purpose of using composite materials. There is also a financial consequence to increasing part count, each requiring frequent surveys and inspections, adding to maintenance costs, and reducing component service availability. Adhesively bonded joints are therefore an attractive alternative within the context of these concerns, eliminating the requirement for holes, and hence the additional weight and part count associated with fasteners. However, as detailed in Adams and Drinkwater, 4 adhesively bonded joints introduce new challenges associated with defects within the bond line of a joint which can reduce strength and stiffness.
There is a strong similarity between laminated composite materials and adhesively bonded joints, particularly in the sense that identifying and characterising defects remains a key barrier to further industrial uptake. Similar defects occur, and consequently similar non-destructive evaluation (NDE) methods are used to identify them.4,5 Many types of NDE have been developed over the past century and have been extensively reviewed by others for both composite materials and adhesively bonded joints.6,7 However, no single NDE technique is capable of detecting all types of damage. 8 Generally, the advantage of NDE is that damage is localised and characterised well, often providing visual full-field results, for example, C-scan and phased array ultrasound, thermography, radiography, shearography. However, the key limitations of NDE are that inspections are conducted periodically, 9 typically require access to the inspected region, and often requiring preparatory work, for example, removal of surface finishes and adjacent furnishings or equipment. The risk of damage occurring and propagating between inspections must therefore be weighed against the significant cost of frequent inspections of healthy structures.
In contrast to the above, continuous structural health monitoring (SHM) systems have the advantage that damage can be detected as it occurs, and often the rate of damage propagation can be obtained. Thus, informed decisions are enabled about when remedial work is required, whether to remove the component from service, or impose operational restrictions. Several continuous monitoring systems exist, some are well established, such as strain gauges and fibre Bragg gratings (FBG). Vibrational monitoring with accelerometers has been implemented on structures; however, the highly transient requires complex processing 10 and challenges remain in reliably distinguishing damaged states from healthy states. 11
Numerous authors have proposed thin film sensor technologies for continuous monitoring SHM applications, often based on carbon nanotubes (CNTs). For example, both displacement 12 and strain 13 measurements have been demonstrated using CNTs. However, there are limitations associated with the use of CNTs that are common to all these technologies. Typically, a conductive network of CNTs is required and the size, orientation and distribution of the CNTs are critical to system performance. 14 Manipulating the dispersion of CNTs remains challenging, requiring a combination of chemical and mechanical processing, 13 which prevents use on a large-scale components and adds to manufacturing complexity and lead time. Furthermore, handling of CNTs requires well-controlled environments. 15 Other thin film sensors include Intelligent Coating Monitoring Systems, which can be used to detect surface damage; however, these sensors are not suitable for detecting damage in bonded joints, or within composite materials.
To overcome some of the limitations presented above, in the present article a novel sensor arrangement based on a sacrificial, electrically conductive embedded layer in an adhesive joint is proposed. The concept aims to combine the damage characterisation typically associated with NDE, with the continuous monitoring capabilities of SHM. The article presents:
Proof of concept for a simple, easily manufactured, embedded sacrificial sensor capable of detecting damage initiation based on changes in electrical resistance occurring with increased joint damage, while causing no reduction in joint strength
Verification of the sensor operability using:
Thermography to establish the temperature increase in the vicinity of the sensors and identify current flow
Digital image correlation (DIC), to relate the sensor output to the onset of damage and crack growth
Demonstration of the non-invasive nature of the sensors through investigation of structural knock-down
Investigation of the effect of different spew fillet configurations in single lap joints using DIC.
Three key objectives are addressed in the current article. First is to establish whether an easily detectable change in electrical response occurs as the sensor material becomes damaged. Second is to assess the effect of embedding the sensor into a joint or composite material on component strength. Third is to demonstrate integration of the sensor into a component and confirm that the sensor does indeed become damaged as the joint becomes damaged.
Sensor concept
Traditionally, joint failure is grouped into three categories: adhesion, cohesion and mixed mode failure. 16 Adhesion failures are typically caused by poor surface preparation during manufacture, which can be minimised by good work practice and procedures. However, cohesion failures occur when the transverse normal stresses exceed the tensile strength of the adhesive, initiating cracks that then propagate in the adhesive layer. Mixed mode failure is a combination of the aforementioned cohesion and adhesion failures. The same through-thickness or transverse normal stress drive delamination failure of composite materials. Delamination is a particularly common type of damage occurring in composite materials, which has multiple possible causes such as overloading, particularly in compression, or impact. As the through-thickness stresses exceed the matrix ultimate tensile strength, interfacial cracks occur followed by separation of the laminate plies and subsequent delamination growth significantly reducing the strength the component. 5 In the cases of both the composite laminate, and the adhesively bonded joints, the damage propagation path is guided by stronger layers (adherend material or fibre reinforcement). This restricts the locations where damage can occur, and where it can propagate, presenting an opportunity for an embedded sensor to detect a common defect which has a significant impact on component strength.
The proposed sensor is based on the concept of a fragile, lightweight, electrically conductive material shown in Figure 1, which can be embedded within the bond line of an adhesively bonded joint. As a secondary application, it is envisaged that the same technology could be applied in interlaminar regions of composite joints. It is intended that as damage evolves in a component, the sensor material itself becomes damaged, hence causing regions of the sensor to become electrically disconnected from undamaged regions. It is expected that as sensor damage accumulates, the electrical properties of the sensor are altered. A simple property to measure and monitor is electrical resistance which has been exploited previously to detect fibre breakage damage in carbon fibre reinforced polymer (CFRP) composites. 17 However, breakage of reinforcing fibres is not an optimal means of assessing component health since fibre failure occurs immediately before or during component failure, and after significant damage has already occurred to the laminate. In contrast, due to the fragile nature of the sensor, the sensor degrades well in advance of ultimate material failure and provides a simple technique for monitoring matrix or adhesive damage. Using either a constant voltage power supply and measuring the current (or vice versa) and applying Ohms law allows the resistance of the sensor to be monitored. While the overall concept is not limited to the use of a single type of material, the sensor material used in this work is an electrically conductive veil, available in various weights from approximately 7–34 gsm. The veil is comparable to thin chopped strand mat, where the fibres are nickel-coated carbon. An image of the material used is presented in Figure 1, which has a thickness of 0.11 mm, weighs 20 gsm, and a tensile strength of 15 MPa.

Photograph showing sensor material construction.
In the case of an adhesively bonded joint, the material is embedded during adhesive application, prior to joining. When the sensor is used for damage detection in composites, it is incorporated into the laminate as an additional ply during laminate layup. Depending on the expected cause of delamination, this could be implemented between each ply of the laminate or just in a single location. For example, in the case of delamination due to impact, a single sensor placed near the surface would likely be sufficient, whereas if the damage initiation site is unknown, for example, due to overloading, additional sensors would be required. In either case, an electrical connection must be made to two opposing ends of the sensor, and therefore prior to implementation in an industrial setting an appropriate means of connection must be designed. While the power consumption of the sensor is dependent on the material and power supplies used, typically the sensor can be considered a low power device with consumption of several hundred milliwatts. It should also be noted that the power supply is not required to deliver power continuously and can be configured to pulse on only as sampling of the sensor state takes place, further minimising power consumption. The frequency of sampling is application dependent, whereby as the consequence of failure become more severe, the sampling frequency is expected to increase. However, the penalty associated with high sampling frequencies is low since only a single number (electrical resistance) must be recorded in each sample, and it is envisioned that samples will be taken at least once per minute.
Sensor response to material removal
Manufacture of test components and experimental setup
Fundamental to the hypothesised operation of the sensor is that the electrical resistance of the sensor will change as damage accumulates. To confirm this and to ensure that such changes are easily detectable, a series of experiments were conducted where material was removed from the sensors. While this is not a realistic representation of actual damage, it is envisaged that the in situ sensor would breakdown under load, with portions of material disconnecting from the sensor. The simulated damage is a means of assessing the how disconnecting portions of the material would affect electrical conductivity and if a loss of conductivity is detectable. The sensor material used for these tests was a nickel-coated carbon veil. A total of four test sensor types were manufactured with varying degrees of damage, simulated by simply removing areas of material as shown in Figure 2. Sensor (1) was an undamaged control. Sensor (2) had the smallest simulated damage with a 20 × 40 mm rectangle removed. To investigate the effect of increasing damage area, the simulated damage area in sensor (3) was double that of sensor (2). It was also hypothesised that two areas of damage in line with the flow of current could not be distinguished. To investigate this hypothesis and to further investigate the effects of damage area, sensor (4) had two squares removed of equal size (40 × 40 mm), thus doubling the damage area relative to sensor (3).
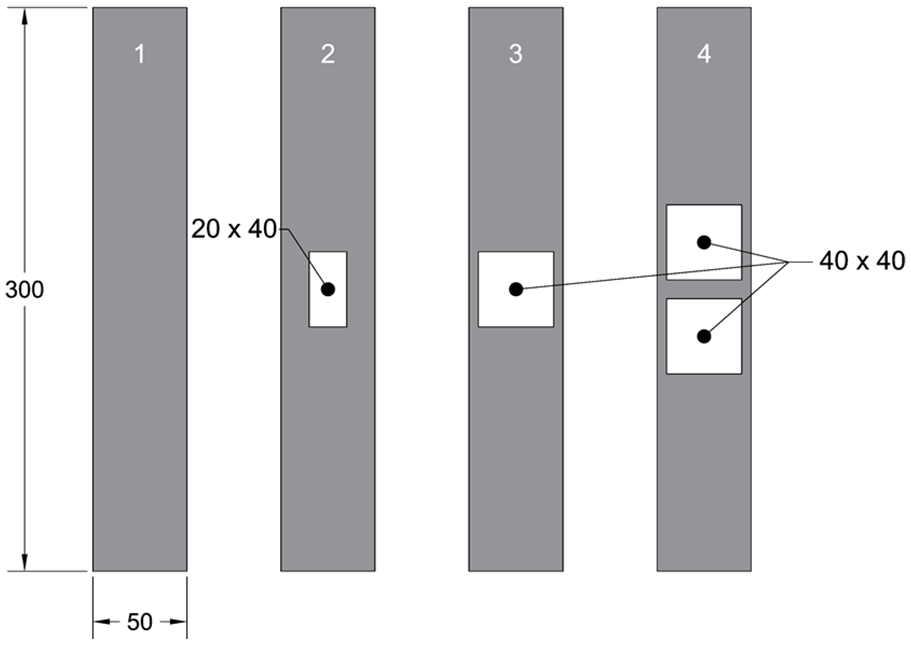
Variations of simulated damage in the sensors (all dimensions in mm).
To investigate the effect of adhesive or resin infiltration on the sensor electrical properties, the electrical response of the sensors was tested twice, before and after to embedding in the component. The sensors with the areas of materials removed were embedded in both glass fibre reinforced polymer (GFRP) and CFRP panels; in both cases the resin material was epoxy. While the sensor was embedded in the mid-place of a laminate, this was designed to represent encapsulation within the bond line of a co-cured composite joint. This also served the purpose of demonstrating the potential for implementation within a composite laminate. The CFRP specimens were used specifically to investigate whether the sensor could be used in conjunction with electrically conductive adherends using only the epoxy matrix in the composite as a means of electrical isolation. The CFRP was manufactured using biaxial woven carbon fibre pre-impregnated with Hexcel M26T epoxy to achieve quasi-isotropic electrical properties as this configuration represents a challenging case from a damage detection perspective. The four plies were all laid up in alignment, and co-cured in an autoclave with the sensors at 125°C for 2 hours at 4 bar pressure to form a 0.2 mm thick laminate simulating a co-cured joint. The GFRP specimen was manufactured using four plies of unidirectional (CYCOM 950-1A-29%). Since glass fibres are known electrical isolators, the ply configuration is trivial and was therefore laid in [0,0]s configuration with the sensor aligned perpendicular to the glass fibre direction resulting in a 0.4 mm thick laminate. The sensors were inserted in the mid-plane of the laminates (between the second and third plies) during layup of the pre-preg material. Both ends of each sensor protruded from the ends of the laminated composite components, so that the electrical connections could be made. The laminate, complete with sensors, was co-cured at 120°C at 3 bar pressure in an autoclave for 2 hours. Copper tape was secured to the protruding sensor ends after curing the composite material which provided reliable electrical connections and achieved a distributed introduction of current into the sensors. The overall experimental setup is shown in Figure 3. A constant voltage of 5 V power supply was connected to the sensors, using crocodile clips.
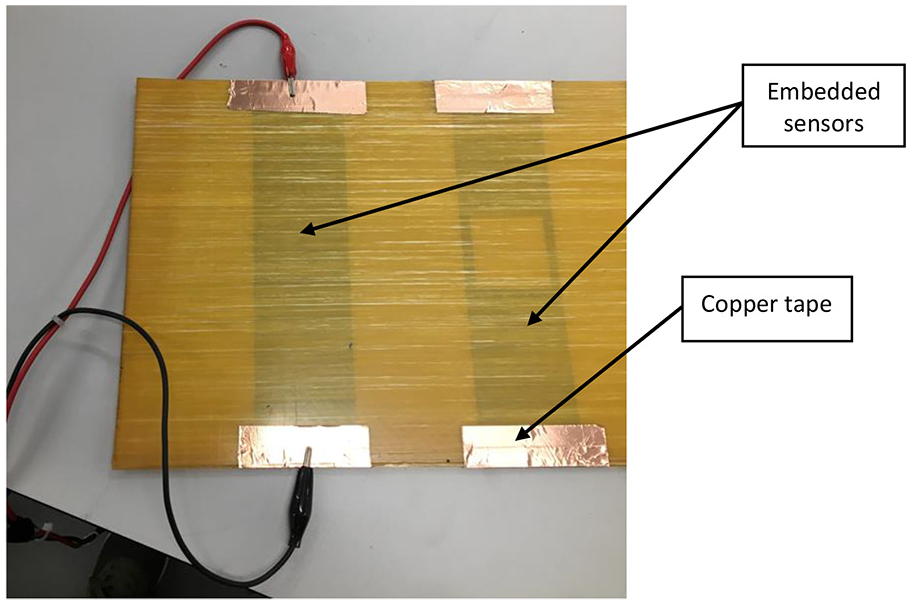
Integrated sensor experimental setup.
Monitoring electrical current
During testing, the electrical current flowing due to the 5 V supply voltage was monitored and recorded. Since changes in current are in fact due to the reduction in sensor effective cross-sectional area, and hence a corresponding increase in electrical resistance, it is appropriate to consider the electrical resistance. Based on the current measurements and the 5 V supply voltage, electrical resistance was calculated using Ohms law and presented in Figure 4. As shown, the sensor resistance increases as a function of area removal, with the resistance of sensor (4) r measuring approximately 5 times more than the control sensor (1). After the sensor is embedded into the component, the overall resistance increases. This can be attributed to the infiltration of non-conductive epoxy into the sensor during co-curing. Hence, the measured resistance for the control sensor (1) represents a baseline for the sensor system, which includes the epoxy matrix. Nevertheless, the resistance measured for each sensor remains a function of material removal area, and the overall trend was not significantly altered. However, when the sensor was placed used in conjunction with electrically conductive adherends, there was no change current measured with increasing material removal area. In addition, the current measured is equivalent to that measured prior to sensor integration, without any increase in resistance due to the epoxy infiltration. This indicates that the epoxy infiltration into the sensor during co-curing was not sufficient to electrically isolate the sensor from the conductive carbon reinforcement fibres, which are able to conduct the current, bypassing the area of material removal in the sensors.
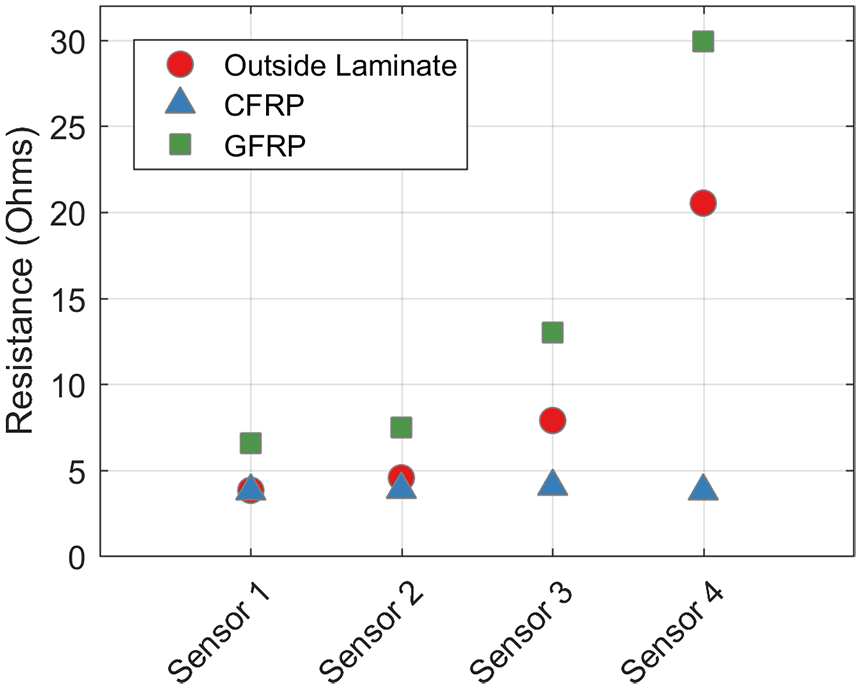
Resistance measured at 5 V applied to sensors before manufacturing, after integration into GFRP and CFRP. Measurements acquired prior to embedding are provided as the mean of the two sensors available for each damage type.
Verification of conductivity path using thermographic testing
To confirm the hypothesis that current was bypassing the sensor when embedded in CFRP, the electrical path was analysed using thermography by exploiting resistive joule heating of the sensor. Moreover, it is well known that the stiffness of many popular polymeric resins is degraded as temperature is increased towards the material glass transition temperature. 18 In the case of the two laminates manufactured, the supplier specification indicates that the elastic modulus of the resin system begins reduce dramatically above approximately 150°C. Thus, a further goal was to quantify the heat generated by the sensors and determine whether it is sufficient to appreciably degrade structural performance. While the low thermal diffusivity of the resin dominates the through-thickness laminate thermal properties, the thin laminates used ensure that the surface temperature approximates the sensor temperature.
A Telops Mk2 FAST-IR photon detector infra-red (IR) camera was used to image the surface of the specimens. The sensors were activated for 10 seconds, and all thermographic data were recorded at 383 Hz using Reveal IR (Telops proprietary software), and imported to Matlab 2016a where they were visualised using a specially developed image processing script. Since the specimens were unpainted, a surface emissivity of 0.9 was assumed and compensated for prior to data visualisation to obtain accurate absolute temperature measurements. The imaged surface was the peel ply side of the laminate which is known to have high emissivity. Tests were conducted in a temperature controlled laboratory, and ambient temperature data of the surfaces were available to confirm the emissivity used was appropriate.
All data presented in this section are taken from the last frame recorded giving the maximum time for the sensor to heat. Figure 5 presents data from the GFRP specimen, showing that all the sensors generated sufficient heat on the specimen surface to be detected by the IR camera and hence identify the current path through the sensor. Each column of the presented data frames was analysed to identify the peak temperatures within the field of view, indicated in Figure 5 by a dashed line. The temperature distribution along this line is presented in Figure 6 to identify the peak temperatures.
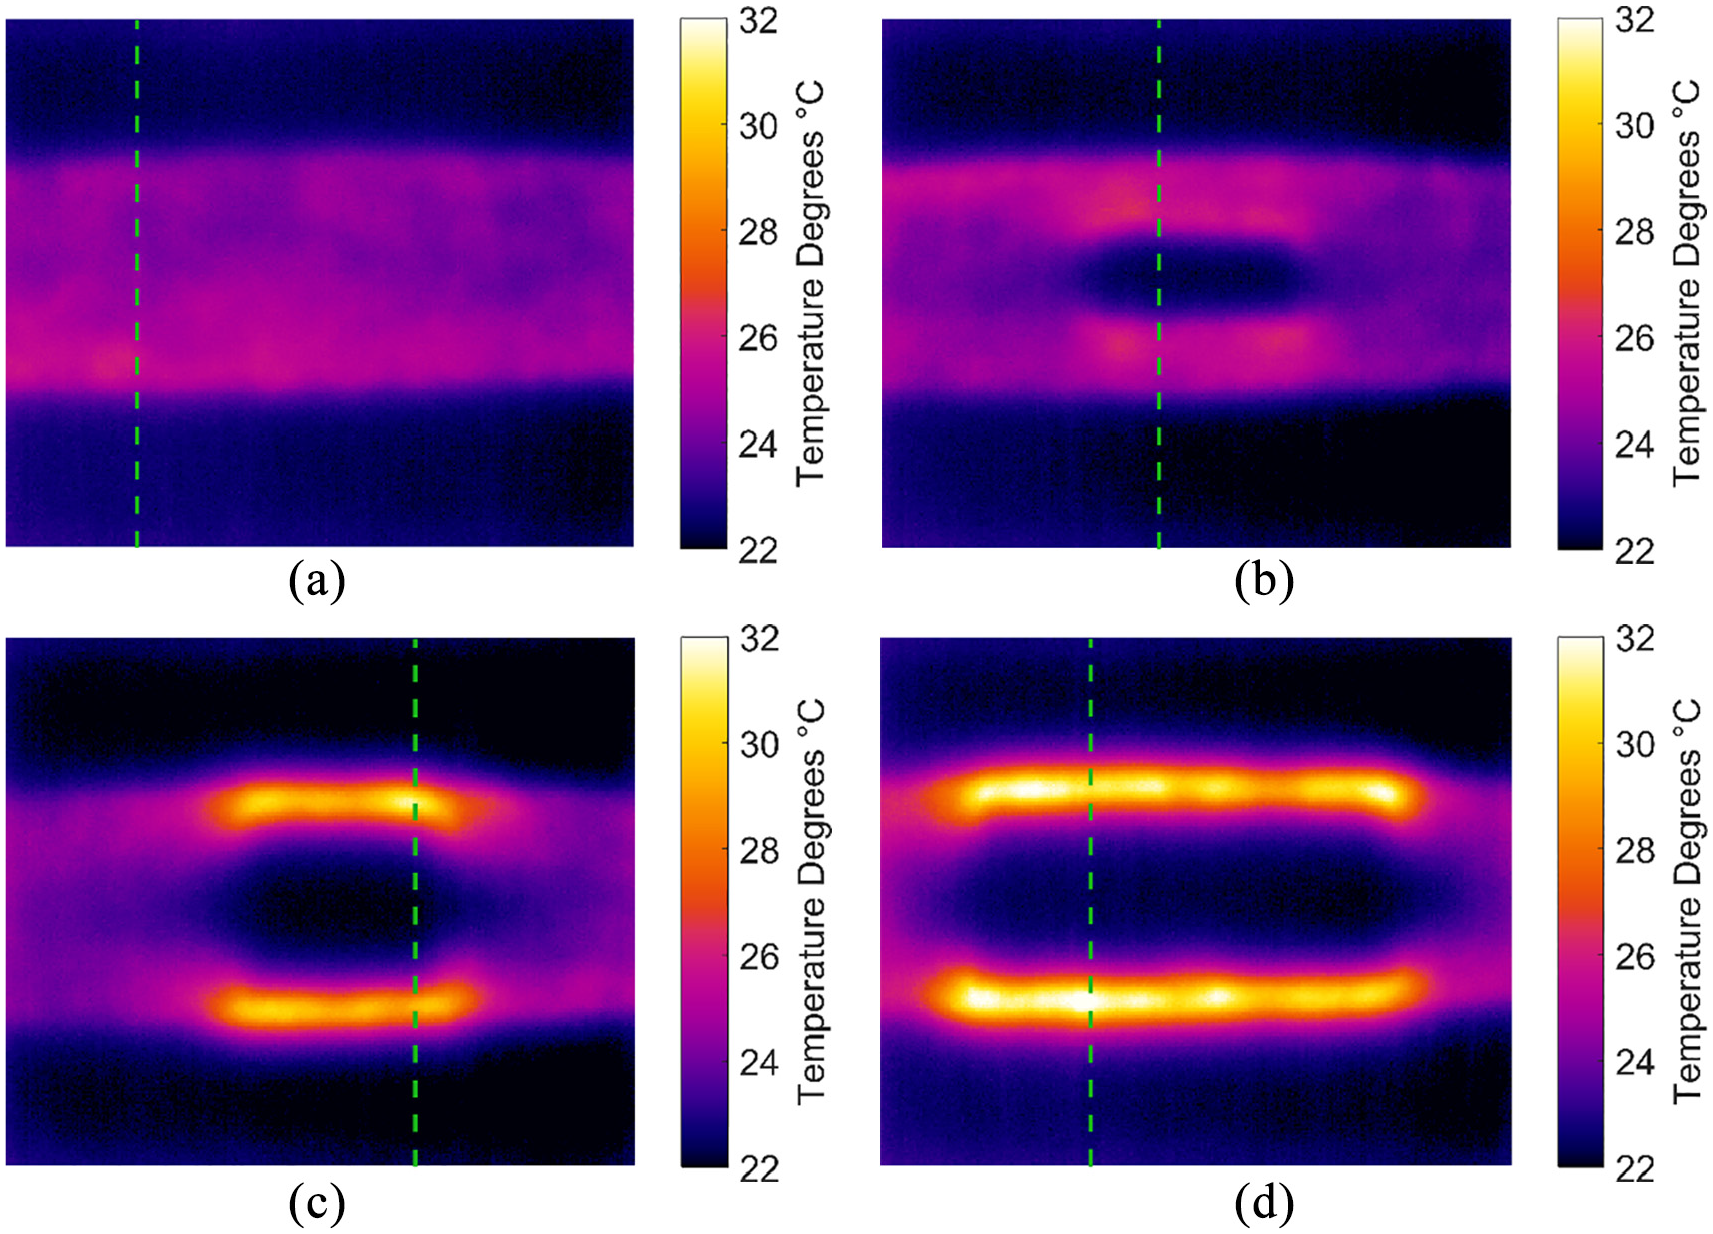
Thermographic results for GFRP specimens with embedded sensors: (a) Undamaged; (b) 20 × 40 mm area removed;(c) 40 × 40 mm area removed; (d) two 40 × 40 mm areas removed.
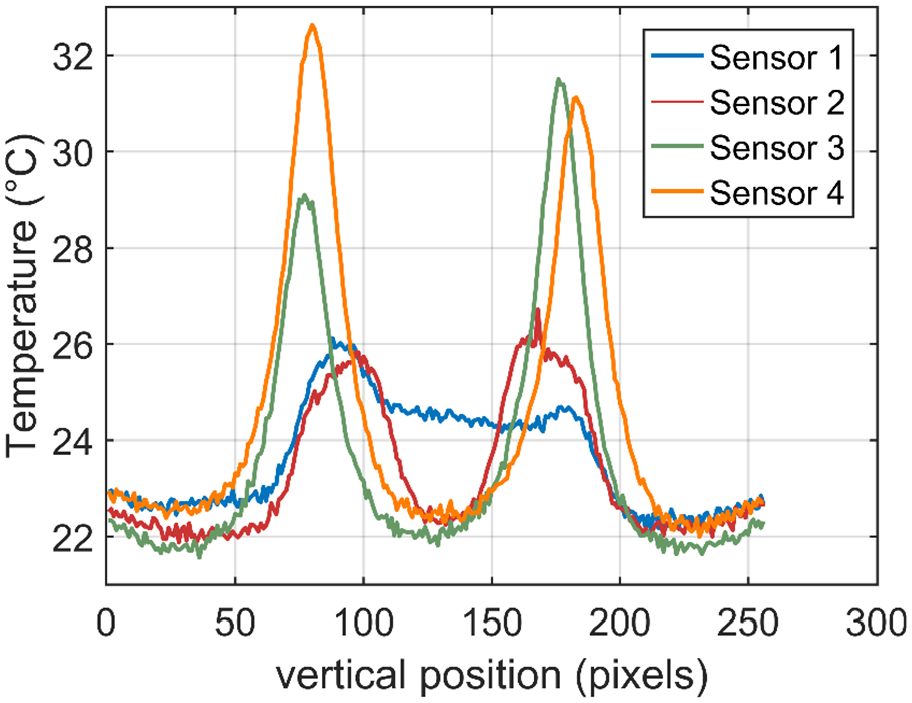
Temperature distribution along the lines shown in Figure 5.
Figure 5(a) shows the current flowing evenly through the undamaged sensor (1) represented with a practically uniform increase in temperature in the centre of the field of view of 2oC–4oC compared with the surrounding GFRP material. However, there appears to be a slight gradient across the sensor with the bottom portion heating more and hence showing increased resistance to the current, possibly due to increased resin in this region. In practice, this is inconsequential since in service resistance measurements are relative, that is, they are compared with a known undamaged base case. The thermal data for sensor (1) indicates that prior to damage onset, the resistive heating is modest when compared with the resin glass transition temperature and hence is unlikely to degrade the laminate stiffness. Considering sensors (2), (3) and (4) shown in Figure 5(b, c, d), respectively, the temperature in undamaged regions is comparable to that measured in sensor (1). Higher temperatures are present in regions immediately adjacent to areas of simulated damage where the effective cross-sectional area of the sensor is reduced, thus local electrical resistance and resistive heating are increased. With increasing damage the peak temperatures increase, with measured temperatures rising to approximately 2°C, 6°C and 7°C relative to the mean temperature of the undamaged sensor. Nevertheless, the temperatures measured are significantly below the glass transition temperature of either laminate resin system, indicating even in a damaged state the performance of the laminate would not be impaired by heating of the sensor. Furthermore, it should be noted that there is no requirement for the sensor to be continually activated, rather short pulses of current could be used to avoid increasing laminate temperature.
Figure 7 shows the thermal response of the CFRP laminate when the sensor is excited by the current flow and clearly the sensor is no longer apparent. Instead a concentration of heat is observed local to the input of electrical current. In addition, greater lateral diffusion can be observed in the vertical direction, indicating that either heat is conducting along the fibres, or that current is flowing in a more distributed manner through the woven carbon material. The combination of these observations confirms the previously stated hypothesis that the current is bypassing the sensor, and instead conducting into the electrically conductive carbon fibres. This is a limitation of the current configuration which involves co-curing of the sensor material within a laminate, enabling contact between the sensor fibres and the carbon fibres. Clearly, the proposed sensors in their current configuration are best suited to non-conducting substrates such as high value GFRP structures as used in shipbuilding and wind turbine structures. However, it is possible that this could be overcome by first infusing the sensor material thus isolating it from the laminate fibres prior to embedding to provide a sensor configuration that can be used in a conductive material.
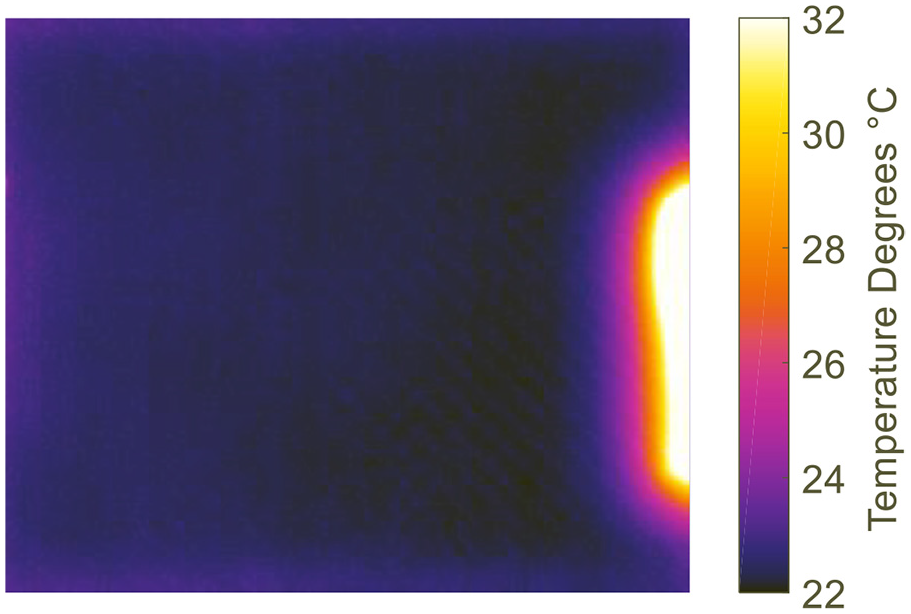
Thermal response of sensor embedded in CFRP.
Investigation of structural knock-down in laminates
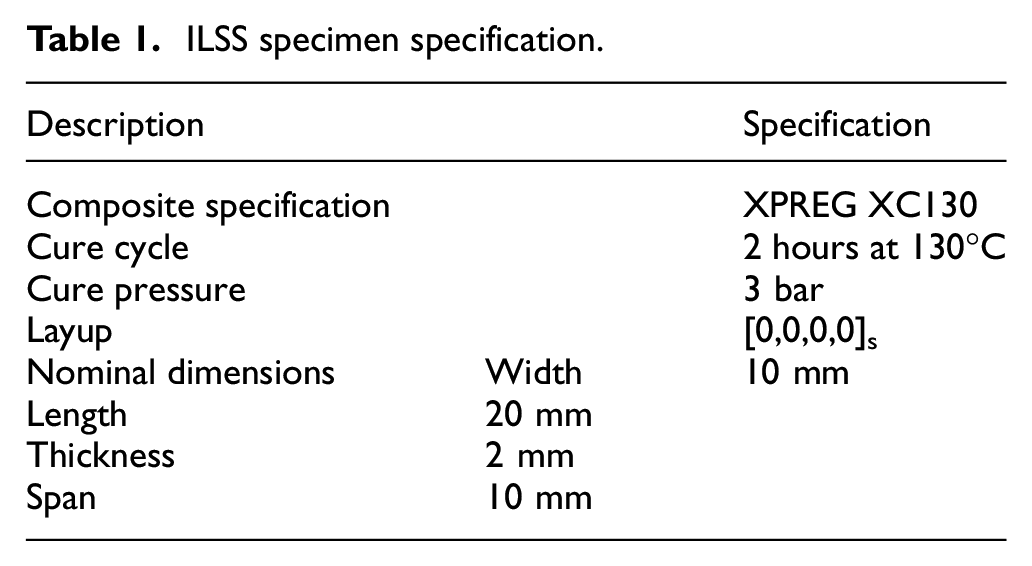
To assess the effect of embedding the sensor on the strength of a laminate, ILSS testing was carried out in accordance with BS ISO 14130. 19 Initially specimens were manufactured using the same GFRP; however, these failed in unacceptable modes of failure (e.g. compression, bottom ply tension or plastic deformation) rather than interlaminar shear. Since ILSS is dominated by the properties of the matrix rather than the reinforcement, new specimens were manufactured using CFRP pre-preg with an epoxy resin system similar to the GFRP used in the SLJs. Using CFRP increased the bending stiffness while the ILSS remained largely unchanged. This increased the likelihood of interlaminar shear failures relative to other (unacceptable) types of failure. In addition, since the experiment is comparative in nature, the ILSS measured is not of interest, rather the difference between specimens with and without embedded sensors. Two identical panels were manufactured using pre-preg composite material measuring 150 × 150 mm. One was a control, the other contained an embedded sensor placed in the mid-plane of the laminate, between the fourth and fifth plies. These were cured in an autoclave and cut to size as detailed in Table 1. All specimens were cut from the centre of the panel to avoid edge effects and ensure consistent laminate thickness across all specimens.
ILSS specimen specification.
The ILSS for each specimen was calculated using the maximum force measured and the measured cross-sectional area of each specimen as detailed in the standard. 19 The peak shear strength is presented in Table 2, where all specimens not failing in interlaminar shear were excluded from the presented data. The data are generally consistent; however, there is one clear outlier in the control group which failed at a significantly lower load than all others. The reason for this outlier could not be determined but is likely due to some form of edge defect either from manufacturing or cutting which initiated failure at a reduced load. A one-way analysis of variance gives a p-value of 0.766, suggesting that there is no significant statistical difference between the control and sensor specimen ILSSs. The analysis was repeated with the extreme outlier (38 MPa) removed from the data set, which reduced the standard deviation resulting in a p-value = 0.304 (i.e. p >> 0.05). Thus, even when this extreme outlier is excluded, there remains no statistical basis to suggest that embedding of the sensor material has any effect on the ILSS. The conclusion is therefore that embedding the sensor does not cause a reduction in structural performance, so the next stage of the study is to demonstrate the sensor in a structural context in an adhesively bonded joint.
ILSS Results.
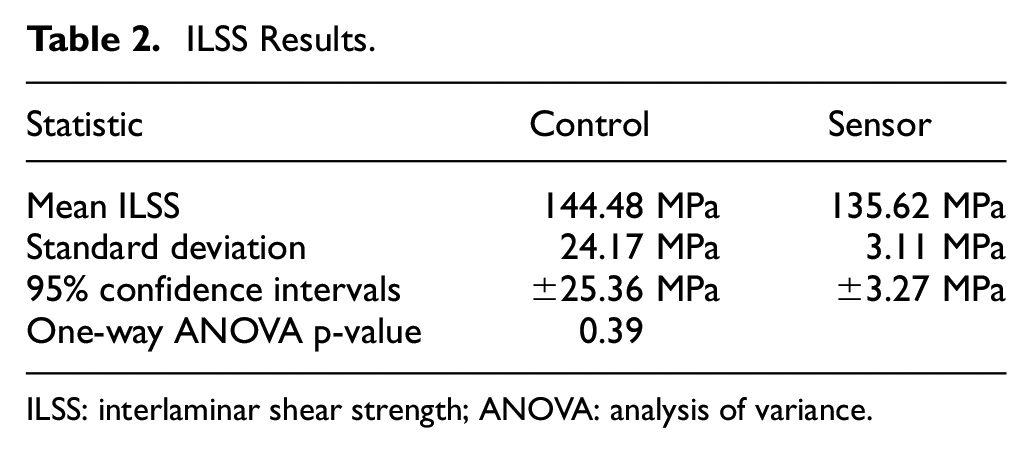
ILSS: interlaminar shear strength; ANOVA: analysis of variance.
Electrical response of sensor embedded within single lap joint
The results present in the previous sections of the article have assumed that the conductive ability of an embedded sensor would be reduced in a similar way to removing material from the sensor. As damage evolves adjacent to the sensor in a component, the sensor damages, and the electrical resistance of the sensor changes and the change in resistance can be related to damage. To the hypothesis, a testing campaign was devised on single lap joints (SLJs) specimens with sensors embedded that are tested in quasi-static tension to failure. Testing the joints to failure also allowed confirmation of the effect of the sensor on joint strength. In addition, the experimental setup enabled a study of spew fillet geometry, which is known to affect stress distributions and thus joint strength. 20 SLJs have been studied extensively by numerous authors, notably,21,22 and are well understood. Under tensile loading, peel (transverse normal) stresses accumulate at the ends of the overlap region as adherend rotation occurs. These stresses exceed the ultimate tensile strength of the adhesive resulting in cracks which propagate along the adhesive bond line. This type of failure is also representative of many other adhesively bonded joints used in industrial applications for example, the maritime industry. 23 Therefore, embedding the proposed sensor in SLJs serves as a useful demonstration of implementation in an industrially relevant structure.
Test components
A total of 12 SLJs were manufactured, 6 included embedded sensors and 6 control specimens without sensors. GFRP was used for both substrates of the SLJs to ensure the current flowed only through the sensor and not through the substrates, as previously discussed. The specimens were manufactured in two batches, each containing three sensor and three control specimens. The joint geometry was based on ASTM D5868 24 standard test method for adhesion in fibre reinforced plastic SLJs. The geometry was modified as shown in Figure 8(a), where the thickness and layup of the two substrates was intentionally altered relative to the standard such that one substrate was thicker than the other. This ensured that failure consistently initiated at the same end of the overlap region, aiding visual confirmation detection of crack initiation. The layups used were [0, 90, 0]s and [0, 90]s for the thick and thin substrates, respectively. The joints were manufactured by bonding two laminates together to form a 300 mm wide panel from which vertical strips were waterjet cut to form the geometry described in Figure 8(a). Both laminates were manufactured using RP-528 (PRF Composites) pre-preg material cured in an autoclave at 120°C and 3 bar for 2 hours. Similar to the specimens in ‘Sensor response to material removal’ section, copper tape was bonded to the substrates to facilitate electrical connections. Bonding of the panel was achieved using a two-part epoxy adhesive, Araldite 2015 (Huntsman). Adhesive was applied to the overlap region of both substrates, and a rectangular area of sensor material (approximately 45 × 150 mm) was positioned onto the adhesive. The sensor therefore covered approximately half the width of the panel, with approximately 10 mm of sensor material protruding from top and bottom of the overlap region. Additional adhesive was used to secure the protruding ends of the sensor to the previously placed copper tape before the two substrates as shown in Figure 8(b), thus forming an electrical connection. Shims were inserted at the panel edges to obtain a consistent bond line of 0.2 mm. Finally, the two substrates were brought together, clamped at the overlap regions to expel excess adhesive and achieve the desired bond thickness. A wooden tongue depressor (spatula) was used to shape different spew fillets. Various geometries were created, including no spew fillet, rounded concave, rounded convex, square and natural, as shown in Figure 9. The panels were then allowed to cure for 12 hours at ambient temperature. The panels were waterjet cut into strips to form the individual SLJ specimens.
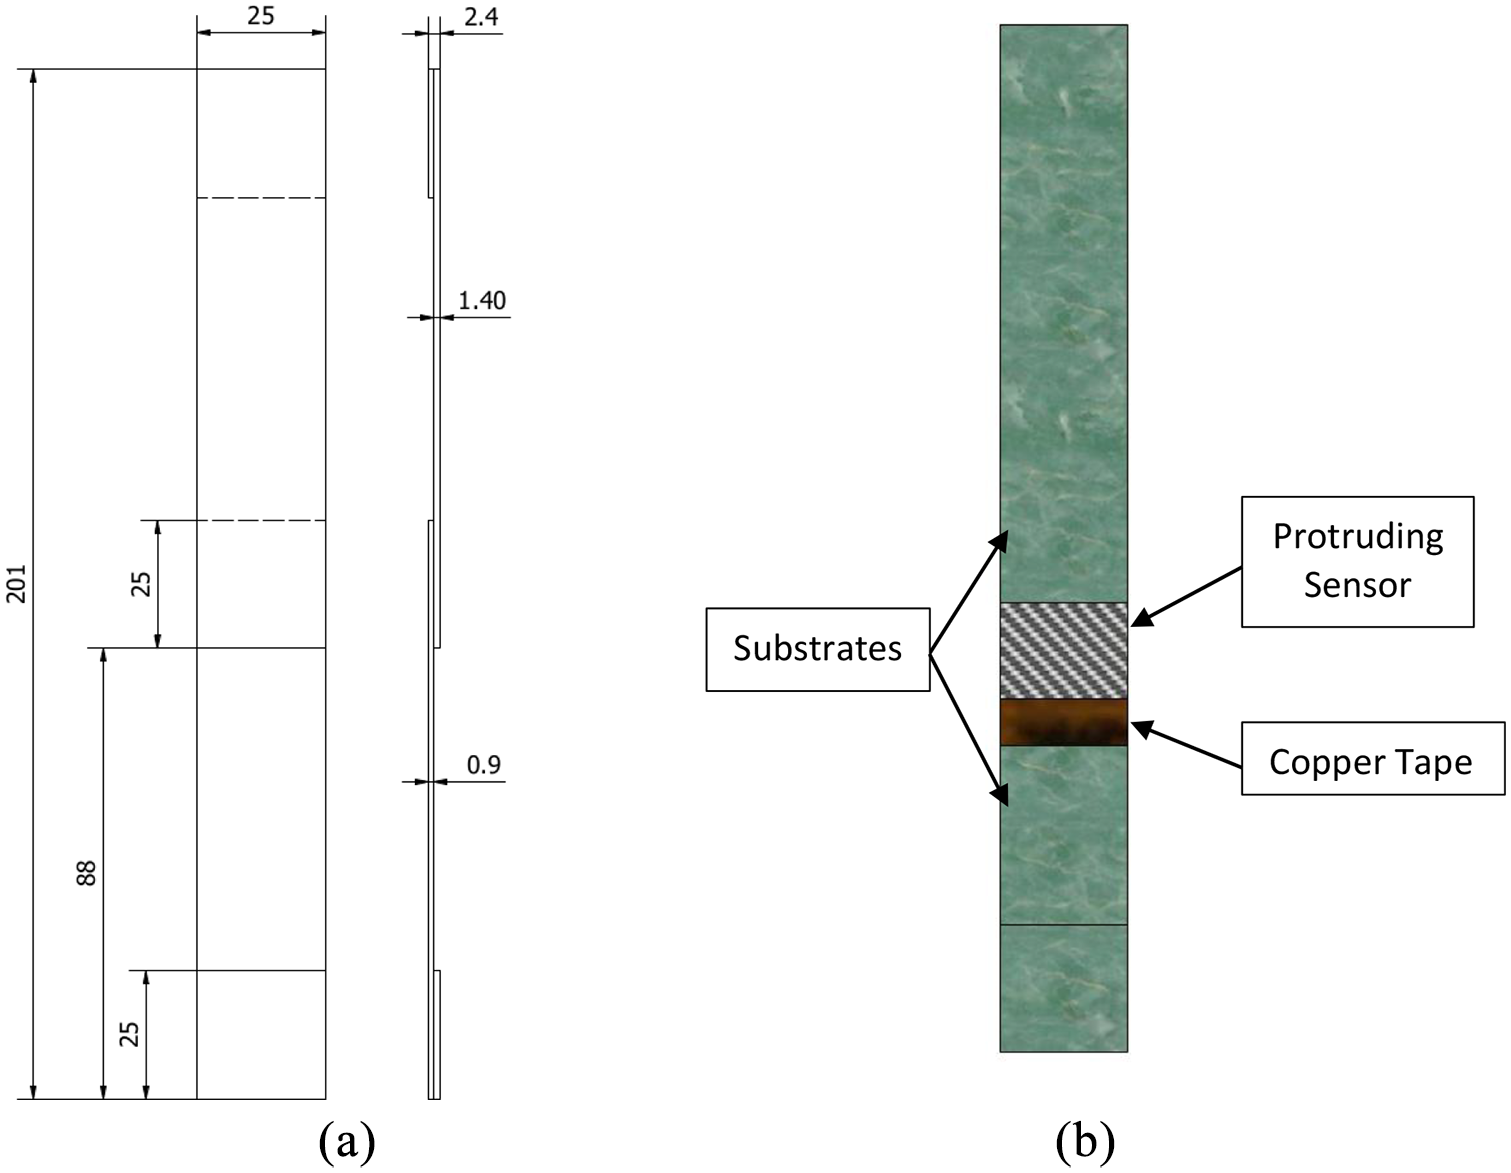
Single lap joint manufacturing: (a) SLJ geometry; (b) schematic showing sensor arrangement.
SLJ experimental setup.
Experimental setup
Imaging was used during the tests on the SLJ to visually identify cracks. Moreover, imaging enables the application of DIC, so that full-field strain and displacements maps can be obtained over the field of view. Importantly, the high resolution DIC performed here can capture the build-up of transverse normal strains at the adherend ends which cause failure. It should be noted that DIC captures surface deformations and strains and hence it is assumed that damage propagation is relatively uniform through the width of the SLJs. The only alternative to viewing the surface crack propagation is to use X-ray CT with in situ loading. This was deemed impractical for the present study, due to difficulties with the rig design, achieving the necessary loading and the need to pause the test to take the images. However, a clear avenue for future work to investigate the interaction between the sensor and the damage is with X-ray CT.
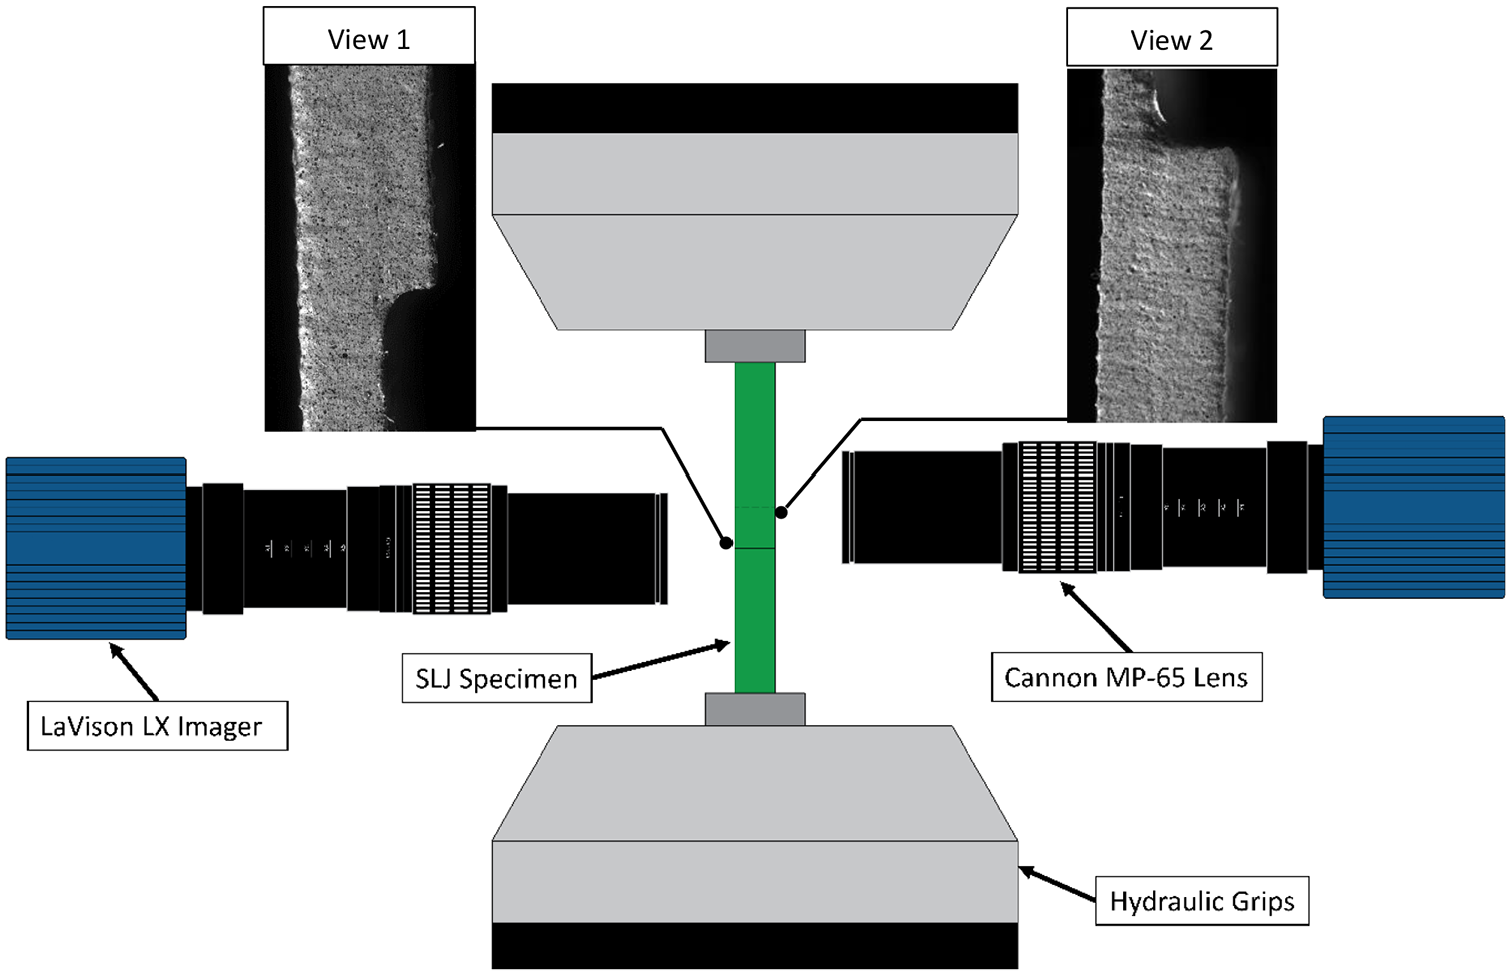
The test setup and approximate field of view for the DIC is shown in Figure 9, which is on the through-thickness plane of the specimen. Hence, the edges of the specimens were coated with a speckle pattern applied by first spray painting across the field of view with matt white paint, and then applying black paint to produce the speckles using an airbrush. A selection of speckle patterns pertaining to specimens discussed in further detail in ‘Sensor electrical response under load’ section is presented in Figure 10, showing relatively even distribution of speckles. As previously stated, both convex and concave spew fillets were manufactured, which are also presented in Figure 10.
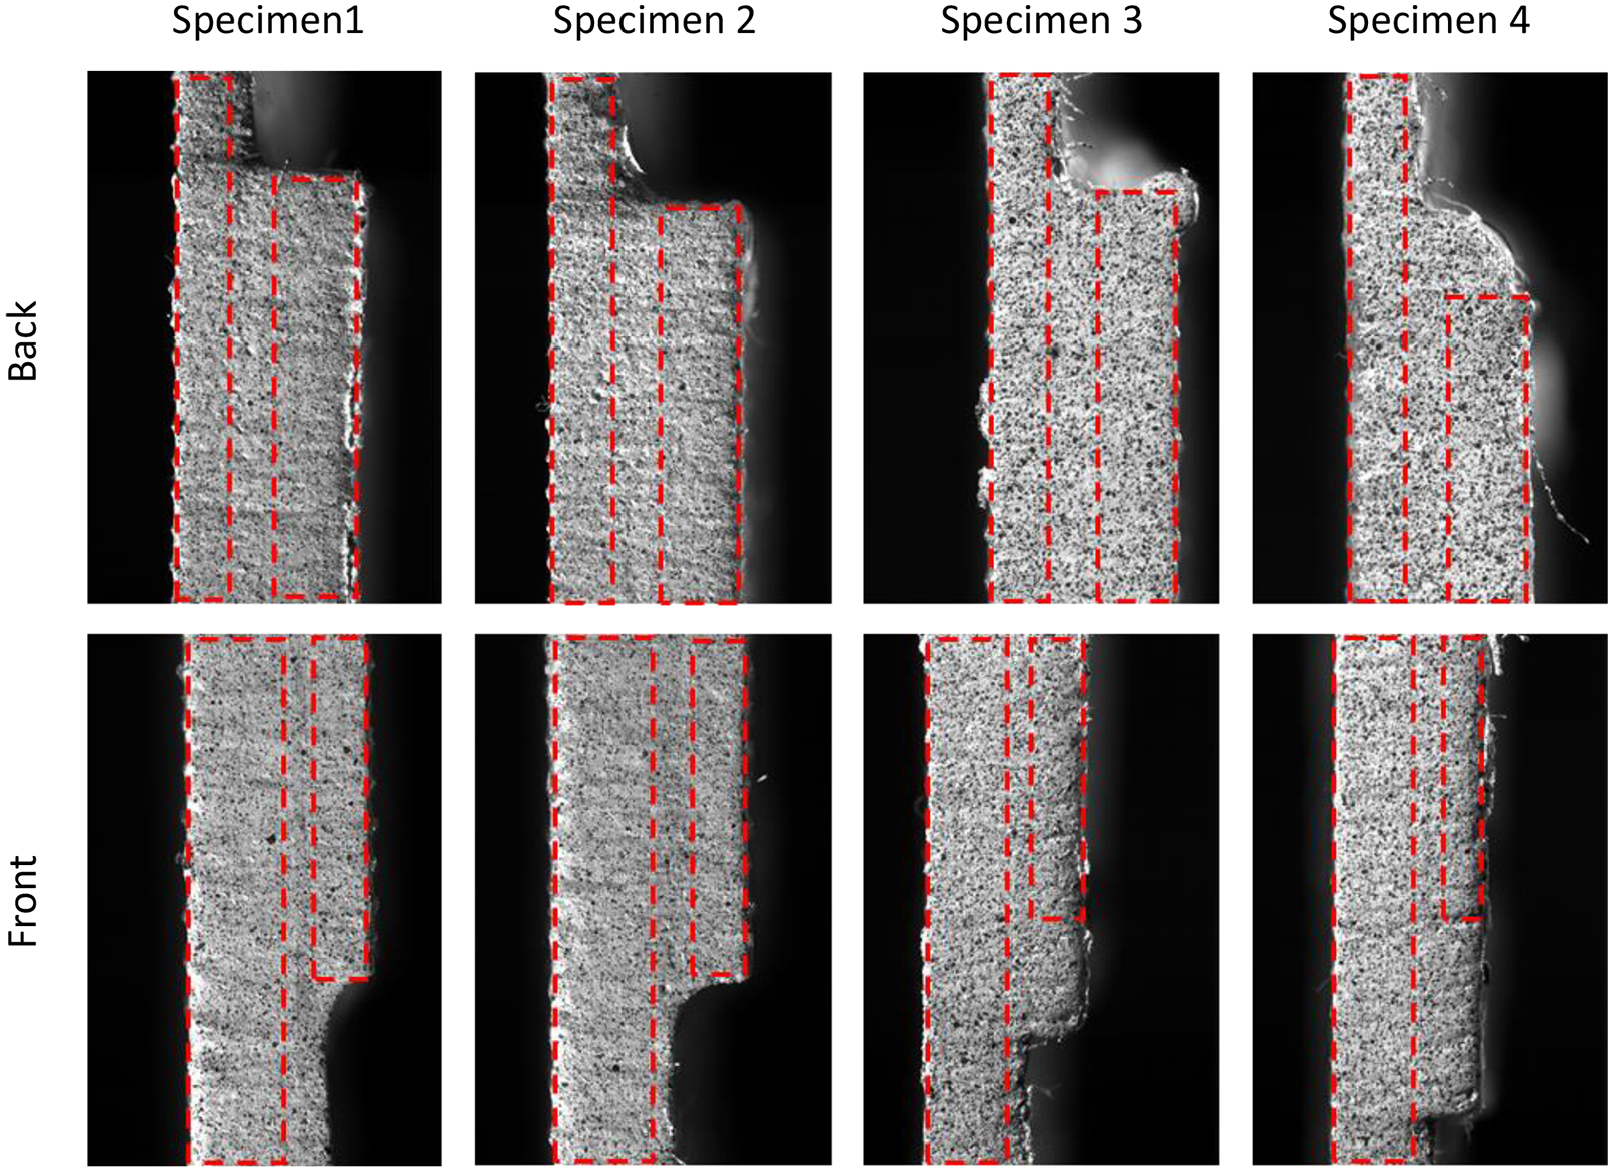
White light images of each field of view showing speckle patterns achieved, with red dotted lines showing approximate position of adherends highlighting the spew fillet configuration tested.
The SLJs were mounted in an Instron 8800 servo-hydraulic test machine. As the required field of view is small (approx. 4.3 × 6.4 mm), it is necessary to use a high resolution DIC setup to capture data relating to damage initiation similar to Crammond et al. 25 and Ramachandran et al. 26 Macro lenses at five times magnification and high-resolution cameras as specified in Table 3 were used either side of the specimen as shown in Figure 10. 2D DIC was used since the short standoff distance (~10 mm) required to obtain the desired field of view did not permit the use of two cameras and hence stereo (3D) DIC. One camera viewed the upper end of the overlap region and the other at opposite side of the SLJ viewed the lower end of the overlap to capture both initial crack onset, and final joint failure. As the width of the specimens exceeds the thickness by an order of magnitude, therefore, out of plane bending and hence out of plane displacements are considered to be insignificant. To avoid misalignment, a digital inclinometer was used to position the specimens into the test machine, and to align the camera sensors to within 0.1 degrees of the specimen.
DIC performance table.
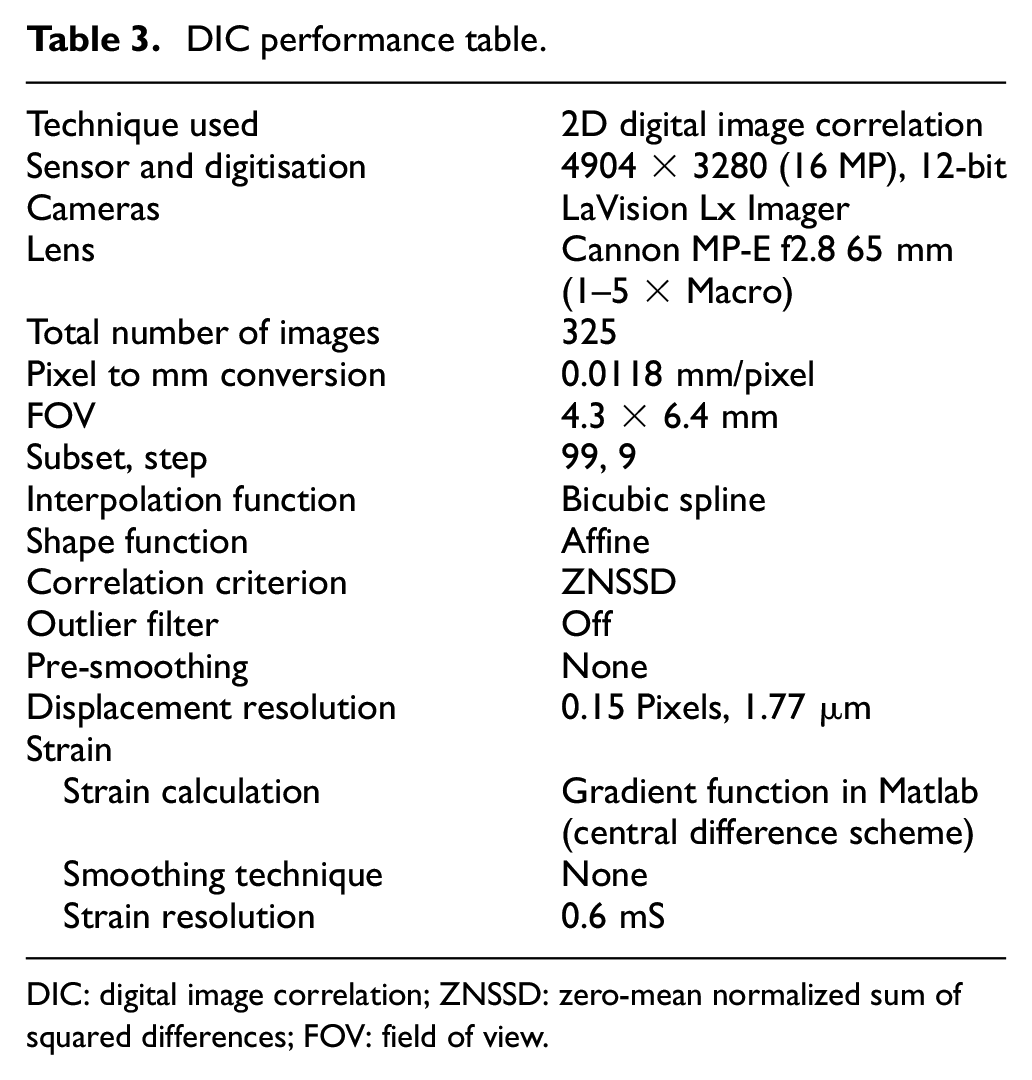
DIC: digital image correlation; ZNSSD: zero-mean normalized sum of squared differences; FOV: field of view.
Wires were soldered to the copper tape applied during SLJ manufacture. These wires were connected to a bench top power supply set to a restricted 100 mA current. In this configuration, the power supply will increase the supply voltage until either the voltage or current limit is met. By setting a low current limit, a small voltage is sufficient to supply maximum allowable current. As the resistance of the sensor increases, the voltage required to supply 100 mA increases, and thus monitoring the voltage provides a means of monitoring the resistance of sensor during the test. This is advantageous since most DIC systems measure voltage using an analogue to digital convertor (ADC) to record test machine load cell output voltage for each image recorded. The sensor resistance was monitored by connecting the sensor circuit to a second channel on the ADC. Therefore, a voltage reading was measured for, and encoded into, each image recorded by the DIC system. The power supply used had a maximum output voltage of 2 V, which was selected to protect the DIC system ADC for accidental overloading.
With all the instrumentation set, the SLJ specimens were loaded in quasi-static tension to failure in displacement control at a rate of 2 mm per minute. All data were acquired at a frame rate of 2 Hz using DaVis 8.3 and was processed using DaVis 10, both supplied by LaVision using the processing described in Table 3 to obtain displacements in x and y directions, to extract load data, and extract voltage readings from the sensor. These data were exported to Matlab 2016a for all additional processing.
Sensor electrical response under load
As discussed previously, embedding of the sensors increases the electrical resistance of the sensor due to epoxy infiltration within the sensor material. All resistance measurements are hence taken relative to a known undamaged baseline. During testing, it was found that the baseline resistance of Sensors 5 and 6 was sufficient to saturate the 2 V power supply. Hence, these data are excluded from this results section, but are included in failure analysis presented in ‘Effect of sensor embedment on joint strength’ section. Figure 11 shows the voltage recorded throughout each test for each of the remaining sensors, whereby the baseline voltage has been subtracted from the entire temporal signal. This presents a clear response relative to the undamaged state and is shown against applied load which is normalised by the specimen failure load.
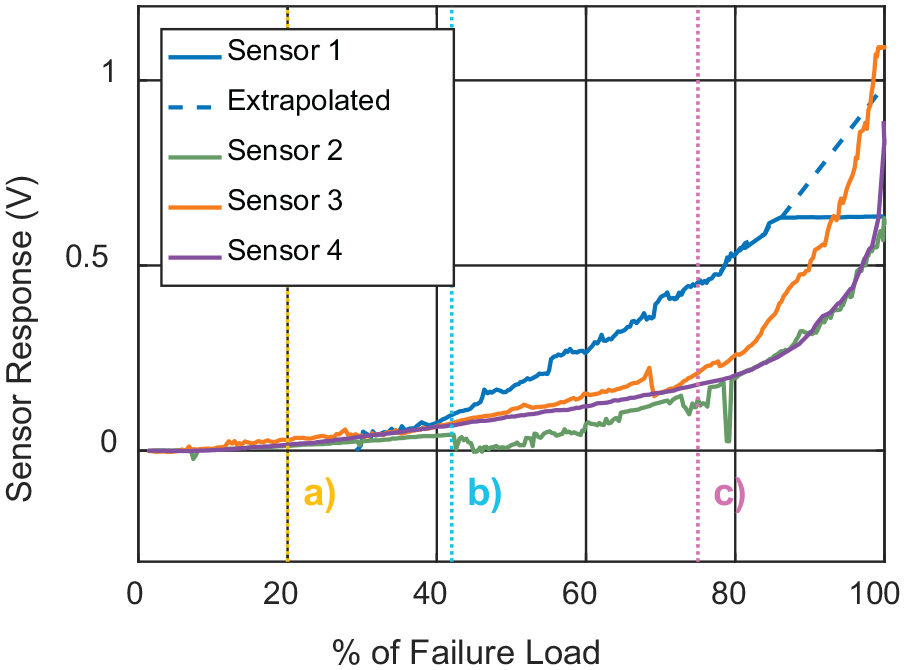
Electrical response of all sensors.
The response shows three distinct phases, whereby at 0%–40% (position a) of failure load the electrical response slowly and smoothly increases. In this region, the data obtained for each sensor closely match one another, with all sensor responses appearing similar. At approximately 45% of failure load (marked as position b), sudden changes in electrical response occur, particularly in sensors 1 and 2. By contrast, while still increasing in gradient, the response of sensor 3 and especially sensor 4 is smoother. As failure approaches, larger and more abrupt changes are apparent in the electrical response of all four sensors (position c). Sensors 2–4 go on to exhibit almost exponential increase in electrical response as failure becomes imminent. Unfortunately, in the case of sensor 1, the resistance of the sensor increased to such an extent that the required voltage saturated the power supply (2 V) during the test. This causes an apparent plateau in the electrical response of sensor 1, occurring at approximately 85% of failure. Where saturation occurred, a linear extrapolation was implemented to suggest likely sensor response as the joint approaches failure load, showing good agreement with other sensor response data.
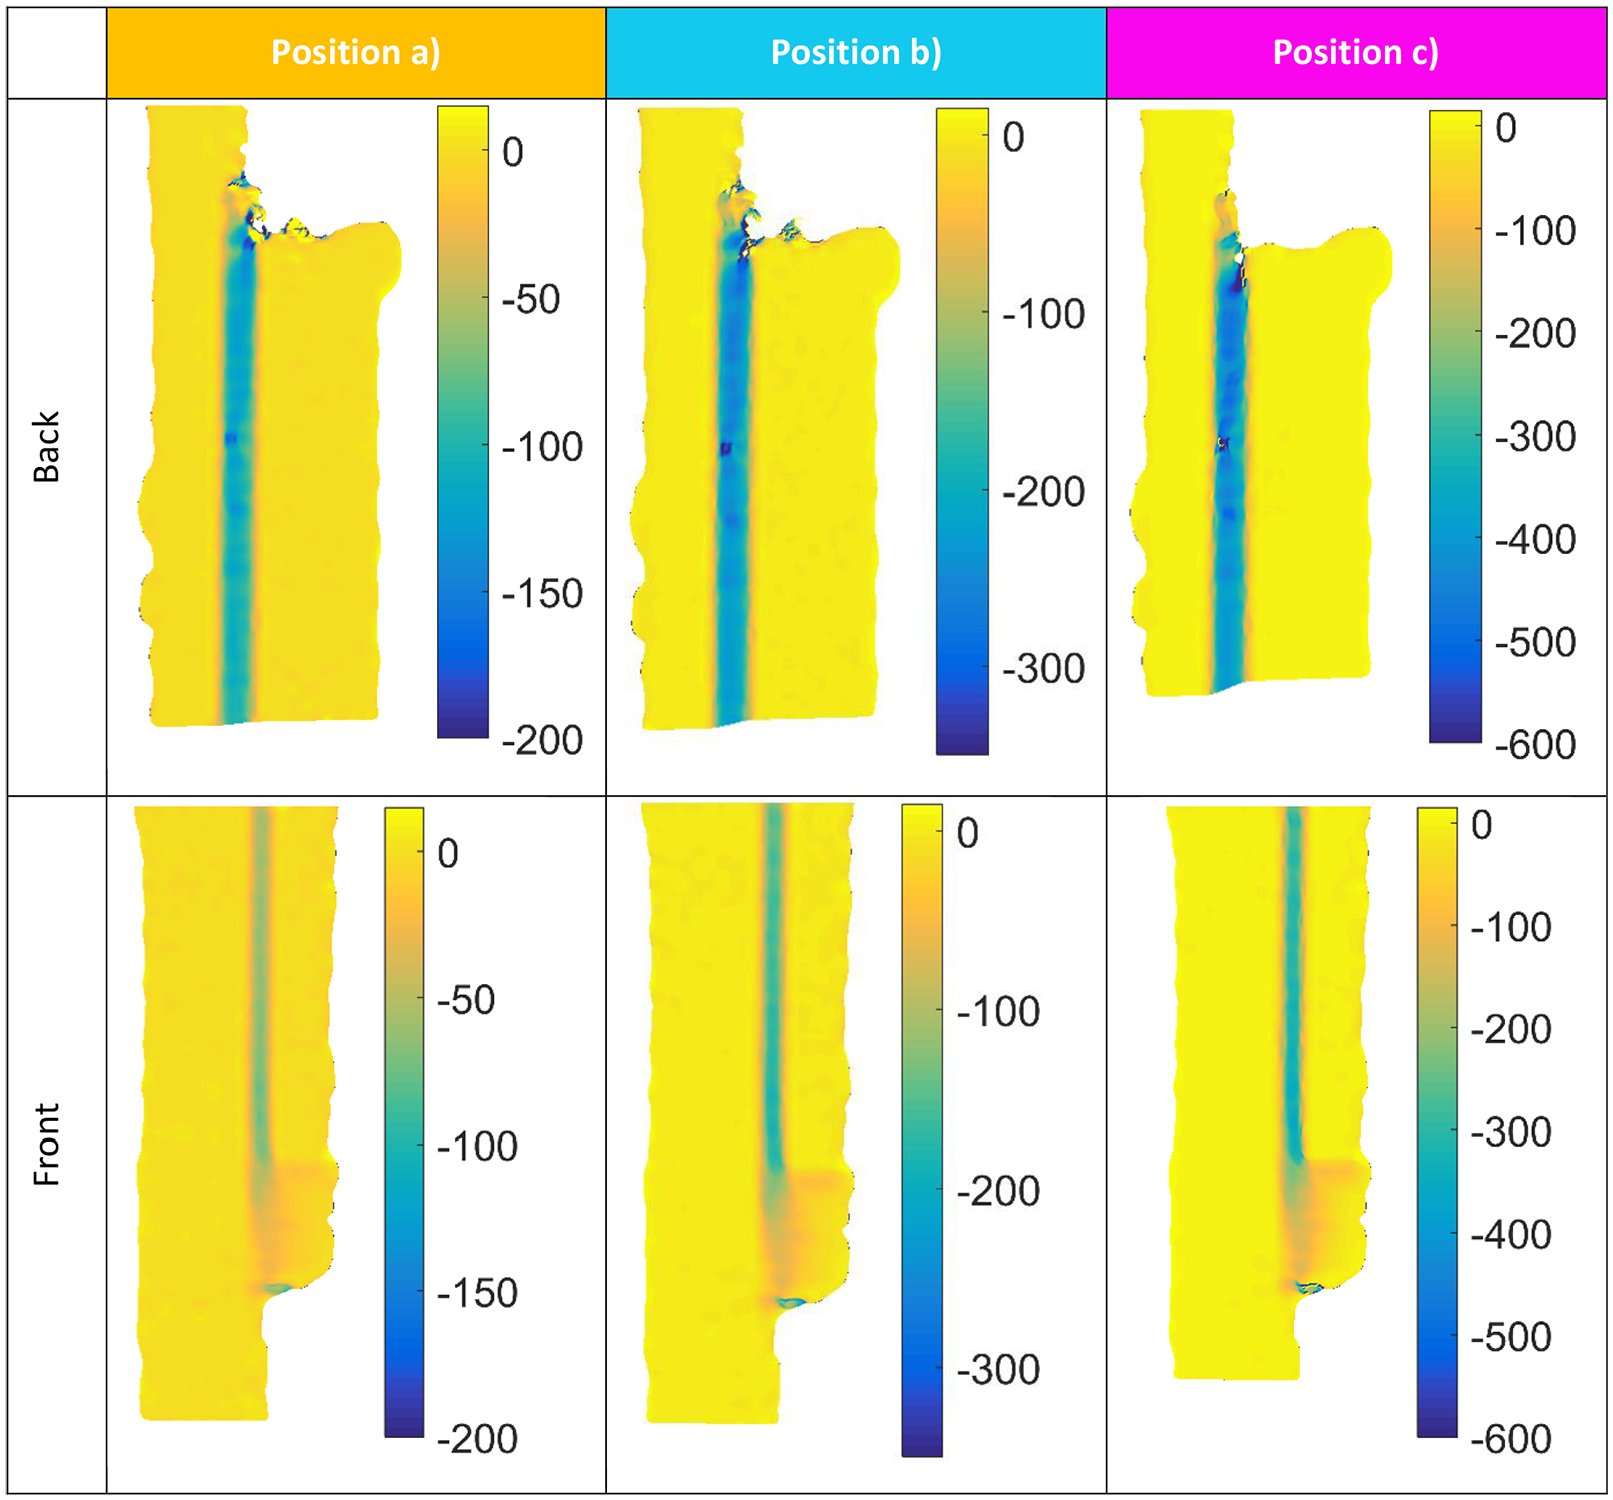
(a) Considering first the variation in responses for the four different sensors, it is useful to consider the effect of the spew fillet on the transverse normal strain (εxx) as shown in Figure 12. Specimens 1 and 2 show sharp corners, where the spew fillet has been largely eliminated during manufacturing. Strain concentrations are apparent at the apex of the spew fillet radius as it transitions from the overlap end onto the adherends. This concentration is caused by both the sharp concave geometry, and the rotation of the adherends caused by the inherent load path eccentricity of SLJs. The back view of Specimen 3 (upper region of overlap) shows a similar geometry has been implemented. In contrast, the lower region of the overlap a large convex spew fillet has been implemented (front view). Here, while strain concentrations are apparent due to both the change in geometry at the adhesive, and due to adherend rotation, they are no longer co-localised. The strains are less concentrated, with lower peak strains which are acting over a larger area. Specimen 4 shows a large convex spew fillet at both ends of the overlap region. The specimens manufactured with such spew fillets showed a smoother progression of damage and hence electrical response in Figure 11.
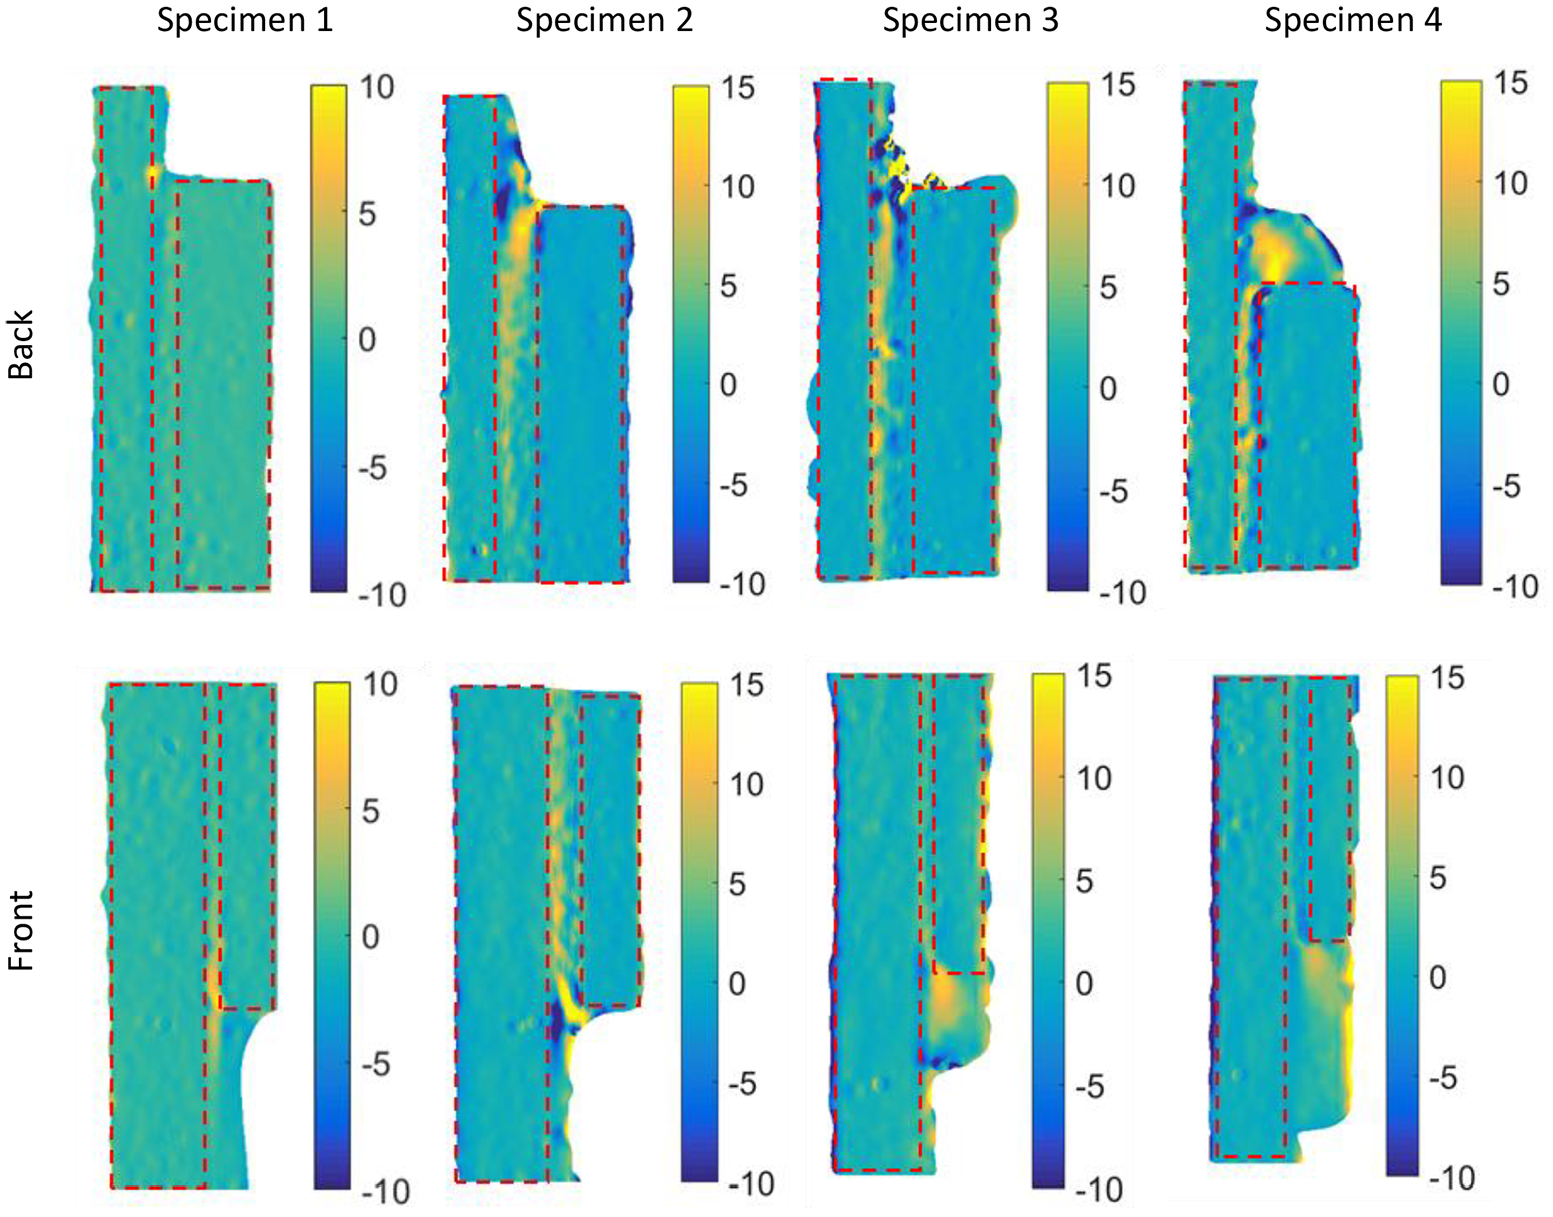
Transverse normal strain εxx (mS) at position (a) in Figure 11 showing variations in strain concentrations due to spew fillet geometry.
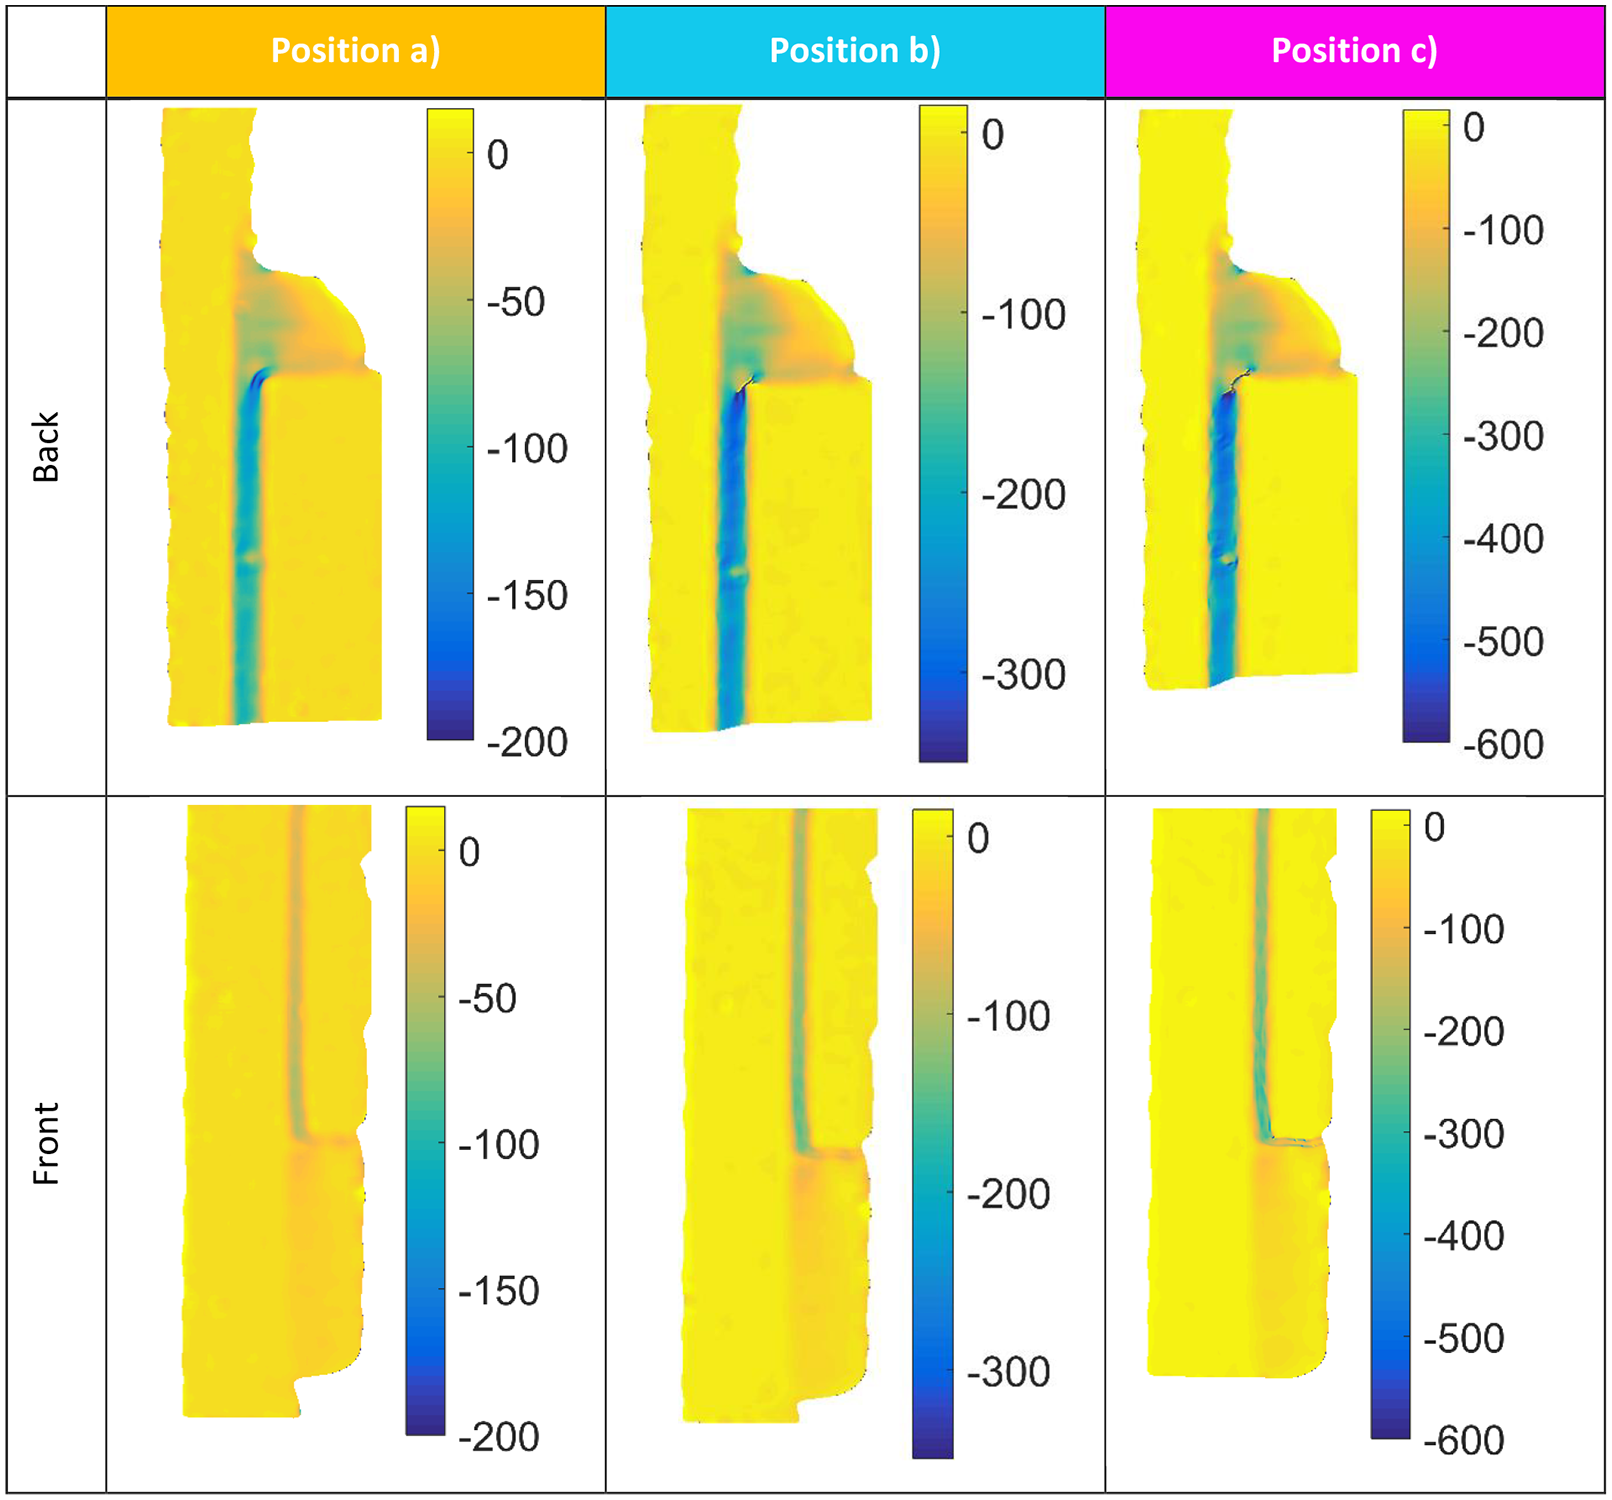
Considering the three phases apparent in the data in Figure 11, the follow data present the engineering shear strains obtained from each specimen at the three identified locations (a), (b) and (c). The shear strains provide an effective means to examine the state of the joint as strains in both transverse and longitudinal directions have an influence and cracks are easily identified. Figures 13 and 14 present similar shear strain γxy data for specimens 1 and 2, where the adherends can be clearly identified, showing shear strains close to zero as is to be expected. At position (a) the shear strains are relatively homogeneous, with concentrations appearing at the adherend ends, and then reducing to zero at the free surfaces. Although Figure 11 shows some increase in electrical response at position (a), there is no indication in the strain data that damage has initiated. While it is noted that two other possible locations of damage onset were not monitored, due to the limited space available, none of the data presented show any cracks at position (a).
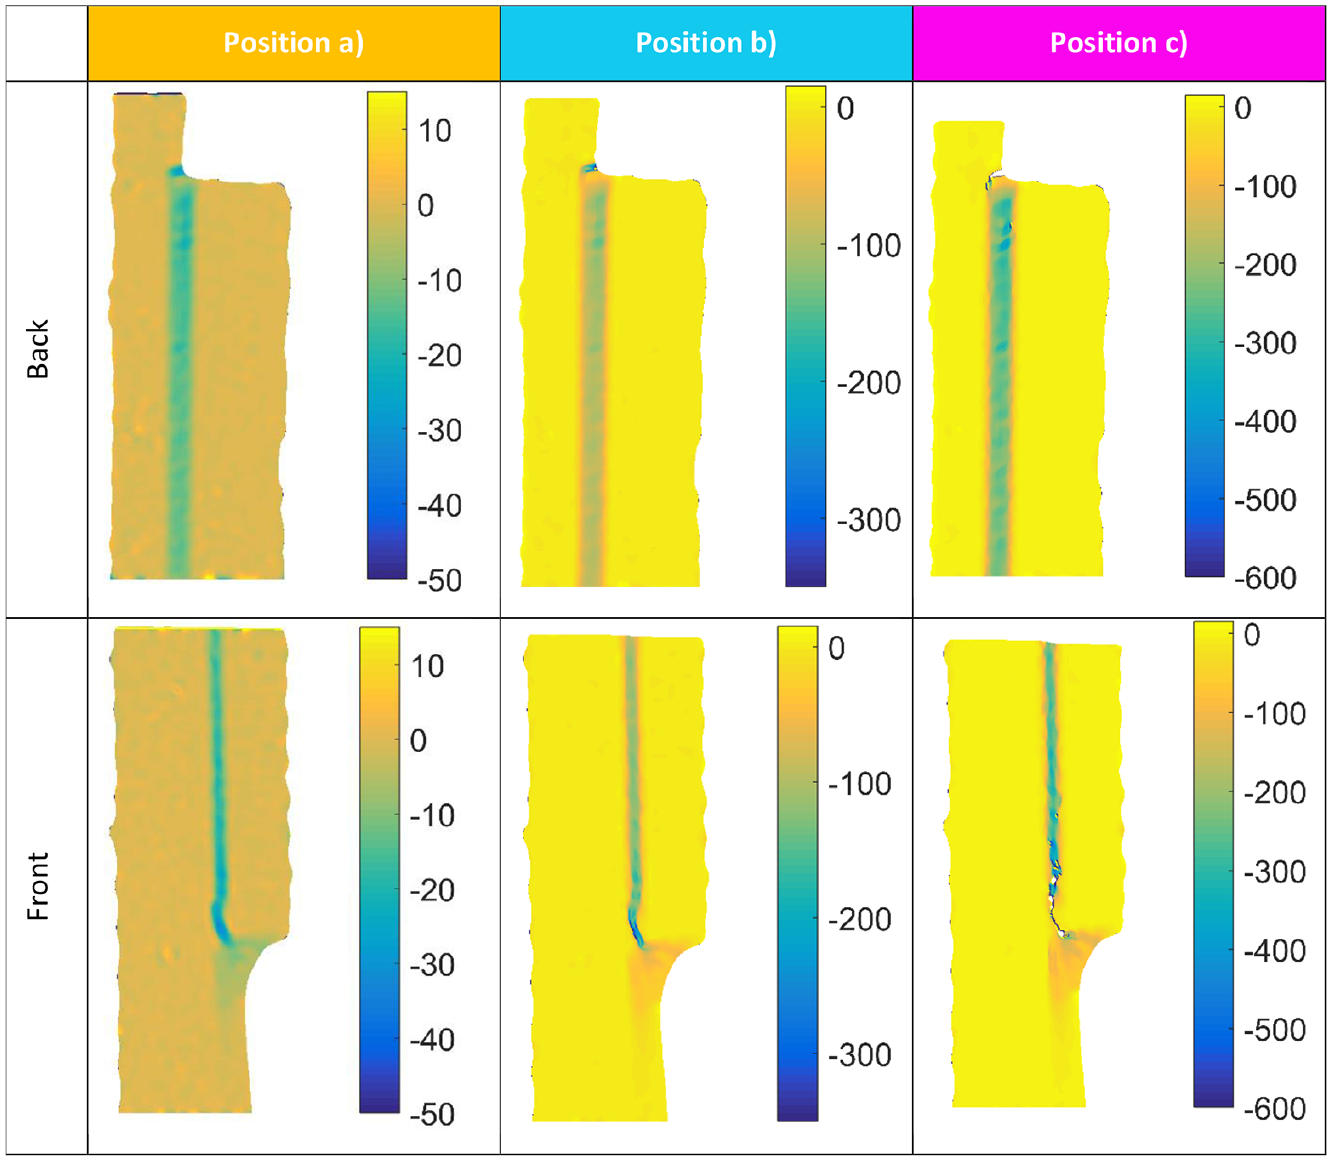
Engineering shear strains γxy (mS) specimen 1.
Engineering shear strains γxy (mS) specimen 2.
At position (b), both the mean and peak strains have increased due to the increased applied load. However, in the data from the front of the SLJ, a compressive strain concentration has developed emanating from the corner of the thinner adherend indicating a crack may have initiated. Position (c) shows that damage has clearly initiated and propagated, with discontinuities visible at both ends of the overlap region.
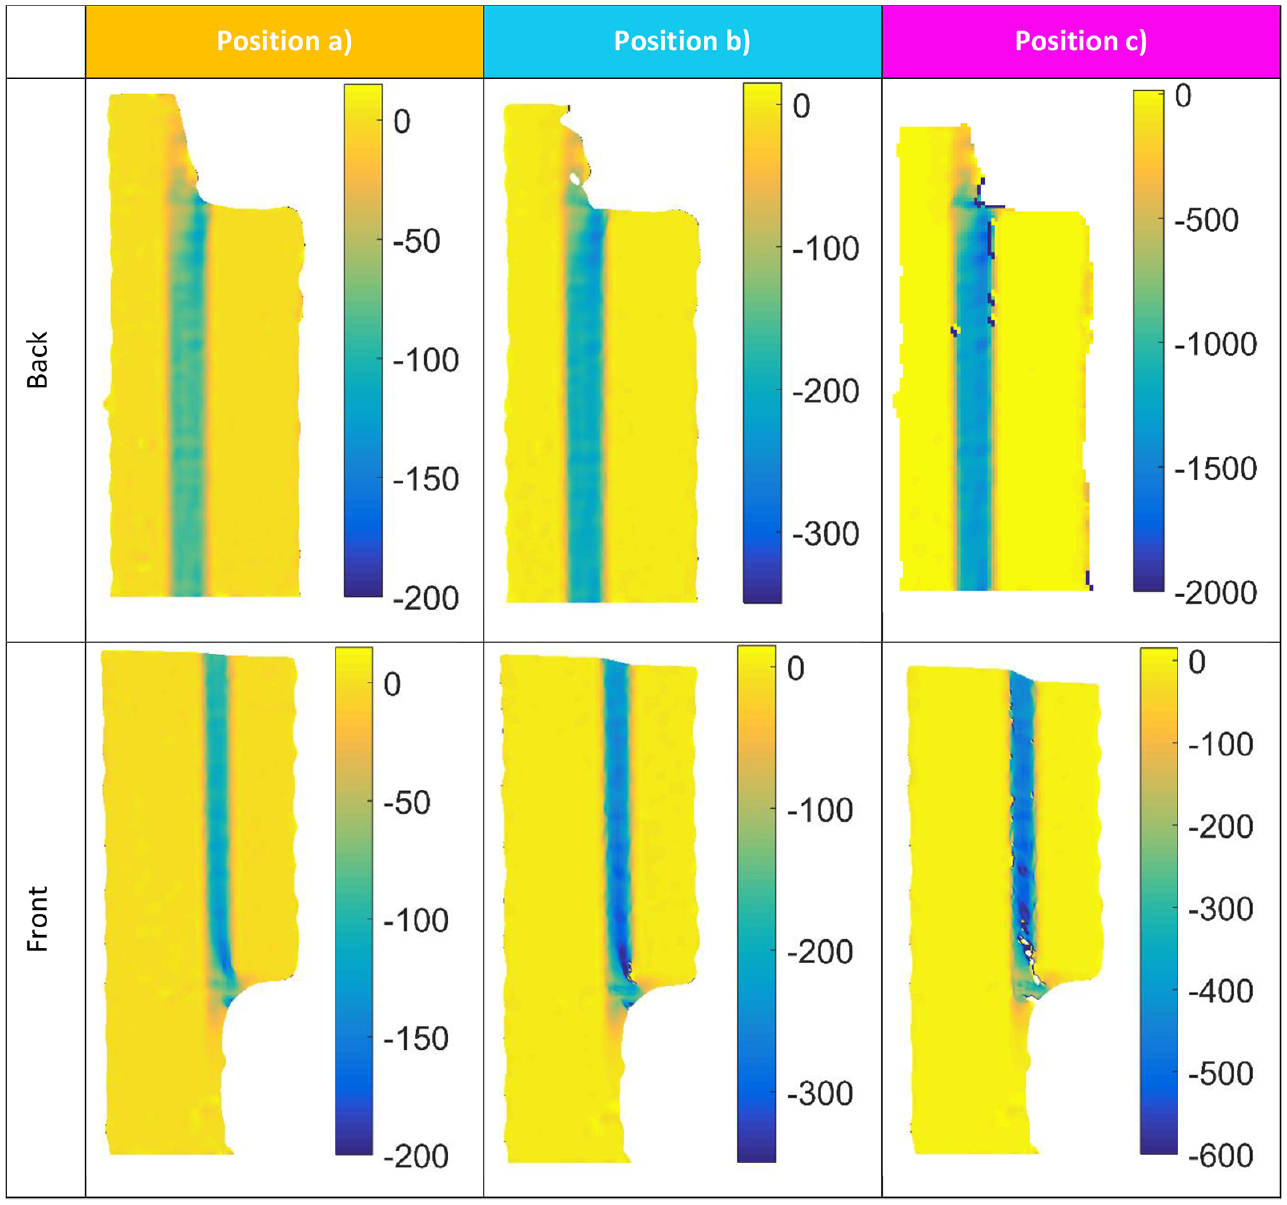
Similar general observations are made in Figure 15, where adherend shear strains are uniformly zero, and the adhesive shows relatively uniform shear strain. The effect of the spew fillets is apparent, with peak strains isolated to the concave spew fillet at the top of the overlap region. The geometric and rotational strain concentrations are also clearly seen to be separated in the case of the convex spew fillets shown at the lower end of the overlap (front view). At position (b), the mean and peak strains have increased, and as in Figure 14, a compressive strain concentration has developed, in this case at the upper region of the overlap. This leads to further crack propagation which is apparent in position (c). Crack initiation at this location is however not solely due to spew fillet configuration, since there is a mismatch in adherend bending rigidity, with both affecting strain concentration and crack initiation.
Engineering shear strains γxy (mS) specimen 3.
In the joints shown in Figure 16, convex spew fillets are implemented at both ends of the overlap. Again, damage is initiated at the upper end of the overlap; however, at position (c) less damage is apparent compared with the other specimens presented. Lower peak strains are also apparent at both ends of the overlap. In the back view showing the upper end of the overlap, two distinct strain concentrations are again apparent, corroborating the findings from the other data presented.
Engineering shear strains γxy (mS) specimen 4.
From the analysis of these four specimens, it is clear that although a voltage response is detected as soon as load is applied, damage initiation does not occur until approximately 40% of failure load. This suggests the sensor may have some load sensing capability, analogous to a strain gauge. In addition, large changes in the electrical response occur in the sensor data at position (b), while only modest damage is initiated in the joint. Cracks shown in the shear strain data are not visible to the naked eye and were only detected after DIC processing of high magnification images. Thus, the sensor appears to be highly sensitive to damage onset, in addition to damage propagation.
A further important consideration beyond the laboratory-based proof-of-concept described in the article is the effect of temperature and humidity changes. As with any measurement based on electrical resistance, it is likely that changes in temperature will affect the measurement, and this will require compensation in a similar way to electrical resistance strain gauges. There are numerous compensation strategies available, which could be implemented in conjunction with the sensor in the real-world environment. It is well known that bonded joints and composite structures lose performance when exposed to moisture, which means they are usually protected from moisture ingress by painting or coating. Hence, changes in humidity are not a great cause for concern. In addition, both temperature and humidity occur slowly over time, whereas changes in electrical response due to damage initiation occur rapidly. Therefore, rate of change of resistance could be considered alongside the temporal data presented here to distinguish between damage onset and environmental changes.
Sensor damage and failure
To further investigate how the embedded sensor fails, images were recorded during failure and micrographs taken post failure. In the DIC images immediately preceding final joint failure, separation of the joint substrates can be clearly seen as shown in Figure 17. In addition, there are clearly remnants of the fibres from the sensor attached to both substrates, which confirms that the sensor fails progressively as intended, explaining the electrical response results from the previous section. For further corroboration, micrographs were taken of the fracture plane at 5 times magnification, with selected images shown in Figure 18.
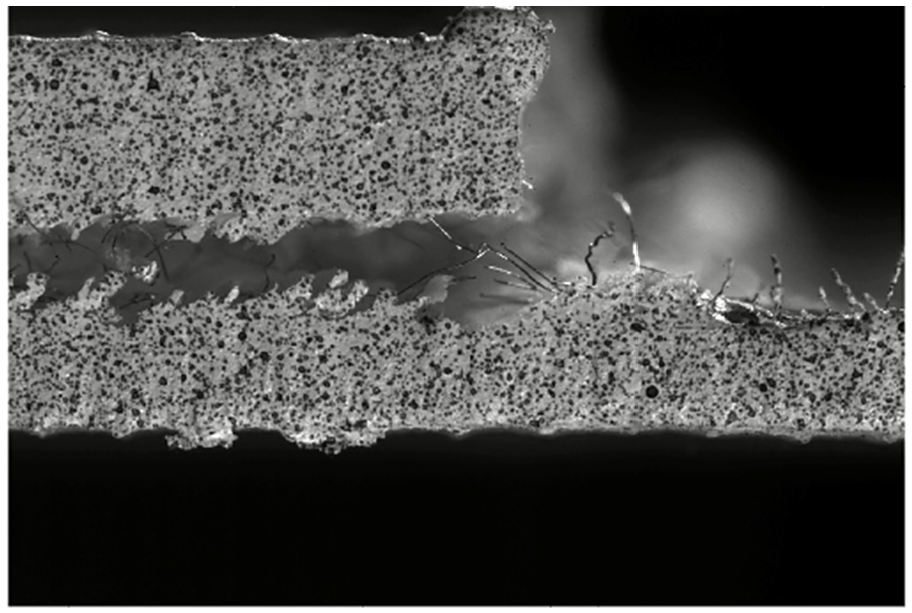
Enlarged image of failed specimen showing sensor material on both substrates.
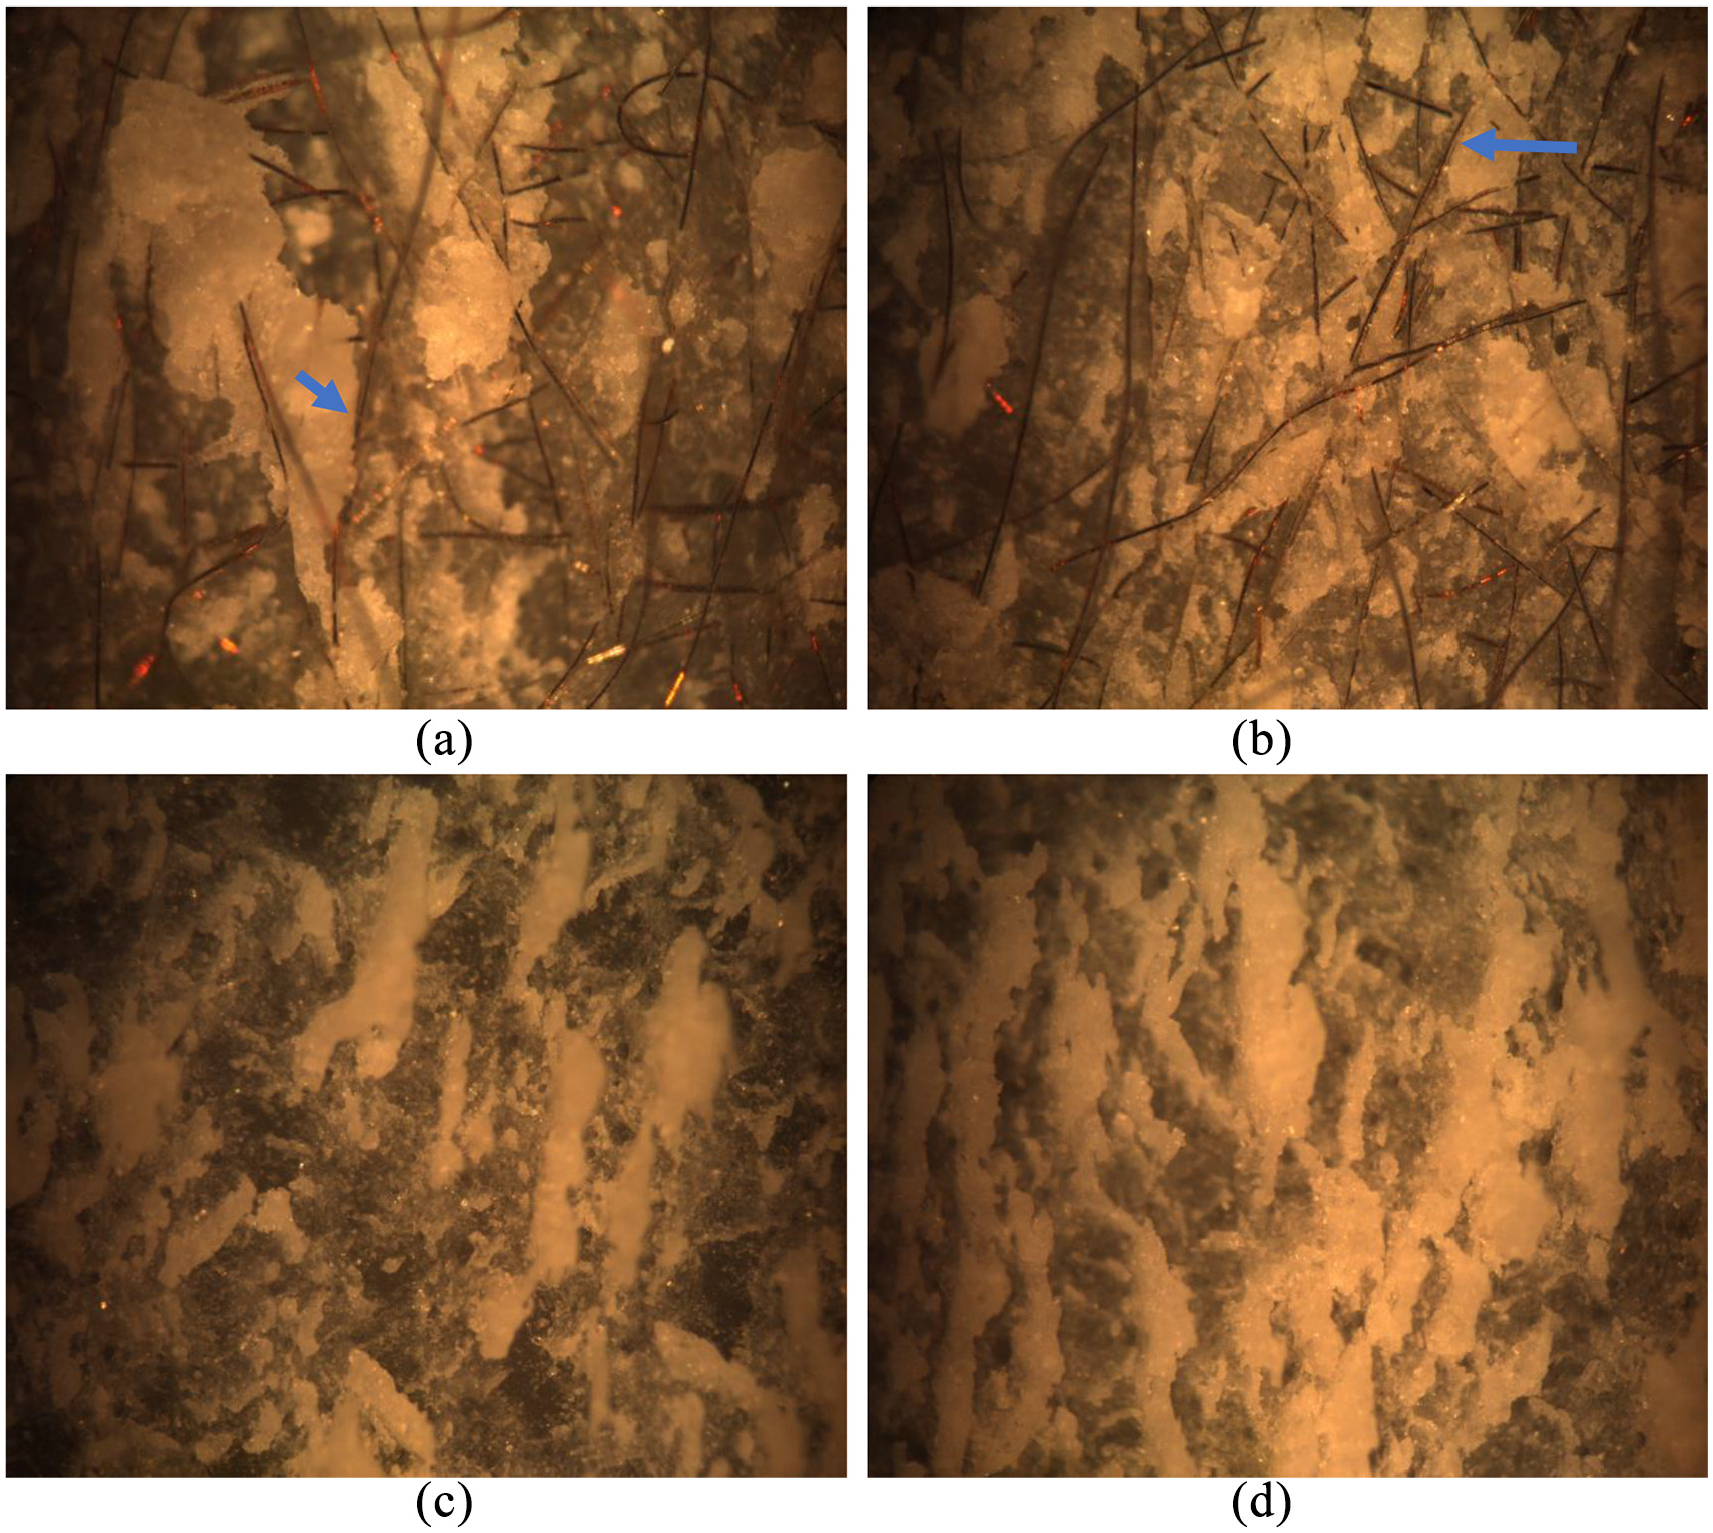
Micrographs of fracture plane: (a) 1.4 mm substrate; (b) 0.9 mm substrate; (c) 1.4 mm substrate; (d) 0.9 mm substrate.
Figure 18(a) and (b) shows the fracture plane close to the crack initiation site of the thick (1.4 mm) and thin (0.9 mm) substrates, respectively, for a specimen containing the sensor, with (c) and (d) showing similar images for a control specimen. Fibres from the sensor are clearly apparent in (a) and (b) with the material appearing to be approximately evenly distributed between the two substrates. The mixed mode failure is also clear in the images of both specimens, with areas of white adhesive remaining where cohesion failure has occurred alongside darker areas indicating adhesion failure which has exposed the laminate. Compared to the images in Figure 18(c) and (d), the shape of the remaining adhesive appears more angular in (a) and (b). Moreover, in many cases the boundary of the remaining adhesive follows the fibres of the sensor (see example highlighted by blue arrows in Figure 18(a) and (b)). This suggests that the sensor fibres may deflect cracks during failure, potentially having a beneficial effect on strength.
Effect of sensor embedment on joint strength
The absolute failure load of each specimen is shown in Table 4 which is taken simply as the maximum measured load. The data show a degree of scatter, and particularly in the sensor data, in part due to the different spew fillet geometries implemented. In addition, the specimens were cut from two separate panels, each providing three specimens. Therefore, variations in bond thickness, laminate thickness, and quality between each panel are to be expected, all contributing to differences in strength between specimens cut from each panel. The manufacturing methodology, where each panel provides both control specimens and specimens with embedded sensors, does ensure that fair comparisons can be made between the two groups as there are equal numbers of control and sensor specimens cut from each panel. Regardless, the mean failure loads are similar, and a one-way analysis of variance showed that statistically there is no difference between the failure loads of specimens with embedded sensors and those without.
Failure loads and statistics for SLJs.
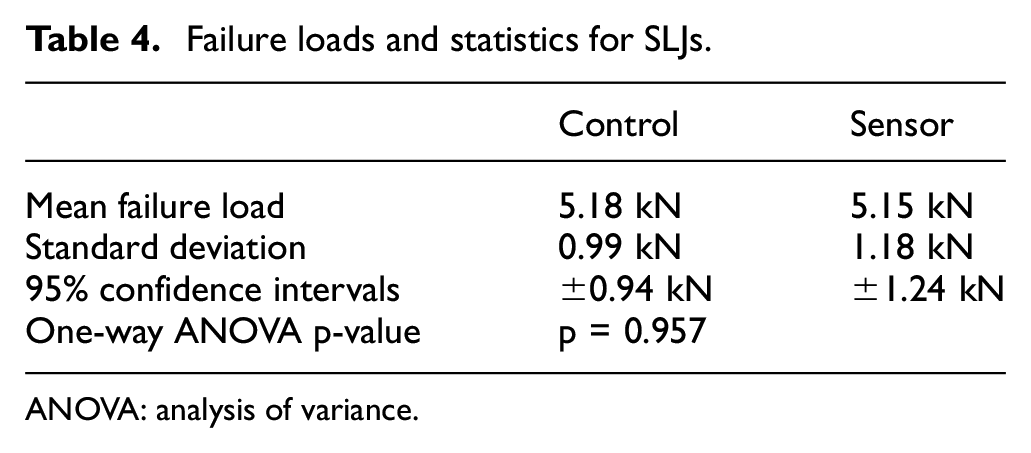
ANOVA: analysis of variance.
Conclusions
The three key objectives given in the introduction to the article have been met, which together demonstrate a proof of concept of a promising and novel sensor technology. Results showed changes in the electrical response of the sensors for varying sizes of simulated damage, and that the response was proportional to the extent of damage. It was found that in its current configuration, the sensor studied in the article is not suitable for use with adherends which are themselves conductive. One simple modification could be to move to a secondary bonding process rather than a co-curing bonding regime. In such a case, the sensor could be infused with resin prior to being embedded, thus insulated in the sensor and enabling its application in metallic bonded joints or carbon fibre composite laminates.
The operation of the sensor was confirmed using thermographic techniques which exploited resistive heating to analyse the current flow through the sensor system. Most importantly, it was shown that temperature increases caused by resistive heating of both undamaged and damaged sensor were modest relative to the resin glass transition temperature. Hence, any heating of the sensor would not negatively impact the structural performance of either a composite laminate or an adhesively bonded joint. Short beam shear test also established that inclusion of the sensor did not affect the ILSS.
Using SLJs loaded in quasi-static tension to failure, the electrical response of the sensor showed a small response as load was applied and before damage onset, potentially of use as a load sensing or load counting device in addition to damage detection. As damage to the joints occurred, there was a clear voltage response measured from the sensor indicating that its resistance had changed. The response continued until failure, where it was confirmed that the sensor had been progressively damaged during failure, leaving remnants of the sensor attached to both substrates. Like the short beam shear tests, the failure loads recorded from the SLJ tension tests showed no significant difference in performance between specimens with and without embedded sensors. In fact, post-mortem micrographical analysis indicated that the sensors actually arrested crack growth similar to the effect of inserting chopped strand mat materials at an interface creating a cohesive zone.
Thus, a simple, robust and novel technique is demonstrated with the potential to encode multiple health monitoring metrics into a single signal, providing valuable information for residual service life assessments and maintenance scheduling teams. In addition, the material is lightweight and easily incorporated into a laminate or joint. With the caveat of identifying an efficient and non-invasive means of making electrical connection directly to the sensor, minimal wiring is required. No additional mechanical or chemical processing is required, representing a cost saving relative to other techniques such as thin film sensors. Indeed, the simplicity of the technique may prove a significant advantage for gaining industrial acceptance. Such acceptance could lead to further cost savings since less reliance placed on periodic NDE inspections will reduce asset downtime. Clearly for very thick composite laminates where current NDE approaches have significant limitations in terms of probing depth the new sensor technology proposed in the article offers a means of hitherto unavailable inspection. A clear avenue for further development is the effect of temperature on the sensor response and the identification of an appropriate means of compensating for any temperature effects.
Footnotes
Acknowledgements
The authors thank the Engineering and Physical Sciences Research Council (EPSRC) and BAE Systems Naval Ships for funding the work under an industrial CASE studentship. The work described in the article was conducted in the Testing and Structures Research Laboratory (TSRL) at the University of Southampton, and the authors are grateful for the support received from Dr Andy Robinson, the TSRL Experimental Officer. For the material used for the embedded sensor, the authors thank Mr Michael Caton of TFP.
Declaration of conflicting interests
The author(s) declared no potential conflicts of interest with respect to the research, authorship, and/or publication of this article.
Funding
The author(s) received no financial support for the research, authorship, and/or publication of this article.