
Abstract
In this article, we introduce a new current injection pattern for electrical impedance tomography. The pattern improves the quality of hole detection in carbon fiber reinforced polymer plates and allows the detection of delaminations. The new pattern is described in detail and compared to three widely used, classical injection patterns. The advantages of the new pattern are demonstrated by numerical finite element analyses for three test cases: a hole of 10-mm diameter, two simultaneous holes, and an ideal delamination in a circular region with a 50-mm diameter. The results are validated experimentally by comparing electrical impedance tomography measurements of a carbon fiber reinforced polymer plate with at first one, then two holes with a 10-mm diameter using classical patterns and the new pattern.
Keywords
Introduction
Carbon fiber reinforced polymers (CFRPs) are widely used in weight-sensitive structures and are often found in aerospace or automotive industry. Besides their obvious advantage of high-strength and stiffness-to-weight ratios, using CFRPs also has its drawbacks. CFRP structures often fail due to internal damages that are undetectable through visual inspection. One internal damage mechanism is delamination. Delamination not only affects through thickness strength of a laminate, it also highly influences the in-plane strength making it a critical failure mechanism. 1 To detect delaminations, cost and time-intensive, nondestructive testing (NDT) methods, for example, X-ray computed tomography (CT), ultrasonic, 2 or eddy current techniques 3 and thermography,2,4 are frequently used. 5 This increases costs and complexity of a traditional schedule-based maintenance system and, thus, yields potential to switch to a condition-based maintenance system, making use of structural health monitoring (SHM) systems. For instance, Yelve et al. 6 describe the use of a nonlinear Lamb-wave-based method to detect delaminations in composites. The results of other research teams, also working on the detection of delaminations using guided-wave-based SHM methods, can be found in the review by Mitra and Gopalakrishnan. 7 From a lightweight design point of view, it makes sense to use the inherent properties of the material under investigation for SHM. For CFRPs, conductivity distribution changes in the material can be observed when damages occur. This is self-evident for fiber breakage, where direct current paths break, 8 but it is also true for delaminations.9,10 Therefore, it is possible to use the specimen itself as a sensor, eliminating the necessity of potentially heavy or expensive sensing equipment, such as piezo elements in the case of guided-wave-based methods. Todoroki et al. 9 presented successful detection of delaminations in CFRP beams using an electrical resistance change method. Swait et al. 10 report the successful detection of barely visible impact damages, embedding flexible printed circuit boards (FPCBs) in CFRP panels to measure electrical resistance. To not only detect but also localize delaminations, the authors propose the use of electrical impedance tomography (EIT). In recent work, Cagáň et al. 11 statistically assess the detection capability of EIT for CFRPs damaged by barely visible impact damages. In this article, a new current injection pattern for the resistivity change-based EIT method is presented to allow detection and localization of delaminations in CFRPs.
EIT
Theory
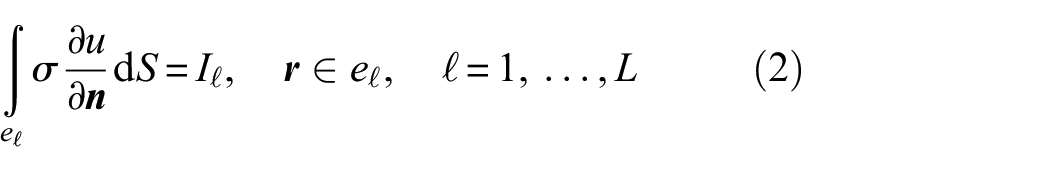
The goal of EIT is the reconstruction of the conductivity distribution of a domain through measurements on the boundary. Changes therein caused by damages can be visualized in this way. The voltage between two electrodes on a plate with

with the boundary conditions
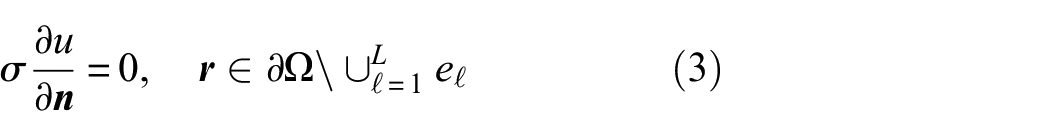
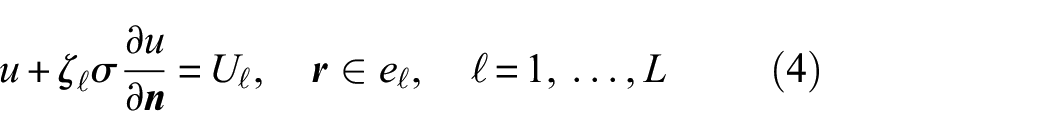
The formulation above is known as the complete electrode model,12,13 where
Every change in the conductivity distribution yields changes in the potential distribution and, therefore, changes in voltages between electrodes. The reconstruction of the conductivity distribution by boundary voltage measurements at given current injection is the inverse problem of EIT. The inverse EIT problem is an ill-posed, not well-defined, nonlinear problem. 14
Adler and Guardo 15 developed a linearized reconstruction method to solve the inverse problem with a one-step inverse operation. It can be formulated as
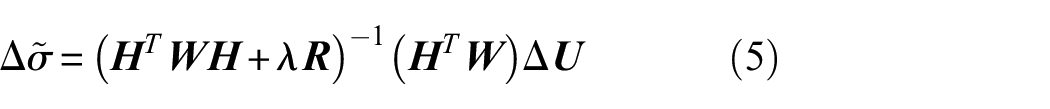
where
For the regularization matrix
Classical injection patterns for EIT
Crucial for the quality of EIT results is, among other subjects (e.g. measurement accuracy, selection of reconstruction solver), the measurement pattern implemented. Different patterns are in use by various research groups for different applications. The choice of the pattern influences the resolution and quality of EIT reconstructions. Several authors worked on the optimization of electrode positioning and measurement patterns.18–24 For this work, three different classical patterns were used and compared to an improved, newly developed current pattern.
Adjacent Pattern
The most commonly used measurement pattern so far is the classical Adjacent Pattern, as described by Barber
25
in 1984 and illustrated in Figure 1. For a plate with
Adjacent Pattern: In the first step, current flows from electrode 1 to 2 (full line), then from 2 to 3, and so on (dashed lines), until the last step, where current flows from electrodes 16 to 1. In each step, voltages are measured between all adjacent electrodes (dotted lines).
Independent of the used injection pattern, there would be negative effects on the EIT reconstruction if voltages are recorded at the same electrodes where current flows. Such measurement points are therefore rejected.26–28 Figure 2 shows how the use of such measurement points can prevent the successful detection of damages in EIT calculations. In Figure 2(a), a hole in a CFRP plate could not be successfully detected. In Figure 2(b), the same damage could be detected using the same measurement set without the poor measurement points. A black circle indicates size and location of the hole.
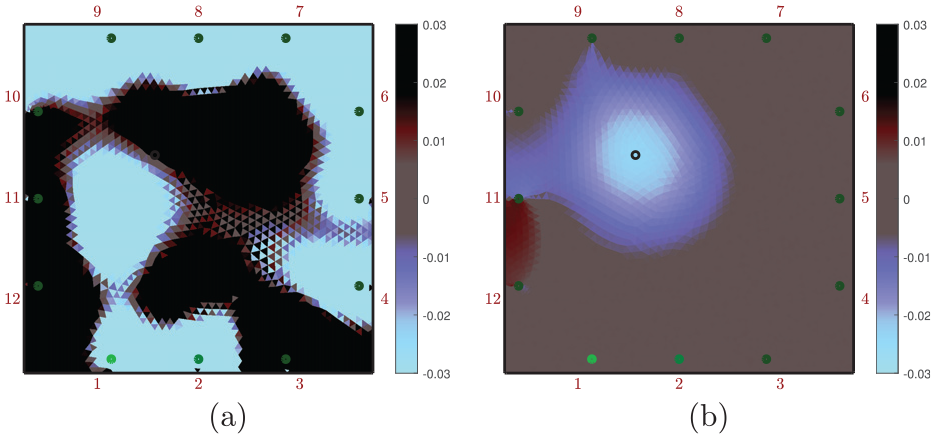
Negative effects on EIT reconstruction and its damage detectability: (a) all measurement points are used for reconstruction, and (b) measurement points at electrodes with current injection are rejected.
Opposite Pattern
Another widely used current pattern is the Opposite Pattern19,26,27,29 (see Figure 3). For this pattern, current always flows between two opposite electrodes. For a square plate with four electrodes on each side, this means that current is first applied between electrodes 1 and 12, then 2 and 11, and so on, until current flows from electrodes 8 to 13. Further steps are redundant and do not yield additional information. Therefore, only
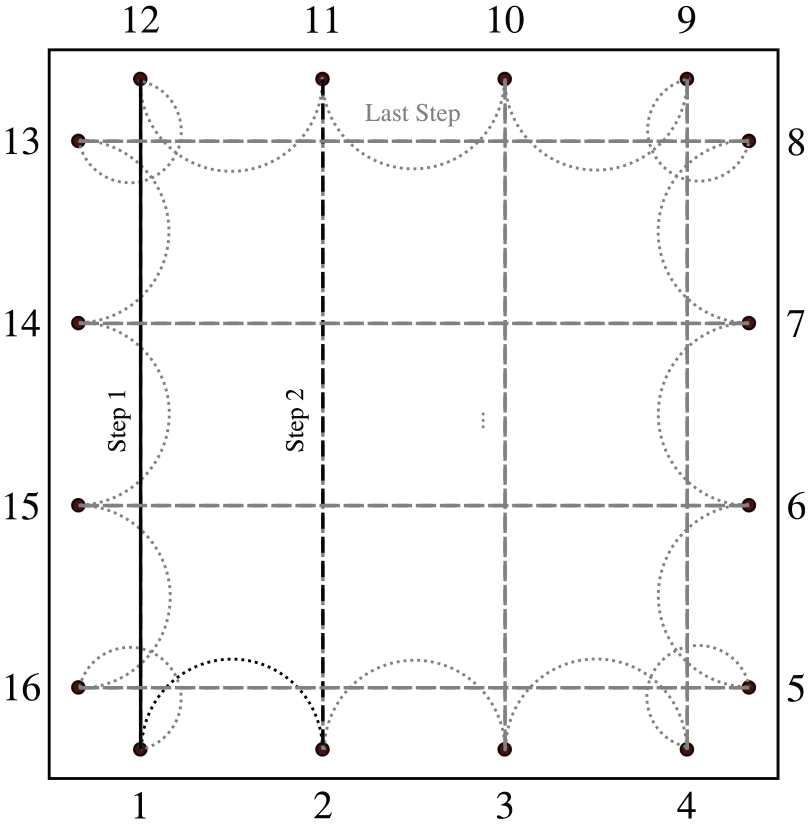
Opposite Pattern: In the first step, current flows from electrodes 1 to 12 (full line), then from 2 to 11, and so on (dashed lines), until the last step, where current flows from electrodes 8 to 13. In each step, voltages are measured between all adjacent electrodes (dotted lines).
Alternative Opposite Pattern through center: In the first step, current flows from electrodes 1 to 9 (full line), then from 2 to 10, and so on (dashed lines), until the last step, where current flows from electrodes 8 to 16. In each step, voltages are measured between all adjacent electrodes (dotted lines).
Diagonal Pattern
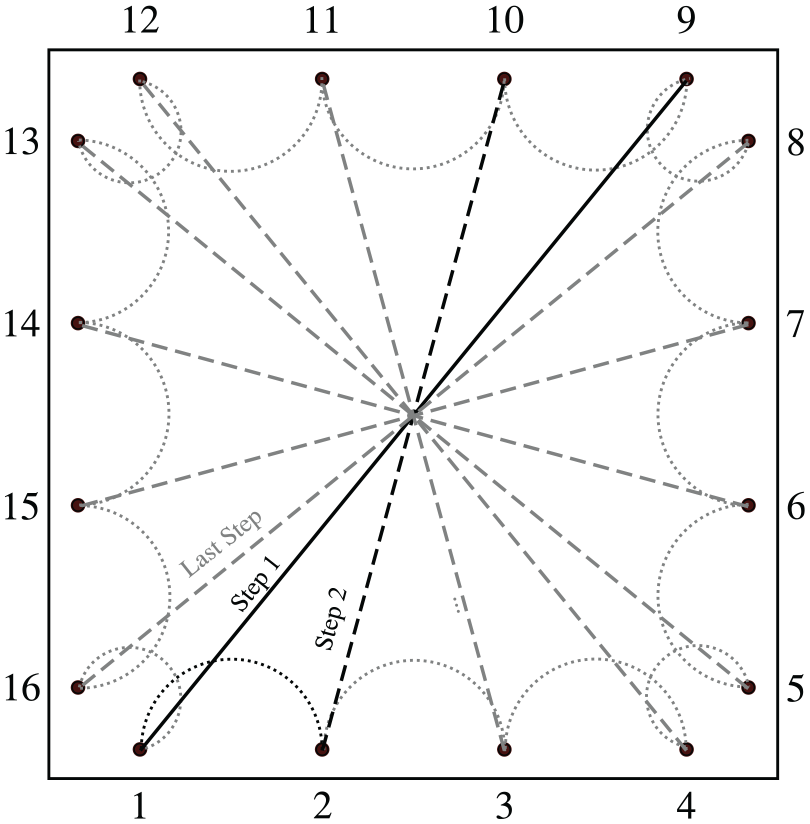
The Diagonal Pattern (see Figure 5) is a special case of the Opposite Pattern for rectangular plates, where the pattern is rotated by 45°. For 16 electrodes, current first flows from 1 to 16, then from 2 to 15, 3 to 14, …, 8 to 9. Afterward, current flows from 4 to 5, 3 to 6, 2 to 7, …, 13 to 12. In total,
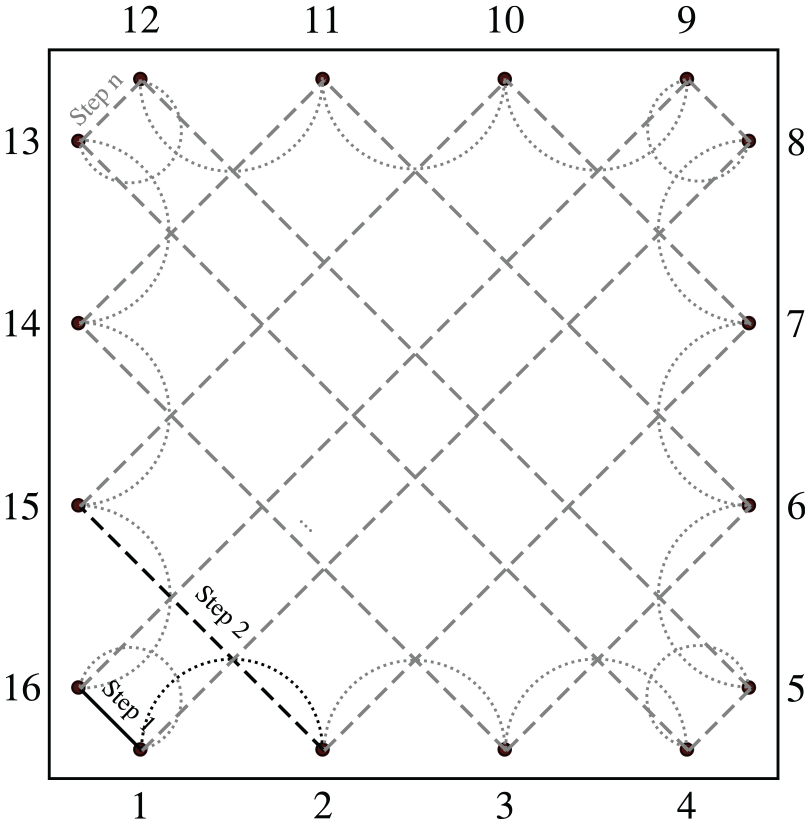
Diagonal Pattern: In the first step, current flows from electrodes 1 to 16 (full line), then from 2 to 15, and so on (dashed lines), until the last step, where current flows from electrodes 13 to 12. In each step, voltages are measured between all adjacent electrodes (dotted lines).
For anisotropic materials such as CFRP, the Diagonal Pattern can be advantageous over the Opposite Pattern, if the direct current paths of the Opposite Pattern were in fiber direction. Measurements that are not in fiber direction have a positive effect on the EIT reconstruction. Loyola et al., 26 who explain this effect with current propagation, propose a combination of Opposite and Diagonal current steps for measurements of anisotropic parts.
Improved current injection pattern
Preliminary investigations using classical EIT current injection patterns failed to provide sufficient contrast to detect delaminations in laminated CFRP plates. Hence, there is a need for an improved pattern for this kind of damage.
Star Pattern
The objective of the new pattern is to gain as much information as possible from a given electrode setup. Therefore, as a starting point, we use every possible combination of electrodes for current injection. For a 16-electrode setup, there are
For a setup with only three electrodes on each side of the plate
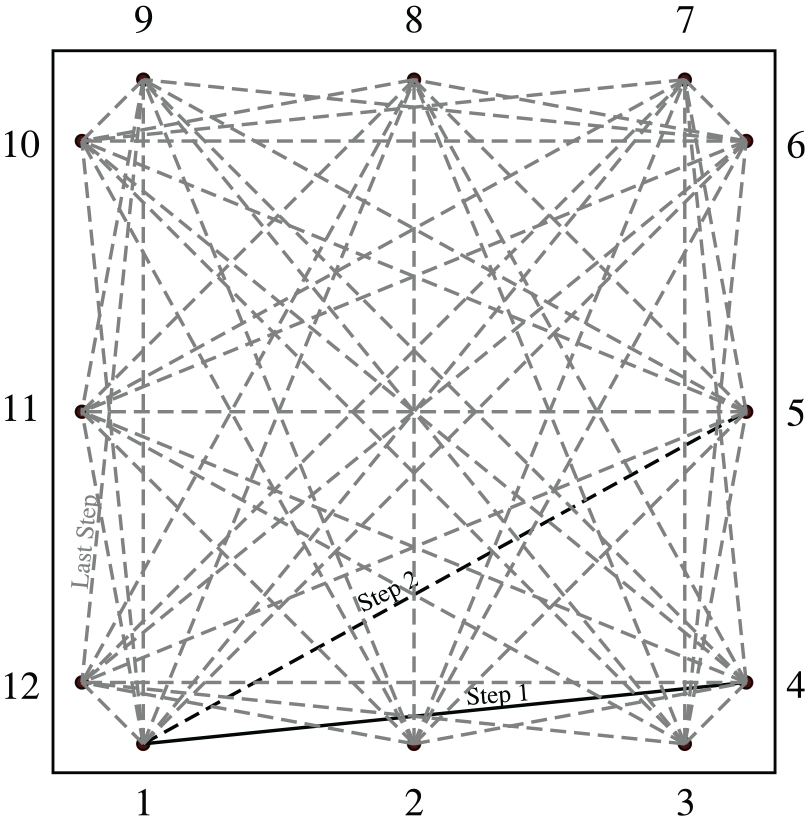
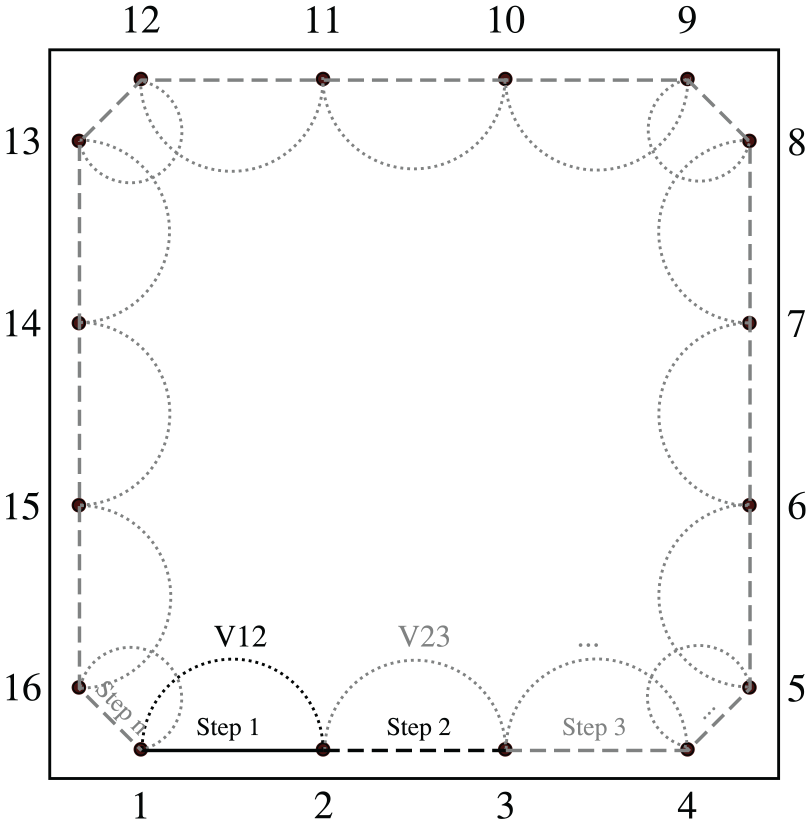
Star Pattern: In the first step, current flows from electrodes 1 to 4 (full line), then from 1 to 5, and so on (dashed lines). In the last step, current runs from electrodes 12 to 9. In each step, voltages are measured between all adjacent electrodes.
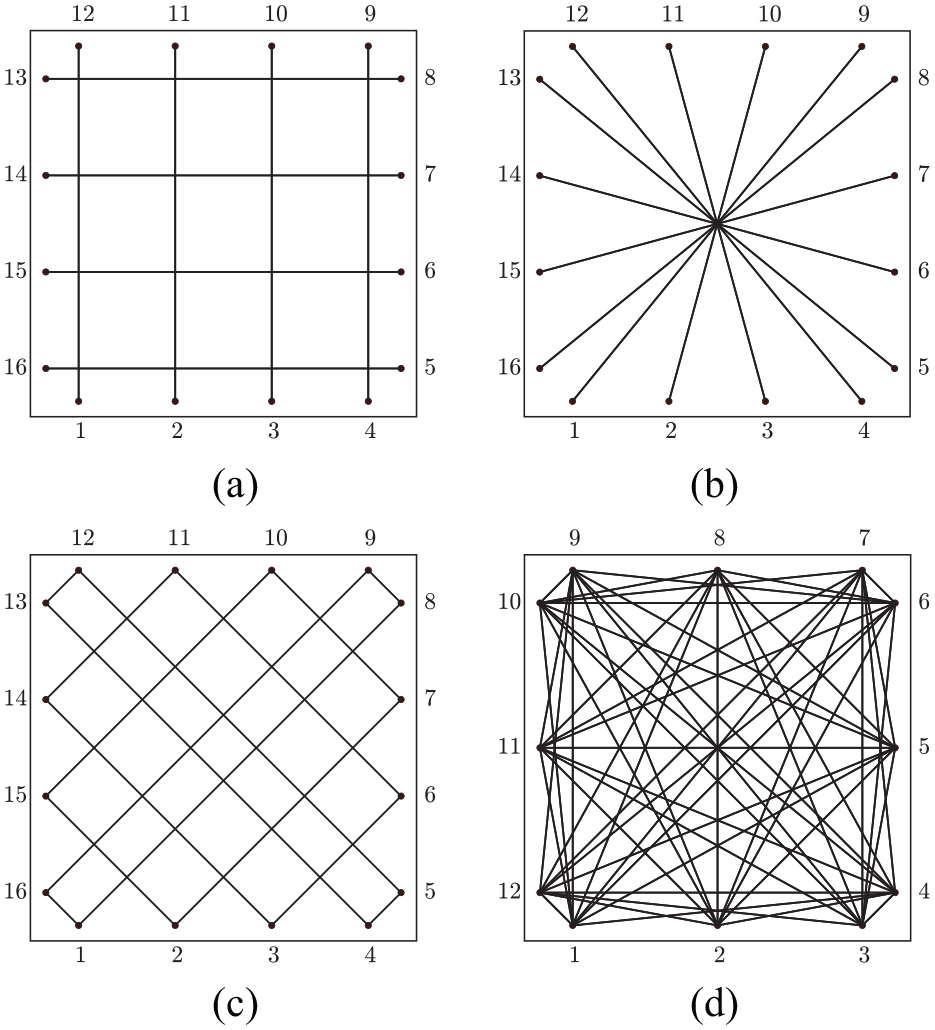
Comparison of resolution of different current injection patterns. The black lines indicate direct current injection paths. Actual current distribution depends on the conductivity distribution of the plate. (a) Opposite Pattern, (b) Opposite Pattern through center, (c) Diagonal Pattern, and (d) Star Pattern.
Experimental methodology
To test the new pattern, three different damage cases were analyzed. First, a hole of 10-mm diameter; second, two holes of 10-mm diameter each; and third, an ideal delamination through all layers in a circular region of 50-mm diameter at three different positions. A numerical analysis was conducted for all three test cases. To validate the results, experiments with holes on a real plate were realized. Experiments with delaminations will be subject to future work.
Numerical analysis
A
The classical Diagonal Pattern, both Opposite Patterns and the newly developed Star Pattern were all simulated as a baseline of the pristine, undamaged plate. In each current step of the pattern, a surface current of 1 A was introduced at the corresponding input electrode and a potential of 0 V was assigned to one node of the corresponding output electrode. The voltage drops between adjacent electrodes were calculated and inserted to the EIT program EIDORS.
17
All voltages were normalized with the injected current. For all damage reconstructions in this work, the Gauss–Newton One-Step algorithm
15
was used with NOSER
16
as prior. The hyperparameter
The position error (PE) was calculated as a figure of merit for all EIDORS reconstructions. The position error is defined as the difference between the nominal damage center and the center of gravity (CoG) of the one-fourth conductivity amplitude set. 30 For calculation of the one-fourth conductivity amplitude set, the images were cropped by 30 mm on all sides. In the case of two holes, separate one-fourth conductivity amplitude sets, CoGs and PEs, were calculated for each half of the plate.
As damages, first one hole of 10-mm diameter, then two holes of 10-mm diameter, and third an ideal delamination in a circular region of 50-mm diameter at three different positions were introduced into the model. The holes were modeled by removing all material in the section. For the delamination, only the matrix material was removed in the area, disconnecting all fiber layers from each other. Figure 8 depicts a model for the delamination. The simulation was repeated for each of the three damage cases and for each pattern. To see how the number of electrodes affects reconstruction results, a total of 28 electrodes were simulated. For most tests, only a subset of 12 electrodes were used for damage reconstruction. Using more electrodes did not lead to better results.
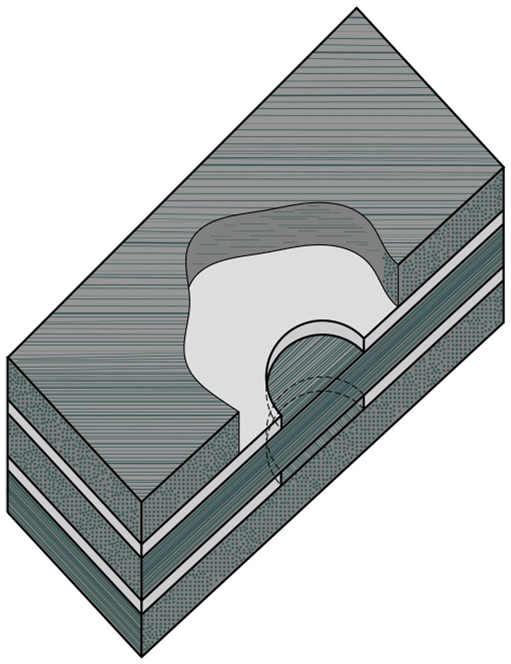
Numerical model of delamination for finite element analysis (not to scale): All matrix material (light gray) was removed within an area of 50-mm diameter to separate fiber layers.
Experimental validation
To validate the numerical analysis, tests on a 500-mm by 500-mm large CFRP plate were conducted. The stacking sequence [+45/–45/0/90]S is the same as used for the numerical analysis; 28 surface electrodes, 7 on each side, were applied by means of electroplating in a method similar to the one described by Todoroki et al. 31 First, carbon fibers were exposed at the positions of electrodes using sandpaper and sulfuric acid. Then, wires were electroplated onto the CFRP plate. For some electrodes, the whole area was not successfully covered with copper after electroplating. This was due to nonconducting glass fiber stitching used for manufacturing of the plate and imperfect process parameters. These flaws were fixed with conductive silver epoxy. To increase the mechanical robustness, the electrodes were covered in clear varnish. The thus prepared plate can be seen in Figure 9: Electrode 27 is shown in detail.
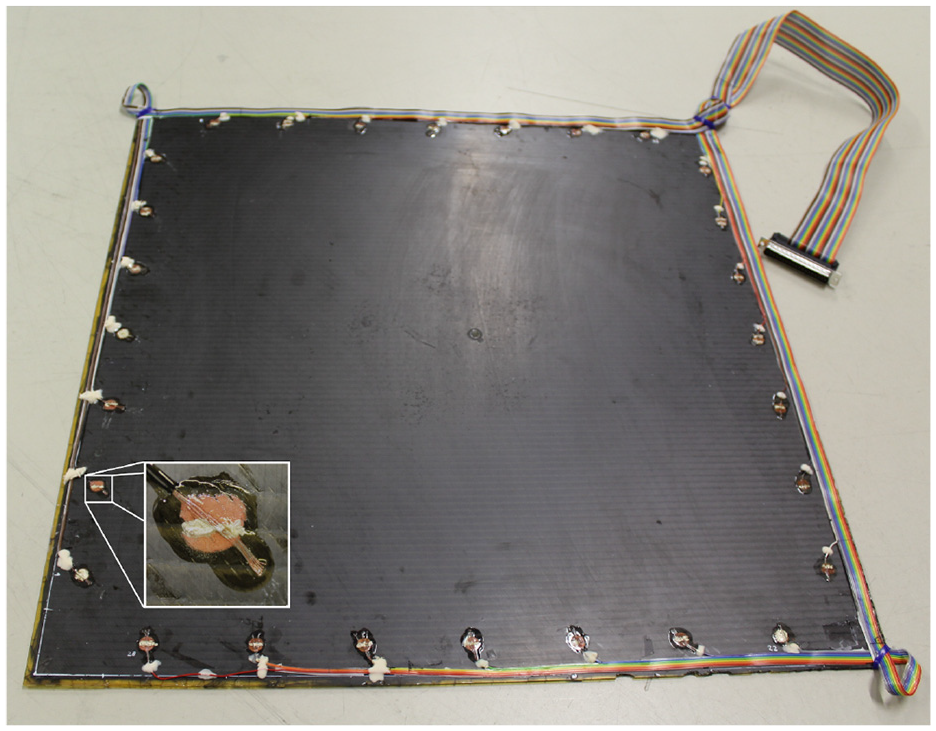
CFRP plate after electroplating 28 surface electrodes before introducing any damage. The detail image shows Electrode 27. The wire was connected by electroplating copper. Flaws were fixed with conductive silver epoxy. All electrodes were then covered in clear varnish.
Baseline measurements were taken using the Diagonal Pattern, both Opposite Patterns and the new Star Pattern, with 12 electrodes. For that, out of the 28 electrodes prepared, electrodes 2, 4, 6, 9, 11, 13, 16, 18, 20, 23, 25, and 27 were used. The measurement chain can be seen in Figure 10. Current was injected with a Keithley 6220 precision current source; 10 mA was used for all measurements. Voltages were measured with a Keithley 2182A nanovoltmeter. The injection pattern was realized with an upgraded version of the Data Acquisition Device developed by Gschoßmann et al. 32 All baseline and damage measurements were repeated at least three times to take environmental influences and statistical variations into account. All combinations of baseline and damage measurements were later evaluated.
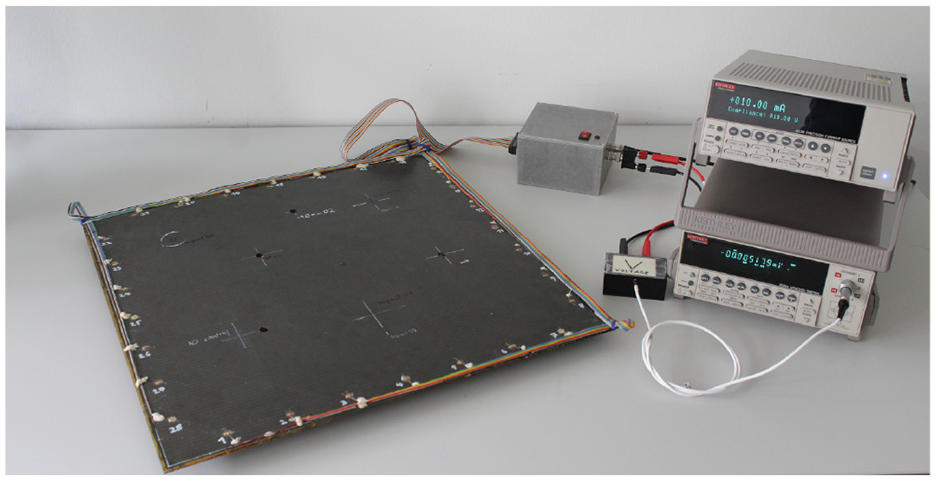
Measurement setup: The specimen is connected to a Keithley 6220 precision current source and a Keithley 2182A nanovoltmeter through the Data Acquisition Device.
The measured boundary voltages were compared with the ones obtained by the simulation of the pristine plate. As seen in Figure 11, the distribution of the boundary voltage signals—for example, the Star Pattern—is almost the same. This proves that the numerical analysis, with the given design and electrical properties, is a good model of the real plate and can be used for further investigations. Subsequently, a hole with a diameter of 10 mm was drilled and measurements of the damaged plate were taken.
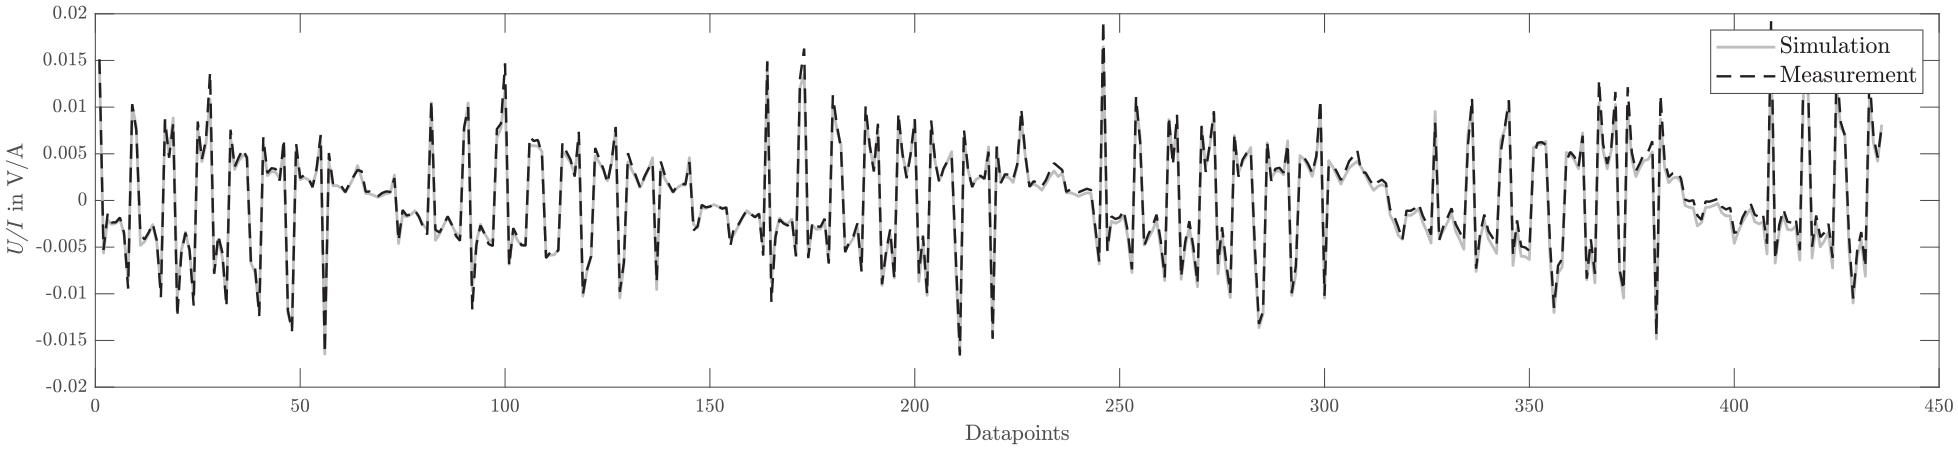
Comparison of boundary voltages between simulation and measurement of a pristine plate.
To further test the capabilities of the new pattern, the topology of the test plate was altered by introducing additional damages. This should represent a more complicated structural part containing defects from manufacturing and usage. New baseline measurements were taken of the altered plate. Two more holes with a diameter of 10 mm each were added to the plate as damages to be inspected. The altered plate is depicted in Figure 12.
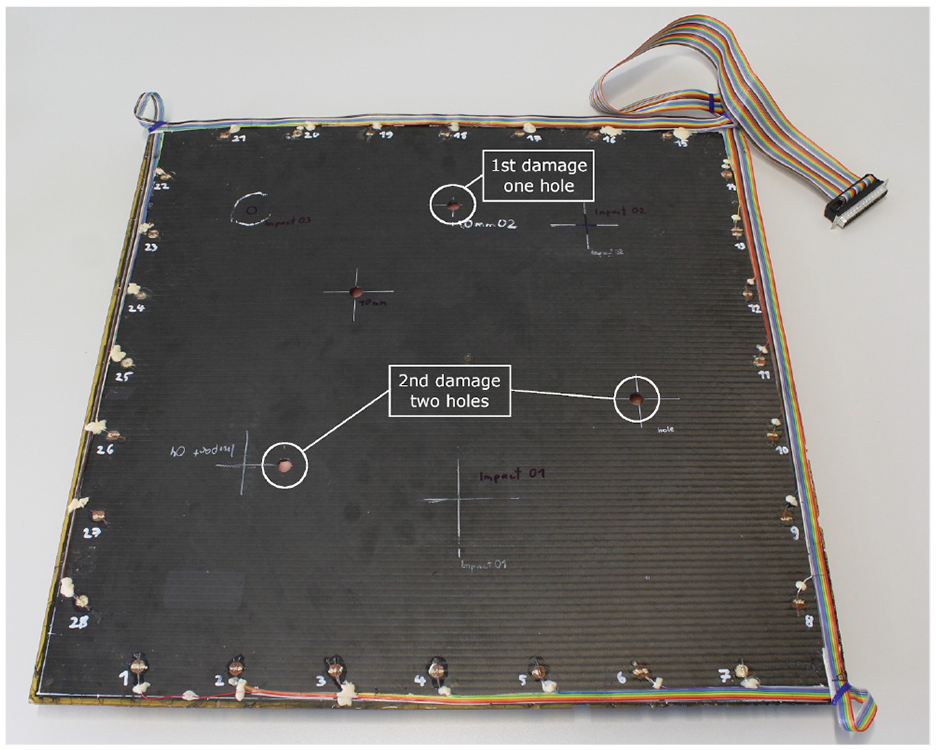
CFRP plate after several damages. The locations of the first damage with one hole and those for the damage investigation with two holes are highlighted. All damages not highlighted, as well as the first damage’s hole, were part of the baseline measurements for the second damage.
Results and discussion
Numerical analysis results
The simulated 10-mm diameter hole is clearly indicated by EIDORS. Figure 13 shows the EIDORS reconstruction of the hole. For each Figure 13(a)-(d), a different injection pattern was used. Although all patterns show the hole, the Star Pattern yields the best resolution. The Diagonal Pattern shows the least distortion caused by the anisotropy of the material, while the two Opposite Patterns show the biggest distortion. PE is smaller than the diameter of the hole for all patterns.
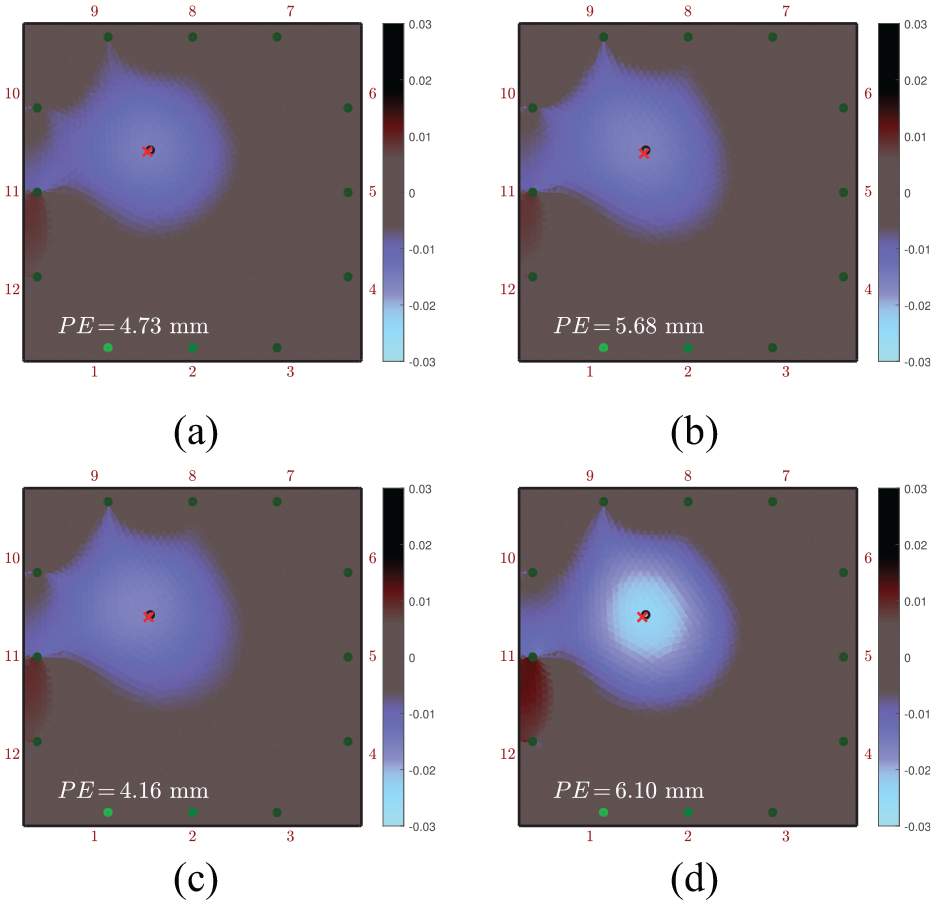
EIDORS reconstruction of a simulated 10-mm hole with different injection patterns. A black circle indicates size and location of the damage. A red cross marks the center of gravity (CoG) of the one-fourth conductivity amplitude set. The position error (PE) is the distance between the CoG and the nominal damage center. (a) Diagonal Pattern, (b) Opposite Pattern, (c) Opposite Pattern through center, and (d) Star Pattern.
Figure 14 highlights how an increase in the number of electrodes affects damage reconstruction. For Figure 14(a), the Opposite Pattern with 28 electrodes was used. For Figure 14(b), the same pattern with only 12 electrodes was used. Resolution increases with the number of electrodes, at the cost of boundary artifacts that distort the image. PE is more than doubled for 28 electrodes because of electrode artifacts, even though 30 mm was truncated for the calculation. Moreover, the Star Pattern with 12 electrodes (see Figure 13(d)) has an even higher resolution than the Opposite Pattern with 28 electrodes without the same drawbacks. Similar comparisons for the other classical injection pattern led to no further conclusions and were withheld from this article.
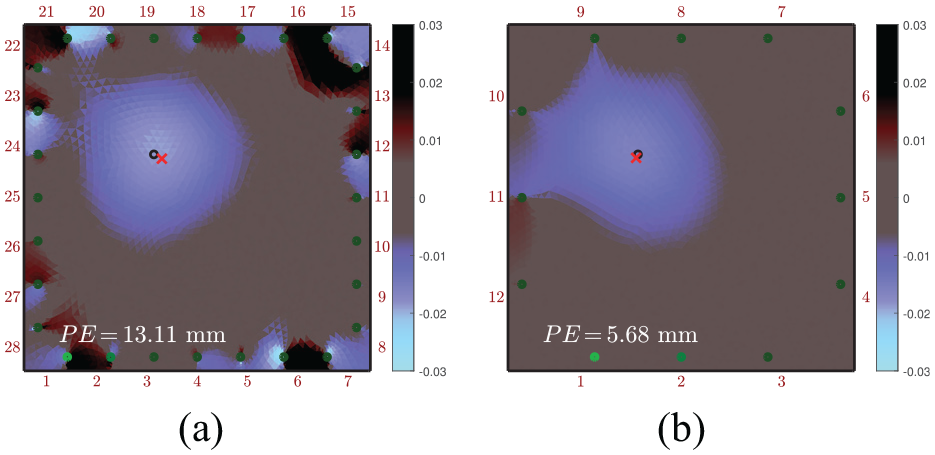
EIDORS reconstruction of a simulated 10-mm hole with different number of electrodes. A black circle indicates size and location of the damage. A red cross marks the CoG. PE is the distance between the CoG and the nominal damage center. Opposite Pattern with (a) 28 electrodes and (b) 12 electrodes.
Figure 15 shows the reconstruction of the plate with two holes. The changes of the potential field are visible for both holes for each injection pattern. As before the Star Pattern shows slightly better results than classical patterns. As a result of the better resolution, the two holes are better distinguishable from each other. PEs are similar for all classical patterns and slightly reduced for the Star Pattern. PE for the hole on the right side, which is closer to the electrodes, is bigger regardless of the pattern.
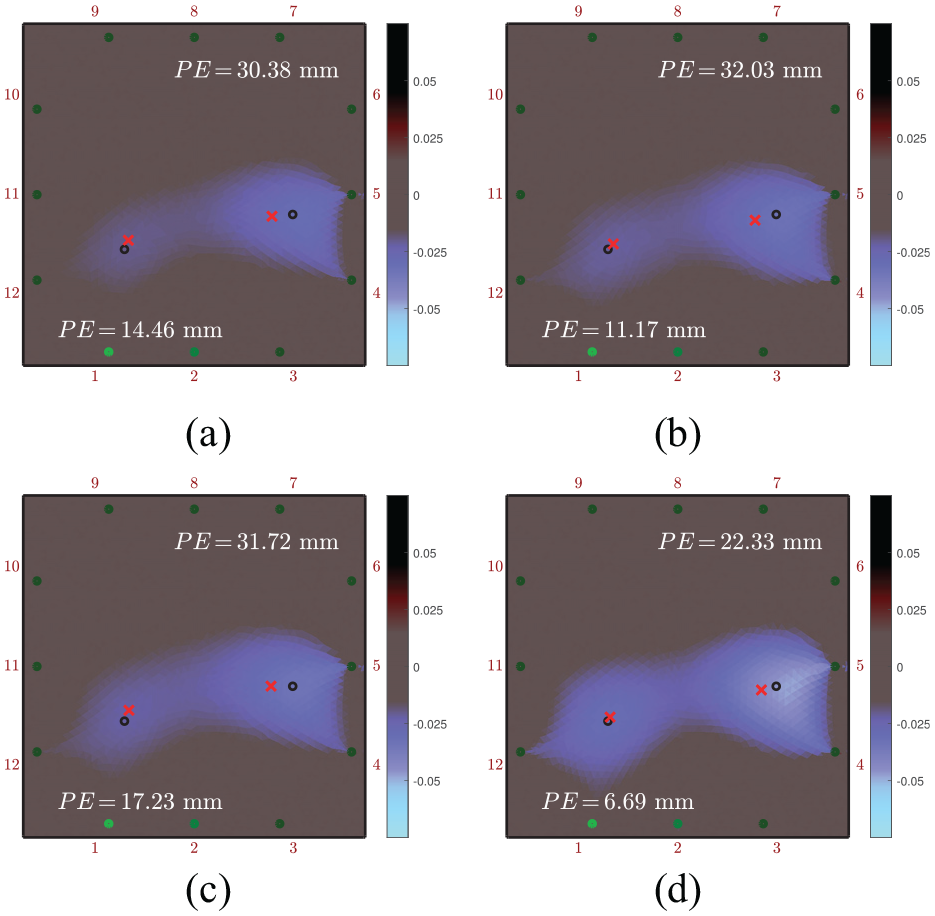
EIDORS reconstruction of a simulated plate with two 10-mm holes with different injection patterns. Black circles indicate size and location of the damages. A separate CoG was calculated for each half of the plate and marked with a red cross. PE is the distance between the CoG and the nominal damage center. (a) Diagonal Pattern, (b) Opposite Pattern, (c) Opposite Pattern through center, and (d) Star Pattern.
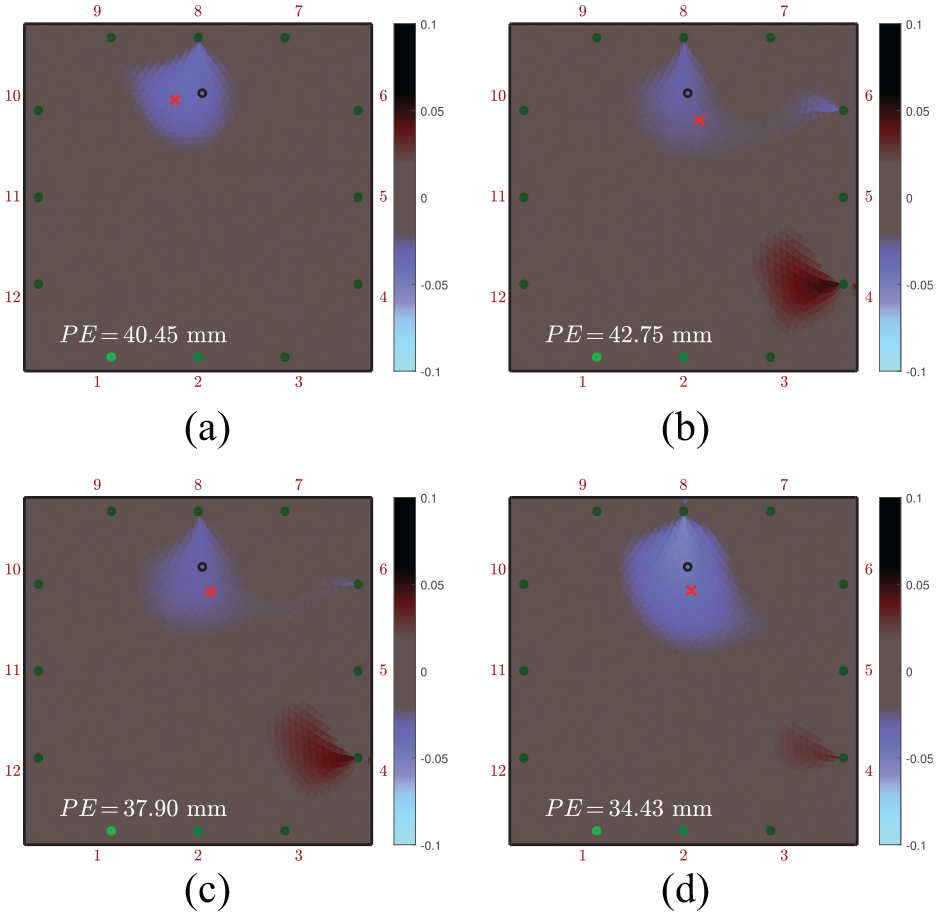
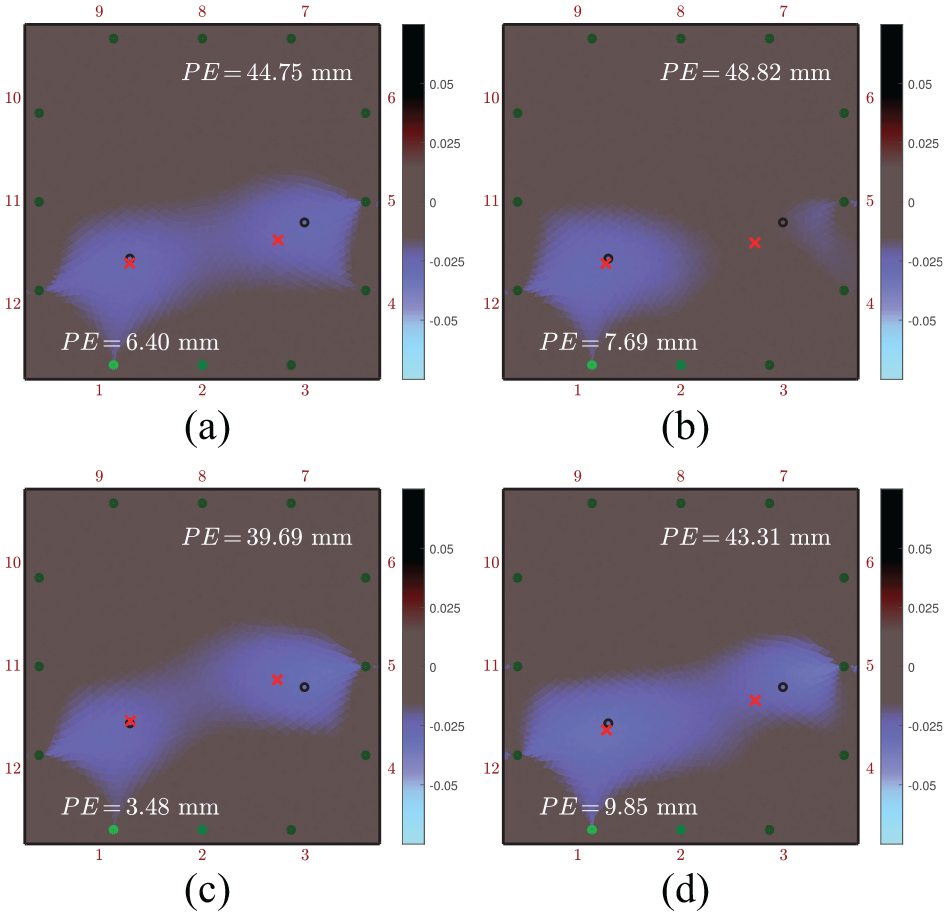
Figure 16 shows the EIDORS reconstruction of the plate damaged by delamination. A black or white circle marks the real position and size of the delamination for each case, as modeled in the numerical analysis. Each row shows the damage at a different location. In each column, a different injection pattern was used. The simulated delamination was not detectable using the classical patterns for most damage positions. With one exception, where the delamination was positioned in the top-right corner (see Figure 16(i)-(l)), the damage was not visible when using classical injection patterns. When using the Star Pattern, the damage is clearly visible for all damage positions (see Figure 16(d), (h), and (l)). Noise level increases for damages closer to the electrodes. This is another reason to prefer a setup using few electrodes. PE is significantly influenced by boundary artifacts. In the cases where no delamination was visually detected, the position of the CoG is solely determined by boundary artifacts, leaving the value of PE meaningless. For the delamination in the top-right corner, PE is of similar size for all patterns.
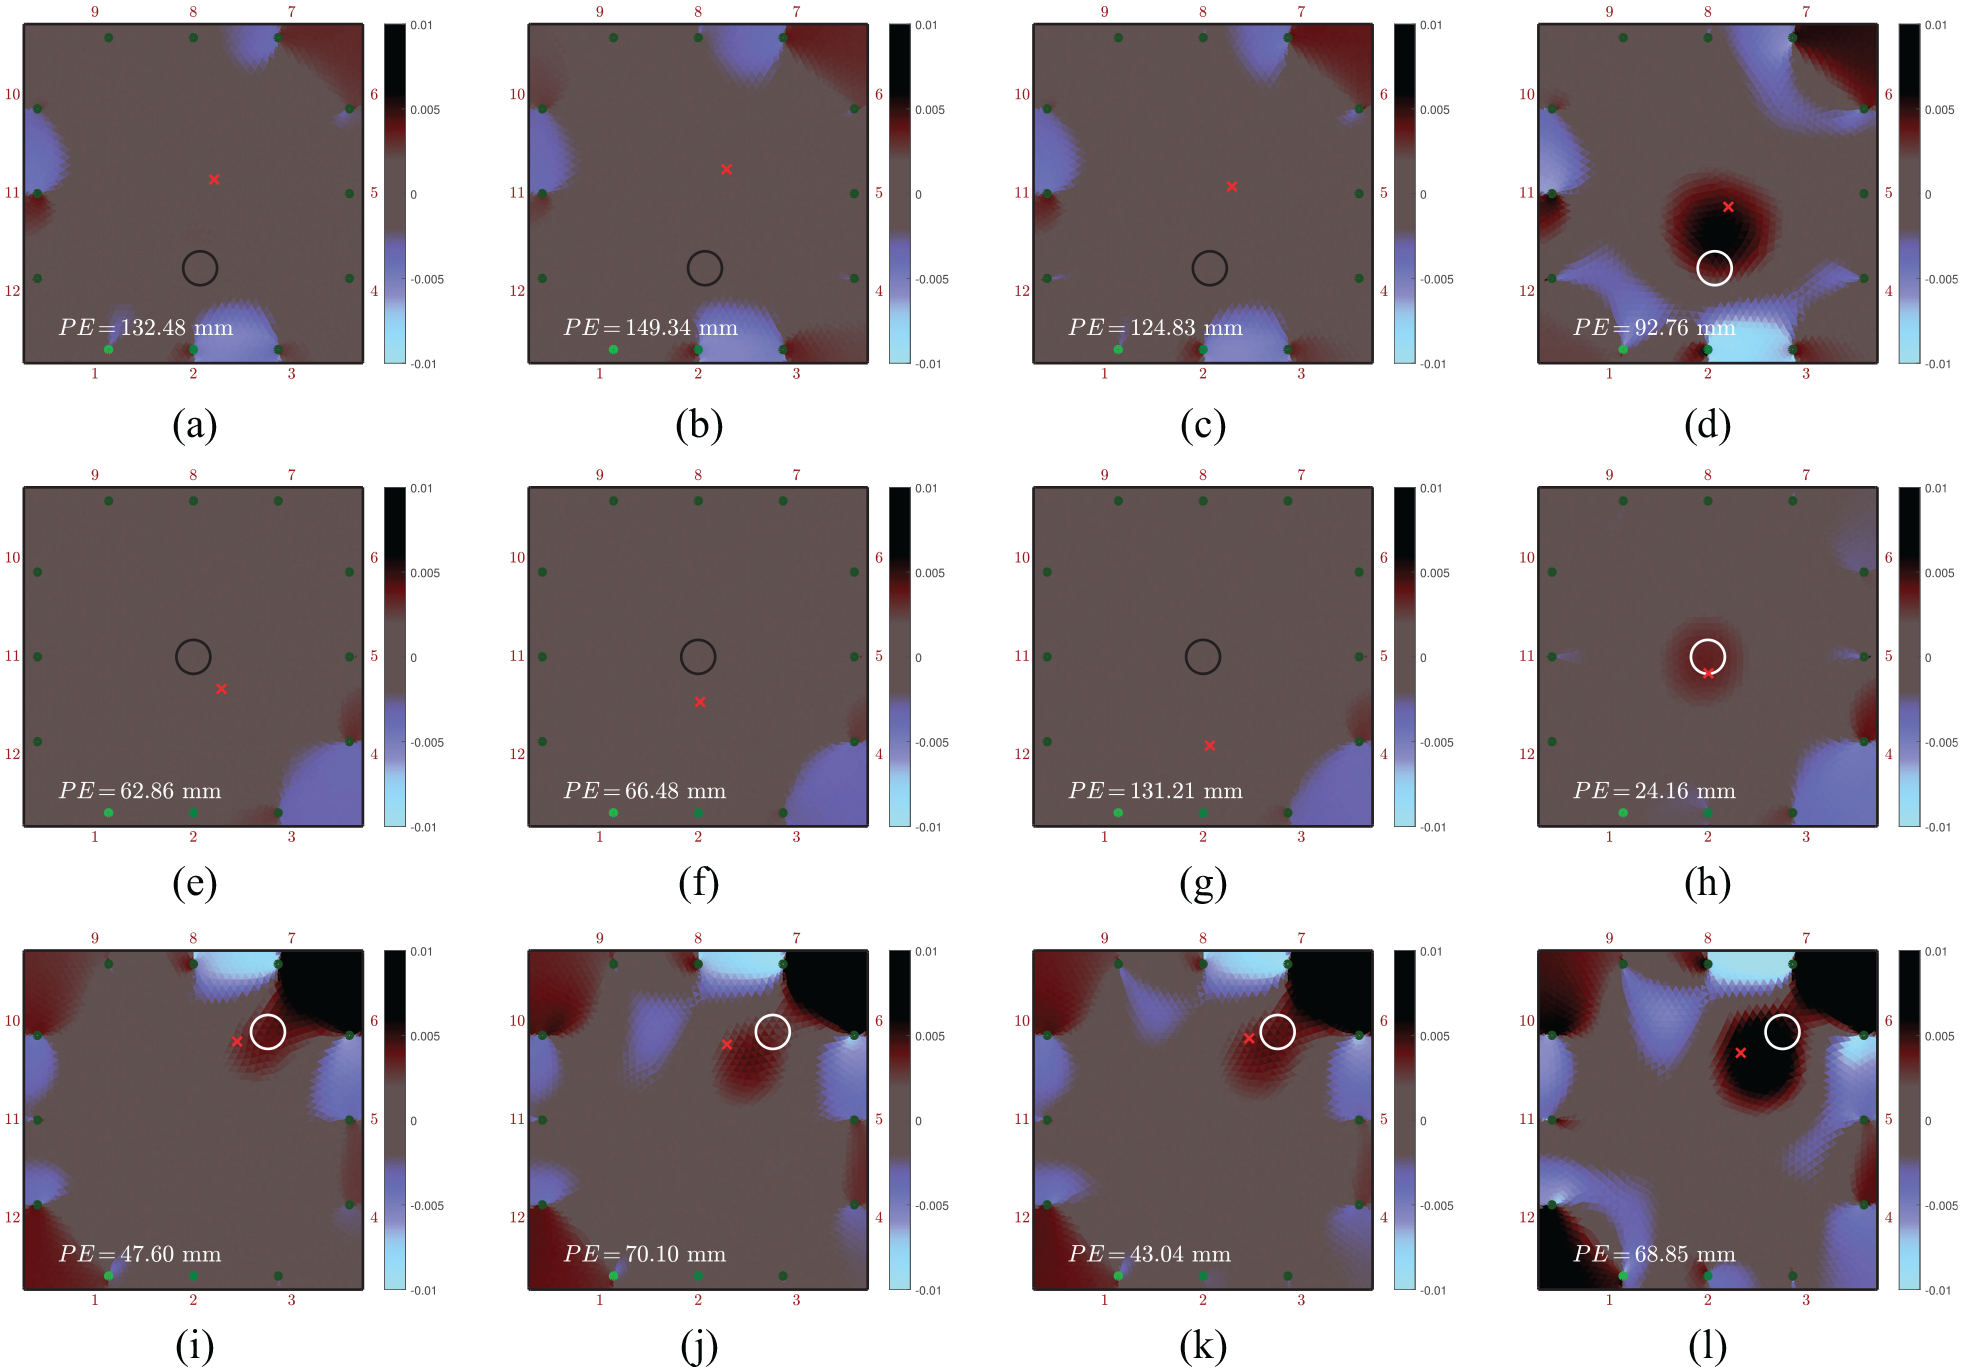
EIDORS reconstruction of a simulated delamination at three different locations with different injection patterns. The black or white circle indicates size and location of the damage modeled in the numerical analysis. A red cross marks the CoG. PE is the distance between the CoG and the nominal damage center. (a), (e), (i) Diagonal Pattern, (b), (f), (j) Opposite Pattern, (c), (g), (k) Opposite Pattern through center, (d), (h), (l) Star Pattern.
Experimental validation results
The conducted experiments prove that the new pattern works under laboratory conditions. As expected, the Star Pattern is not only able to detect a 10-mm diameter hole but also outperforms classical patterns. Other than with measurements taken with classical patterns, where some measurements did not clearly show the hole, every single measurement taken with the Star Pattern clearly detected the damage. For Figure 17, one good combination of baseline and damage measurement was chosen for each injection pattern. PE is similar for all patterns.
EIDORS reconstruction of a measured 10-mm hole on a real specimen with different injection patterns. A black circle indicates size and location of the damage. A red cross marks the CoG. PE is the distance between the CoG and the nominal damage center. (a) Diagonal Pattern, (b) Opposite Pattern, (c) Opposite Pattern through center, and (d) Star Pattern.
The reconstruction of two simultaneous damages still successfully shows both holes, even though the plate was seriously altered before the damages of interest were introduced (see Figure 18). This is true, despite the fact that the EIDORS model of a square plate was not altered in any way, which illustrates the robustness of using differential imaging. The alterations of the plate have the same effect on baseline and damage measurements. Therefore, they do not appear in the final image. This can be used to avoid complex models for complex-shaped structures. As for the previous experiment with one hole, the Star Pattern proved to be more reliable in providing good images. Both holes were distinguishable for each combination of baseline and damage measurements. This was not the case when classical patterns were used. For Figure 18, one good combination of baseline and damage measurement was chosen for each injection pattern. The PEs are similar for all patterns while bigger for the hole closer to the boundary, which is the same shown in the numerical analysis.
EIDORS reconstruction of two 10-mm holes, measured on a real specimen with different injection patterns. Black circles indicate size and location of the damages. A separate CoG was calculated for each half of the plate and marked with a red cross. PE is the distance between the CoG and the nominal damage center. (a) Diagonal Pattern, (b) Opposite Pattern, (c) Opposite Pattern through center, and (d) Star Pattern.
Conclusion
Classical current injection patterns for EIT have difficulties detecting delaminations. Therefore, this article introduced an advanced current injection strategy, the so-called Star Pattern. Through the use of more possible electrode combinations, including current paths at many different angles, the Star Pattern allows for the acquisition of more data points using fewer electrodes than classical current injection patterns. Numerical analysis was conducted showing that the Star Pattern yields better imaging of a 10-mm diameter hole within a 500-mm by 500-mm CFRP plate than the classical patterns. A separate numerical analysis also proved that multiple damages can be detected simultaneously. The third simulation series shows that an ideal delamination of 50 mm in diameter can be successfully detected and localized within the same plate using the new Star Pattern. Experimental measurements of first one, then two 10-mm sized holes validated the numerical analysis confirming the conclusions stated above. For the measurements with two holes, the plate was artificially altered to represent a more complex structural part. This further illustrates the robustness of the method for reliable damage detection. PE was used as a figure of merit to compare different patterns. A comparison of numerical results and measurements indicated similar results for holes.
For future testing and application, real-life measurements of delamination damages caused by impact events will be taken. Based on the results of this article, it is expected that the detection of such impact damages will be possible by using the newly developed Star Pattern. This will make EIT suitable for detecting delamination damage in CFRP parts.
Footnotes
Declaration of conflicting interests
The author(s) declared no potential conflicts of interest with respect to the research, authorship, and/or publication of this article.
Funding
The author(s) disclosed receipt of the following financial support for the research, authorship, and/or publication of this article: The financial support by the Christian Doppler Research Association, the Austrian Federal Ministry for Digital and Economic Affairs, and the National Foundation for Research, Technology and Development is gratefully acknowledged.