
Abstract
This article provides a quantitative nondestructive damage detection method through a Lamb wave technique assisted by an artificial neural network model for fiber-reinforced composite structures. For simulating damages with a variety of sizes, rectangular Teflon tapes with different lengths and widths are applied on a unidirectional carbon fiber–reinforced polymer composite plate. Two characteristic parameters, amplitude damage index and phase damage index, are defined to evaluate effects by the shape of the rectangular damage in the carbon fiber–reinforced polymer composite plate. The relationships between the amplitude damage index and phase damage index parameters and the damage sizes in the carbon fiber–reinforced polymer composite plate are quantitatively addressed using a three-layer artificial neural network model. It can be seen that a reasonable agreement is achieved between the pre-assigned damage lengths and widths and the corresponding predictions provided by the artificial neural network model. This shows the great potential of using the proposed artificial neural network model for quantitatively detecting the damage size in fiber-reinforced composite structures.
Keywords
Introduction
Composites are known as favorable materials by their advantages of superior performance against harsh environments, low cost, and excellent manufacturing capabilities, compared to their metallic counterparts.1–3 Particularly in the aerospace industry, aerocrafts made of full composites have been designed and certified for aerobatic training and competition. Recent surveys show that the penetration rate of composite materials has reached 50% up to now and the full composite airplane is expected to be applied for military and commercial purposes.4–6 However, as laminated composite structures are vulnerable to delamination failures which can grow imperceptibly up to a catastrophic rupture, cautions on the evolution of those failures are raised as well.7–10 The composite structures are vulnerable to failures of interface damage which can grow imperceptibly until a catastrophic rupture is caused on the composites. The delamination damage in a practical carbon fiber–reinforced polymer (CFRP) composite structure is difficult to be identified in situ, especially when it is at its initial stage. Therefore, a number of novel nondestructive evaluation (NDE) techniques have been developed for health monitoring of the composite materials and structures in recent years.11–13 Among these techniques, Lamb waves are widely used for fiber-reinforced composites because of their powerful capability of long-distance propagations with high speeds and little loss of energy.14–17 With transducers in a sparse configuration and well-calibrated signal interpretation techniques, Lamb waves could qualitatively inspect damage such as cracks or delamination in a large area of the composite structure.18–20 However, the quantitative assessment of such abovementioned damages still remains a challenge to the research community. Meanwhile, various problems originated from the dispersion nature and superposition of Lamb waves make it even more challenging in the interpretation of the Lamb wave signals to extract useful information on damages.21–23
According to the research on Lamb wave detection mechanisms, a direct mutual relation between the damage dimension and wave changes introduced by the damaged response signal and the healthy baseline signal is investigated. In order to obtain such quantitative relation, a large number of experiments are acquired for generating the data sets. Then the finite element method (FEM), wavelet spectral finite element (WSFE), chirp broadband, and the time reversal method were investigated for damage identification in both isotropic and anisotropic materials.24–27 The elliptical imaging method was also successfully applied to qualify the delamination damage in a composite plate.28,29 However, due to the amplitude attenuation of guided wave propagation in a laminated composite material, the qualification accuracy might be limited by the sensor array. Recent research has shown that a quantitative damage estimation relationship between the damage geometries and the offsets of Lamb wave inlet and outlet signals can be obtained via the artificial neural network (ANN) technique. 30 In order to ensure the accuracy of ANN, a number of data are required to train the network. A damage identification strategy can be developed with the aid of ANN as an efficient computing tool in composite damage simulation using FEM.31–34 Based on the excellent nonlinear computing capability, it is expected that ANN has a great potential for quantitative damage detection in composite applications, when the accuracy of networks is effectively validated by, for instance, enough experimental data.
In this article, an ANN-based model is proposed to provide a quantitative damage detection solution for unidirectional CFRP composite plates. The remainder of the article is organized as follows: A unidirectional CFRP composite sample with a simulated rectangular damage with different lengths and widths are prepared and tested using the Lamb wave technique in section “Experiments.” According to the experimental results, two characterization parameters for damage detection are defined and their relationships with the damage sizes are discussed in section “Damage indexes.” Then an ANN model is proposed to make a reasonable quantitative determination of the damage size in section “ANN modeling.” Finally, section “Conclusion” draws the concluding remarks of this research.
Experiments
The general damage monitoring procedure using Lamb wave techniques is to capture changes in characteristics from propagation waves. The changes of Lamb wave characteristics due to damage structures in the propagation path are used to quantify the damage dimension. The experimental setup for damage detection is shown in Figure 1. The composite plate was made of 10 T-300 carbon fiber–reinforced unidirectional plies [0]10, the material properties of which are presented in Table 1. The dimensions of the composite plate are 450 mm × 450 mm × 3 mm. A piece of rectangular Teflon tape was applied at the center of the composite surface to simulate accumulated air at the site of damage and debonding.35,36 The length of damage varies in range from 5 to 75 mm, the detailed distribution of which is sparse in the middle of the damage dimension range and dense at 5 and 10 mm. To activate and acquire the damage diagnosis signal, two SM412 piezoelectric (PZT) sensors from Steminc Inc. with 7 mm diameter were fixed on the surface, the material properties of which are shown in Table 2. The sensors were on both sides of artificial damage with the distance of 200 mm, as shown in Figure 2. The Lamb wave propagates through the damage area and is received from the other sensor as the pitch–catch configuration. Due to the attenuation of Lamb wave propagating in the composite plate, the damage is placed along the sensor path for collecting as many experimental signals as possible. The propagation Lamb wave throughout the damage area including damage information such as damage size is received by the PZT sensor.

Experimental setup of damage monitoring.
Mechanical properties of the composite plate.

Geometrical and material parameters of piezoelectric sensors.


Geometry of the piezoelectric sensor layout.
Lamb wave propagation in isotropy plates are complex due to the synthetic effect by the dispersion nature, multi-mode superposition, and mode conversion.37,38 The anisotropy and multiple plies of composite materials further enlarge the complexity of received Lamb waves and increase the difficulty of signal processing. The velocities of Lamb waves are strongly dependent on wave frequency and plate thickness. As given in the literature, each mode of the Lamb waves travels at almost the same velocities for composites with different laminating components.26,39,40 Therefore, to avoid mode superposition, low-frequency Lamb waves are usually utilized for damage detection. In our study, the excited signal of the Lamb waves is limited to 1 MHz mm. In practice, the excitation signal with a frequency lower than 100 kHz might hardly provide the required resolution for damage monitoring in composite plates. 41 In order to concentrate the majority of wave energy on the desired central frequency, a window function is used on Lamb waves such as Hamming window, Hanning window, or Gaussian window. Hanning window is one of the most widely used window functions with the characteristic of reducing spectrum leakage, the function of which is expressed with discretization from N sampling points as

It is reported that the Lamb wave dispersion characteristics decrease with the increasing number of wave cycles, but excessive cycles lead to over long duration, redundant wavelength, and low time resolution. 42 A five-cycle sinusoidal tone burst with a Hanning window function is commonly used as the activated signal in NDE damage detection testing due to a compromise between dispersion reduction and appropriate time duration.43–45 A sinusoidal Hanning-windowed signal with five cycles and a central frequency of 140 kHz is shown in Figure 3 as the excited signal.

Excitation Lamb wave signal in the time domain.
The baseline signal is carried out to present the healthy state in comparison with the received signal from the damaged state. The first wave packets of the received and excited Lamb waves are shown in Figure 4, together with the envelope corresponding to each wave packet. It illustrates that the amplitude of damaged signals is larger than that of healthy signals, and time of flight (ToF) is slightly altered as well. This is because the damage behaves as an obstacle and the low-frequency ultrasound waves tend to diffract around it. When the Lamb wave propagates to the damage area, it is reflected dispersedly by the edge of the damage, resulting in a certain class of mode superposition on the received signal and enhancing the amplitude of the received wave packet in Figure 4. Meanwhile, the propagation path of the Lamb wave is extended, causing a delay of the received signal. Accordingly, the shift of amplitude and ToF from the received Lamb wave can be linked with the damage in the wave path to identify the presence of the damage effectively.

Excitation signal and response signals of the healthy plate and the delaminated plate.
Damage indexes
Figure 5 shows the damage wave packets passing through damages in which only the lengths or widths are varied, compared to the healthy wave packets. It can be observed that the amplitude of the damage wave packet arises with the increasing length of damage but decreases with the increasing width of damage. The arrival time of the damage wave packet reduces while either the length or the width of the damage increases.

Details of wave packets from healthy signals and damaged signals: (a) only the widths of the damage are varied; (b) only the lengths of the damage are varied.
It can also be seen from Figure 5 that the amplitude and ToF of Lamb waves show an evident correlation with both the damage length and width. This is to say that the signals captured from the damaged laminate would change drastically compared with the baseline signal from the healthy laminate. Such a change can be used to quantitatively indicate the damage size along the sensing paths, by two parameters. One is called amplitude damage index (ADI) defined by the ratio of amplitudes between the damage and baseline wave packets. The other is called phase damage index (PDI) defined by the ratio of phases between the damage and baseline wave packets. These two parameters present an approximate mathematical correlation between the damage size and the Lamb wave signal as expressed by the following equations


where a means the wave packet amplitude, p is the instantaneous phase, the subscripts d and h represent the damaged and healthy signals, respectively.
Relationships between the damage indices ADIs and PDIs and damage sizes are plotted in Figure 6(a) and (b), respectively. It can be seen clearly that both ADIs and PDIs arise when the damage width increases or the damage length decreases with the other damage size fixed. A certain relationship between unilateral damage size and damage index is acquired from the experimental datasets. By assuming that each side of the rectangular damage has a unique corresponding damage index, the ADIs and PDIs can be adopted to quantify damage size. However, the mathematical relationship between both lengths of the rectangular delaminated damage and such damage indexes is obviously nonlinear, and thus the simple linear fitting equation is not suitable for quantitative damage assessment. Therefore, advanced modeling techniques such as ANN are required for quantitative damage detection.

Damage indices versus damage lengths and widths: (a) ADI and (b) PDI.
ANN modeling
As described above, an ANN model is developed for evaluating the nonlinear relationships between the damage indices (ADIs and PDIs) and damage sizes. This ANN model consists of one input layer, one output layer, and one hidden neural processing layer as illustrated in Figure 7. The ADI and PDI are assumed as the input (x, y) of the ANN model, and the length and width of the damage area are assumed as the two-dimensional output (a, b), respectively. And the hidden layer of the ANN model is constructed using four computing elements. The sigmoid function shown in equation (4) is adopted to train the ANN model 46

where x indicates the input of each node in the input layer ranging from negative infinity to positive infinity. To provide the training data for ANN, 84 sets of experimental data are randomly picked out from the 91 datasets from damage detection experiments acquired in section “Experiments.” The training data of ANN are normalized to the interval [0, 1] for achieving higher computing speed and accuracy. 47 After a number of iterations of the neural network learning, the absolute mean square error (MSE) between the actual value and the predicted value converges to its minimum. Then the input and output data are de-normalized to their initial dimensions.

Illustration of the artificial neural network.
To validate the accuracy of the ANN model, two parameters, that is, “loss” and “ val_loss,” respectively, are defined from the difference of outputs and actual values. The parameter “loss” indicates the deviation between the neural network output and the experimental measurement, while the parameter “val_loss” indicates the deviation between the output value and the calibration value. During the network training, the trends of both the “loss” and “val_loss” parameters within 10,000 training epochs are illustrated in Figure 8. It indicates that both deviation parameters decrease rapidly at the beginning of the iterations and converge gradually instead of enlarging suddenly at a large epoch number which is called over-fitting appearance in the neural network. This shows that the ANN model developed in this study is trained effectively.
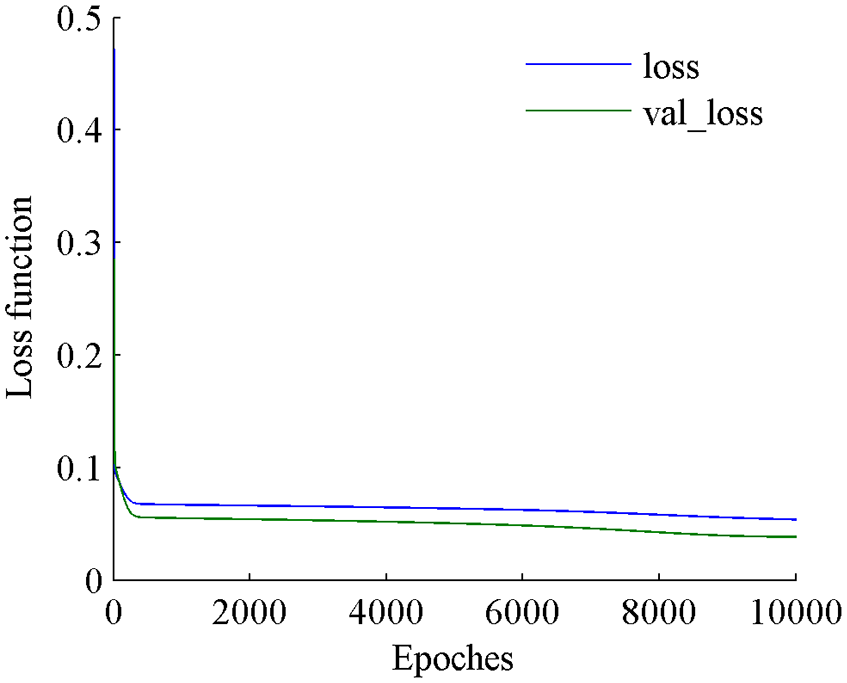
The trend of deviation of the neural network.
Results of the remaining 7 out of 91 experimental datasets are used for the ANN model validation. Comparisons between the predictions of damage lengths and widths and their experimental counterparts are plotted in Figure 9. It can be concluded that the estimated error from the actual values subject to the distribution N(0,

where S2 means the sample variance, n means the degree of freedom with a value of 7, α is 5%, and t means t distribution. It can be observed that both the length and width of the delaminated damage can be evaluated by network study, and the prediction values are approximately in the 95% confidence bounds. A deviation of approximately 15 mm between the predicted and actual values is illustrated in Figure 9 from which the deviation of damage width is larger than that of damage length. It is shown that the predicted damage size is in an approximate agreement with the actual damage size, which implies that the estimation model using ANN techniques is usable for quantitative damage assessment. This is in agreement with the literature study of using the similar models for the detection of damage size in a composite structure, from which both length and width of a rectangular damage were detected with a notable error in average. 48 As a comparison, the detection error is further reduced using our presented method.

Predicted damage sizes using the ANN model compared with the actual values: (a) length of the damage and (b) width of the damage.
Finally, a sensitivity study on predictions by the ANN model was carried out by applying a slight perturbance on the input damage indices ADIs and PDIs. It is assumed that the measurement error of both ADIs and PDIs follows a normal distribution N(0, σe), where σe is set at 0.02. Then a completely new set of data were generated by adding random error to each of the experimentally measured ADI and PDI parameters from the training data. Using the same training strategy, the predictions of the seven damage sizes were obtained and are shown in Figure 10, compared with those obtained from pristine experimental measurements. According to Figure 10, the predicted damage sizes are not significantly changed with and without consideration of the stochastic error. This underlines the fact that the ANN model is robust enough to persist a small perturbance on the input damage indices.

Perturbation analysis of damage prediction with random error value: (a) length of the damage and (b) width of the damage.
Conclusion
A Lamb wave–based damage evaluation method assisted by an ANN model is presented in this article. When guided Lamb waves propagate through an artificial simulated damage, the response wave signals containing damage size features are obtained. Two damage indices ADI and PDI are extracted from the received wave packets and found to be in nonlinear correlations with both length and width of the artificial damage in the composite plate. Then an ANN-based damage prediction model is developed to quantify the damage size based on the measurements of these two damage indices. In total, 91 Lamb wave detection tests with different artificial damage lengths and widths were performed for collecting experimental data. Among them, 84 sets of the experimental data were randomly selected for training the ANN model, and the remaining 7 sets of the experimental data were used for validation. A good agreement between the experimental and predicted results can be observed even though a small perturbance was applied on the ANN input data to simulate the measurement error. This implies that the ANN model developed in this study shows a robust behavior in the prediction of damage sizes and therefore presents potential applications on quantitative damage evaluation in composite materials.
Footnotes
Handling Editor: James Baldwin
Declaration of conflicting interests
The author(s) declared no potential conflicts of interest with respect to the research, authorship, and/or publication of this article.
Funding
The author(s) disclosed receipt of the following financial support for the research, authorship, and/or publication of this article: The work described in this paper was supported by the Fundamental Research Funds for the Central Universities (No. 50100002019114016).