
Abstract
Local, superficial damage was detected and localized on an 8 × 2-m concrete floor slab using a structural health monitoring system. A total of 30 piezoelectric transducers, placed in a grid, transmitted and received continuous ultrasonic waves that were measured using a lock-in amplifier. Tomography was used to create images from the measured amplitude and phase of the continuous waves between all possible transducer pairs. The location of damage induced by impact hits was visible in the resulting images. The signals could easily be detected even between the most distant transducer pairs, indicating the possibility of monitoring even very large concrete structures.
Introduction
Minor damage and small cracks in concrete can quickly lead to more severe damage, for example, by exposing the reinforcement bars to the environment. Thus, early signs of damage and degradation need to be detected. To this end, much effort has been devoted to the fields of non-destructive testing (NDT) and structural health monitoring (SHM).
Ultrasonic waves have been successfully used in NDT of concrete structures.1,2 Measurements of the velocity, attenuation, and nonlinearity of propagating ultrasonic pulses have been shown to be indicators of cracking, with increasing sensitivity in the order mentioned.3–5 Methods based on guided waves commonly only involve an analysis of the direct propagating wave, and thus they only investigate the direct path between two sensors. This is not optimal for SHM of large civil structures, as it is necessary to monitor as large a volume as possible using fixed sensor locations.
In coda wave interferometry (CWI), the trailing part of the transient signal is included in the analysis. These signals correspond to the diffuse field created by reflections from the boundaries and scattering from heterogeneities in the material. It is not possible to attribute features in the diffuse signal to any one specific bulk or guided-wave mode, nor is it possible to determine the propagation path traveled by a wave corresponding to a particular part of the signal. However, it has been shown that CWI is very sensitive to changes in the material.6–9 This sensitivity can be attributed to the fact that the trailing parts of the measured signal correspond to waves that have traversed a relatively large volume and they may have traversed the damaged region repeatedly. These waves, thus, have been more affected by damage in the material than the parts corresponding to the direct propagation path.
The literature describes numerous studies where CWI has been implemented in both NDT and SHM applications and investigated for its ability to detect early onsets of cracking in concrete.10–14 Recent publications report on methods to compensate for temperature effects on CWI measurements15–17 and to measure nonlinear effects in the monitored material,18,19 thus furthering the usefulness of diffuse field measurements in SHM applications.
However, one issue with coda wave analysis (and guided waves in general) in civil structures is the fact that mechanical waves experience substantial attenuation in concrete. This makes it difficult to cover large areas as the transducers have to be placed close together. For this reason, the prospect of detecting weaker signals, thereby increasing the transmission range, is appealing.
One method of improving the detection capability is to use single-frequency tones as the excitation instead of transient bursts. If a single frequency is transmitted continuously, then after a short period of time, a steady state will stabilize that consists of direct propagation, reflections from the boundaries, and scattered waves. The signal measured at any receiver location will be a superposition of all the different propagation paths between the actuator and receiver. This removes any temporal information in the measured signal, which impedes spatial resolution. However, an advantage is the increase in energy of the scattered and reflected waves, which would otherwise rapidly attenuate below the noise floor. Furthermore, if a lock-in amplifier is used as a coherent detector, then continuous signals can be detected at low amplitudes, even well below the noise floor. This has the potential to increase the distance between transducers and thus enable the monitoring of larger structures given a fixed number of sensors. It also has the potential to measure higher signal frequencies, which are known to be more sensitive to damage but are quickly attenuated by the concrete at significant distances.
Yan et al., 20 Liao et al., 21 and Song et al. 22 used continuous waves in SHM of concrete beams subjected to damage. The frequency of the continuous transmission was swept over an interval, and the energy at different frequency bands was calculated using wavelet package decomposition. The damage to the concrete was correlated with a decrease in energy. Lobkis and Weaver 23 also proposed the use of continuous wave transmissions to monitor changes in materials. In their work, the monitored structure acts as the propagation medium in an ultrasonic feedback system, and changes in the material were shown to affect the frequency of the resulting continuous tone.
In previously published work by the authors, 24 we showed that, in a reinforced concrete slab subjected to bending loads, the amplitude and phase measurements of continuous wave excitations can indicate damage with a sensitivity comparable to that of pulsed coda wave analysis. We also showed that measurements of the continuous waves maintain their sensitivity to damage in the specimen at signal-to-noise ratios far below the functional limit of pulsed wave measurements, even after the filtering and averaging of the latter.
Locating damage in concrete, when using multiple scattered and reflected wave measurements, is not straightforward due to the diffuse nature of the acquired signals. However, methods for locating damage have been proposed based on modeling travel time variations of coda waves 25 and decorrelation.26,27 In these methods, the multiply scattered propagating wave fields are modeled as diffusion, where analytical solutions of the propagation of the average intensity in space and time are used. These tomographic methods require full waveform measurements of the diffuse wave fields, which is why they are not applicable when transmitting continuous waves and measuring with a lock-in amplifier, since this yields only scalar values of amplitude and phase. Yan et al. 20 located damage to some degree, when using continuous waves, through dividing a shear wall into horizontal and vertical subdomains and assigning each domain the value of the damage index measured by one transducer pair per domain. A similar approach is used in this work; the structure under test is divided into a set of subdomains and each domain is evaluated by averaging amplitude and phase measurements from a large number of transducer pairs.
The purpose of this study is to investigate the possibility of detecting and locating any superficial damage on a large concrete floor slab using continuous wave measurements. Reciprocal piezoelectric transducers were surface mounted in a grid on the floor, and a monitoring system was implemented that enabled reciprocal measurements between all sensors in the network.
Materials and equipment
Floor module
The floor module was a composite of an 8000 × 2110 × 80-mm concrete slab on top of glued, laminated timber (glulam) beams. The glulam beams were attached to the concrete slab with screws that protruded diagonally from the beams and were cast into the concrete. Figure 1 provides details on the dimensions of the floor module, and Table 1 lists the material composition of the concrete. The water–cement ratio for the concrete was 0.442. The slab was cured for more than 28 days at 20°C at the production facility of the manufacturer, after which it was transported to the testing facility. The concrete slab was reinforced with a steel mesh with a nominal diameter of 6 and 150 mm2.
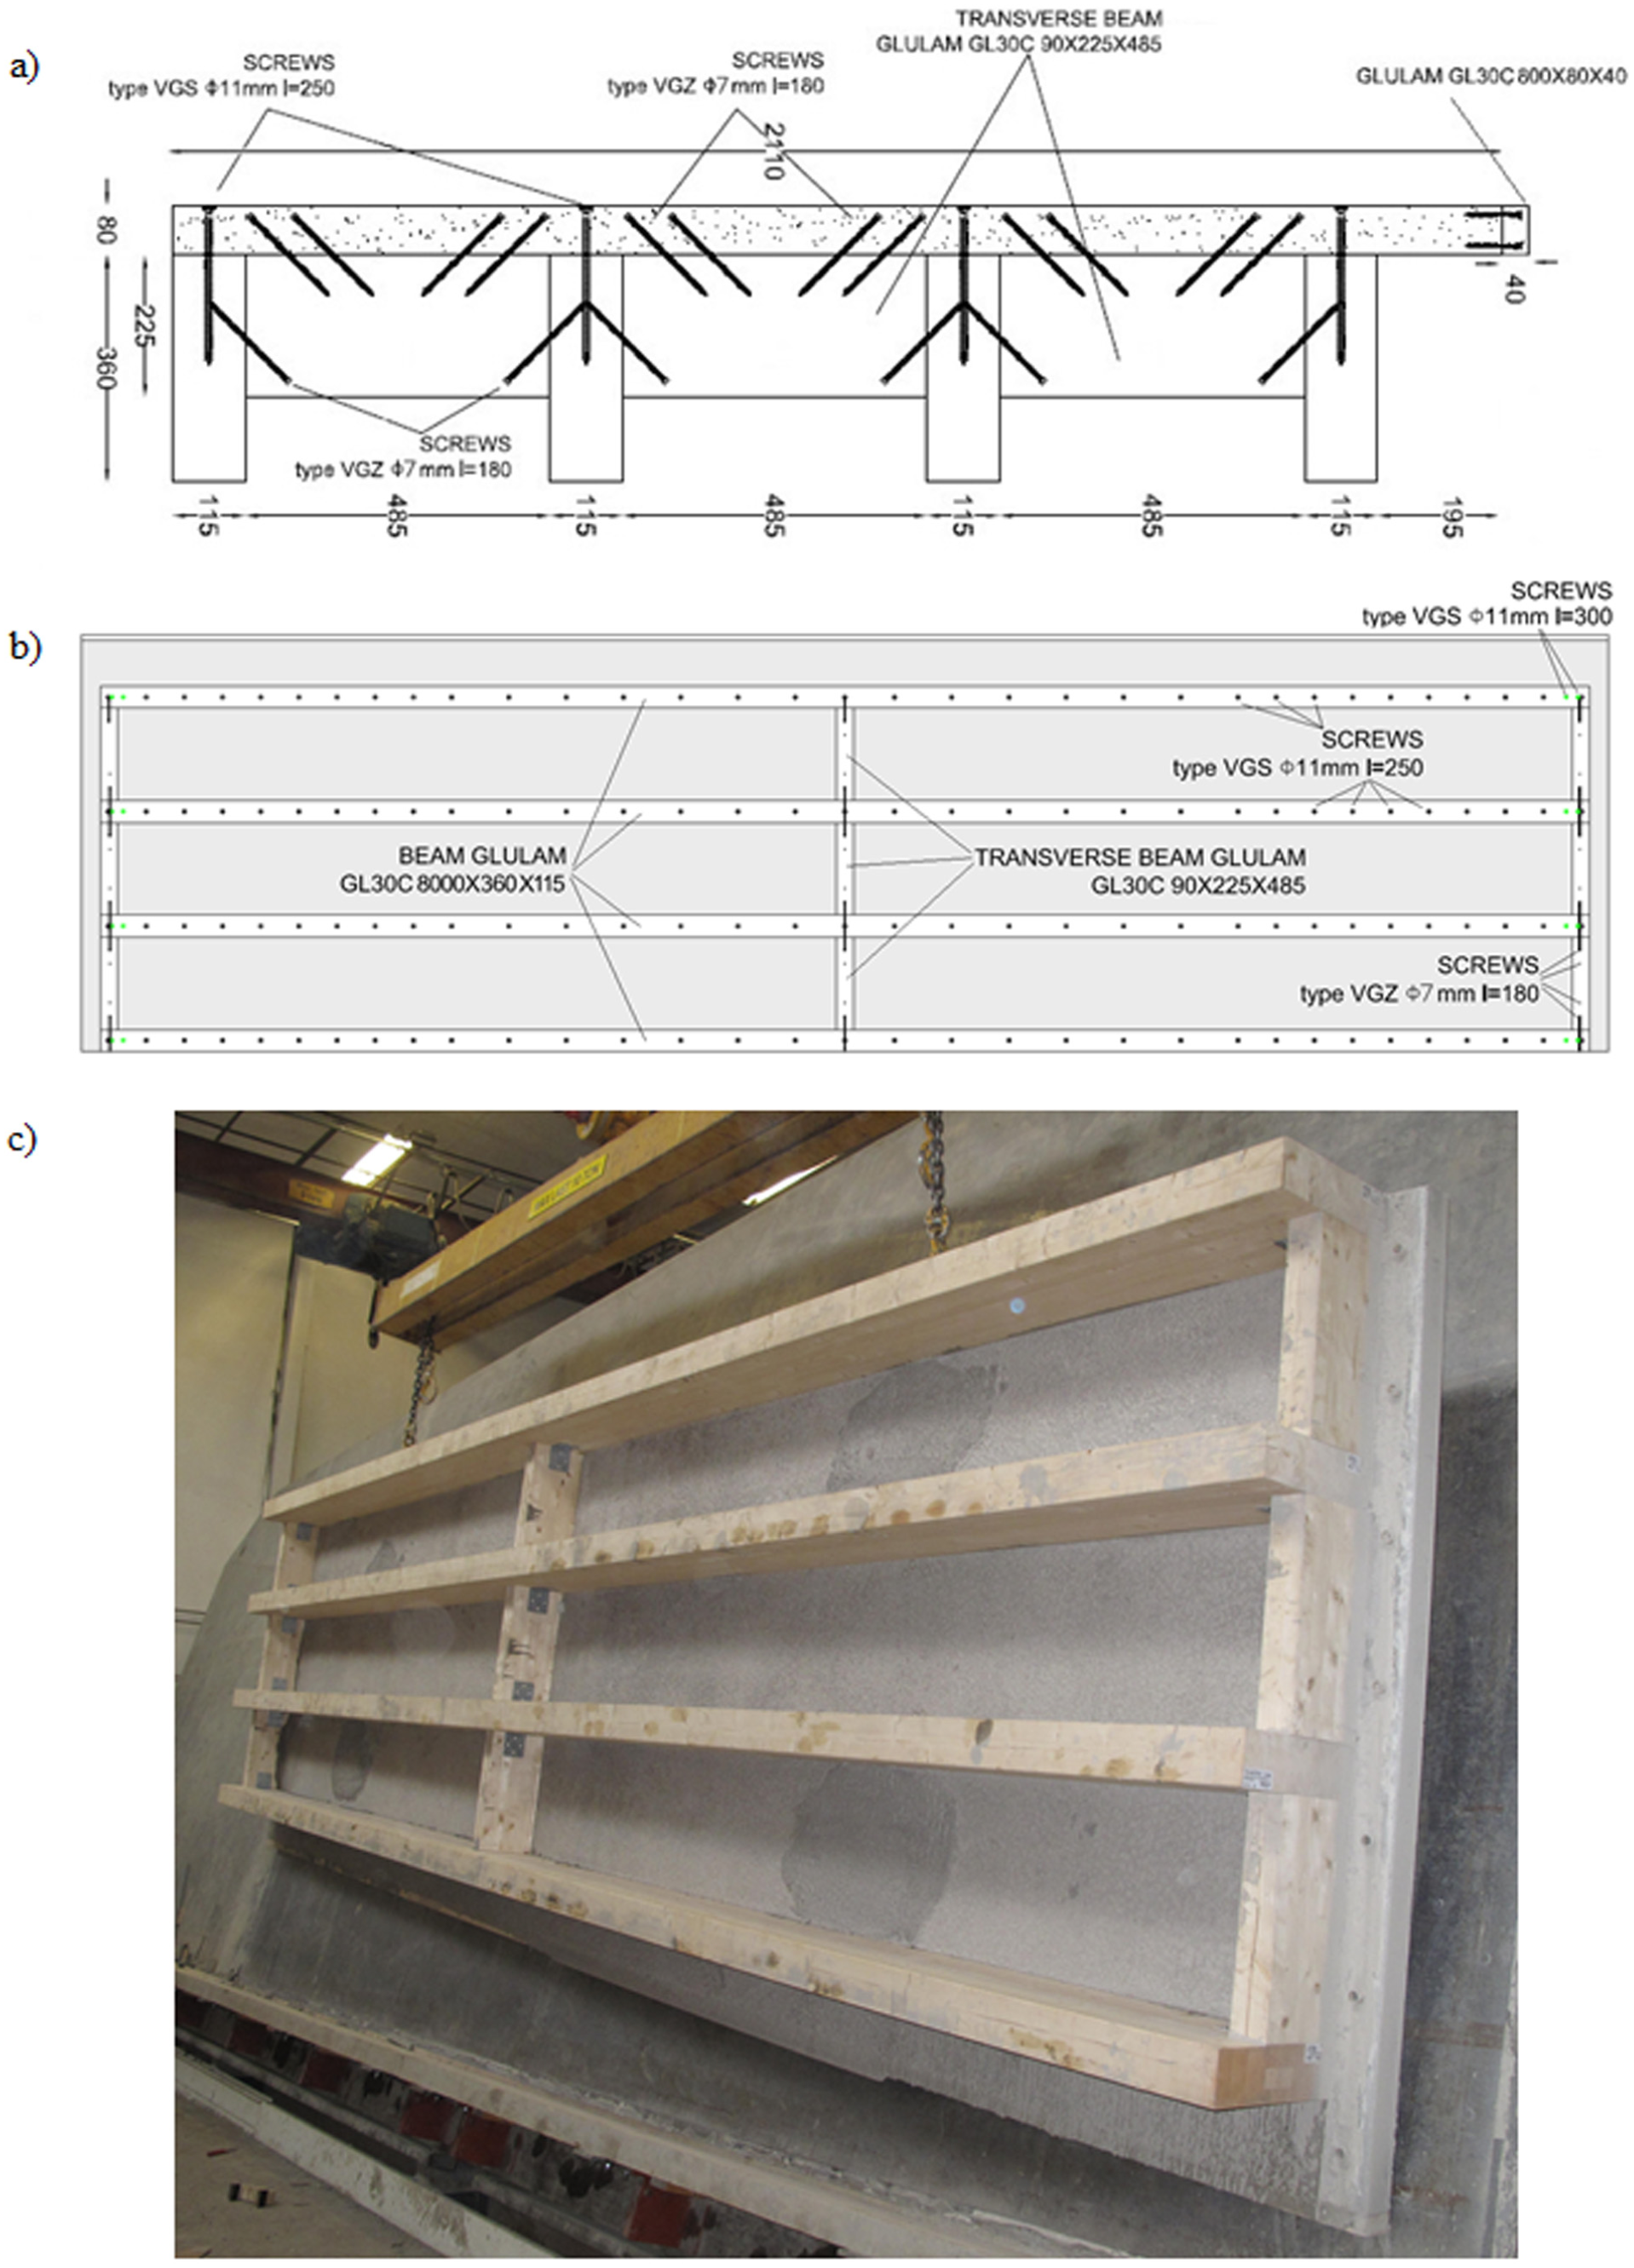
(a) Sketch of the floor module as seen from the short side, (b) sketch of the floor module as seen from below, and (c) photograph of the floor module as seen at an angle from below. All dimensions are in mm.
Composition of concrete.
Ultrasonic transducers
Piezoceramic disks (Ferroperm Pz 27) with a diameter of 38 mm and a thickness of 10 mm were used as the ultrasonic transducers. The disks were glued to 25-mm-high aluminum cylinders. Bayonet Neill–Concelman (BNC) connectors were installed into threaded holes in the cylinders and connected to each pole of the ceramic disks. Combined, the transducers, lead zirconate titanate (PZT) disk, and aluminum cylinder have major resonant frequencies around 50 kHz.
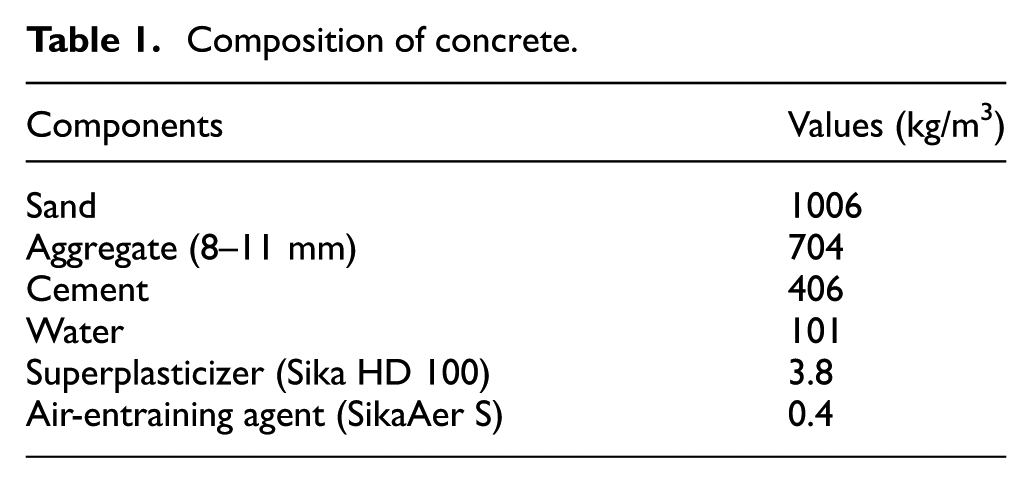
A total of 30 steel disks with a diameter of 40 mm and a thickness of 5 mm were glued onto the upper side of the concrete floor slab with an even distribution in a 3 × 10 grid. Each disk had a threaded hole by which the transducers could be attached. The layout and numbering of the transducers are shown in Figure 2.
Layout and numbering of transducers. Dimensions are given in mm.
Measurement equipment
The excitation signal was generated by an Agilent 33500B waveform generator and amplified by an A.A. Lab Systems LTD A-303 amplifier. Measurements were performed with a Signal Recovery 7210 multichannel digital signal processing (DSP) lock-in amplifier that can measure up to 32 channels simultaneously. The lock-in amplifier outputs the amplitude of the measured signal and its phase relative to the driver signal (provided by the waveform generator).
A custom-made multiplexer from SubVision was used to switch the transmission and reception channels arbitrarily between the signal generator and the lock-in amplifier.
Experimental program
For each measurement, one transmitting transducer was excited by a continuous 50 kHz sinusoidal wave. After the amplifier stage, the amplitude was 60 Vpp. The signal was left on for 100 ms before any measurements were made, providing sufficient time to reach a steady state. The lock-in amplifier measured the amplitude and phase at all 29 transducers that were not transmitting. The multiplexer then switched so that the next transducer in line operated as the transmitter and the rest as receivers. Thus, in each measurement cycle, every transducer acted once as transmitter, while all others acted as receivers. This resulted in 30 × 29 data pairs. There was no external filtering or pre-amplification of the input signals to the lock-in amplifier.
Damage was gradually induced by use of a HILTI DX2 bolt gun with 6.8/11 M10 DX cartridges, power level “green” (“light”). The bolt gun was not loaded with any bolts, but the piston was used to inflict impact damage in a repeatable manner. The location of the shots on the floor slab is indicated in Figure 2.
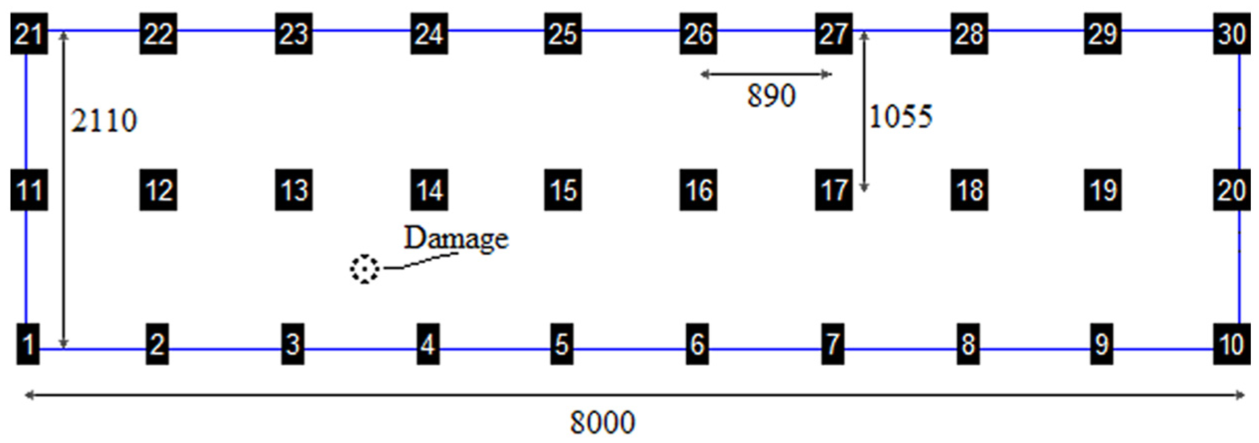
The first shot was fired at the center of the area between transducers 3, 4, 13, and 14. Subsequent shots were fired in a 15-cm-diameter circle around the location of the first shot. Figure 3 shows the order of the shots and the damage to the concrete. The visible damage to the concrete was superficial, with the deepest hole about 5 mm. The width of the holes varied from less than 1 to 4.5 cm. Some superficial cracking can be seen around the holes, for example, around hole number 1.
Photographs of the damage to the concrete from the bolt gun shots: (a) close-up of the damaged area. The numbers signify the order the shots were fired in; (b) damaged area in relation to surrounding transducers. Closest in-picture transducers are numbered. Other types of transducers, not referenced in this article, and two of the threaded holes used for lifting the floor slab are also seen.
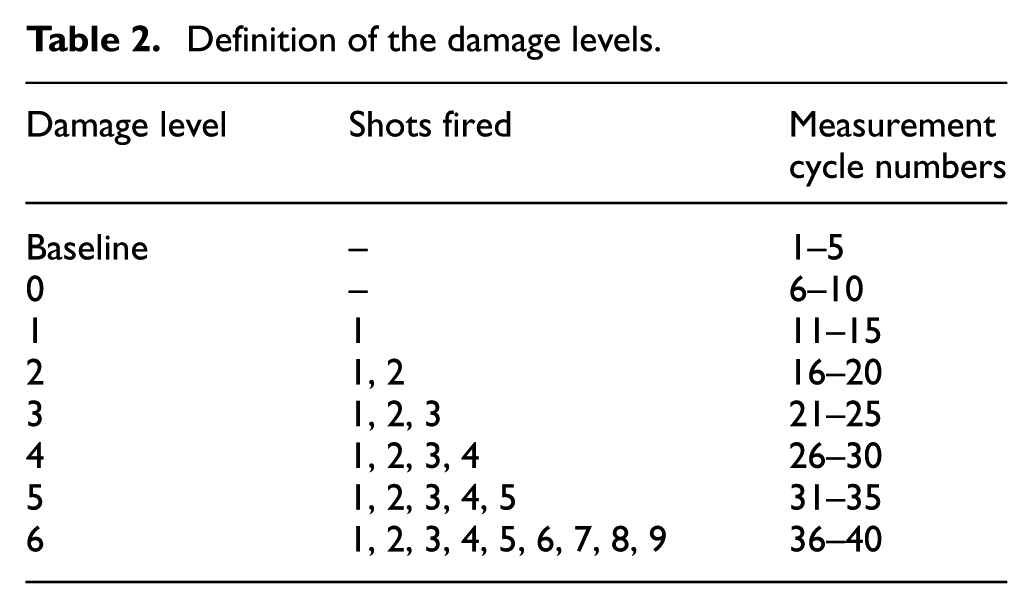
A total of 10 measurement cycles were performed with the undamaged concrete floor slab. The data from the first five measurements are used as the baseline. After the measurements on the undamaged slab, shots were fired every five measurement cycles. Table 2 shows after which shot (as numbered in Figure 3) the different measurement cycles were done. Shots 6–9 were all fired together before the last five measurement cycles.
Definition of the damage levels.
Data processing
The lock-in amplifier measured the amplitude and phase of the steady-state wave field at each receiver location, yielding two-dimensional measurements.
Each measurement was evaluated with Mahalanobis distance, 28 in amplitude–phase space, from the baseline data set. Equation (1) shows the Mahalanobis distance with transducer i as the transmitter and transducer j as the receiver
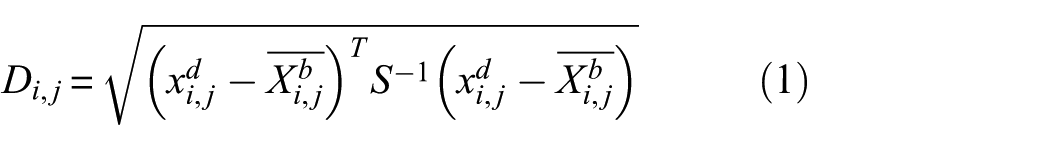
where
Mahalanobis distance equals the distance from the mean of the baseline data set, expressed as the number of standard deviations of the baseline data in the specific direction in amplitude–phase space.
This damage indication system takes into account fluctuations in the baseline data set. If the baseline measurements have large variations in a certain direction in amplitude–phase space, then a larger absolute deviation from the mean of the baseline is needed in this direction to identify a measurement value as an outlier.
Since the continuous transmission will create a diffuse field through wave scatterings and boundary reflections, all pairs are affected by changes in the concrete, not just those pairs whose direct propagation path exactly crosses the area of damage. The benefit of this is that the waves reaching the receiver will have traversed the damaged area multiple times, and this yields high sensitivity. The drawback is that it impedes spatial localization.
However, there is some correlation to the transducer pair configuration relative to the damaged region. The attenuation in the concrete is such that waves that have traveled further will have less energy than those that traveled a more direct path. This means that the part of the wave corresponding to the direct propagation path, or close to this, contains the most energy. It is reasonable to assume that those transducer pairs with the damaged region between them are affected more by the damage than the other pairs.
In order to investigate this, the floor slab was divided into a grid having the same layout as the grid formed by the transducers. Each box in the grid was assigned a value corresponding to the mean of Mahalanobis distance for all transducer pairs whose direct propagation path intersects the box. Figure 4 shows, as an example, lines between the transducers in the pairs which are included in the evaluation of the grid coordinate between transducers 3, 4, 13, and 14. The grid coordinate is highlighted in red. Since all transducers are used reciprocally as transmitters and receivers, each one transducer pair provides two measurements, with reversed transmission. For example, the grid coordinate corresponding to the location of damage includes both measurements from transmissions between transducers 3 and 4 and between transducers 4 and 3.
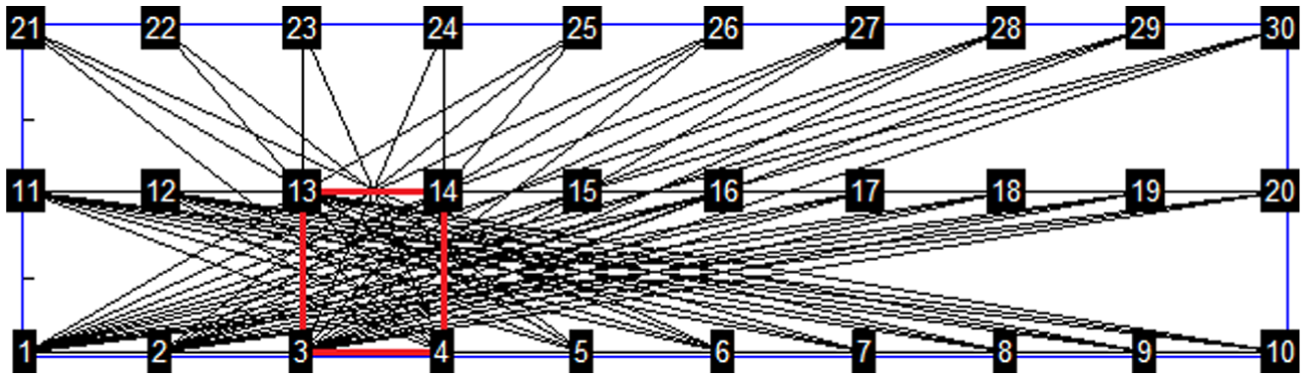
Lines connecting the transducer pairs from which measurements were used to evaluate the grid coordinate corresponding to the location of the damage (between transducers 3, 4, 13, and 14, as outlined in red).
Results and discussions
The lock-in amplifier enabled transmission between even the furthest transducers. The measured signal level between transducers 21 and 10 (distance of ∼8.2 m) was on the order of 50 µVrms. Signals of this level are far below the noise floor, but the impressive capabilities of the lock-in amplifier enabled their detection.
Figure 5 shows the data measured at receivers 4, 14, and 15 while transducer number 3 is acting as transmitter, and the data measured at receivers 18, 19, and 29 when transducer 28 acted as transmitter. The measurements with transducer 3 as transmitter are close to the location of damage and those with transducer 28 as transmitter are further away from the damage. The plots in Figure 5 show the amplitude, phase, and Mahalanobis distance as a function of the measurement cycle number. The mean offsets of the baseline values have been subtracted from the amplitude and phase data. Similar data sets were developed for every transmitter–receiver pair.
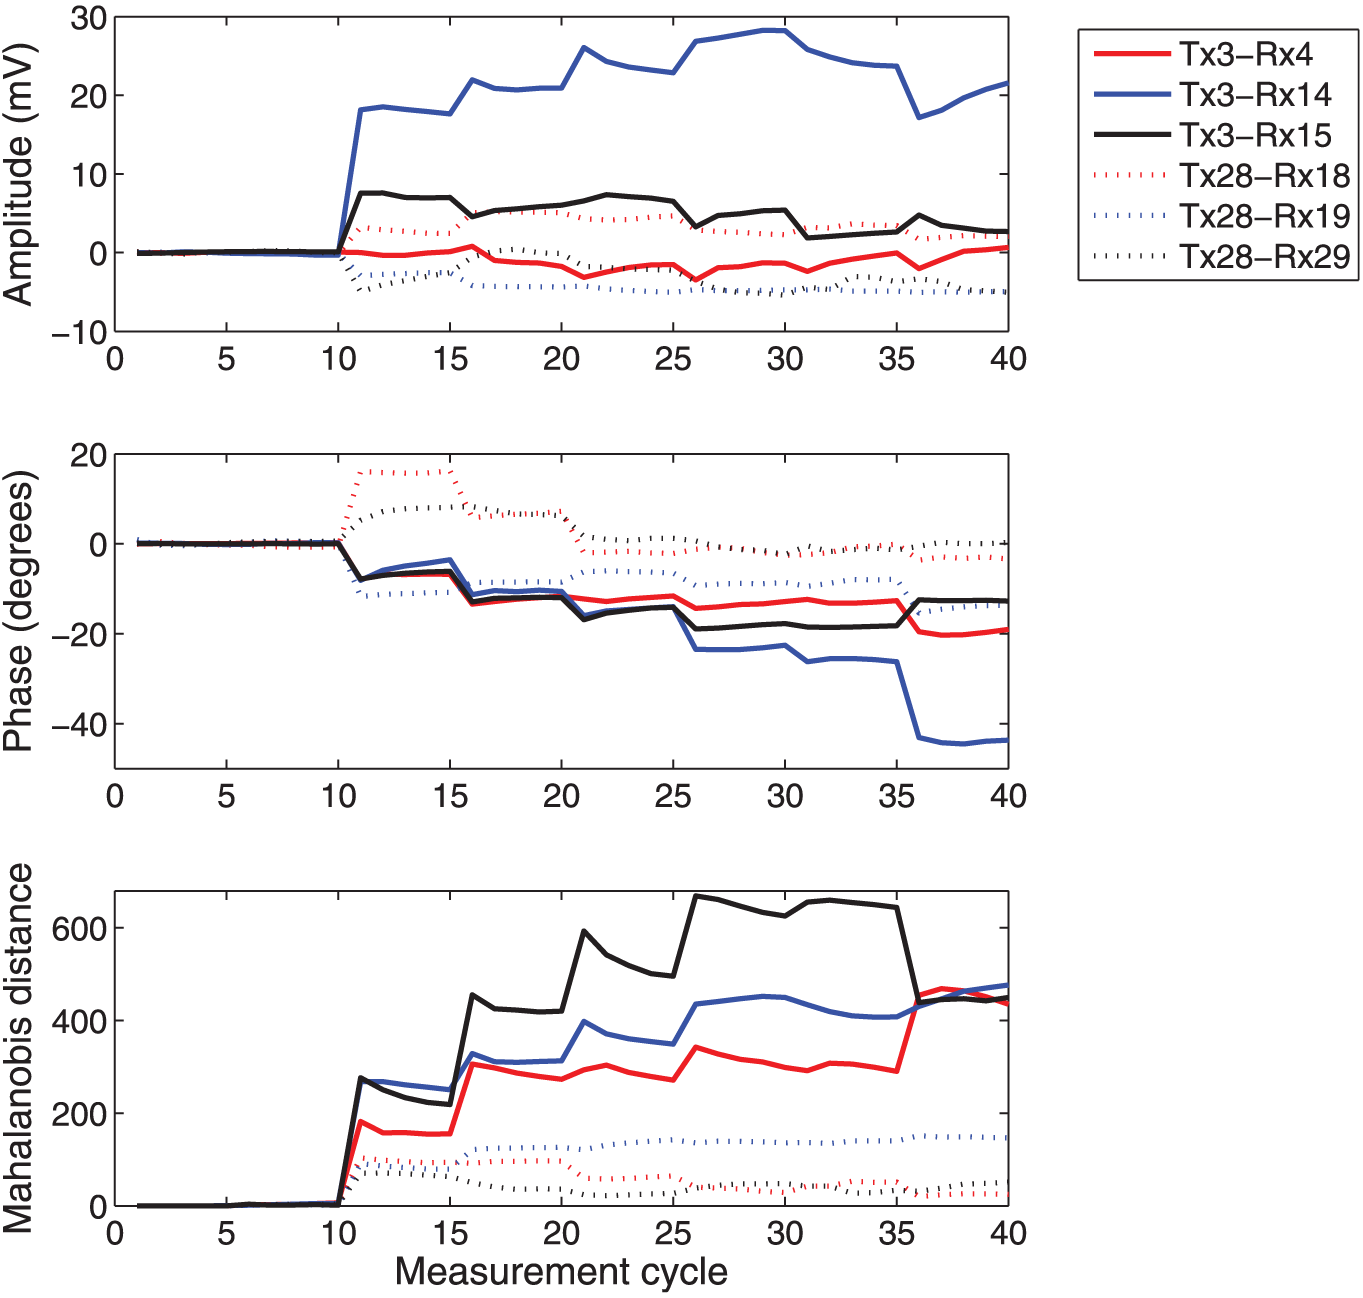
Data measured from transducers 4, 14, and 15 when transducer 3 acted as transmitter (solid lines) and from transducers 18, 19, and 29 when transducer 28 acted as transmitter (dotted lines). The x-axis shows the measurement cycle number. The first five measurements are the baseline when no damage has yet occurred. After the 10th measurement, the damage level is increased with shots made with the bolt gun after every five measurement cycles. The mean offset of the baseline data is removed from the amplitude and phase data sets. Top: amplitude measurements, center: phase measurements, and bottom: Mahalanobis distance.
All diagrams show deviations from the baseline after the 10th measurement cycle when the first shot was fired. Further changes can be seen every five measurements, as more shots are fired at the concrete. As seen from Figure 5, the data measured with the damage between the transducers react, on average, more to the damage than the data from the transducers further from it. Some exceptions occur, as with the amplitude measurements between transducers 3 and 4.
Interestingly, the amplitudes measured by several receivers increase as the concrete is damaged. If there had been no reflections of the ultrasonic waves at the boundaries or scattering from heterogeneities, one would measure a wave traveling only along the direct propagation path. If cracks were to appear in this path, the measured amplitude would decrease due to increased attenuation and scattering. However, since we measure the sum of all possible propagation paths in a continuous wave field, it is not trivial to predict the effects on amplitude and phase. This is less of an issue in SHM than in traditional NDT, since the main goal of SHM is to detect deviations from the baseline. Even more confusing are the data sets in which the amplitude first decreases with damage and then begins to increase with further damage. This could be explained in part by the initial formation of small cracks that mostly attenuate the signals. However, as the level of damage increases, the size of the cracks act more like reflectors and the emerging wave field happens to yield higher energies at the receiving transducer location than it does with the undamaged structure. Further research is needed to better understand such behavior.
Mahalanobis distance takes into account both the amplitude and phase values for each measurement and yields data with better correlation to the damage level than if the components are analyzed separately.
The previously described algorithm was used to investigate the possibility of localizing the damage. The floor slab was divided into a grid, and the mean Mahalanobis distance of all transducer pairs that had a direct connecting line intersecting each individual grid box was calculated in a tomographic style. Figure 6 shows such data from one measurement at each of the different damage levels.
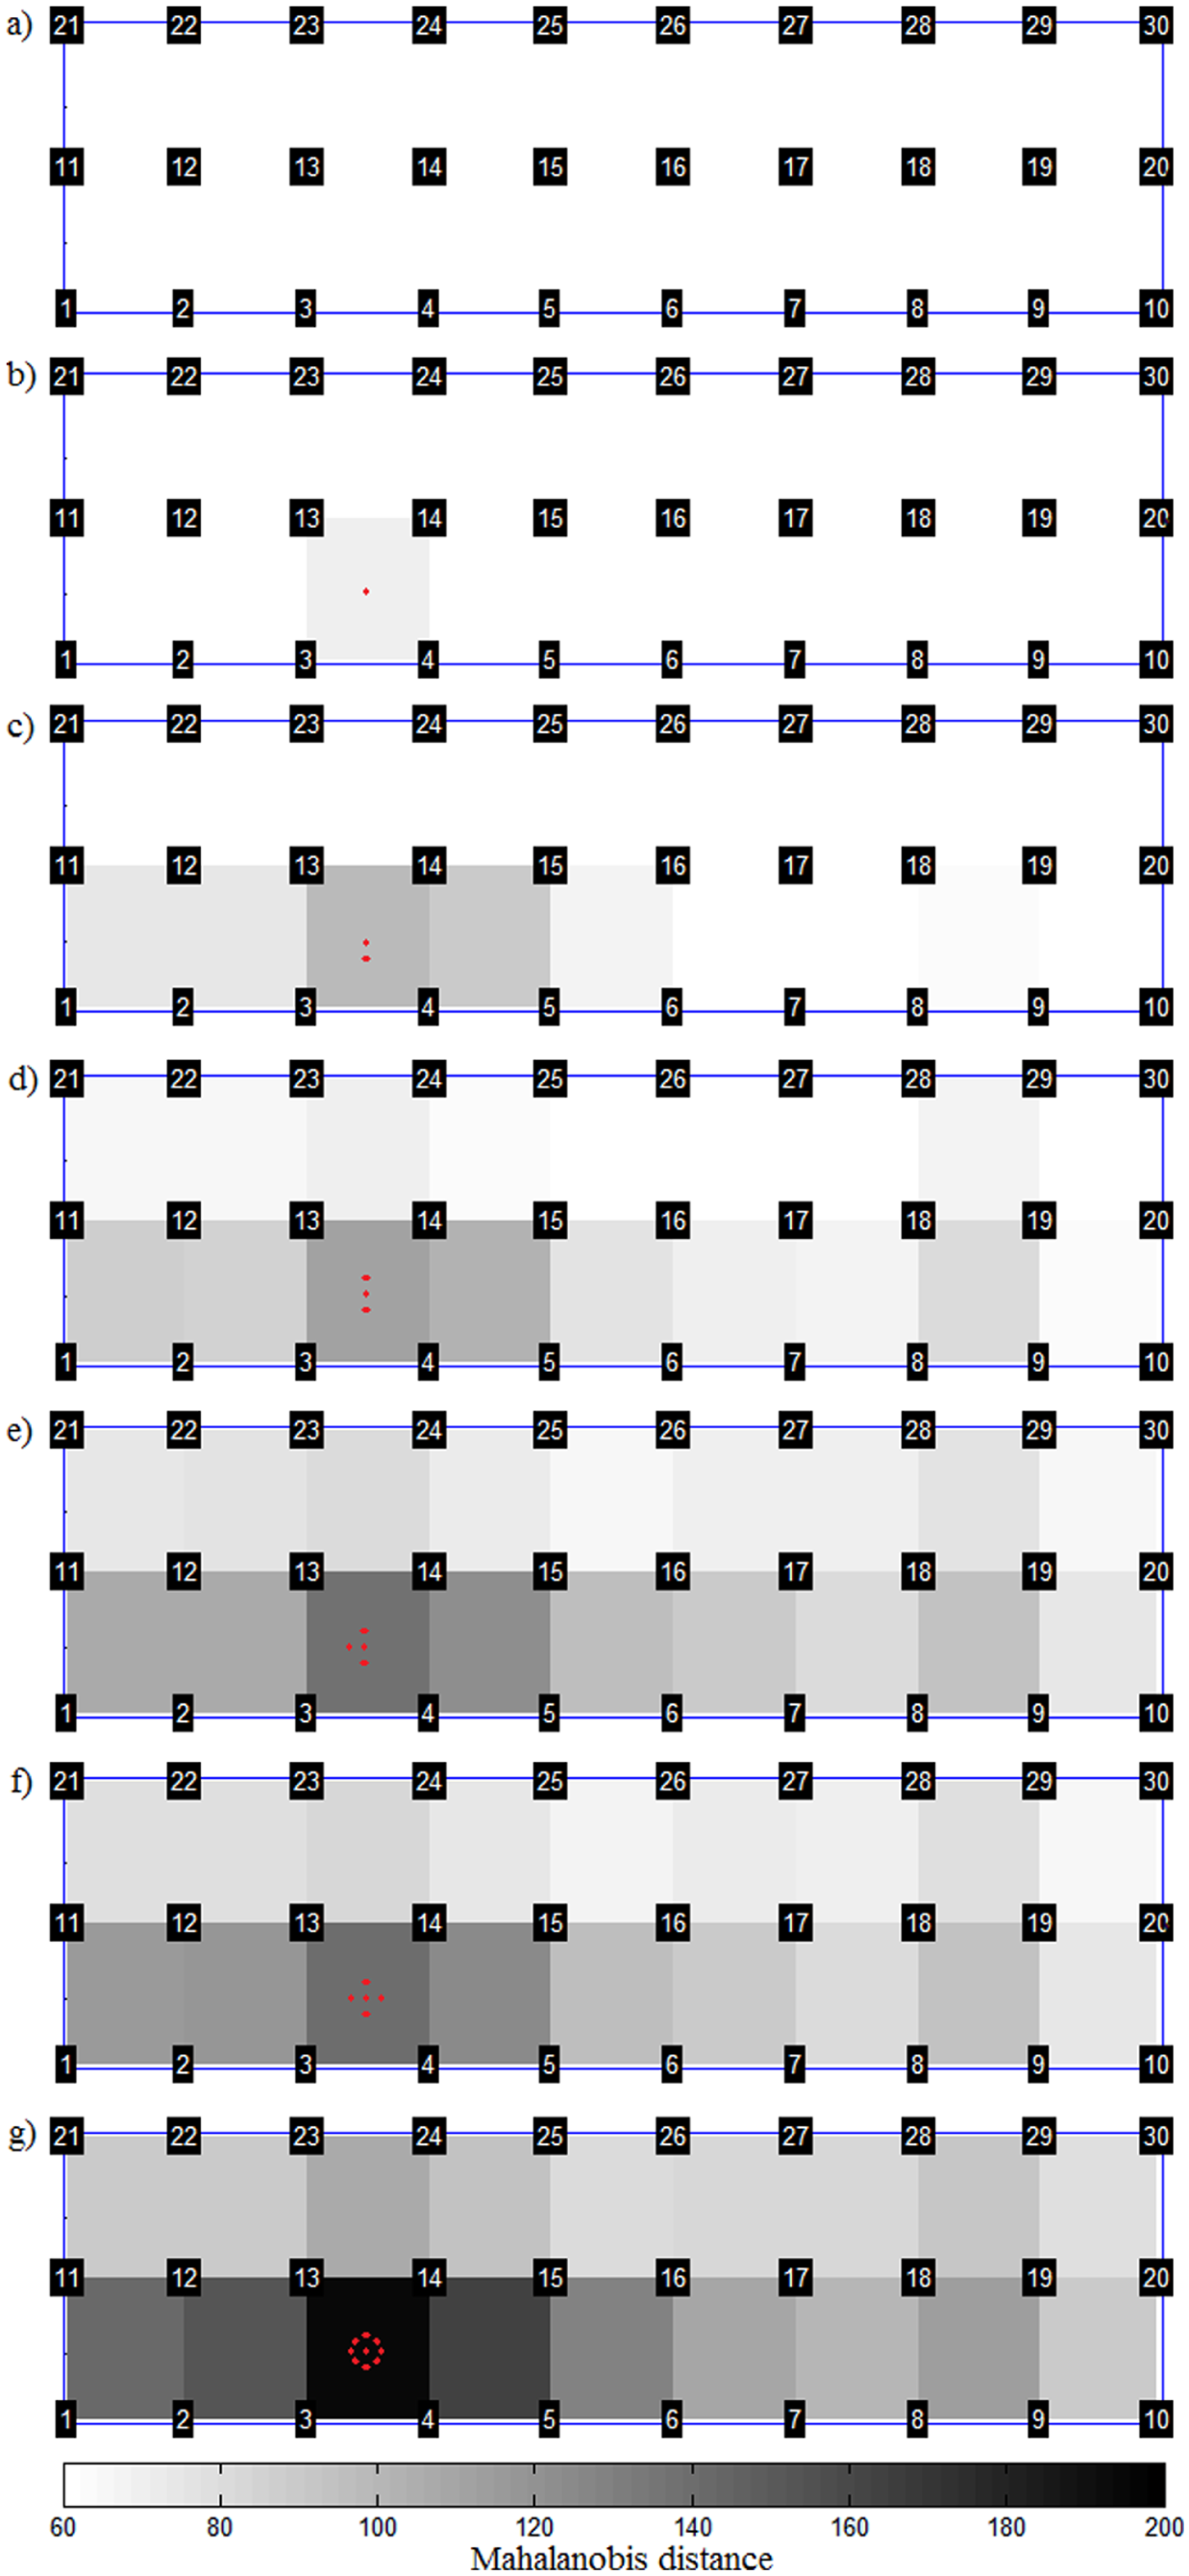
Mahalanobis distance from the baseline data for measurements at different damage levels: (a)–(g) damage levels 0–6. The red dots indicate locations of bolt gun shots.
The imaging method successfully identifies the grid coordinate of the damage as the box with the highest mean Mahalanobis distance from the baseline data. Additionally, it is evident that the deviation from the baseline increases as the damage level increases. This increase is seen over the entire floor slab, and there is a misleading, particularly, high, indication in the grid box 8–9–18–19, but at all damage levels the correct grid box is assigned the highest value.
It should be noted that even the first damage level yields a mean Mahalanobis distance of 72 in the grid box corresponding to the damaged area. This is a substantial deviation, corresponding to 72 standard deviations from the mean of the baseline data set, and the possibility of detecting even slighter damage seems likely.
It is of interest to see if similar localization is possible with a sparser network of transducers. An example is shown in Figure 7(a), where only transducers 4, 8, 11, 20, 22, 26, and 30 are used. It is evident from the figure that it is possible to localize the damage with sparser networks. Further removal of transducers resulted in a gradual loss of ability to locate the damage.
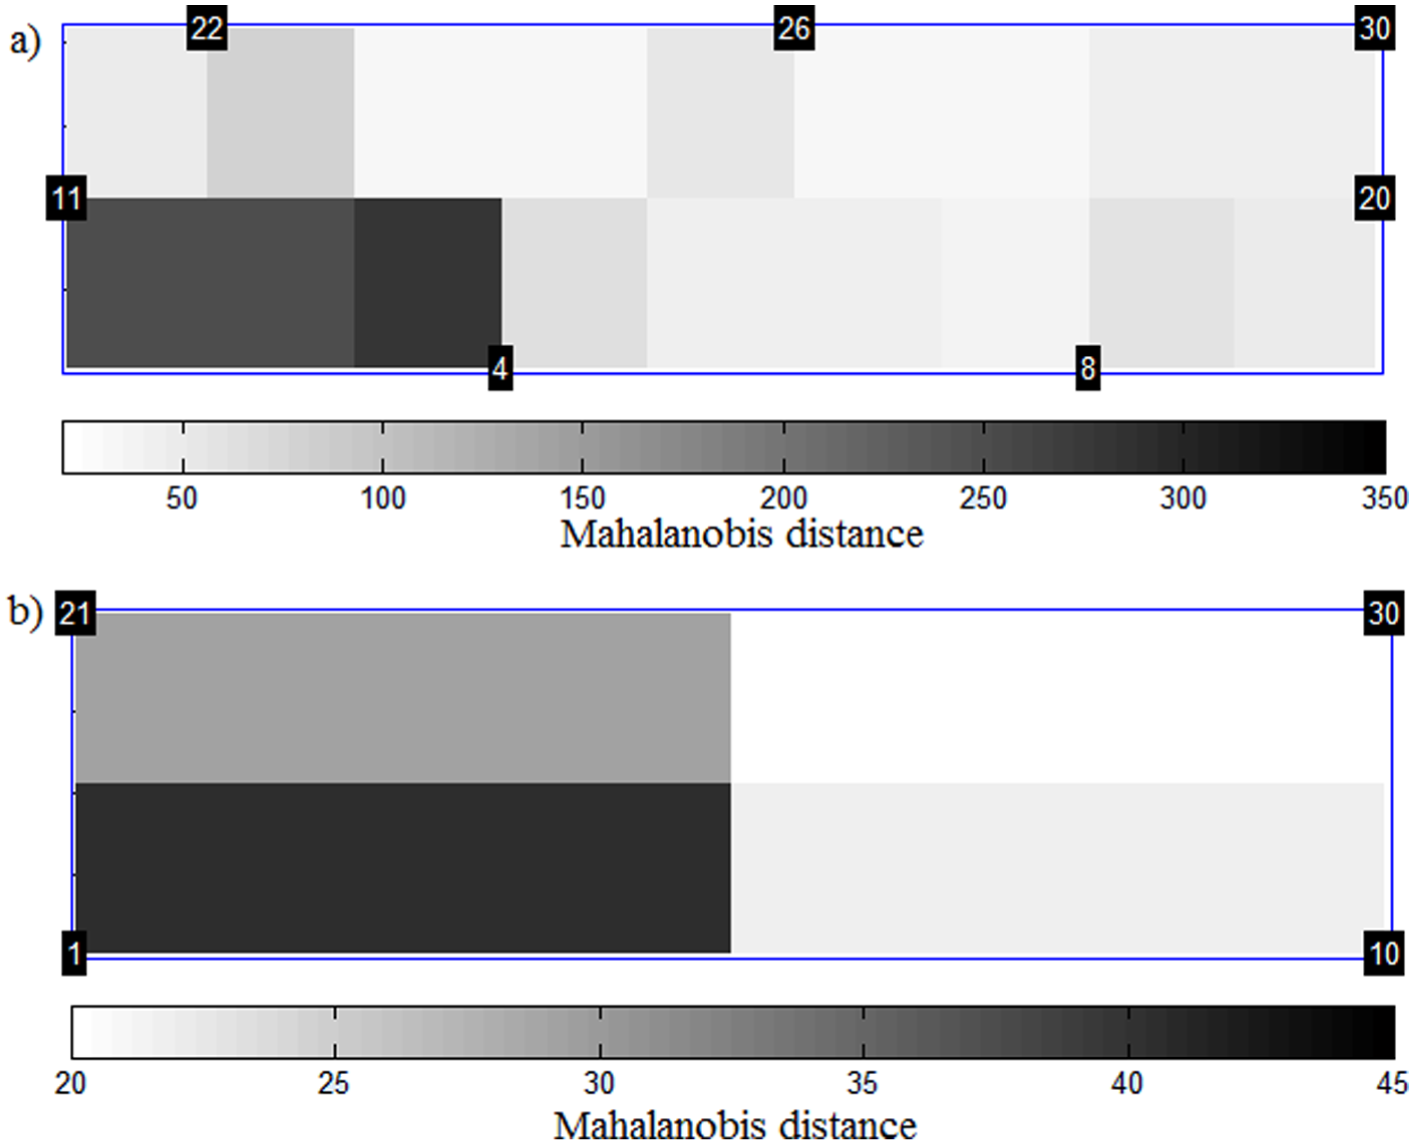
Mahalanobis distance from the baseline data for sparse networks of transducers at damage level 6: (a) transducers 4, 8, 11, 20, 22, 26, and 30 were used and (b) transducers 1, 10, 21, and 30 were used.
Figure 7(b) shows a lower resolution localization using only the data from the four transducers in the corners of the slab. This is encouraging for the scalability of the system; a system similar to that in this study but with several meters between the closest transducers would have great utility. Scaling the experiment is not straightforward, however, as the distance to the reflective boundaries affects the emerging diffuse wave field.
It should be stressed that the shading of the boxes in the grid is based on the means of all values from the transducer pairs with direct propagation paths crossing the box. Looking only at one or a very few pairs can yield false negative indications of damage in the vicinity of the pair or false positive indications at other locations. Further research is needed to fully understand this instability, but averaging over a number of transducer pairs mitigates the effects of such outliers.
Conclusion
It has been shown that amplitude and phase measurements of single-frequency steady-state wave fields can successfully be used to detect small superficial damage in a concrete slab. Mahalanobis distance from baseline measurements was used as an indicator of damage. This distance increased as further damage was introduced to the floor slab.
Using a lock-in amplifier, useful signals were detectable even between transducer pairs placed 8.2 m apart. This was achieved with an excitation signal amplitude of 60 Vpp, which is relatively low compared to many other presented guided-wave SHM applications. An even greater range is expected if the excitation signal is increased further, although care must be taken when using continuous transmissions to avoid accidentally measuring the electrical coupling in the measurement system. The proposed measurement technique, thus, has the potential for monitoring even larger structures.
Using a 50-kHz transmission frequency, it was possible to locate the damaged region within an area slightly less than 1 m2 through averaging of all transducer pair combinations.
Fluctuations are a source of error in the measurements. It is speculated that these fluctuations are caused by temperature variations leading to slight shifts in the transfer functions between each transducer pair, resulting in fluctuations in the efficiency of the chosen transmission frequency. A possible method to avoid this sensitivity is to step through a number of frequencies.
Further research is needed to be able to predict the effect of different changes in the material on the amplitude and phase of the transmitted signal between two transducers. However, by averaging the result over a number of transducer pairs and calculating Mahalanobis distance from the baseline, it is possible to detect and locate damage and to differentiate between damage levels of varying severity.
Footnotes
Acknowledgements
The authors would like to give special thanks to the manufacturers of the concrete floor module. The concrete slab was constructed by Hedareds Sand & Betong AB, and the glulam beams were created by Moelven Töreboda AB.
Declaration of Conflicting Interests
The author(s) declared no potential conflicts of interest with respect to the research, authorship, and/or publication of this article.
Funding
The author(s) disclosed receipt of the following financial support for the research, authorship, and/or publication of this article: This work was supported by the Swedish Research Council Formas (grant no. 244-2012-1001).