
Abstract
Learning to interpret visual representations of data is an important step towards becoming an informed consumer of research. The current study assesses the effectiveness of two versions of a scaffolded online module in improving students’ ability to identify main effects and interactions in 2 × 2 factorial designs. Across two experiments (N = 313), we compared exam performance between sections of a lower-division conceptual statistics course that completed the module (in addition to other course activities) to a section that did not complete the module (n = 91). The first iteration of the module (used in Experiment 1, n = 96) was completed once individually and once with peers and did not enhance students’ individual performance on conceptually-related exam questions. However, performance on the module was low, indicating that students may have needed more support to benefit from this experience. In Experiment 2 (n = 126), we made three empirically-driven changes to better scaffold student learning: we added a worked example, offered a greater variety of examples, and instructed students to complete the whole activity with peers. Under these conditions, performance increased on related exam questions. We conclude that this freely available module is a promising intervention to strengthen students’ ability to understand factorial designs.
The ability to interpret data, statistics, and graphical information is a key learning objective of most undergraduate psychology programs (American Psychological Association, 2013, 2023). This skill extends beyond the classroom and is essential to becoming a confident and informed consumer of real-world research. Many psychology courses support students in developing this core competency by providing direct instruction and by exposing students to examples of data visualizations (e.g., see Chew, 2007; Hartnett, 2020). Despite this exposure, many students still have difficulty interpreting visual representations of data. In the current study, we designed an online scaffolded module aimed at improving this skill. In a series of two experiments, we assessed performance on different iterations of the module and examined whether completing the module improves students’ performance on related exam questions.
Interpreting visual representations of data is an important skill for students to master in order to understand content they encounter in the news and media (e.g., infographics about changes in economic inflation or the effectiveness of different legislation on health outcomes). However, interpreting graphs can be challenging. For example, novice learners may have difficulty digesting the amount of information presented in graphs and can be distracted or even misled by visual features such as the use of an inappropriate scale or colors (see Glazer, 2011 for a discussion).
Most research methods courses in psychology include direct instruction on interpreting visual representations of data from factorial designs that incorporate multiple independent variables. For instance, students might be asked to imagine whether someone's choice of food temperature (hot or cold) depends on the type of food they are eating (pancakes or ice cream; see Morling, 2021 for this and additional examples). Here, a student is likely to note that overall deliciousness would not just depend on food temperature, but that these two variables interact such that pancakes are preferred hot and ice cream is preferred cold. When presented with such results from a study with a factorial design, students must learn to identify main effects (e.g., by estimating the overall deliciousness of pancakes vs. ice cream) and interactions (e.g., by estimating the difference in differences or by viewing –or constructing– a line graph of the data and determining whether the lines are parallel, indicating no interaction). The Factorial Designs modules used in the present research focus on practicing the vocabulary and developing the visual reasoning skills to identify effects in 2 × 2 factorial designs.
Despite explicit instruction, identifying the main effects and interactions between independent variables in 2 × 2 factorial designs remains challenging for many students. There are a number of possible reasons for this difficulty. First, the type of graph used to present the factorial results (e.g., line graph or bar graph) can lead students to focus on particular features of those graphs; for example, in interpreting line graphs, novice learners tend to focus on the variable on the x-axis and ignore the second variable (Ali & Peebles, 2013). To successfully interpret factorial designs, students must flexibly extract multiple pieces of information from the same graph. Secondly, interpreting interactions requires students to have already developed a solid understanding of other bottleneck concepts such as identifying independent and dependent variables (Gurung & Landrum, 2013). Success may be limited by their previous (mis)understanding of research designs and other difficult-to-grasp concepts. Finally, for some students, graphs may trigger math or statistics anxiety (Ashcraft, 2002; Chew & Dillon, 2014; Macher et al., 2013). Although statistics anxiety seems to be broadly prevalent in undergraduate students (Ruggeri et al., 2008), it may disproportionately impact female (Koch, 2018) and first-generation students (Cataldi et al., 2018). While the mathematical computations required to determine main effects and interactions are relatively simple (e.g., compute a mean), students’ lack of familiarity with new vocabulary and the inherent complexity of drawing three different conclusions from a single table or graph may exacerbate students’ insecurities about their mathematical competence.
Given the difficulties discussed above, a more scaffolded approach to instruction may be needed to enhance students’ ability to understand factorial designs. Scaffolding provides support that is tailored to the learner's skill level, such that the amount of support provided decreases as the learner's mastery of the content increases (Pea, 2004; Vygotsky, 1978). Worked examples are an effective form of scaffolding problem-solving as they offer students an exemplar of an applicable strategy and reduce the need for trial-and-error (Atkinson et al., 2000; Ayres & Paas, 2012). Such scaffolding may support students in flexibly interpreting information from different types of graphs, increase familiarity with bottleneck concepts, and decrease potential math anxiety.
Peer support can also be particularly effective in scaffolding student learning and is scalable for use in large classes (see Doo et al., 2020 for a review). Ideally, tasks that foster effective peer collaboration should be structured and difficult enough that individuals are not able to easily accomplish them individually (Crouch & Mazur, 2001). Opportunities to work in groups can be beneficial to both students who are struggling with concepts as well as students who have already mastered the concepts (Gilley & Clarkston, 2014). For those who are less knowledgeable, more knowledgeable peers can help to clarify key misunderstandings and bolster their conceptual understanding (Nokes-Malach et al., 2019; Smith et al., 2009). For students who have already achieved mastery, the opportunity to teach peers may enhance their learning and memory for information (Fiorella & Mayer, 2013).
In the current study, students in a conceptual statistics class completed a scaffolded factorial designs module with peers. In a series of two experiments, we examined the effectiveness of two iterations of this module (available at https://testyourself.psych.ucla.edu/interpreting-statistical-interactions/) in facilitating students’ ability to identify main effects and interactions on related exam questions. Our data suggest that completing this module with peers may be a promising way to enhance students’ understanding of factorial designs.
Experiment 1
This study recruited students enrolled in two sections of a lower-division conceptual statistics course. One section completed a module where they identified effects and interpreted interactions from a series of bar and line graphs (Intervention section). The other section was not exposed to the module (Control Section). To test our prediction that this scaffolded, low-stakes practice and feedback would enhance mastery, we compared later performance on conceptually related exam questions.
Method
Participants
Participants were 193 undergraduate students enrolled in two sections of a conceptual statistics course offered in consecutive academic terms at a large public university in the United States of America. Overall, 67.36% identified as women and 32.12% identified as men. Most of the students started their university education at this institution (73.58%) with 15.54% having transferred in from a community college. Over 40% of students indicated that they were among the first generation of their family to attend university (i.e., neither of their parents had earned a college degree) and nearly one quarter (23.83%) identified themselves as belonging to historically underrepresented ethnic minority (URM) groups 1 . There were no significant differences between the Intervention and Control sections in terms of student demographics (all χ2 < 5.17, all ps > .075; see Table 1).
Participant Demographics by Section Experiment 1.
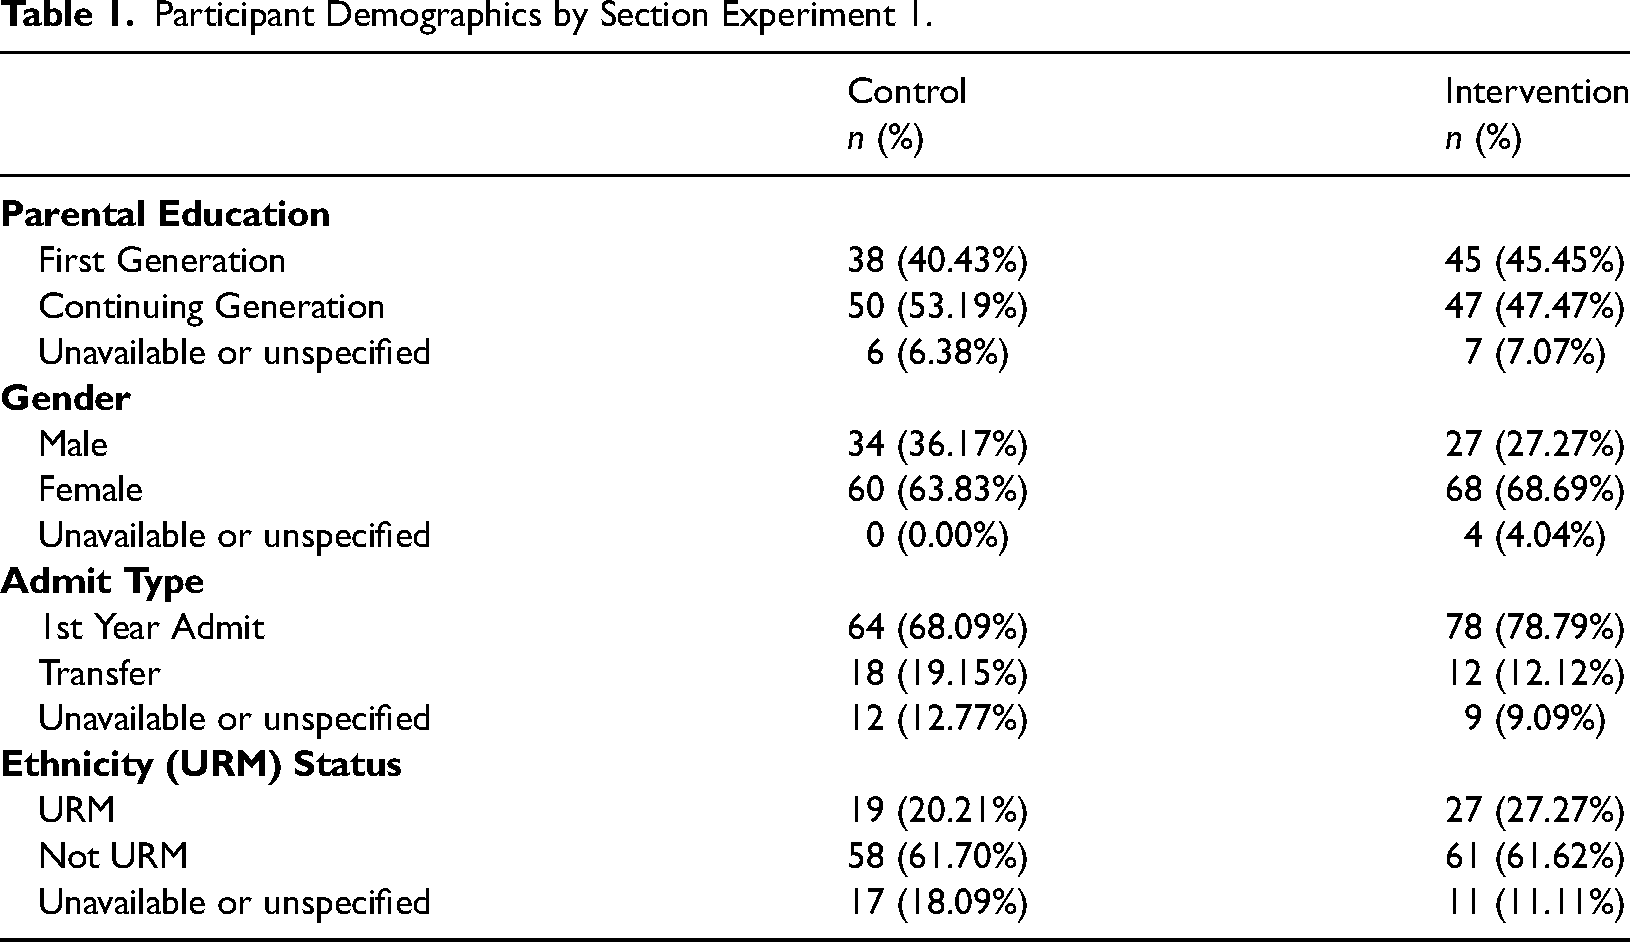
Data from six participants were excluded from the analysis because they did not complete both exams, resulting in a final sample of n = 91 in the Control section and n = 96 in the Intervention section.
Design
The study took place across two sections of the same course. One section of the course was assigned to be the Control section; the other was assigned to be the Intervention section. Students self-enrolled in the sections and therefore were not randomly assigned to the Intervention and Control conditions.
All students in the Intervention section completed the module twice, once alone and once in collaboration with peers. Order of social context was counterbalanced such that half of the TA-led discussion sections (and therefore approximately half of the students) were assigned to work alone on the first attempt and the other half were assigned to work collaboratively on the first attempt.
Course Context
The two sections of the course were highly similar and were offered in consecutive academic terms. Both were taught online by the same instructor and graduate student teaching assistants (TAs) and contained similar activities and content. Students met synchronously each week via video conferencing in small groups of up to 25 students and a TA.
This course did not require any prerequisite statistical knowledge. All students were given direct instruction about how to numerically and visually identify main effects and interactions. These concepts were reviewed during TA-led discussion sessions and in two additional video tutorials. Students also independently completed two self-graded worksheets on these topics.
Materials
Factorial Designs Module
A web-based platform (Qualtrics: https://www.qualtrics.com/) was used to create an interactive module with four examples. The first two examples were Identifying Effects questions (see Figure 1). In these questions, students were shown a bar graph and asked to identify whether there were main effects of each variable and whether there was an interaction by selecting all the statements that applied. To reduce the computational burden of completing the module and to keep the focus on practicing vocabulary and high-level inferences, we indicated that a difference of any size was likely to be significant. The remaining two examples were Interpreting Interaction questions (see Figure 2). These questions displayed line graphs with multiple-choice question. These questions moved students beyond just identifying an interaction and asked them to choose the appropriate interpretation of an interaction (e.g., “There is a big difference on bacterial growth between Sugar and Sugar Substitute for 5 g of water, but not 10 g of water”). The module concluded with two open-ended questions about the learning experience (“Was there anything you/your group found confusing?” and “Is there anything else you would like to share about your experience completing this practice set?”) and then displayed a feedback page with corrective feedback for each of the four examples.
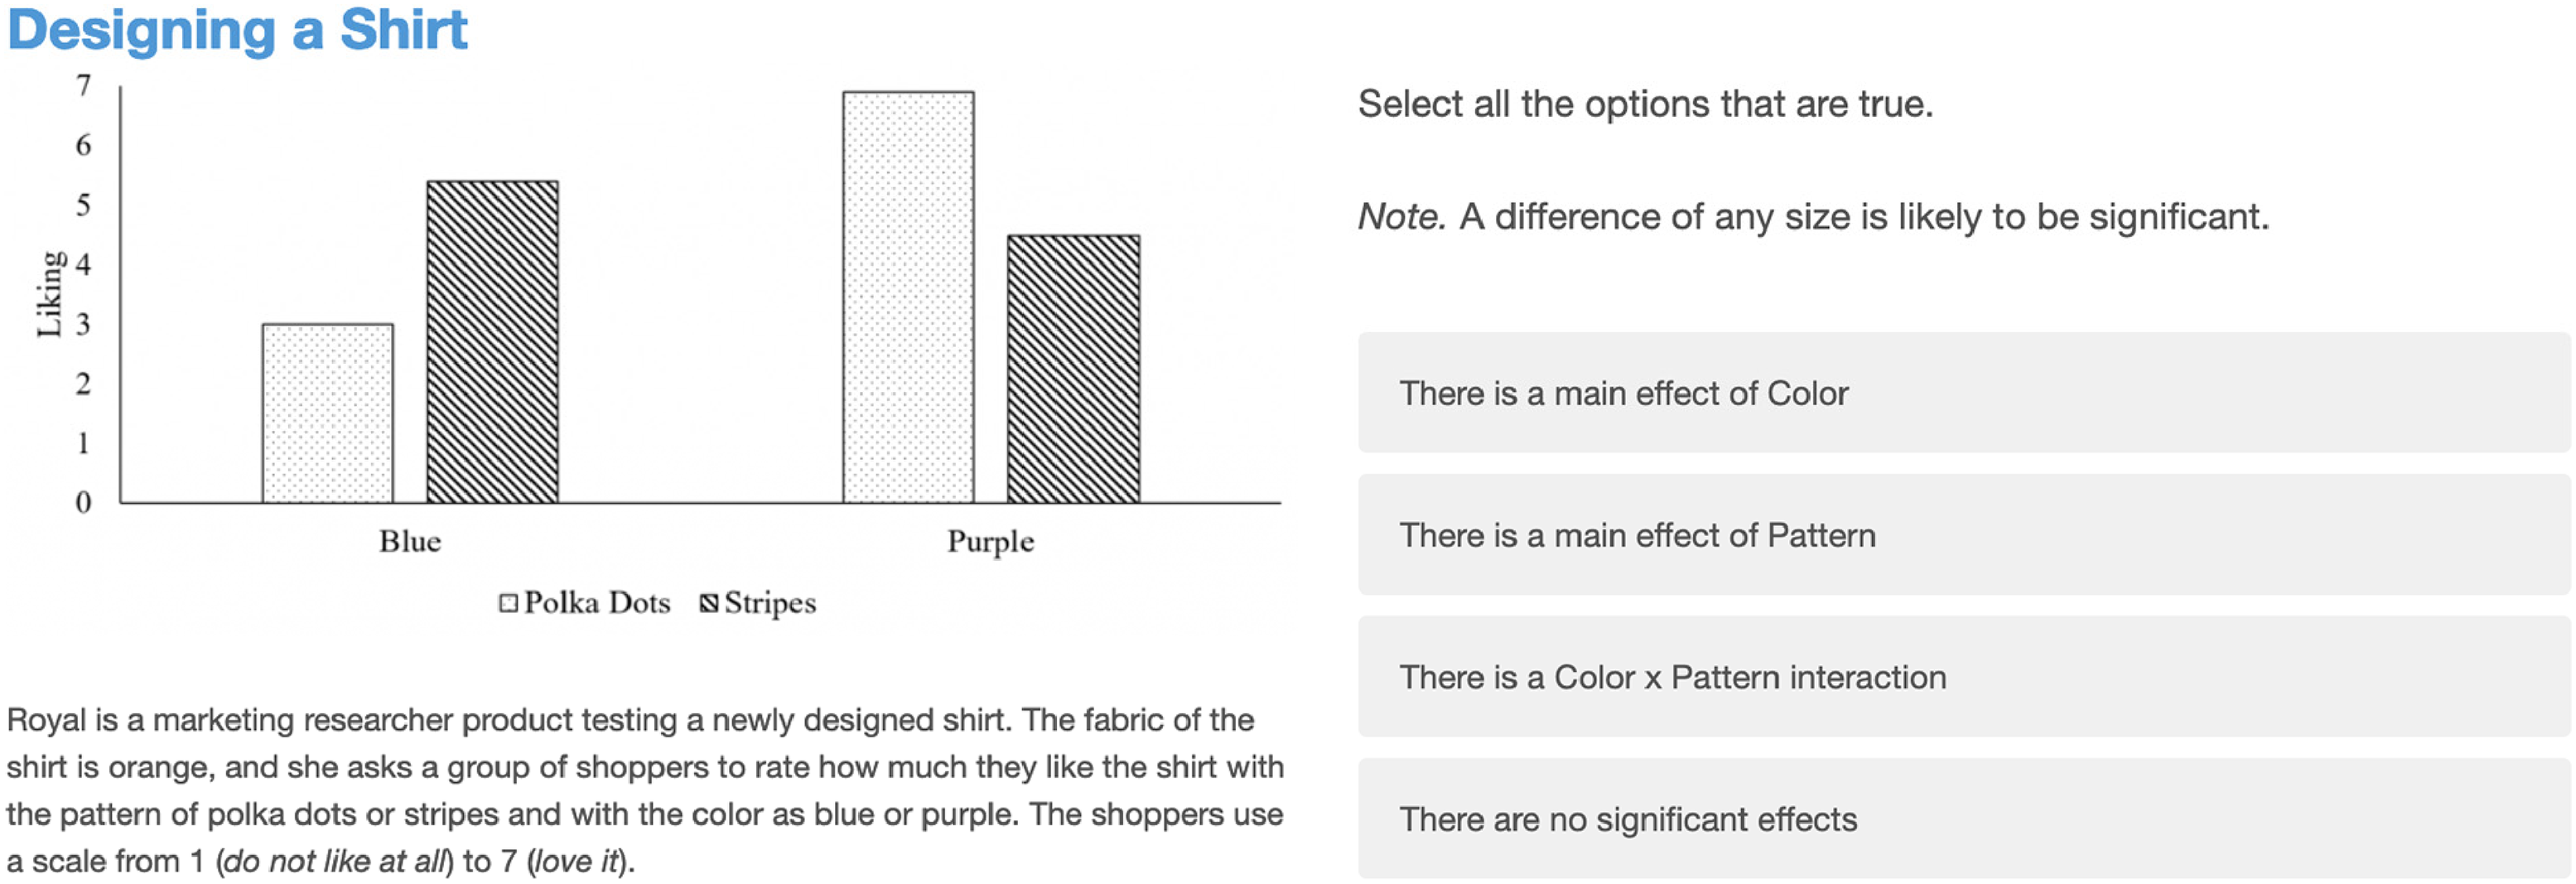
Example of an identifying effects question from the Experiment 1 factorial designs module.
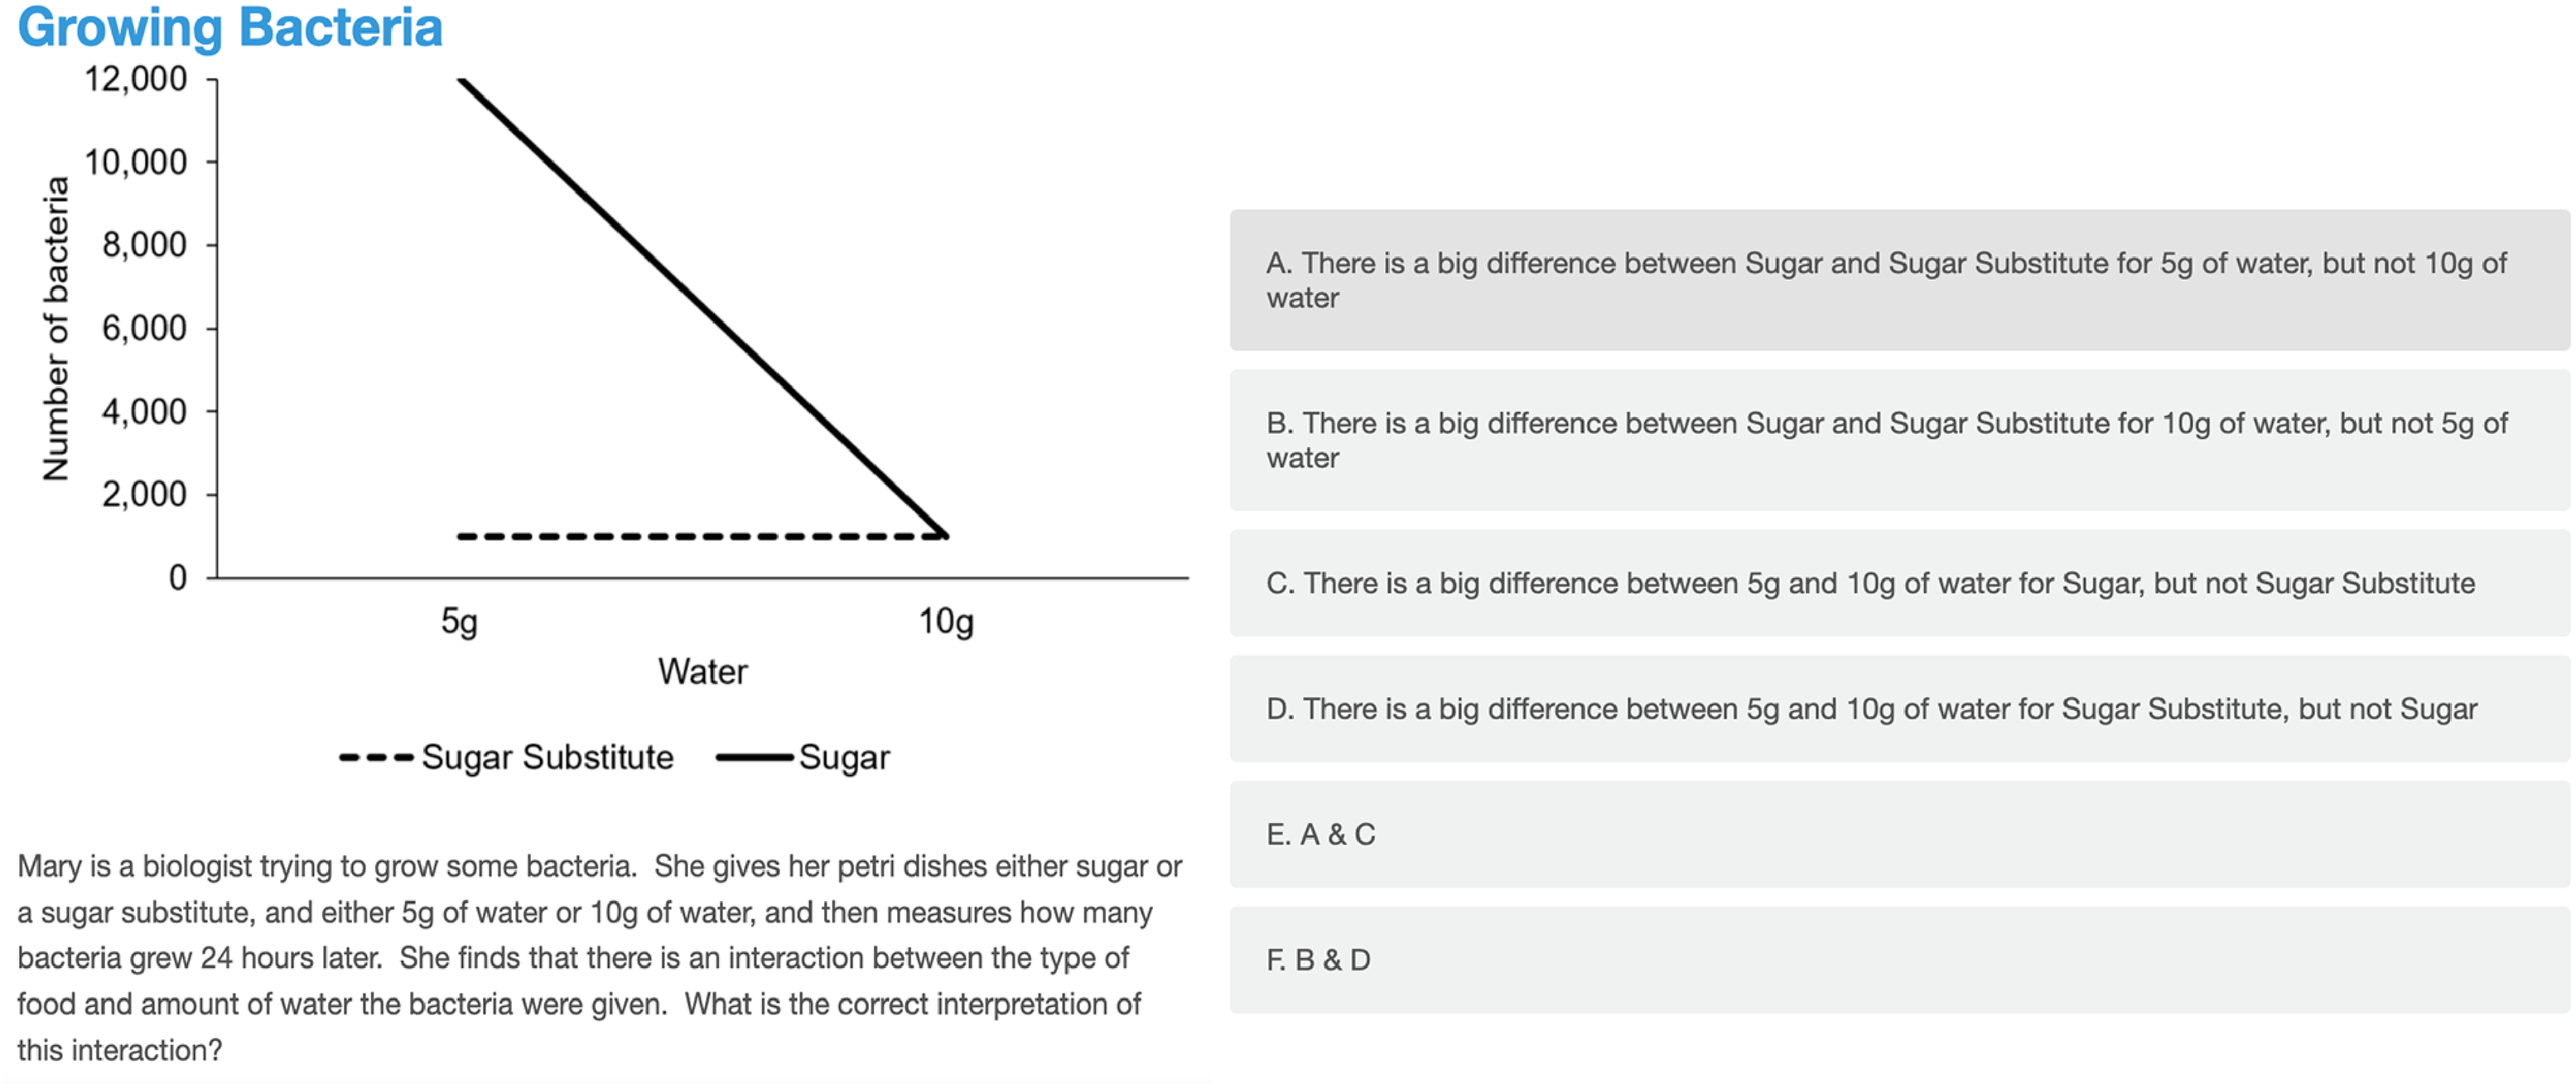
Example of an interpreting interactions question from the Experiment 1 factorial designs module.
Procedure
Students enrolled in the Intervention section (n = 96) were given two opportunities to complete the Factorial Designs module synchronously during TA-led small group video conferences (in two consecutive weeks). In each of those weeks, students were given 15 minutes to complete the activity. Attendance was high, with 91.67% of students attending both sessions. Students enrolled in the Control section (n = 91) spent that time continuing live discussion with the TA and their peers.
For the students in the Intervention section, one week they completed the activity with peers and the other week they completed the activity alone. When working collaboratively, students worked in groups of 3–4 peers in a video conferencing breakout room. One student in each group was assigned to open the module and share their screen. Groups submitted a single set of responses. When working individually, each student navigated the module on their own computer and submitted their own responses.
Outcome Measures
Exam Performance
Concept mastery was assessed using three written questions on an exam administered within two days of the second time students completed the module. Two of the exam questions asked students to identify effects shown in a graph. The other question asked students to interpret the nature of a significant interaction shown in a graph (see Appendix). Performance was independently scored by MP-S, MI, and CC. A subset of the Identifying Effects items (13.3%) from Experiments 1 and 2 were double coded and interrater reliability was high (Cronbach's alpha = .89). After resolving disagreements on double-coded items, one coder independently scored the remaining items. Since there was only one Interpreting Interactions question, this item was coded by two coders (Cronbach's alpha = .86) and the average of the coders’ scores was used in analyses.
Module Performance
Performance on the two types of questions (Identifying Effects and Interpreting Interactions) was computed separately. The two Identifying Effects examples were scored as a series of True/False questions with participants scoring a point for each statement correctly evaluated. The two Interpreting Interactions examples had a single correct answer that was scored as correct or incorrect. Incomplete attempts and attempts completed outside of scheduled class time were excluded.
Results
Exam Performance
A multivariate ANCOVA 2 was conducted to compare performance on two types of relevant exam questions (Identifying Effects and Interpreting Interactions) between the Intervention section (that completed the module) and the Control section (that did not). Scores on the midterm exam (administered four weeks before the activity) were included in the model to control for baseline differences in student performance across the two sections. As expected, students’ performance on the midterm exam significantly predicted their performance on the three relevant exam questions, F (2,183) = 20.88, p < .001, Wilk's Λ = .81, ηp2 = .19. In contrast to our hypothesis that engaging in the module would support students’ ability to identify and interpret factorial designs, there were no differences in exam performance between students in the Intervention and Control sections, F (2,183) = 0.88, p = .417, Wilk's Λ = .99, ηp2 = .01, (see Figure 3). Students in both sections performed similarly on the exam problems that directly tested identifying effects, F(1,184) = 1.69, p = .196, ηp2 = .01 and those that tested their interpretation of interactions, F(1,184) = 0.00, p = .948, ηp2 < .001.
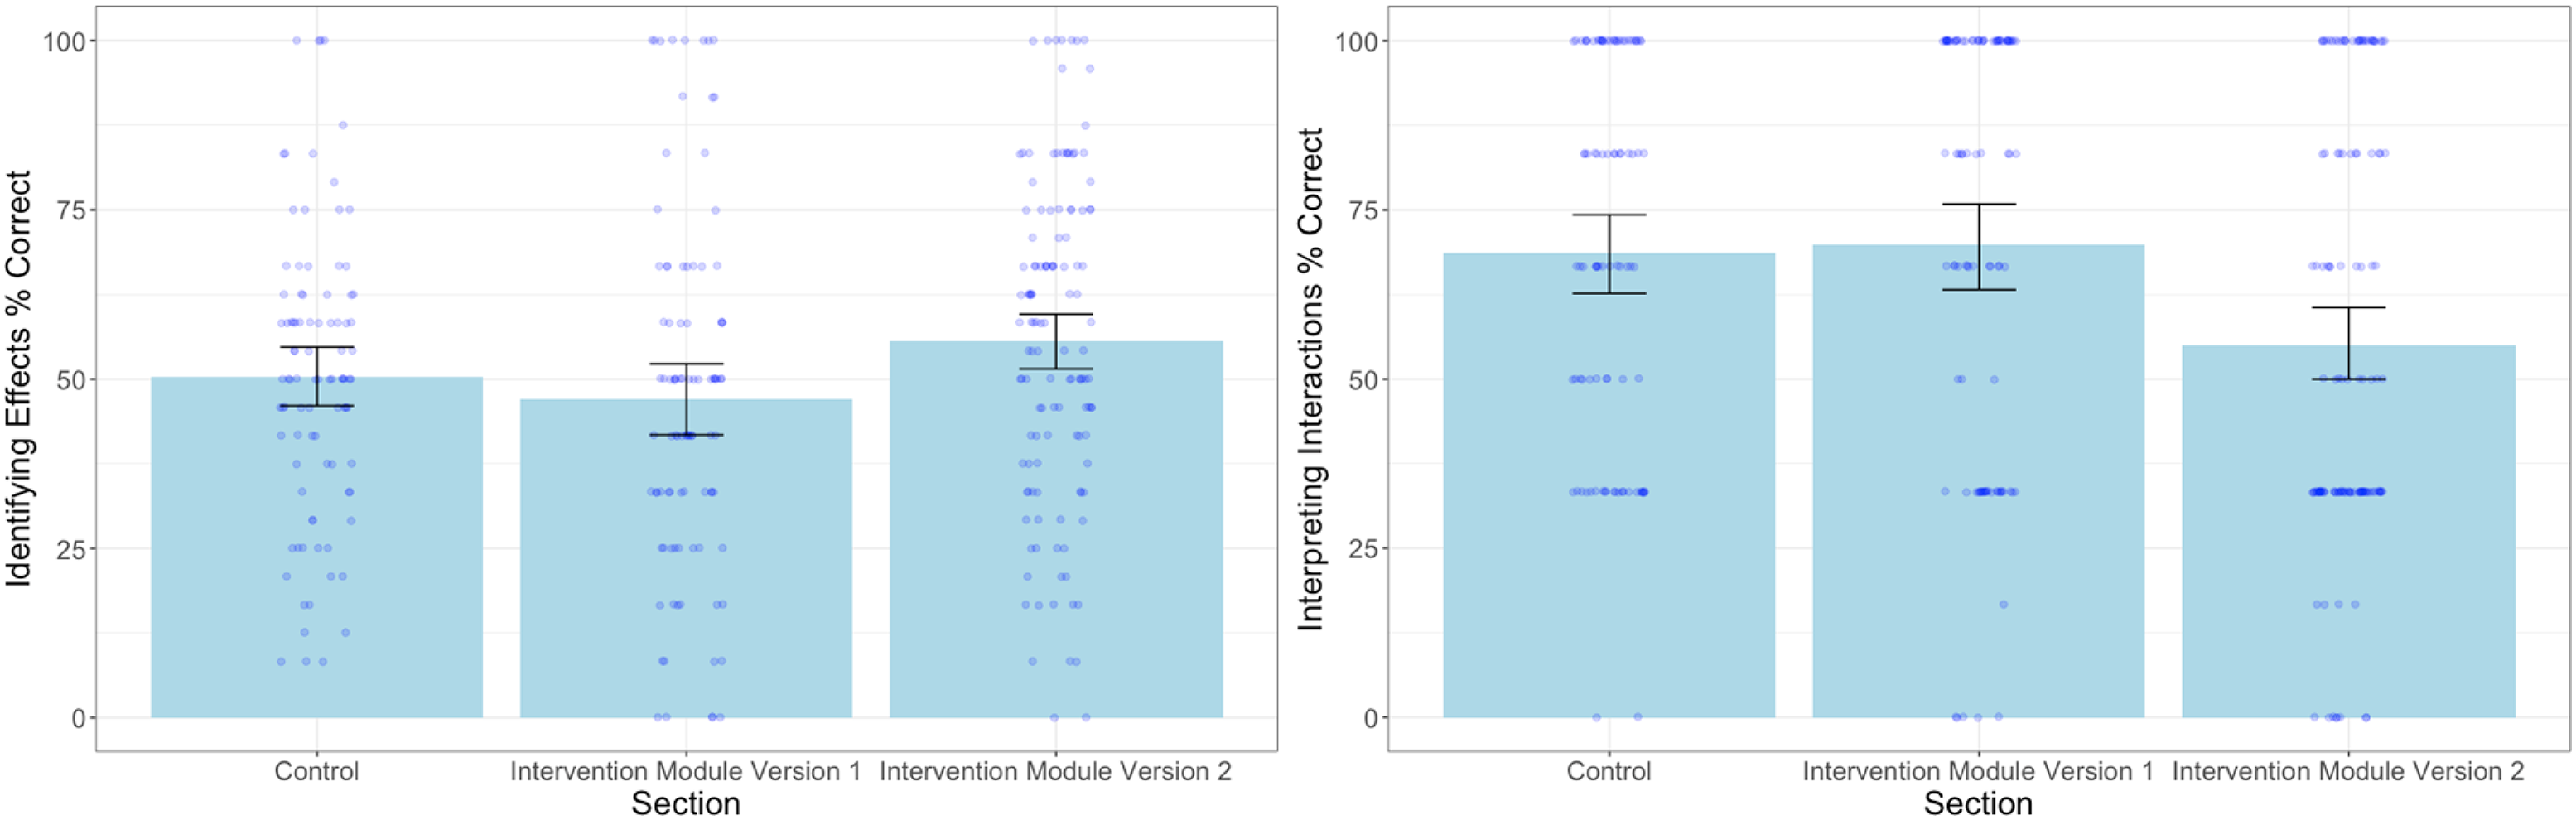
Exam performance for control, experiment 1 intervention, and experiment 2 intervention sections. Note: Error bars represent 95% confidence intervals.
Module Performance
Overall, we were surprised to find that completing the Factorial Designs module did not bolster students’ performance on the closely related exam questions. To better understand this finding, we examined performance on the module over time (first attempt and second attempt) and social context (group and individual). As the module included two types of questions that targeted different information and were asked in different formats, we examined performance on the Identifying Effects questions separately from the Interpreting Interactions questions. 3
Identifying Effects
Although, scores on the questions that asked students to identify all significant effects increased slightly over time from the first attempt (M = 61.67%, SD = 16.24) to the second attempt (M = 68.21%, SD = 25.55), this difference was not statistically significant, 4 t (90.66) = 1.57, p = .120, d = 0.30. Additionally, social context did not affect performance on these questions on either attempt. Students who worked in groups on their first attempt, (M = 61.54%, SD = 18.49, n = 13 groups) did not score higher on the Identifying Effects questions than those who worked individually (M = 61.71%, SD = 15.65, n = 37 individuals), t (48) = 0.03, p = .974, d = 0.01. On the second attempt, we also did not find evidence that students working in groups (M = 68.06%, SD = 26.07, n = 12 groups) performed better than students working alone (M = 68.25%, SD = 25.72, n = 42 individuals), t (52) = 0.02, p = .981, d = 0.01 (see Figure 4). These questions were challenging the first time students attempted them and remained so the second time, regardless of social context.
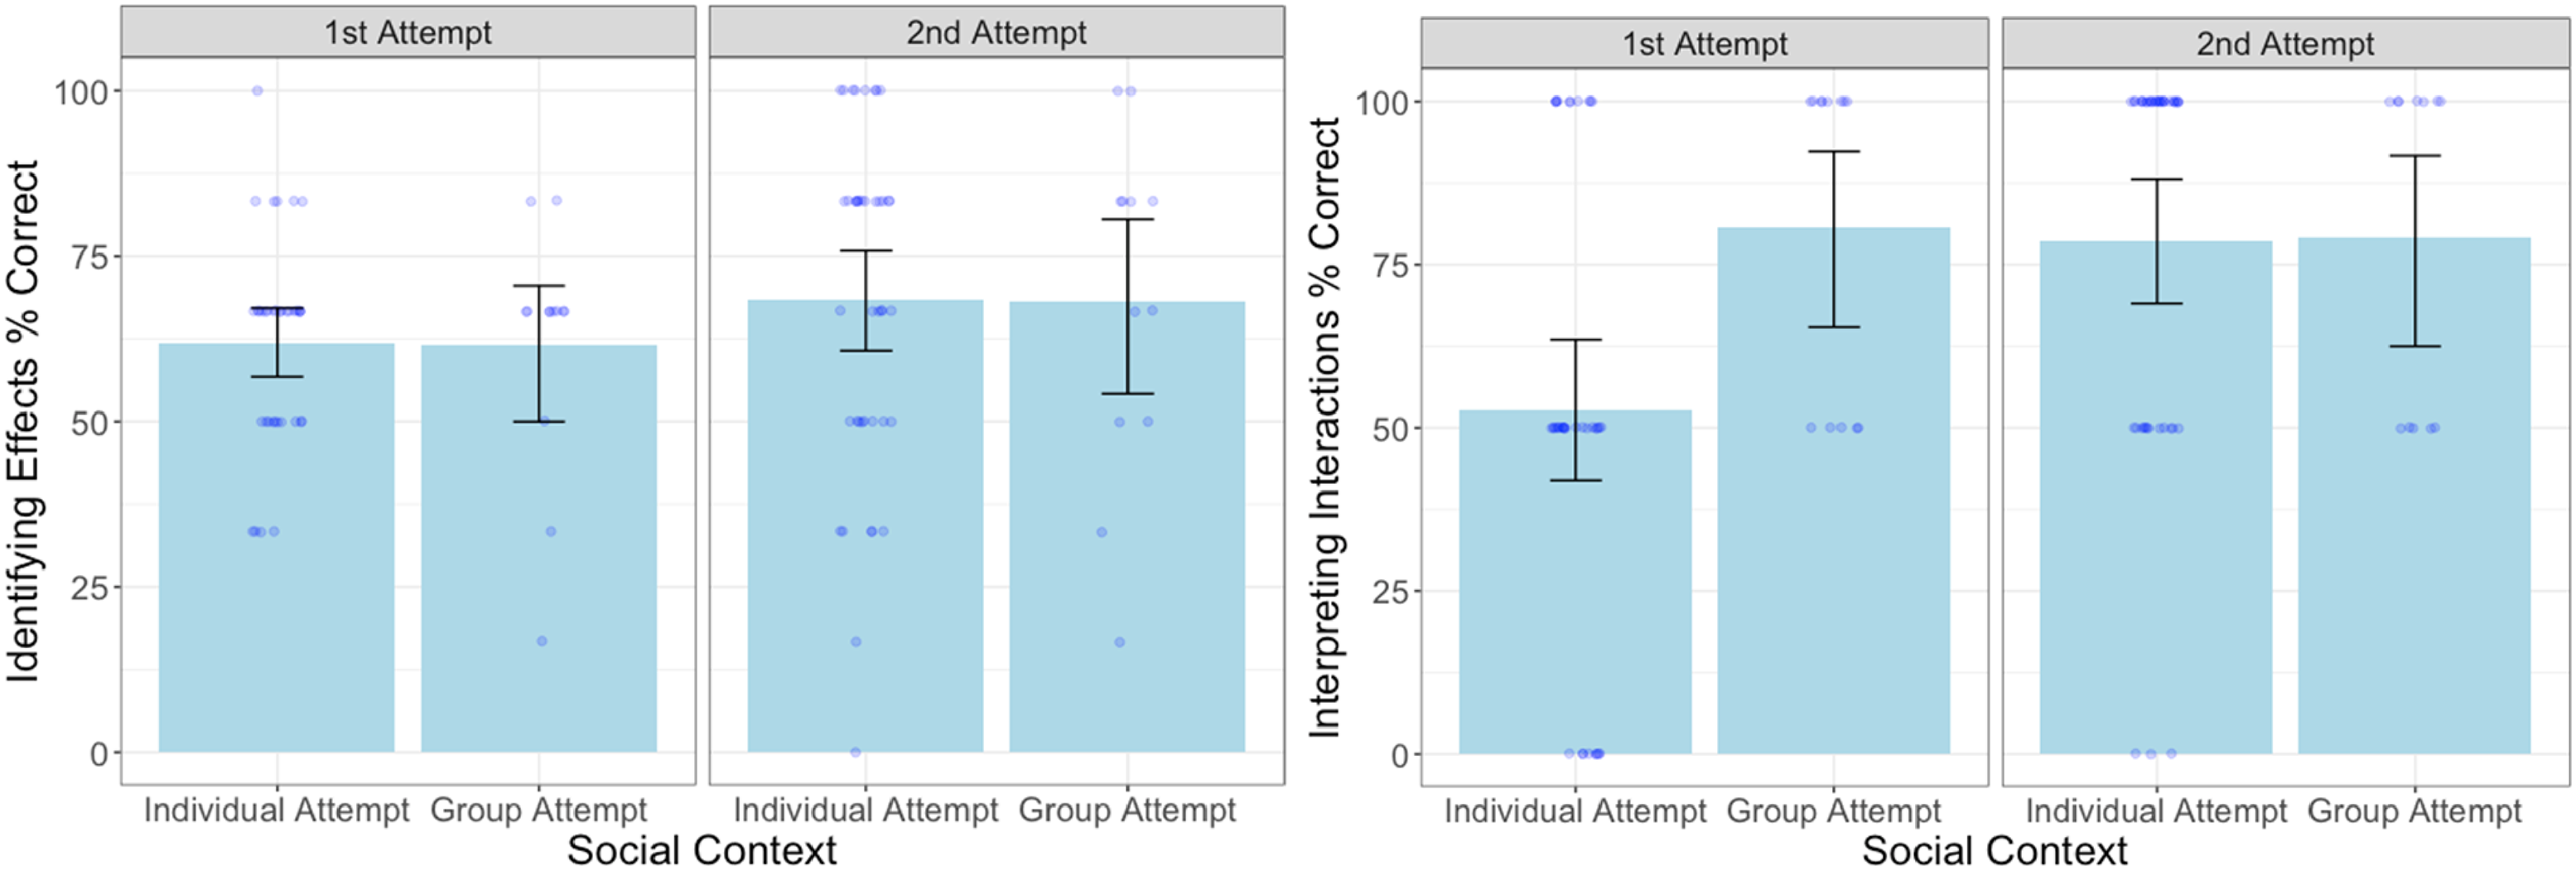
Module performance by social context and attempt number.
Interpreting Interactions
In contrast, students found the two multiple choice questions on interpreting interactions easier to master and showed improvement between the first (M = 60.00%, SD = 34.99) and second attempts (M = 78.70%, SD = 30.10), t (102) = 2.93, p = .004, d = 0.58. Working with peers increased performance on these questions when they were first encountered, t (48) = 2.63, p = .011, d = 0.85. On the first attempt, those working in groups (M = 80.77%; SD = 25.32, n = 13 groups) performed better than individuals (M = 52.70%, SD = 35.25, n = 37 individuals). However, there were no differences in performance by social context on the second attempt, t (52) = 0.06, p = .953, d = 0.02 (see Figure 4) with both individuals and groups performing at a high level. Given the simplicity of the multiple-choice question format and the repetition of the exact same examples, we assume that students may have simply remembered the correct answers from the previous week.
Feedback
The open-ended questions about learning experience yielded 43 responses. Most frequently (39.53% of the comments), students indicated that they found understanding factorial design difficult or confusing. Students also frequently reported finding the specific examples confusing (34.88%). The next most frequent comment (20.93%) indicated that this module was a fun, interesting, or helpful way to review or assess their mastery of these concepts.
Discussion
We were surprised that completing the Factorial Designs module twice did not bolster performance on closely related questions on a later exam (see Figure 3). This result could be explained, at least in part, by students’ poor performance on the Identifying Effects questions in the module. Even when working with a group of peers and when completing the activity for the second time and after having seen corrective feedback a week earlier, students still had difficulty identifying main effects and interactions in the module. Group work can effectively scaffold student learning; however, when a task is so difficult that no group member can adequately leverage prior knowledge or existing skills, we would not expect a consistent benefit of collaboration. Without additional instructions on “how” to determine whether there are main effects or an interaction, the module may have simply been too difficult to affect students’ understanding or enhance their performance on related exam items.
Experiment 2
In Experiment 2, we examined whether a revised version of the activity (Version 2.0) could enhance students’ ability to visually identify main effects and interactions. We made three empirically-driven changes to the materials and procedure in an attempt to better scaffold students’ mastery of this skill.
First, we added a worked example as a reminder of the steps in identifying main effects and interactions. A number of studies have demonstrated that worked examples can bolster student learning, particularly for tasks that rely on implementations of problem-solving procedures (see Atkinson et al., 2000 for a review).
Second, we eliminated the individual attempt. Students often perform better on assessments they complete with the support of peers (Cortright et al., 2003) and tend to have better long-term retention of this information compared to information they were assessed on alone (Gilley & Clarkston, 2014). From Experiment 1 we know that the Identifying Effects questions are sufficiently challenging to warrant peer support. Thus, we assigned all students to work with peers both times they tackled the module in order to leverage the potential benefits of peer collaboration.
Third, we simplified and focused the module in three ways. We removed the two examples on interpreting interactions and added additional examples on the more challenging question type, identifying main effects and interactions. We exaggerated the effects presented in the examples and included more whole numbers to reduce any possible confusion from visual judgments. Finally, we created two versions of the module so that students worked through eight unique examples (including two worked examples) instead of repeating the same four examples. Increased variety of examples might increase the durability of learning and transfer to related exam problems (e.g., Butler et al., 2017). Students were therefore exposed to a more focused module, with larger effects of the independent variables, and a greater variety of examples.
In Experiment 2, we compared student performance on a subsequent exam between those who engaged in the revised Factorial Designs 2.0 module to those who did not see the module, using the same Control section as Experiment 1. We predicted that additional scaffolding in the form of a worked example, more practice with identifying effects, examples presenting larger effects, and greater variability in examples might not only increase students’ performance on the module but also transfer to closely related exam questions.
Method
Participants
Participants included the Control participants from Experiment 1 and 131 additional participants who enrolled in a subsequent section of the course. The students in this Intervention section did not differ from those in the Control section in regards to parental education, transfer status, or prevalence of historically underrepresented ethnic minority groups (all χ2 < 2.45, all ps > .29; see Table 2). This Intervention section did differ from the Control section in gender distribution, χ2(2, N = 225) = 9.68, p = .008, with more students identifying as women (65.93% versus 63.83%) and fewer students identifying as men (17.78% versus 36.17%).
Participant Demographics by Section Experiment 2.
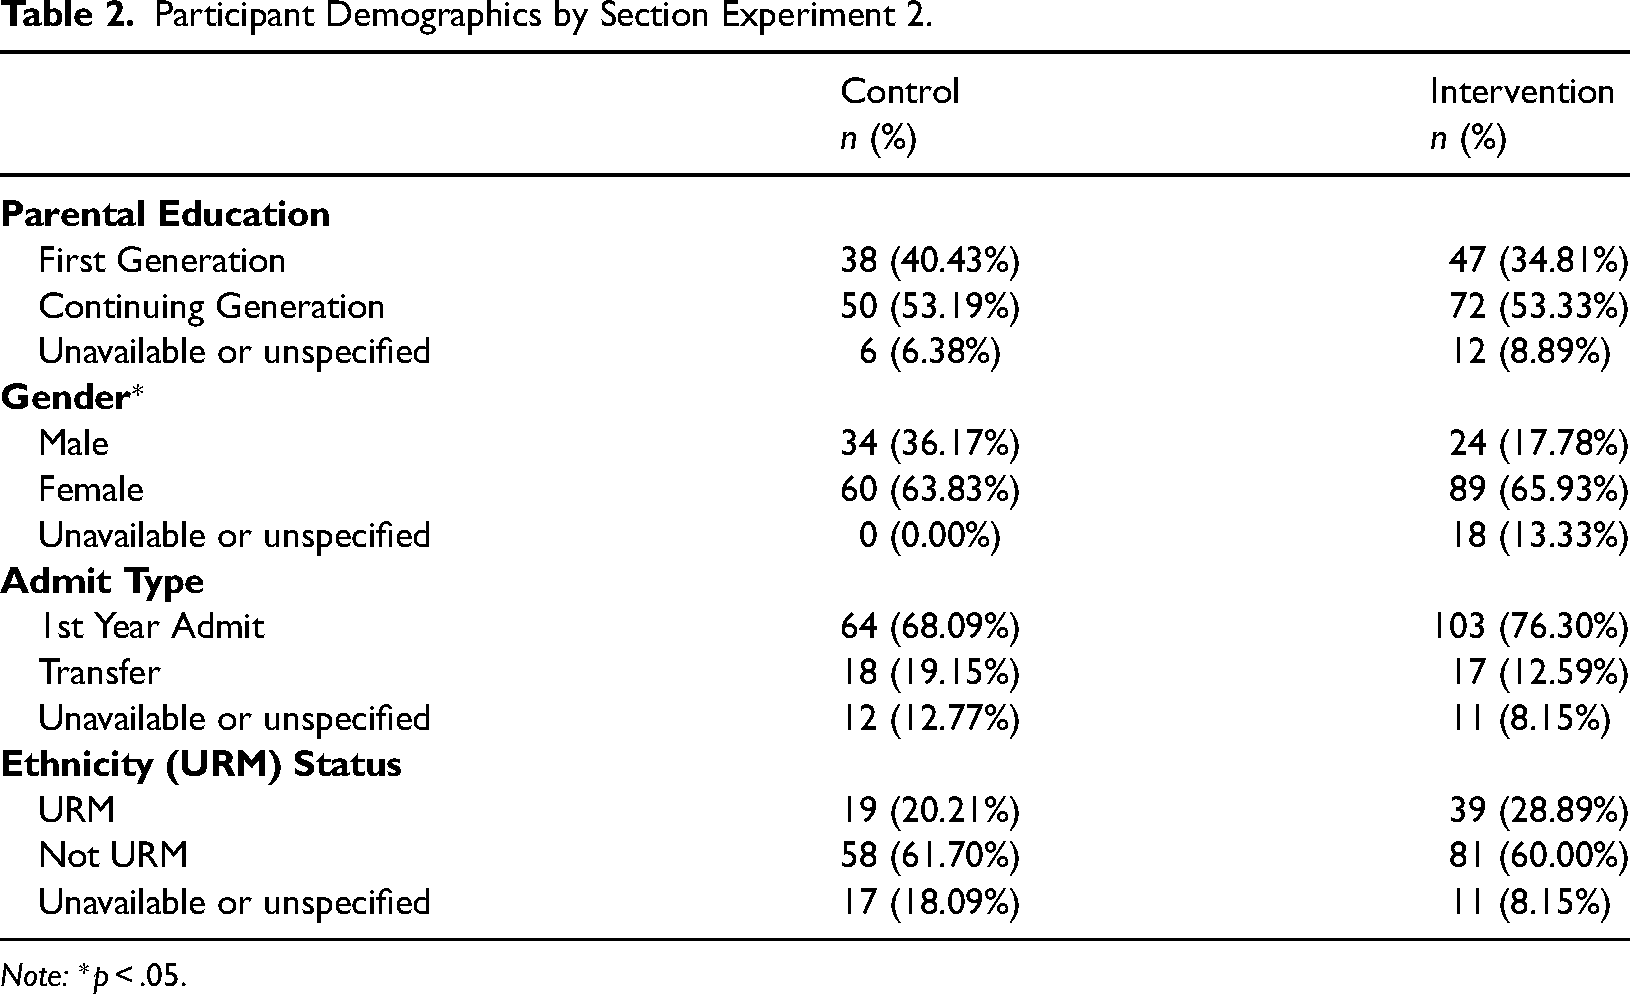
Note: *p < .05.
Data from five participants in the Intervention section and three from the Control section were excluded from the analysis because they did not complete both exams, resulting in samples of n = 91 in the Control section and n = 126 in the Intervention section.
Design and Course Context
As in Experiment 1, students self-enrolled in the sections and were therefore not randomly assigned to the Intervention and Control conditions. The course context for this Intervention section was highly similar to the Control section. The course was taught remotely, with the same materials, and by the same instructor of record.
Materials
Experiment 2 used a simplified and revised version of the Factorial Designs web-based module. Version 2.0 began with a worked example (see Figure 5) and focused only on identifying effects. The worked example detailed how to draw conclusions visually and required students to respond “yes or no” to a series of carefully scaffolded questions (e.g., “Yes, there is a main effect because the averages are different from each other”; “No, there is NOT an interaction because the lines are parallel”). The worked example was followed by three Identifying Effects questions similar to those presented in Experiment 1. We created two variations of the module, each with four different but equally difficult examples.
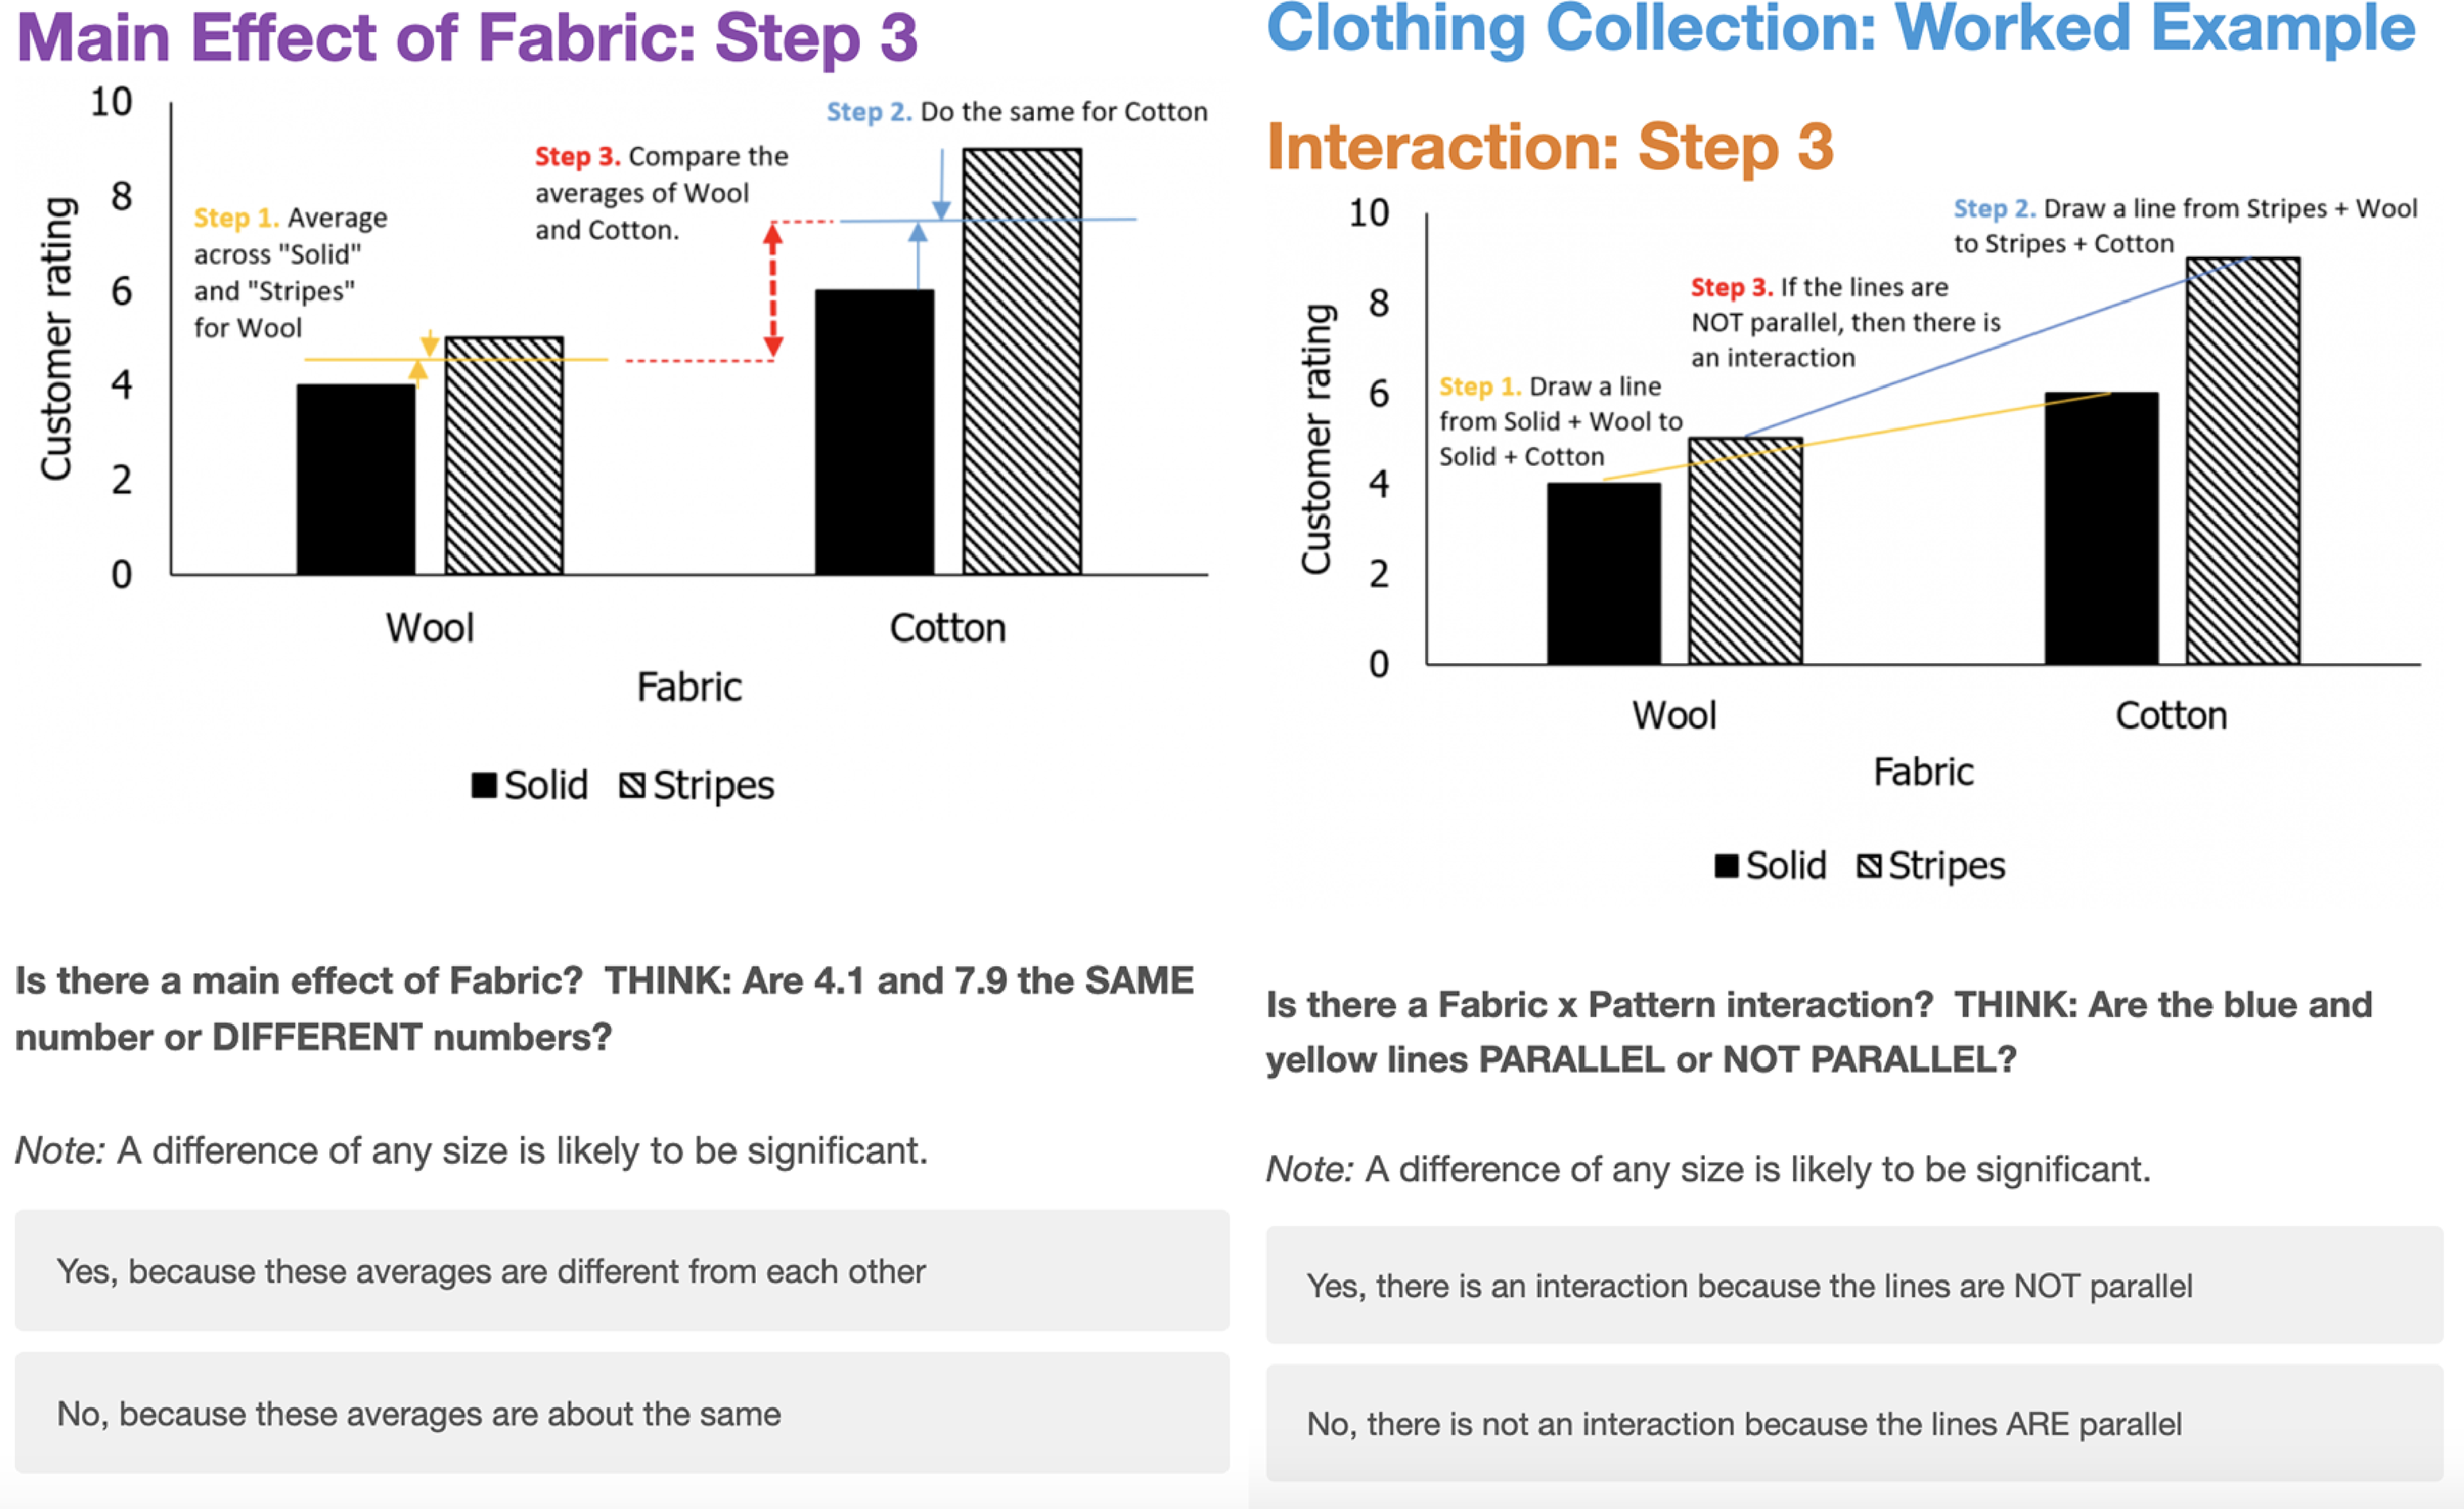
Worked example from factorial designs 2.0.
Procedure
In the Intervention section, students completed the Factorial Designs 2.0 modules in two 15-min sessions, one week apart. Students worked synchronously in groups of 3 to 4 peers in a private room on a video conference. All groups attempted the first set of module questions in the first week and the second set in the second week. Most participants (80.95%) were in attendance for both sessions. The exam was completed one to three days following the second practice session.
Outcome Measures
As in Experiment 1, both concept mastery on the exam and module performance were calculated. The same exam question prompts, graph examples, and scoring procedures were used.
Results
Exam Performance
Similar to Experiment 1, in Experiment 2 we used a multivariate ANCOVA 5 to compare exam performance on Identifying Effects and Interpreting Interactions questions for students in the Intervention and Control sections. While the Interpreting Interactions questions were not specifically targeted by the Factorial Designs 2.0 module, we kept these data in the model to explore whether practice on identifying effects might transfer to this related concept. Scores on the midterm (administered four weeks before the activity) were, once again, included in the model to control for baseline differences in student performance. As expected, midterm scores significantly (and strongly) predicted performance on both sets of exam questions, F (2, 213) = 19.71, p < .001, Wilk's Λ = .84, ηp2 = .16. Performance on the exam questions differed between the sections, F (2, 213) = 8.18, p < .001, Wilk's Λ = .93, ηp2 = .07. Students in the Intervention section performed significantly better on the exam questions that tested students’ ability to identify main effects and interactions, F (1, 214) = 5.46, p = .020, ηp2 = .03 (see Figure 3), but worse on the exam question in which they were asked to interpret an interaction, F (1, 214) = 7.86, p = .006, ηp2 = .04. These effect sizes suggest that participation in the Intervention section explained 3-4% of the variance in students’ exam scores on these sets of questions after taking into account variance explained by midterm exam scores. Although these effects are considered small, they are in line with the effect sizes often seen in interventions that take place in real-world educational settings (Kraft, 2020). It is especially notable that we have observed these effects within the context of a high-stakes exam that students have prepared for considerably.
Module Performance
In this experiment, the Intervention section completed both module attempts in groups and the module only included questions on Identifying Effects. Compared to the students who worked in groups on their first attempt in Experiment 1 (M = 61.54%, SD = 18.49, n = 13 groups), students performed numerically (but not significantly) better on these Identifying Effects questions in Version 2.0 of module (M = 66.12%, SD = 14.26), t (52) = 0.94, p = .352, d = 0.30. However, there was no improvement between module performance for the first (M = 66.12%, SD = 14.26) and second attempt in Experiment 2 (M = 70.11, SD = 13.99), t (81) = 1.28, p = .203, d = 0.28 (see Figure 6). As students completed different questions for each attempt (rather than repeating the same questions as in Experiment 1), there was no potential increase over time by simply recognizing the correct answer.
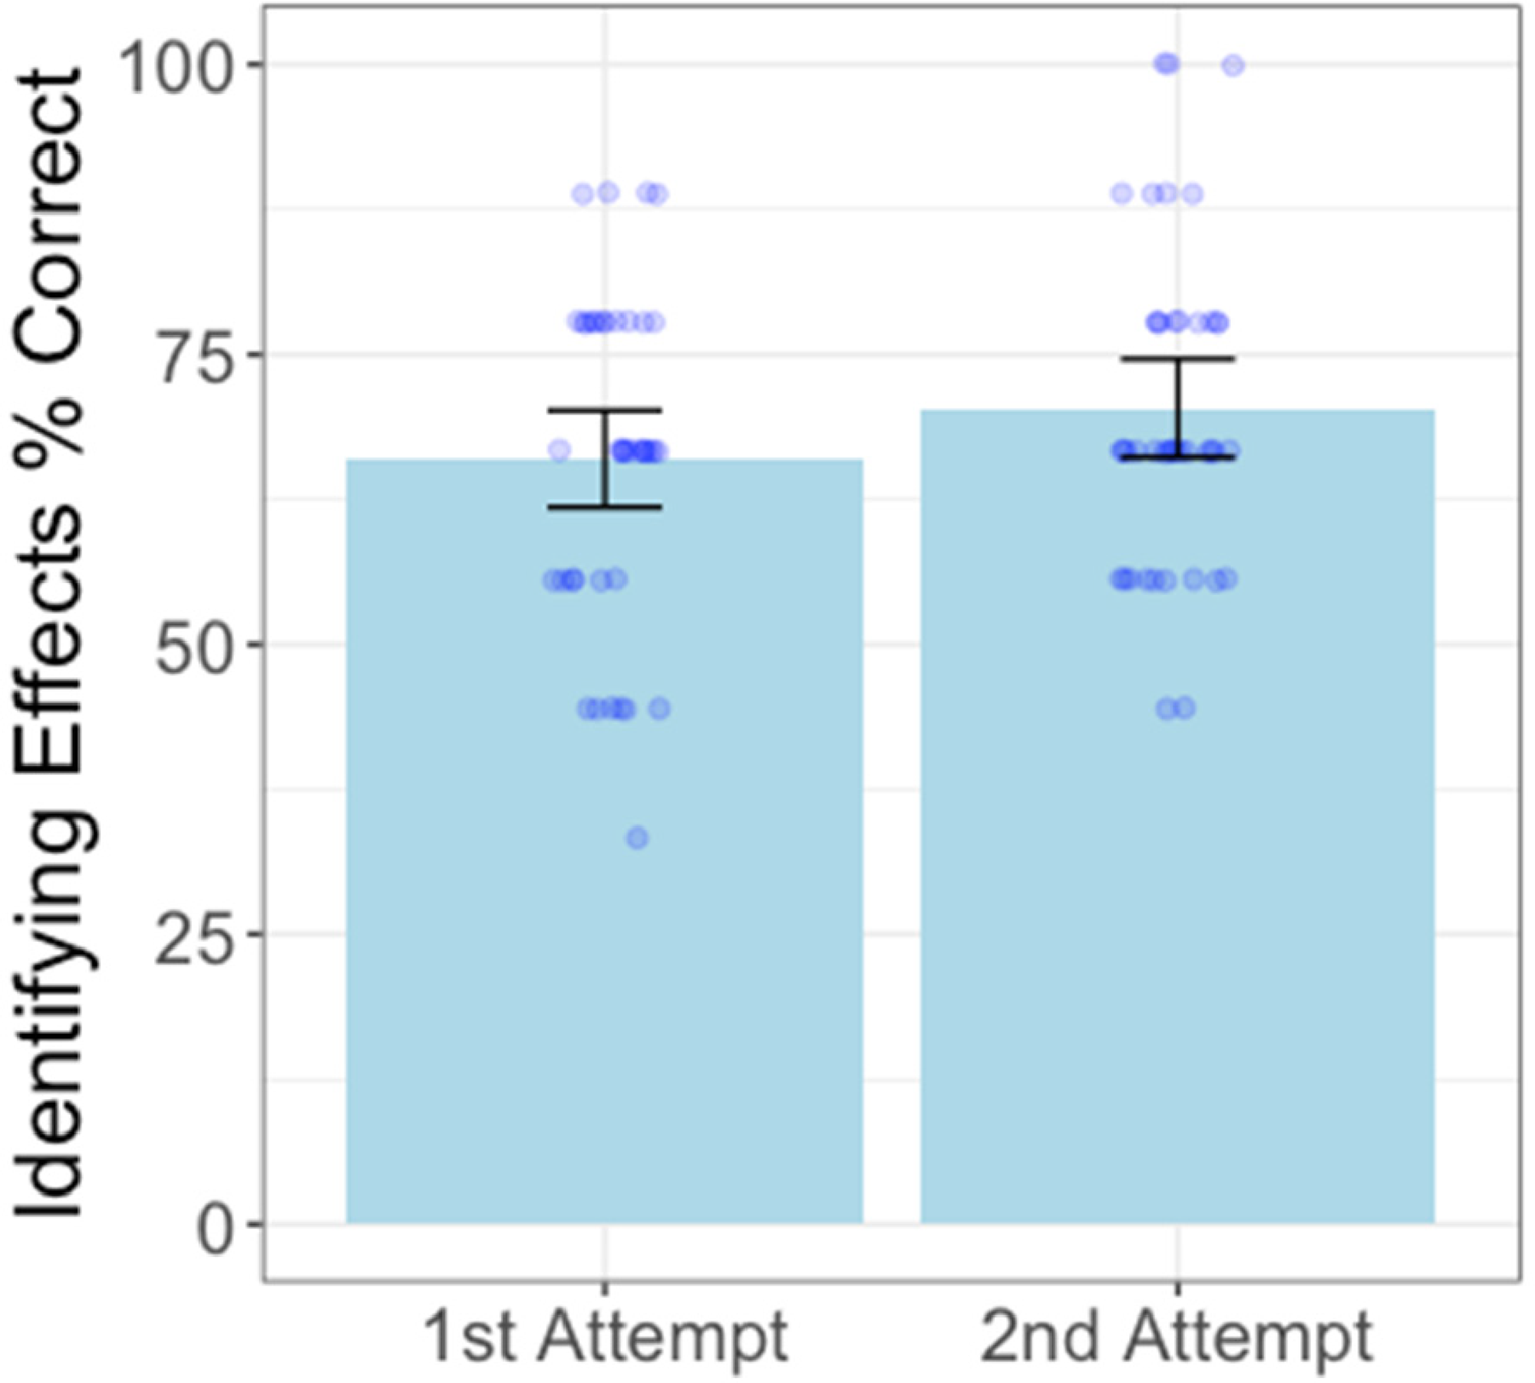
Factorial designs 2.0 performance by attempt.
Discussion
The revised module seemed to be effective in helping students identify effects in factorial designs and improved performance on closely related exam problems (Figure 3). Even though group performance did not improve on the second attempt at the module, after seeing two worked examples and collaborating with peers, students in the Intervention section demonstrated higher mastery on the Identifying Effects exam questions than students in the Control section.
Paradoxically, although these students performed better than the Control section on the Identifying Effects question targeted by the module, they performed worse on the unpracticed Interpreting Interactions question. One possible explanation could simply be that they did not have as many opportunities to practice that content and thus performance on those items declined. It is also possible that completing such a highly structured activity in the weeks leading up to the exam could have primed students to focus on identifying effects, which may have led them to inappropriately apply the steps they learned to identify effects to problems on interpreting interactions 6 . Finally, we cannot rule out the possibility that due to the non-random assignment of students to sections, there could be inherent differences between the sections. Although we controlled for midterm scores, the students in the Intervention section performed worse than the Control section on both the midterm and the remainder of the exam 7 indicating that the Intervention section may have had overall less advanced conceptual understanding. If this is indeed the case, it is promising that, even for students with less mastery of course material, completing the module increased their performance on the targeted items.
General Discussion
Across two experiments we tested the effectiveness of a module designed to strengthen students’ ability to comprehend visual representations of 2 × 2 factorial designs. The first iteration of this module did not seem to provide sufficient support to bolster student understanding, however, the revised module showed promise in enhancing performance on closely related exam questions. Although we cannot pinpoint which features of Factorial Design 2.0 led to these differences, the combination of a worked example, greater variability of examples, and increased time spent collaborating with peers seemed to provide a more appropriate level of challenge and support.
The findings from this line of work highlight the importance of providing effective scaffolding to support students’ learning of challenging concepts. In Experiment 1, providing some practice and the opportunity for peer discussion was not sufficient to help students consolidate these ideas and demonstrate learning on an exam. Even when working in groups, performance on the Interpreting Effects questions on the module never exceeded 70%, indicating that greater support was needed. In order to better scaffold students’ learning, the revised module included several empirically-driven improvements such as incorporating increased opportunities for peer collaboration (Doo et al., 2020; Gilley & Clarkston, 2014) and including a worked example (Ayres & Paas, 2012). The revised module also provided a greater variety of examples that specifically targeted identifying effects which may have facilitated transfer to the related exam items.
Although we know that providing carefully scaffolded activities can enhance learning (Pea, 2004), given the inherent messiness of real classrooms it can be difficult to observe the effect that these activities have on performance. Nevertheless, it is important to use live classrooms as laboratories to understand the tangible impact that these teaching and learning practices have on student learning. Of course, this ecological validity may come at a cost. In real classrooms there is often no random assignment to sections and it is difficult or impossible to track time spent studying or access to resources outside of the classroom. In the current studies, we attempted to mitigate potential differences between sections by controlling for scores on the midterm. We find that, even though there were likely pre-existing differences between the sections (i.e., students in the intervention section in Experiment 2 performed worse on the midterm), those students that completed the revised module performed better on the targeted exam questions; an indication that the module may be effective in enhancing students’ ability to identify effects in 2 × 2 factorial designs.
Future work is necessary to tease apart which aspects of the activity might be driving these benefits. Future research could also explore the effectiveness of this module in other courses, such as upper-division courses where students have higher levels of prerequisite statistical knowledge. Identifying and evaluating further improvements to this module, such as providing a copy of the worked example that remains visible throughout the examples, might also be beneficial.
Taken together, across two experiments, we documented the difficulty students have in identifying effects in factorial designs and established that a scaffolded peer activity can lead to targeted improvement. The success of peer collaboration for problem-solving may depend on providing sufficient scaffolding and clear feedback. Notably, lack of mastery of these foundational concepts was surprisingly difficult to disrupt and suggests a need for continued research in supporting students’ skill in comprehending complex visualizations of data. Facilitating understanding of factorial designs is a worthwhile and potentially achievable goal, as it is one part of the essential foundation for establishing psychological literacy.
Footnotes
Declaration of Conflicting Interests
The author declared no potential conflicts of interest with respect to the research, authorship, and/or publication of this article.
Funding
The authors received no financial support for the research, authorship, and/or publication of this article.