
Abstract
An experiment is conducted in a multistage high-pressure compressor to investigate noise and rotor blade vibration. When vibration with high amplitude occurs in the rotor blade, high-intensity sound occurs within the compressor. The amplitude of noise inside the compressor varies with the amplitude of blade vibration, and the variation laws are consistent. Therefore, an annular disk cavity model, the simplified cavity between the rotator and stator of a high-pressure compressor, is built to study the high-intensity sound in the compressor by numerical simulation. The motion processes of the vortex structure inside the cavity are captured. The acoustic mode of the annular disk cavity model is excited at Ma 0.2, at the same time the sound pressure in the cavity is characterized with obvious a form of circumferential second order. The internal sound pressure gradually increases along the radial direction. Meanwhile, an annular disk cavity structure is established for experimental study. The characteristics of the acoustic mode of the annular disk cavity structure obtained in the simulation and experiment are consistent.
Keywords
Introduction
With the development of aircraft engines towards high thrust-weight ratios, the requirements for compressors in engines are becoming stricter and harsher. According to statistics, the occurrence rate of vibration failure compressor blades accounts for one-third of the total structural faults of the engine. High intensity sound is one of the reasons discovered in recent years that lead to compressor blade fracture 1 There will be narrow band pressure peaks at discrete frequencies with high amplitude, when high-intensity sound occurs, which is typically not integer multiples of the rotor rotational frequency. When an aircraft engine is operating beyond design condition, high-intensity sound may generate significant acoustic excitation, resulting in pure tone noise up to 160 dB, leading to structural damage. 2 In extreme cases, sound pressure fluctuations with large amplitude caused by high-intensity sound can lead to failure of the compressor structure. 3 Most high-intensity sound phenomena occur inside high-pressure compressors and cause vibration of the first-stage rotor blades in articles. Although these phenomena show similar characteristics, the explanations of their mechanism are not the same.
Parker proposed the first investigation on high-intensity sound in compressors in 1968, who discovered the phenomenon of acoustic resonance in a low-speed single-stage compressor in the development stage. 4 A phenomenon similar to acoustic resonance was discovered in the testing of a certain turbojet engine. The high level of sound pressure generated during the testing even damaged the testing equipment. Although the problem was solved, the underlying mechanism of this physical phenomenon was not fully understood.5,6 Weidenfeller and Lawerenz conducted the annular cascade experiment, it is found that the frequency of flow separation vortex caused by the angular stall is consistent with the blade vibration frequency within a certain operating range of the highly loaded blade. 7 These indicated that there may be a certain correlation between acoustic mode frequency and the excitation source of blade vibration with high amplitude. Legerton conducted research on acoustic resonance with a full-scale compressor developed by Rolls Royce, and indicated that the natural shedding of blades and interaction with downstream plates influence each resonance mode 8 This is mainly influenced on the resonance mode by adjusting the speed range that each resonance mode excited. Holzinger conducted detailed measurements on the vibration of rotor blades induced by acoustic resonance in a 1.5-stage transonic compressor and pointed out that the wake-shedding vortex of adjustable stator blades is the source of high-intensity sound. 1 Cyrus pointed out that the static flow on the blade surface with vortex shedding causes flow pulsation which is measured through static and total pressure probes in the axial compressor. A flow pulsation, approaching the first natural frequency of the damaged stator blade, was found at the rear of the compressor. 9 Through the numerical study, it was shown the relation between the stalled flow on the blade surface with vortex shedding and the airflow pulsation, and high-intensity sound also contributed to it. During experimental research on the low-speed and high-pressure axial flow compressors at the University of Cambridge, Camp found that there is a specific frequency component in the measured pressure spectrum that remained constant as the rotational speed changed. 10 The sound wave propagated in the pipeline as a spiral structure with the direction of rotation opposite to the direction of the rotor. These were completely consistent with characteristics of high-intensity sound that occur in high-speed compressors. It is pointed out that three frequencies must be very close when the high-intensity sound occurs, including the shedding frequency of the vortex, the high-intensity sound frequency of the cavity, and the natural frequency of blade vibration. Camp indicated that both the support plates and blade rows of the compressor may be sources of shedding vortices. Hellrich discovered that when the compressor is operated beyond the stable bound, the pressure level by high-intensity sound inside the compressor exceeds the sound pressure level by frequency dominated of the blade passing, and made a prediction on the resonance frequency through a mathematical model. 11 There were typical characteristics high-intensity sound in axial flow compressors: shedding vortices were considered as the domain factor exciting high-intensity sound; the frequency of the spiral sound mode in the pipeline coincided with the frequency of the blade vortex shedding, when high-intensity sound occurs; the frequency locking phenomenon occurs between the vortex shedding frequency and the acoustic mode frequency; the specific frequency of the noise signal took a step change.
The high-intensity sound also existed in centrifugal compressors. Ziada recorded acoustic mode at the inlet of a multistage centrifugal compressor. 12 Resonance causes significant mechanical vibration throughout the entire compressor. It was found that the significant vibration of the turbine compressor is caused by high-intensity sound caused by vortex shedding through analysis, and vortex excitation is suppressed by installing a splitter plate or airfoil at the tail of the structure, thereby significantly reducing the vibration of the compressor. Sven Konig took the geometric model of the high-pressure centrifugal compressor in the experiment to study the coupling acoustic modes of the side cavity and its connecting cavity of the centrifugal compressor. 13 The influence of different boundary conditions on the acoustic modes of the side cavity was evaluated through numerical calculation. They pointed out that high-intensity sound is the cause of structural damage, and these acoustic modes were similar to Parker’s high-intensity sound modes.
To better study the characteristics of high-intensity noise, Parker experimentally studied the high-intensity sound of the plate in the pipeline structure by changing the flow speed. And investigating high-intensity sound in a parallel multi plates model by experiment, it was found that high-intensity sound all occurs at a certain frequency in the same model with different plate material.14,15 There was a conclusion proposed that acoustic resonance does not involve mechanical vibration of the plate structure, Parker predicted the acoustic mode of the plate in the pipeline model. Archibald conducted an experimental study on the effect of the external sound field and the shape of the trailing edge of the plate on vortex shedding and proposed a feedback loop for the occurrence of high-intensity sound. 16 Campsty and Whitehead studied the high-intensity sound caused by the shedding vortex, theoretically explaining the process of resonant sound resulting from the shedding vortex by theory. Meanwhile, predicting the acoustic mode frequency of the plate in the pipeline model, is in line well with the acoustic resonance frequency obtained from experiments. 17 Welsh and Gibson studied the interaction between the flow and sound of the plate in the pipeline model and found that high-intensity sound occurs when acoustic mode frequency is close to the frequency of vortex shedding at the trailing edge of the plate with a sound pressure up to 130 dB. They also found that the occurrence of high-intensity sound can be suppressed by changing the angle between the flat plate and the incoming flow. 18 Nelson conducted experiments to determine the natural frequency of the Helmholtz resonator using acoustic excitation. The acoustic mode was excited at the flow speed 22 m/s and carefully studied the evolution of vortex structure at the opening of the Helmholtz resonator. 19 Parker and Welsh studied the effects of the sound field on the separation of c/t (ratio of chord length to thickness of a flat plate) vortices and the attachment of shear layers by experiment. 20
Welsh conducted an experiment to study the influence of the shape of the leading and trailing edges of a plate on the high-intensity sound of a plate in a pipeline model. 21 The research found that the frequency of shedding vortices at the trailing edge of the plate increases with flow speed. When a high-intensity sound occurs, the frequency of shedding vortices keeps constant with the flow speed change, called frequency-locked. Yasuharu Nakamura investigated the relationship between the Strouhal number and the rate of c/t (ratio of chord length to thickness of a flat plate) of the plate.22,23 It was found that with the increase of plate c/t, the Strouhal number took a step change by an integer multiple. At the same time, numerical simulations were conducted based on the experimental model to verify the result. Tan and Thompson investigated the source of acoustic resonances by experiment and numerical simulation.24–26 It was found that the sound energy is mainly concentrated at the trailing edge of the plate, and showed a close relation with the generation of the shedding vortex. Yokoyama studied the effect of high-intensity sound on the velocity shear layer of the flat plate cascade model, the vortex shedding at the trailing edge of different plates showed a similar rule. 27
The hazards of high-intensity sound bringing in the compressor cannot be ignored. Therefore, the high-intensity sound problem in multistage high-pressure compressors is studied with experiments and numerical simulation. An experiment is conducted to investigate the noise in the compressor and the vibration of the blade in a multistage high-pressure compressor. The high-intensity sound of the circular tube square cavity model is reproduced at the perspective of decoupling between the flow field and the sound field. The annular disc cavity model is established based on the rotating stator disk structure in the compressor, and the high-intensity sound in the model is excited. The noise experiment is carried out with an annular disc cavity structure. This paper presents the feasibility of analyzing the structure failure resulting from the coupling between acoustic and structure from the perspective of high-intensity sound.
Theory of sound production around blunt bodies
Flow field simulation theory
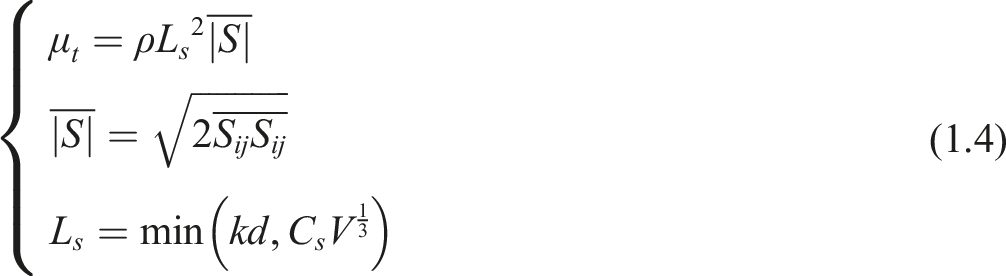
LES (Large eddy simulation) take direct calculation on large-scale vortices which have a large effect on the flow. The effect of small-scale vortices on the flow field is handled with a function. The filter function is taken to divide the flow to large-scale vortices and small-scale vortices. LES can accurately characterize the motion of vortex structures with a small cost. After processing by a mathematical filter function, the governing equations for large vortex simulations can be expressed as:
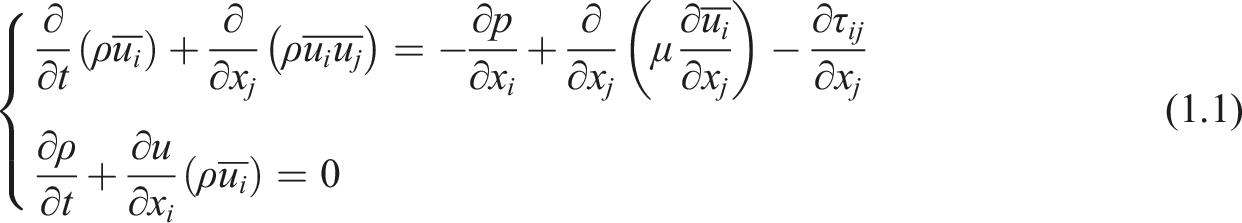

The above equation is a sub-lattice scale stress term. The variables in this equation are taken as instantaneous values after filtering. Smagorinsdky proposed the vortex viscous model to be applied in the solution of the sub-lattice model.

Sound analogy theory under the action of fixed wall
Lighthill first derived the sound equation for the sound problem in free space. The mass conservation equations and momentum conservation equations are:

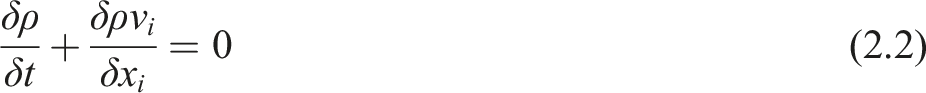

Taking partial derivatives from the above equation in space and time:
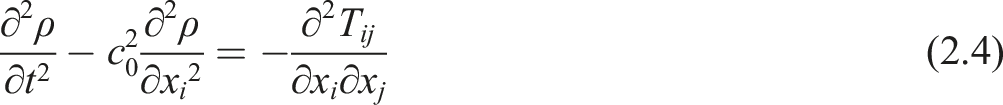
Taking into account the limitation of boundaries such as walls on sound propagation, Curle derived the Curle equations by considering the effects of fixed walls based on the Lighthill equations:
On the premise that the wall is rigid and the length of the sound wave is far greater than the size of the sound source, the far field sound pressure can be expressed as:
The first term on the right side of the first equation represents the free field sound radiation of the sound source as a quadrupole source, and the second term represents the influence of objects on sound radiation as a dipole source.
Noise and vibration in high pressure compressor
Experimental equipment
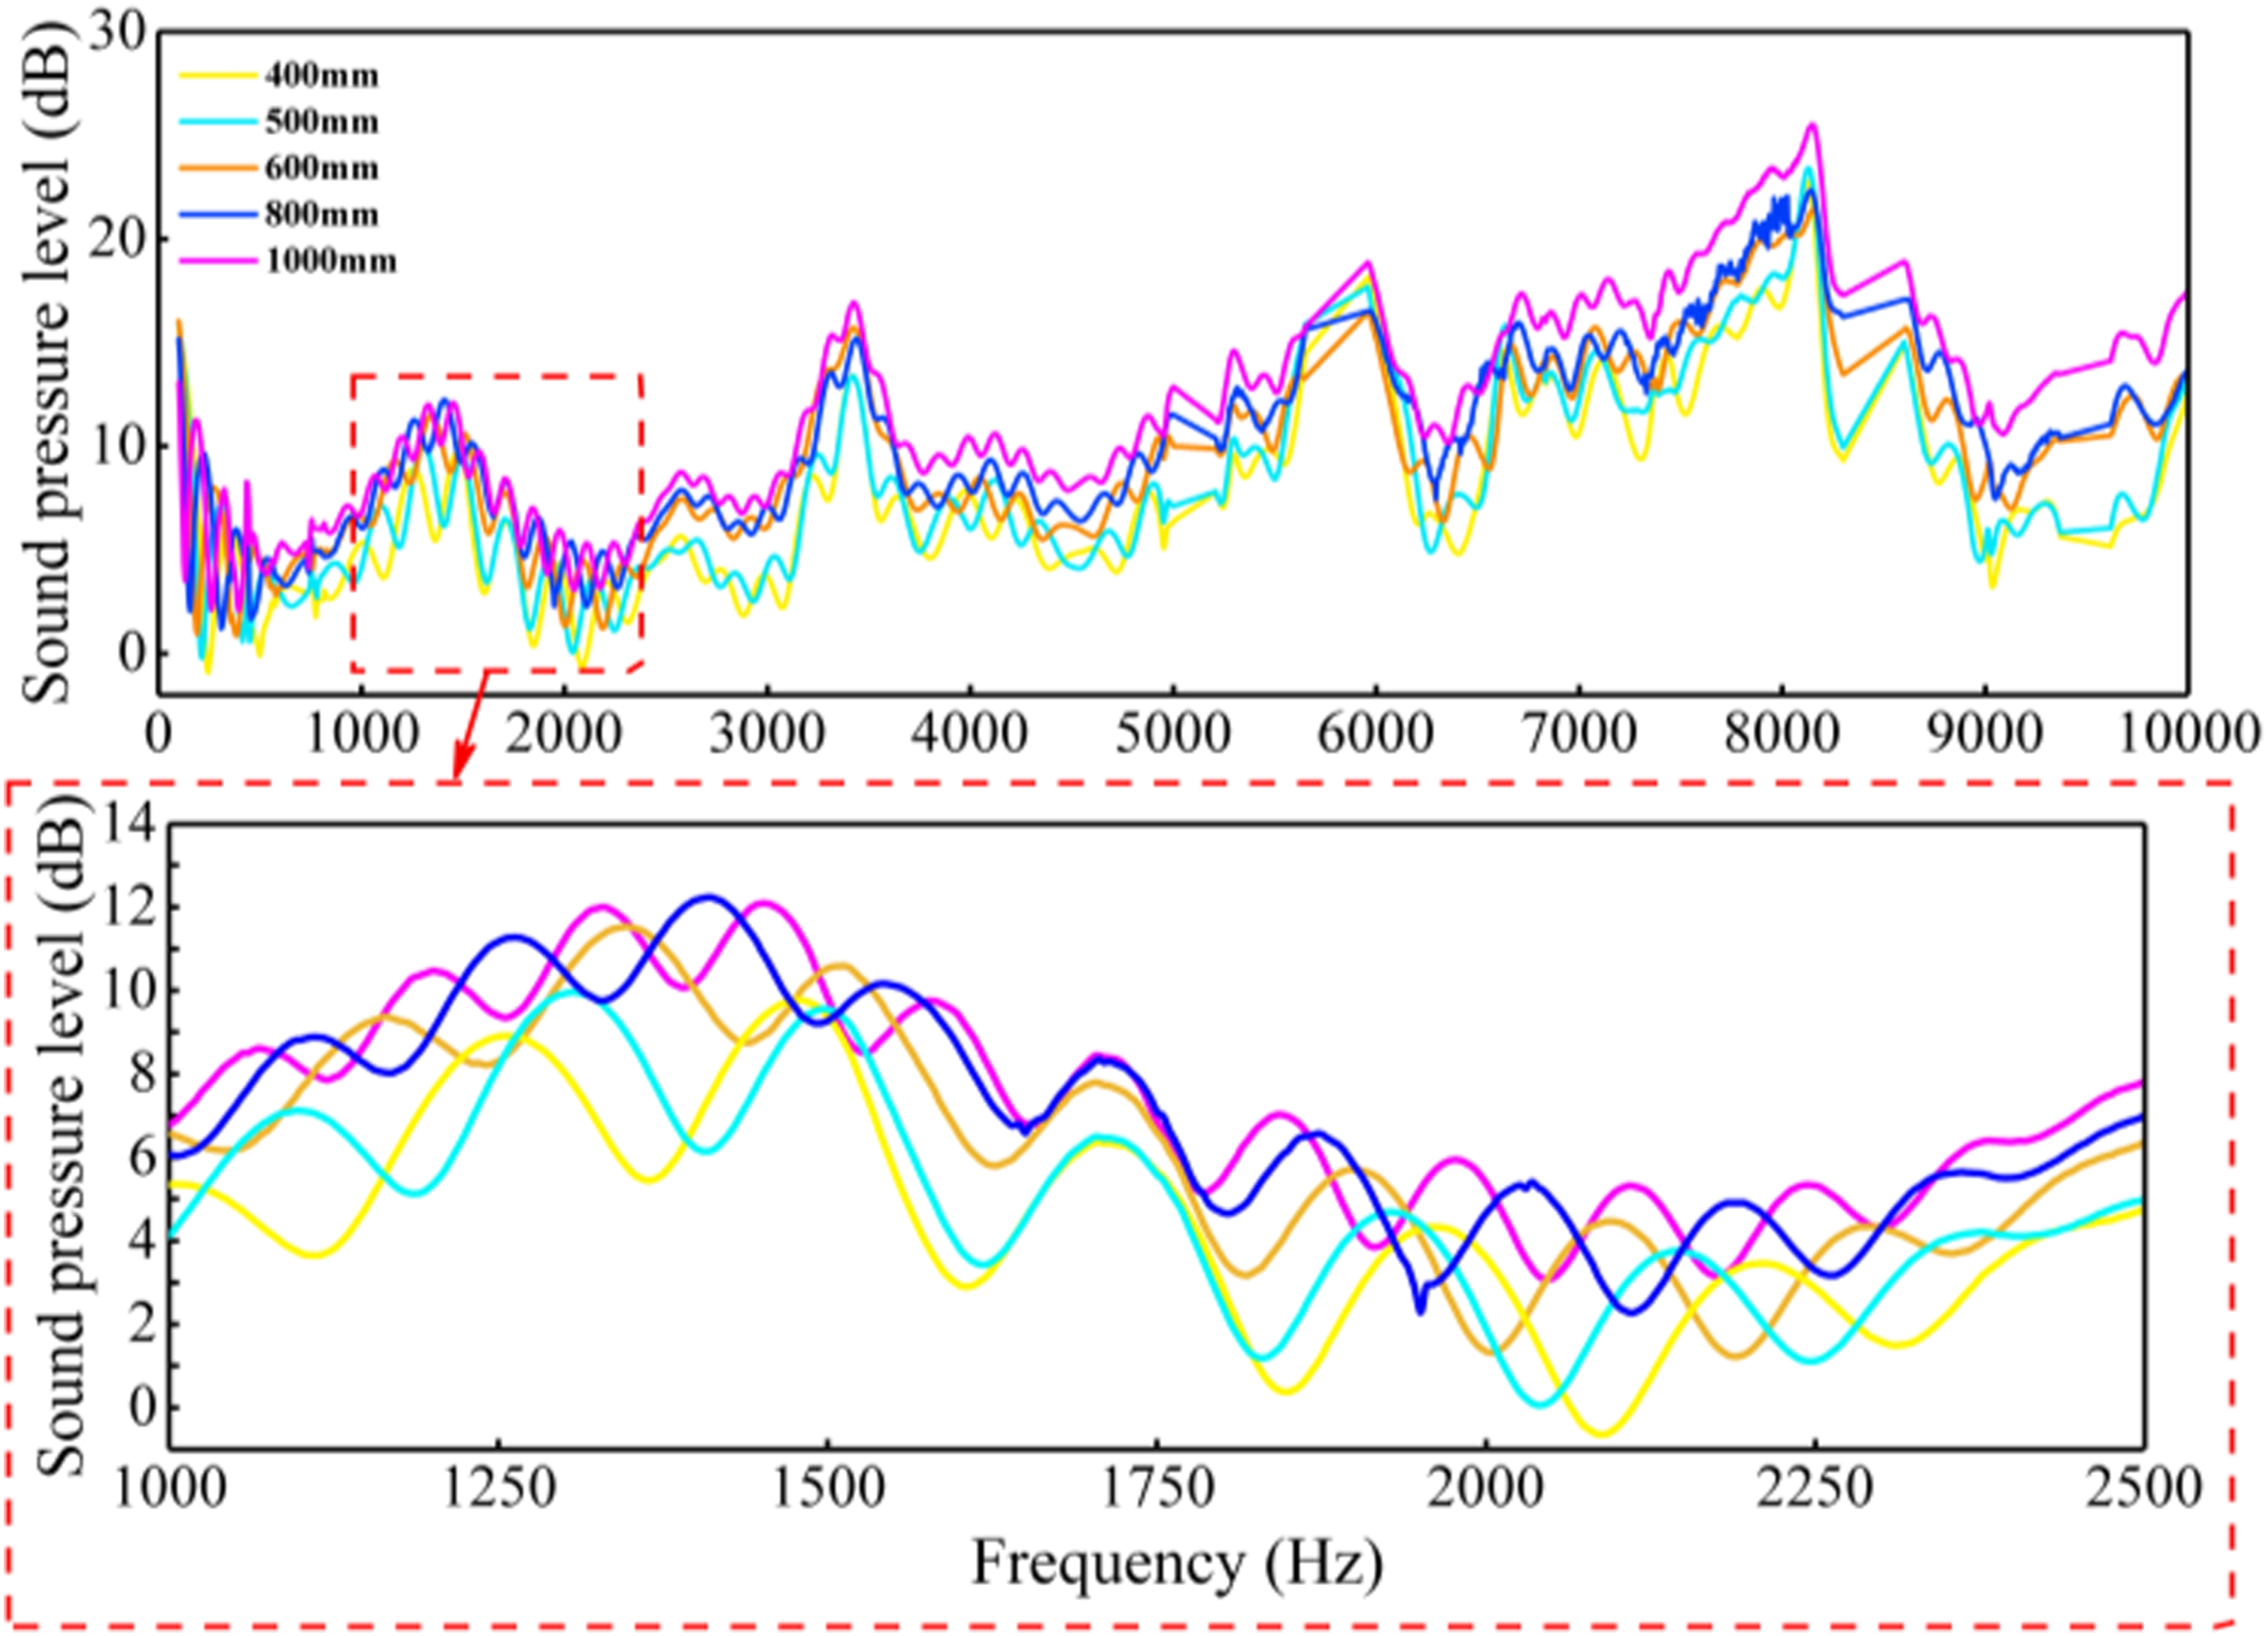
The operating environment of aircraft compressor is high temperature, high pressure, and high sound intensity. Therefore, the derived noise measurement method based on rigid wall acoustic waveguide technology can show better performance in this environment. During the process of measurement, connecting the two ends of the acoustic waveguide to the compressor casing and microphone separately. Thus, the measurement of internal noise in the engine can be done with no need for the microphone to be in direct contact with harsh environments. However, the bandwidth of signal frequency band may be limited in the propagation process of sound wave in the pipe, and the resonance peak and pressure time domain waveform also may be lost when sound wave propagate in the pipelines. In order to compensate for the shortcomings of acoustic waveguide, it is necessary to capture the static and dynamic characteristics of the testing system, and then make corresponding adjustments for the sound attenuation correction obtained in the measurement results. A standard piston sounder 250 Hz/124 dB of B&K company is used to calibrate the static characteristics of the testing system during the experiment. The dynamic characteristics of the testing system are calibrated using a broadband digital closed-loop acoustic calibration system. The schematic diagram of the digital closed-loop acoustic calibration system is shown in Figure 1. Due to limitations in installation conditions at the test site, the length of acoustic waveguide installed at different measurement points need to be adjusted respectively. By calibrating the dynamic characteristics of the derived noise testing system, the sound attenuation characteristic curves of different lengths of the acoustic waveguide are obtained, which is show in Figure 2. The schematic diagram of the digital closed-loop acoustic calibration system. Attenuation characteristics of acoustic ducts with different lengths.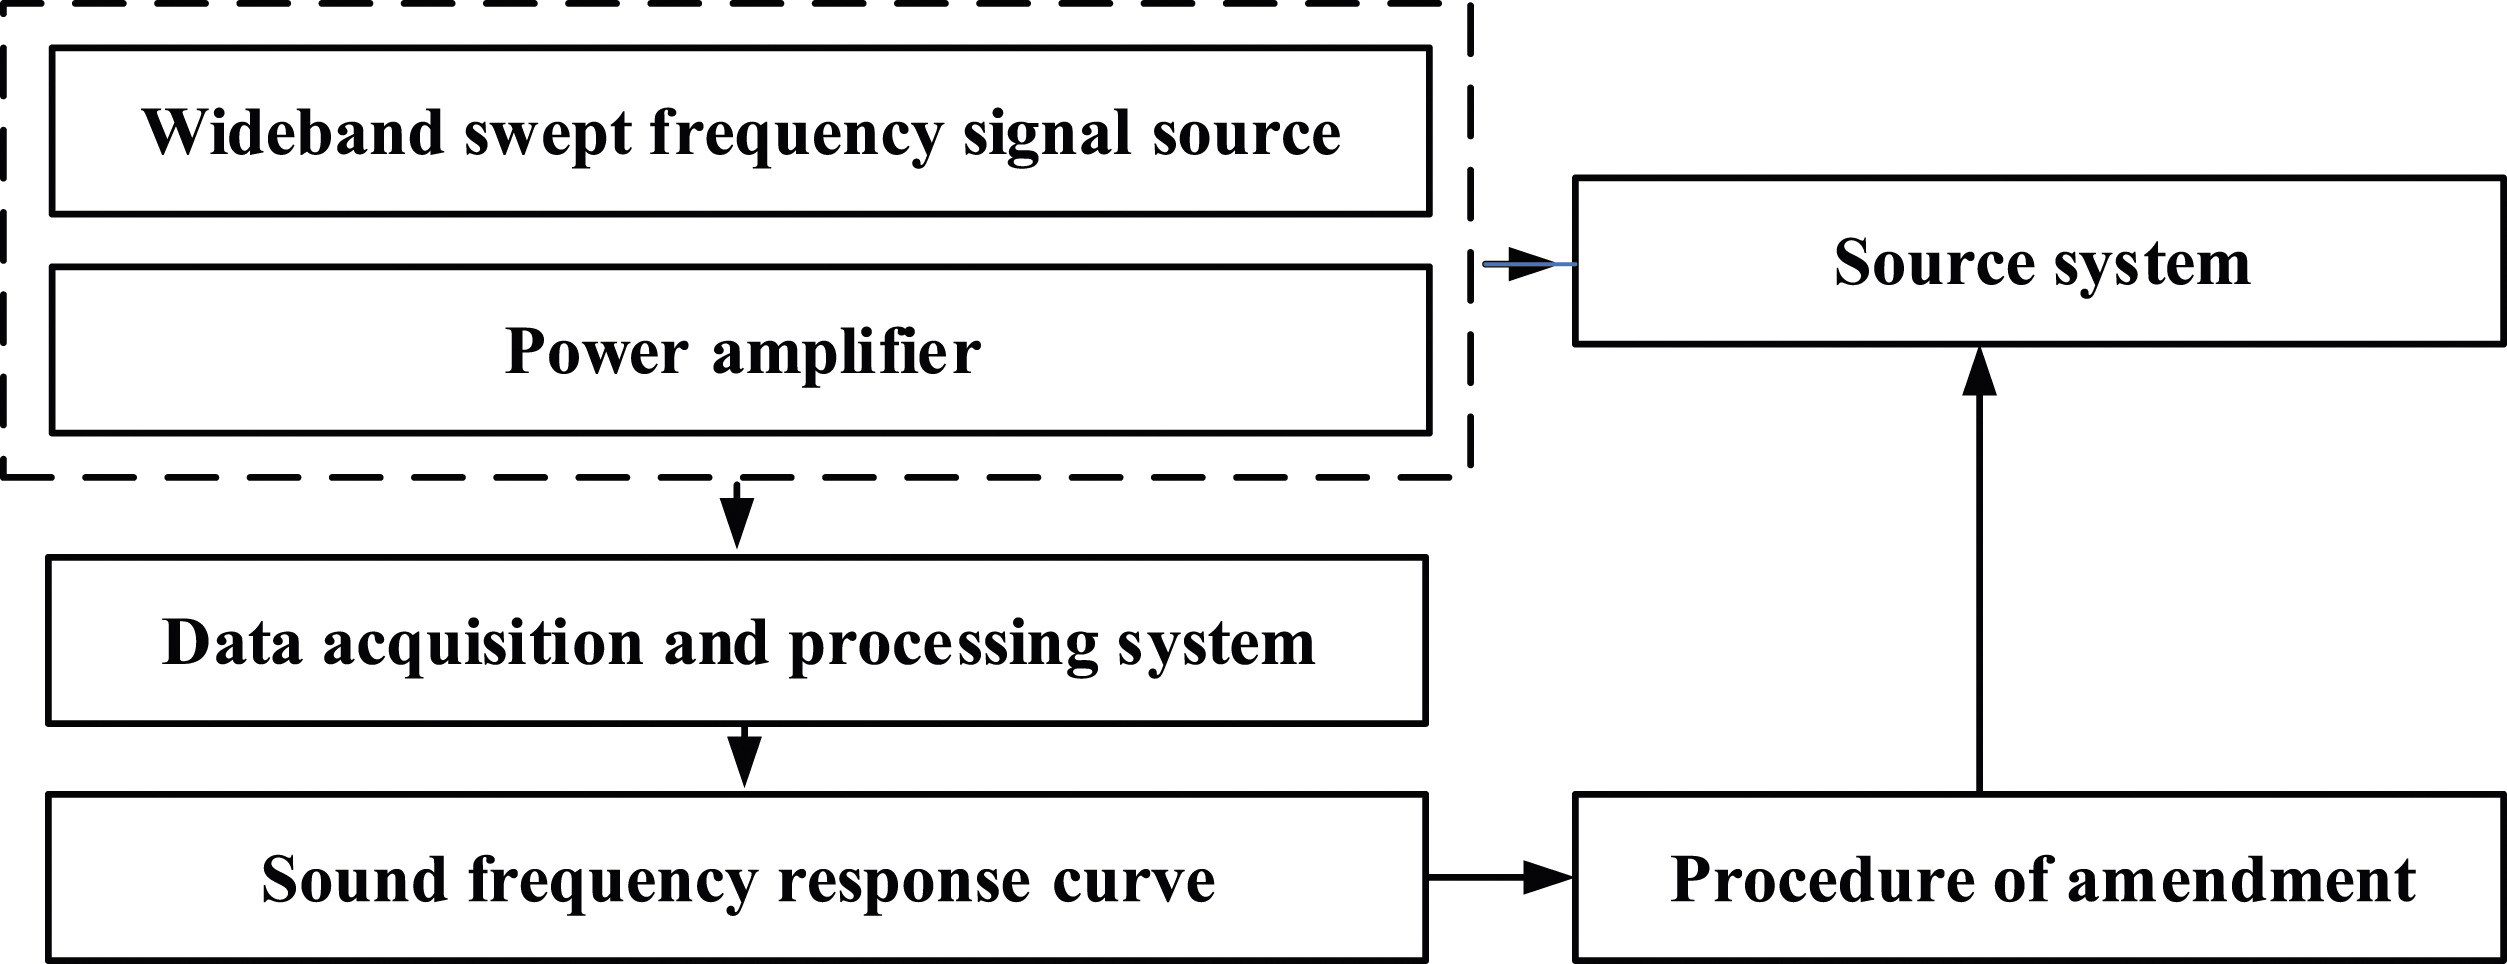
At the same time as conducting noise detection inside the compressor, the vibration of the R1 (first-stage rotor blades) of the compressor is detected with non-contact measurement methods. Noise measurement points are located at the casing along the circumferential position of the engine, and vibration measurement points are located at the casing directly above R1. The distribution of noise and vibration detection points in the compressor is shown in Figure 3. High pressure compressor and location distribution of measuring points schematics.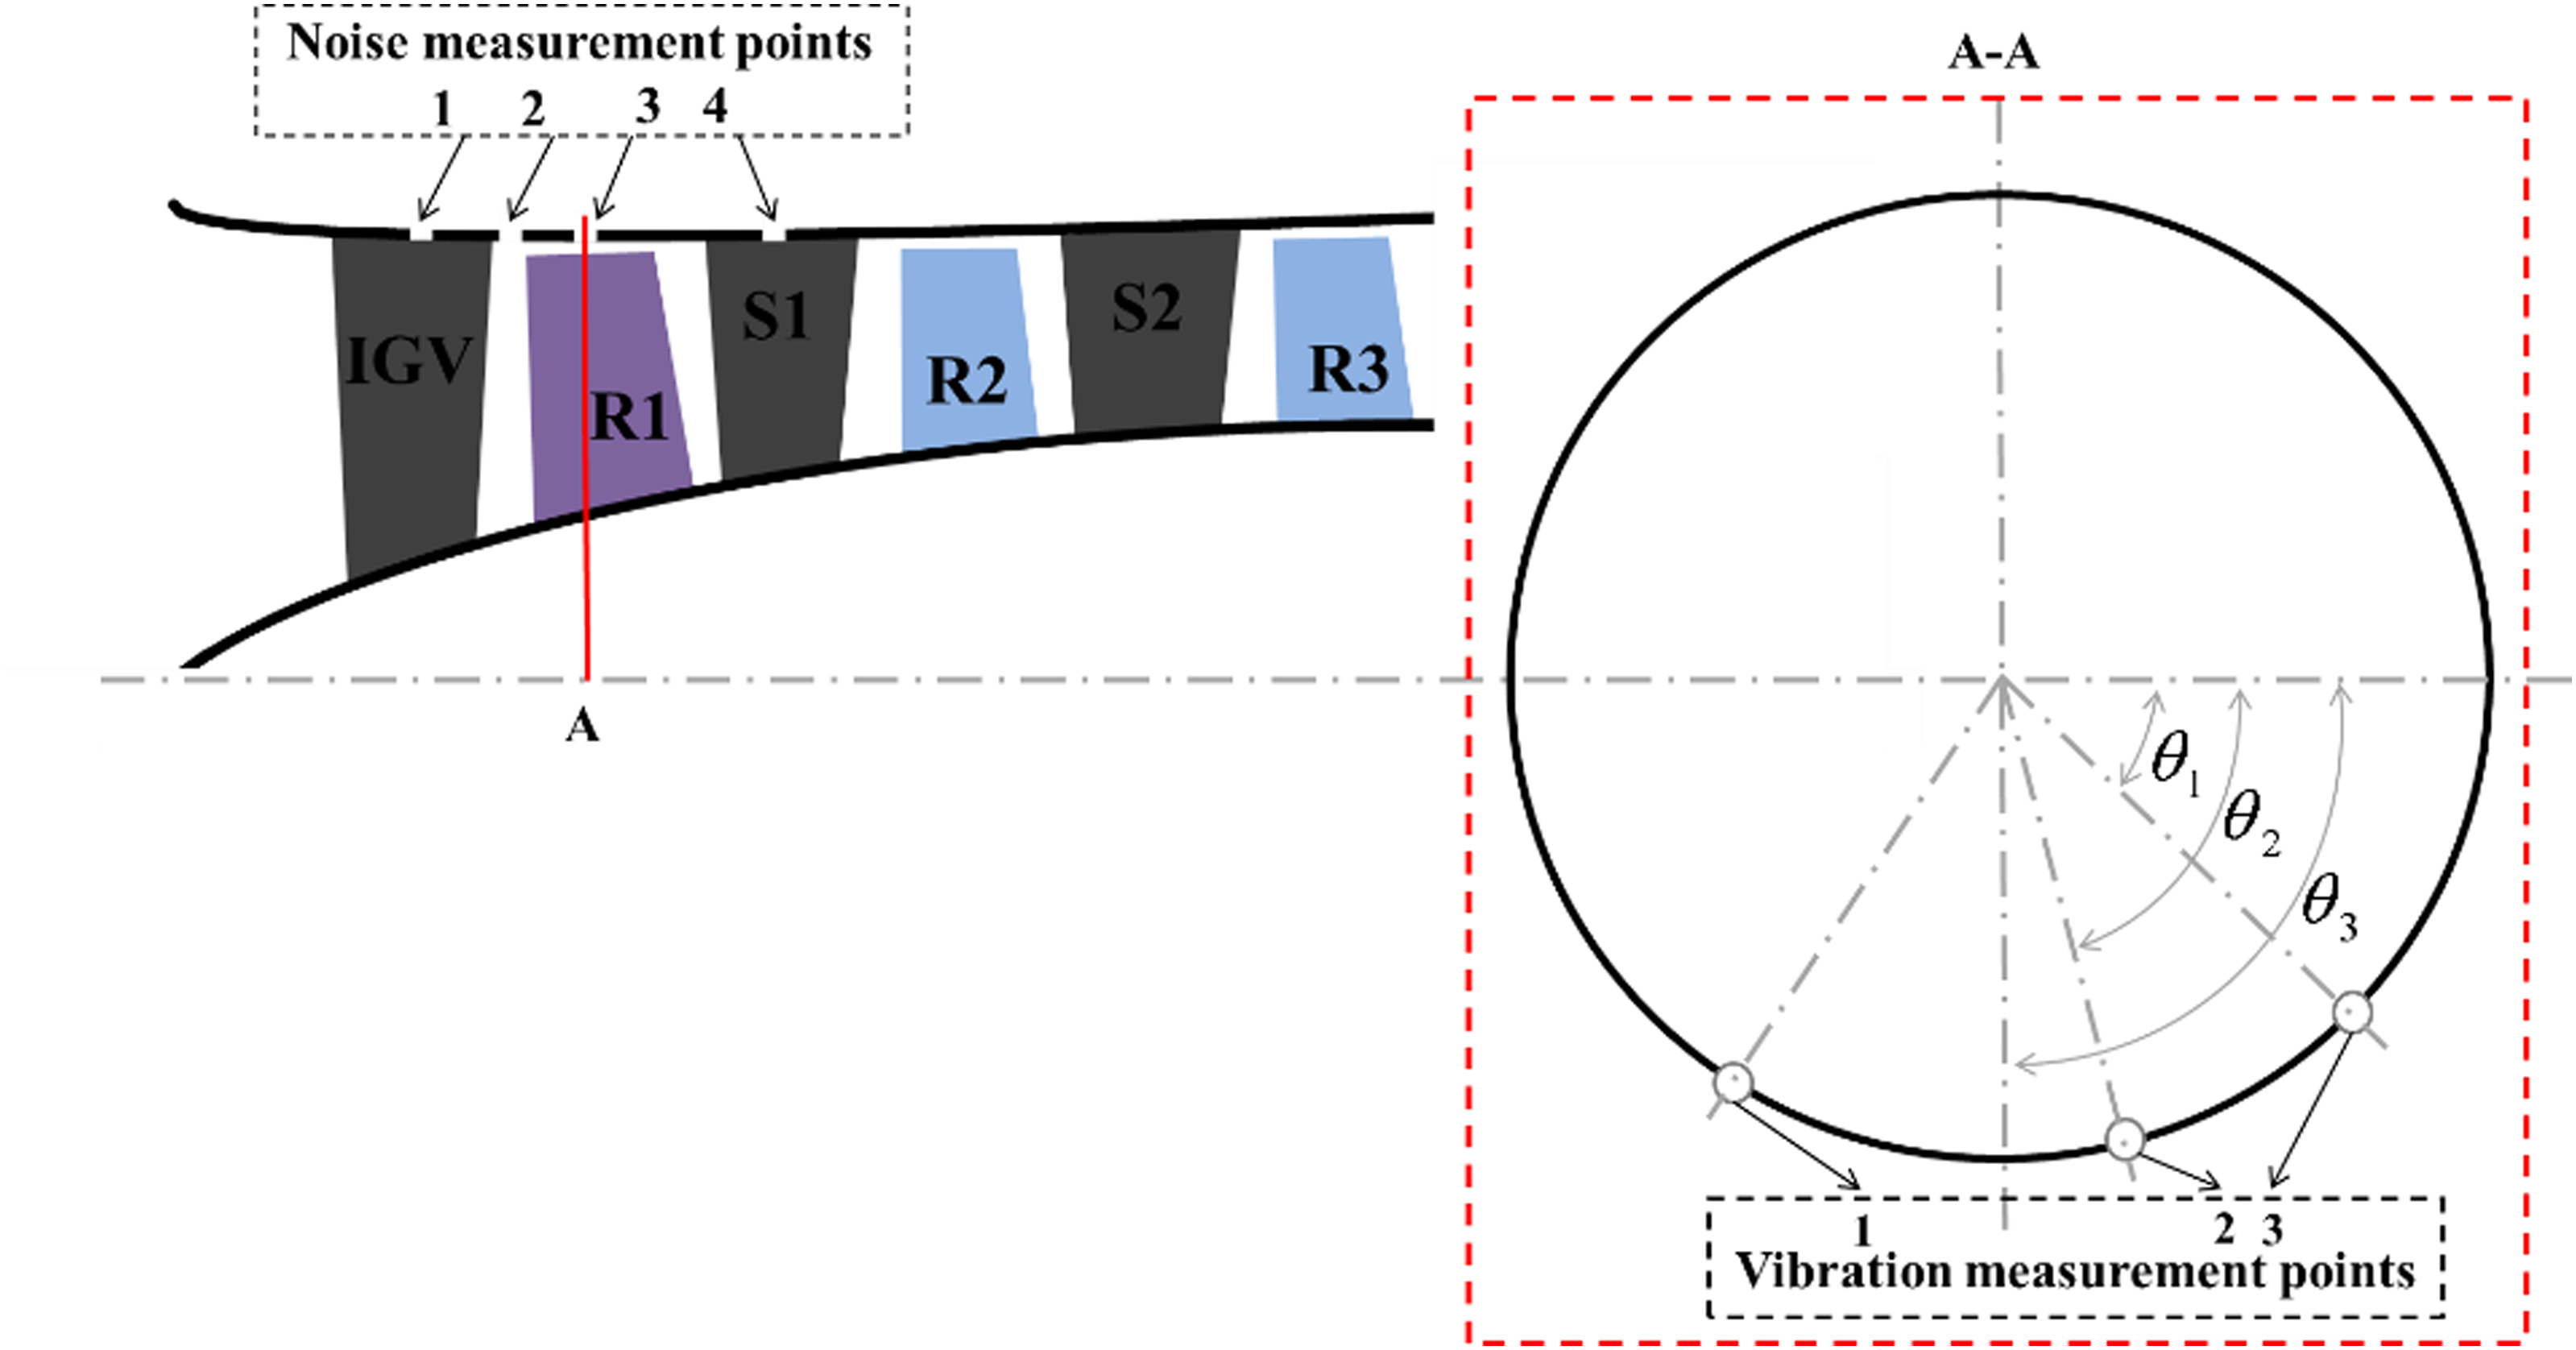
Experimental result
During the experiment, the operating conditions of the compressor are changed by adjusting the rotor speed of the compressor and the deflection angle of the stator adjustable blades. The high-pressure rotor speed working conditions cover various typical working conditions of the engine, from starting to idle, through intermediate state to maximum state. The stator adjustable blades are adjusted according to the initial and deviation design angle of the engine. Under a specific operating condition, a characteristic frequency component is observed in the internal noise signal of the compressor flow channel, at the same time blade vibration with high amplitude is observed in the high-pressure R1. The spectral characteristics of noise signals at different noise measurement positions are shown in Figure 4. Noise characteristics at different measuring points (Z0: zero level guide blade; Z0/R1: space between Z0 and R1; S1: the first stage of stators).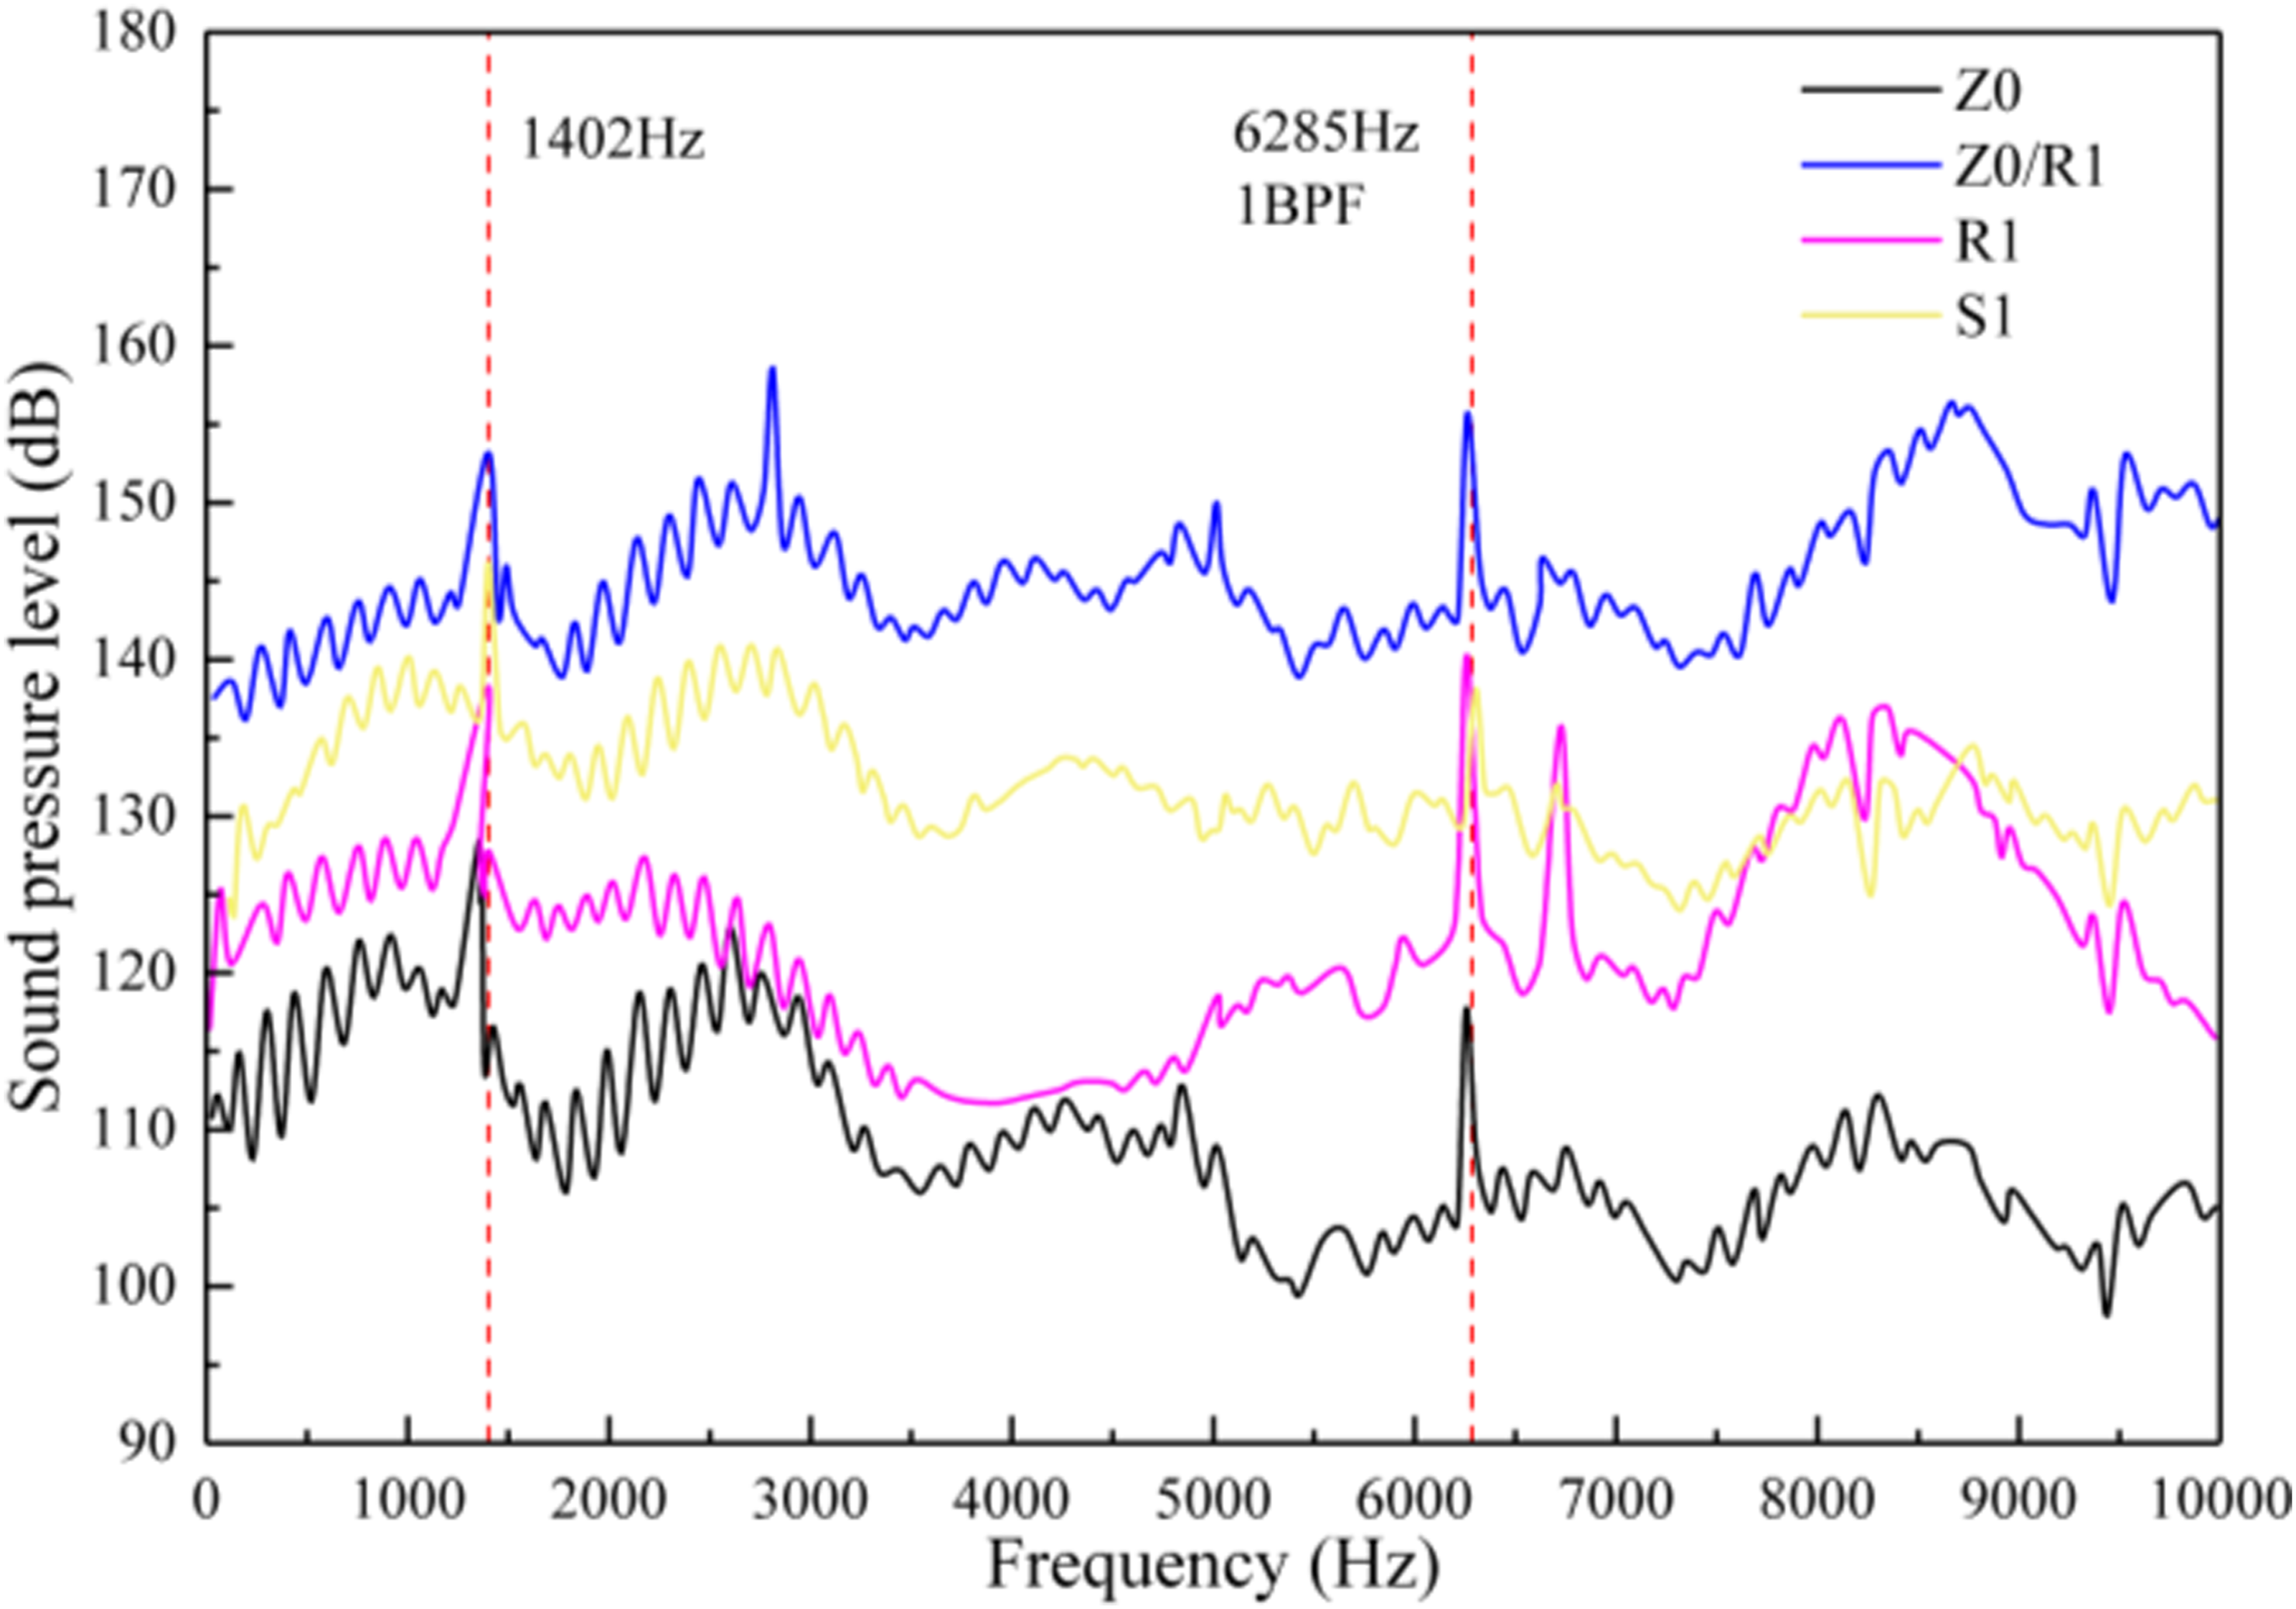
As shown in Figure 4, when abnormal vibration occurs in the high-pressure R1, a discrete pure tone characteristic frequency of 1402 Hz with high amplitude, a passing frequency of 6285 Hz for R1, and other peak noise frequencies are all detected at different axial position of the compressor casing. The characteristic relationship between these characteristic frequencies and the passing frequency of R1 has been confirmed. Therefore, when abnormal vibration occurs on R1, the sound pressure evolution law of characteristic frequencies at different positions is monitored as shown in Figure 5 at the time of the emergence of abnormal vibration on R1. Frequency characteristics of total sound pressure levels at different measuring points.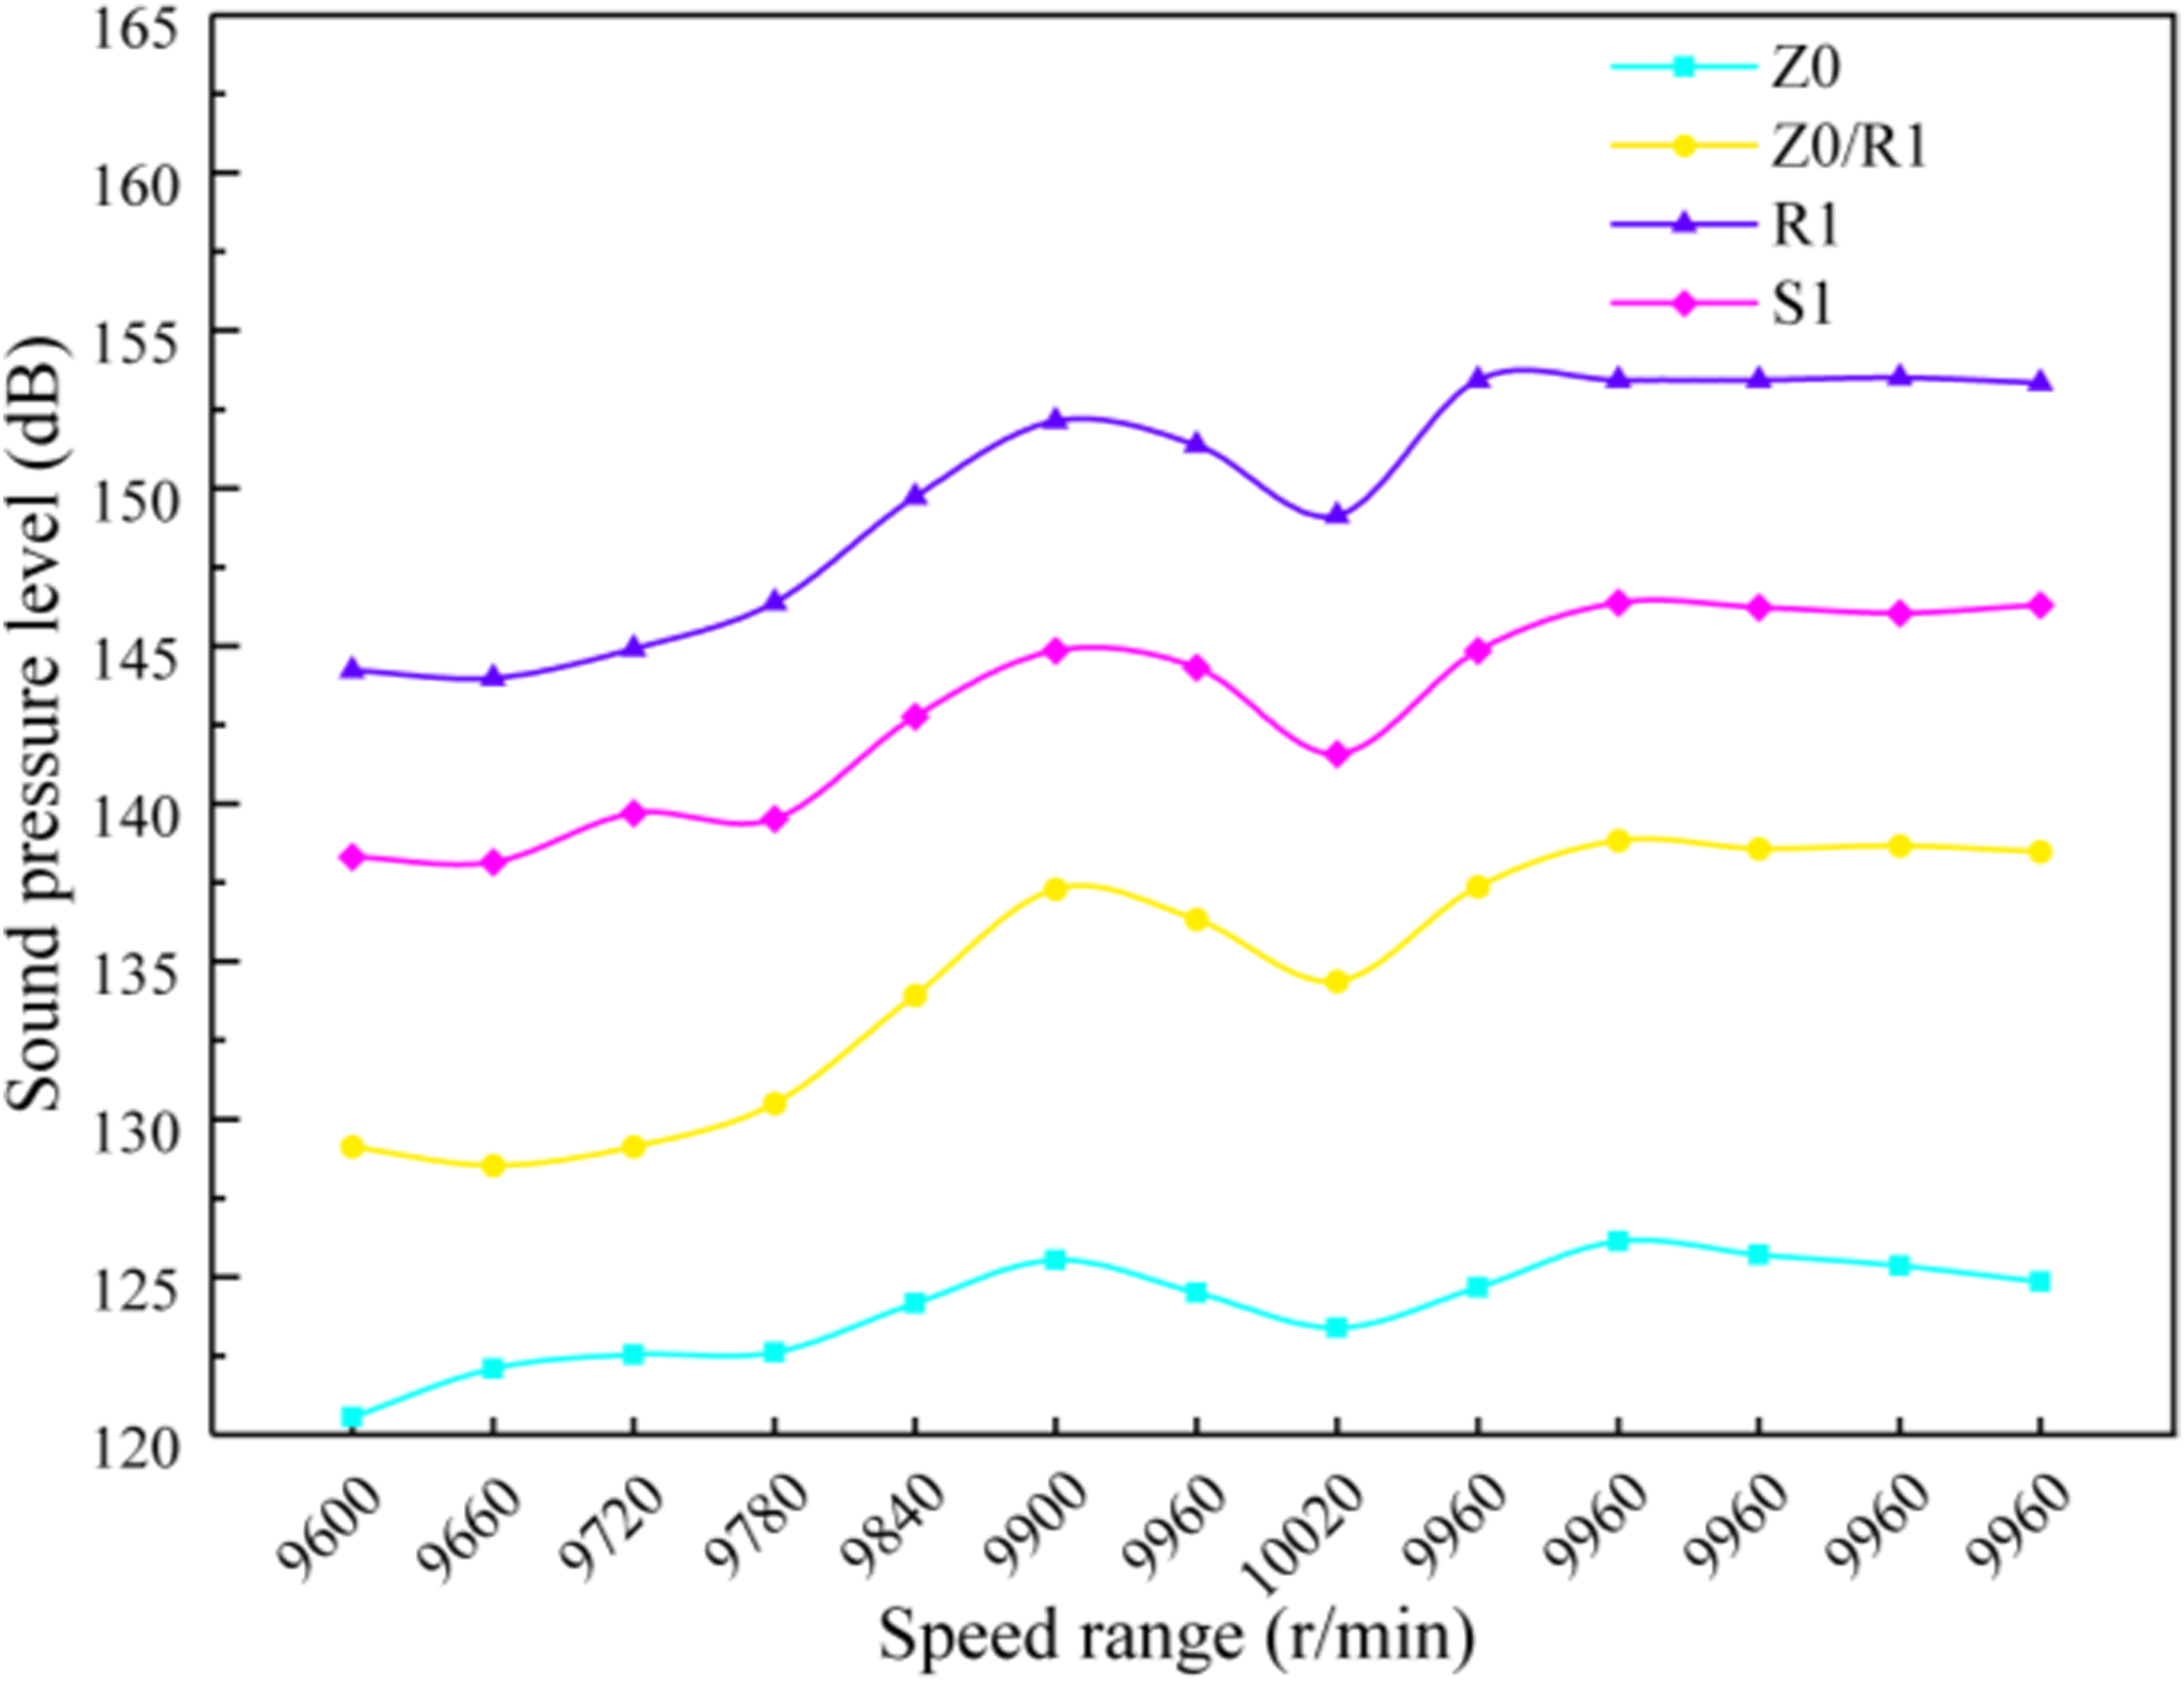
The sound pressure level of the noise signal measured at four different measurement points along the axial direction of the compressor at the characteristic frequency of 1402 Hz is the highest, before and after the occurrence of significant vibration of the high-pressure R1. This phenomenon is present at all speed conditions. During the process of rotor blade vibration from normal to abnormal, the sound pressure level of all measured noise signals at this characteristic frequency gradually increases. During the vibration process of R1 from normal to abnormal, the sound pressure level of characteristic frequency all gradually grows up at all measured positions. The sound pressure level of noise signals at the characteristic frequency reaches the maximum at the time of occurrence of vibration of R1 with the highest amplitude, and the sound pressure level of characteristic frequency directly above R1 is the highest at all measurement points, which is up to 154 dB. During the above process, the total sound pressure level directly above the rotor blade is about 31 dB higher than that at the channel of the Z0, about 20 dB higher than that between the Z0 and R1, and about 12 dB higher than that at the channel of S1. The total sound pressure level directly above R1 is up to 174 dB.
Synchronous analysis is conducted on the vibration status of rotor blades and the characteristic frequency of the noise signal to establish the corresponding relationship between the vibration of high pressure R1 and the internal noise signal of the compressor flow channel. During the experiment, the deflection angles of Z0 and stator adjustable blades are adjusted to change the operation condition of the compressor. The corresponding relationship between the vibration displacement of the high-pressure R1 and the sound pressure level of the noise signal characteristic frequency near 1402 Hz is shown in Figure 6. Noise and vibration variation laws under different operating conditions.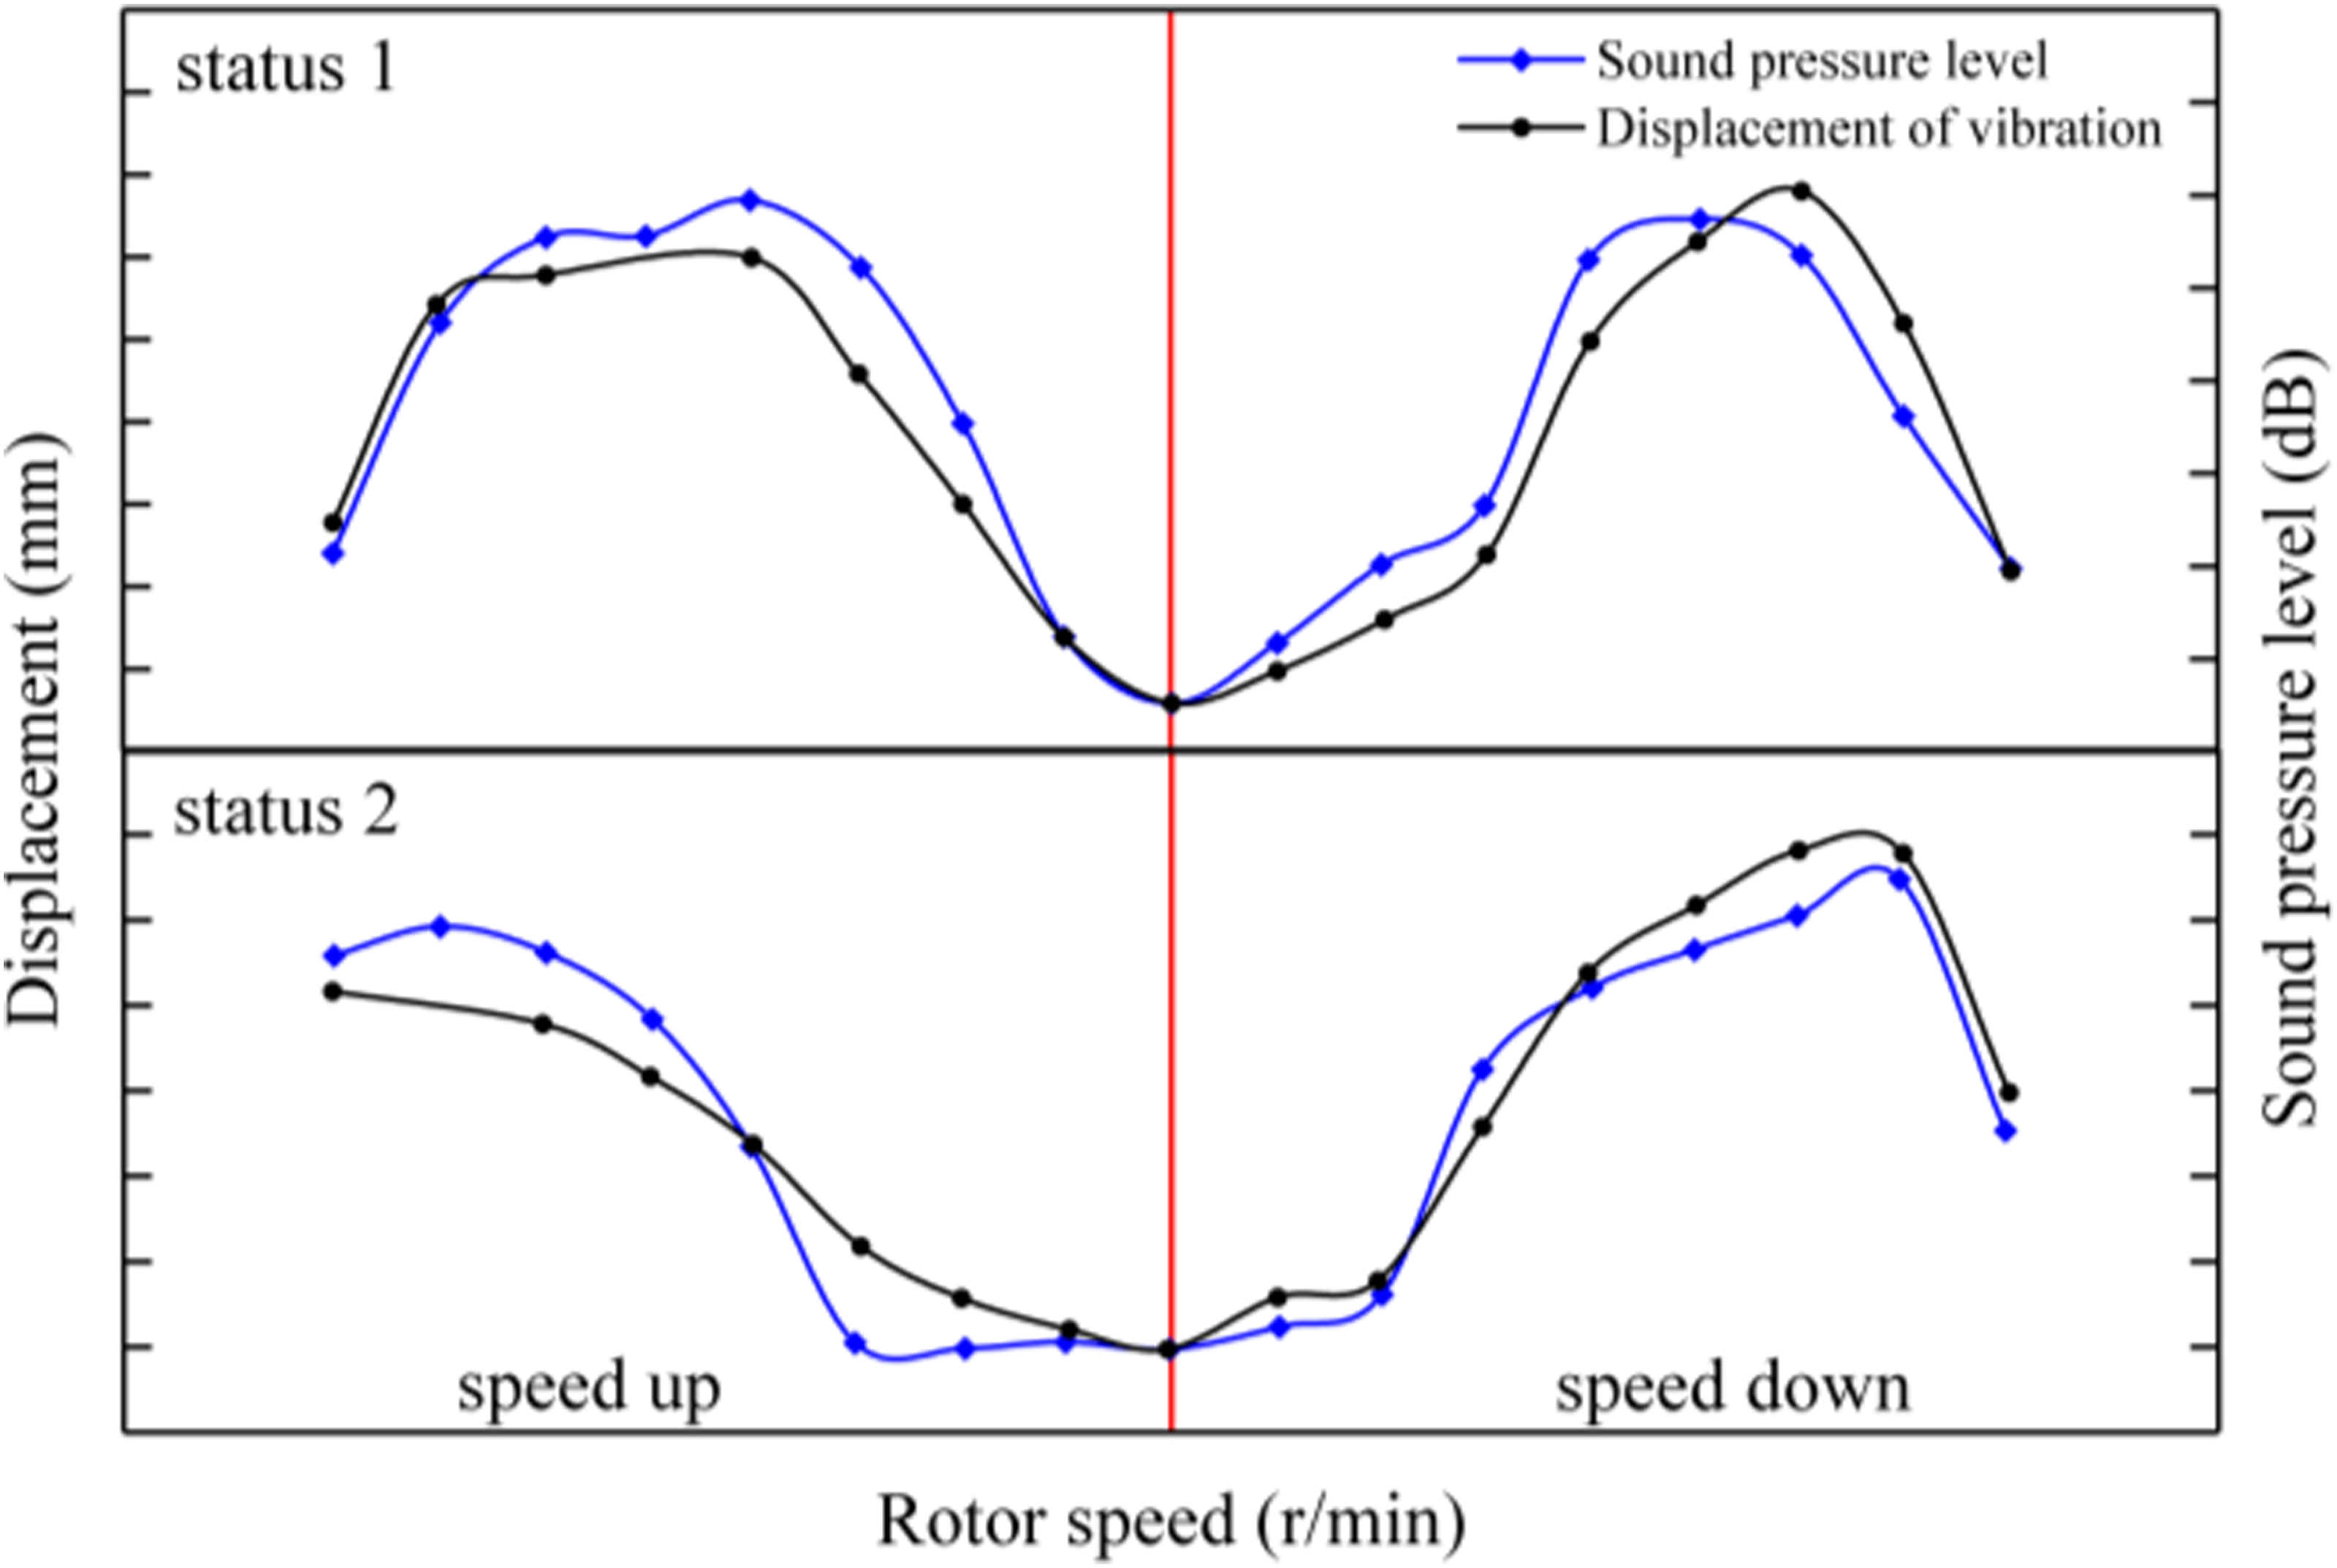
It is obvious that the variation trend of the vibration amplitude of the high pressure R1 is highly consistent with the change of the sound pressure level at the characteristic frequency of the noise signal measured directly above the rotor blade. When the amplitude of blade vibration reaches maximum, the sound pressure level of the noise signal at the characteristic frequency is also the highest. The speed range of vibration with high amplitude in R1 takes change under different structural adjustment states of the high pressure compressor, and the range of the present of characteristic frequency noise signals is also shift. Therefore, the characteristic frequency peak at 1402 Hz must be tightly related to the vibration of the high-pressure R1, meanwhile, it also demonstrates the feasibility of the method for analyzing the coupling between acoustic and solid from the perspective of internal noise characteristics.
Validation of numerical simulation methods
The problem of sound propagation in pipelines can be found in broad applications regularly. When the radiation of sound waves is present in the pipe, reflection on the pipe wall will form a secondary sound source, which is combined with the radiation sound field in the fluid to form a complex sound field. Therefore, the numerical simulation of it requires high-precision numerical methods and precise boundary conditions. To reduce the computational complexity under the premise of ensuring the accuracy of the calculation, the aerodynamic acoustic calculation of the circular tube square cavity structure is carried out from the perspective of decoupling between the flow field and the sound field. Ziada studied the high-intensity sound of the circular tube square cavity structure and determined the characteristic frequencies of the circular tube square cavity structure at different orders.
28
Therefore, this article takes the circular tube square cavity model to study the characteristics of high-intensity sound by the method of decoupling between the flow field and sound field, the dimensions of the circular tube square cavity model are shown in Figure 7. A diagram of a circular tube square cavity model.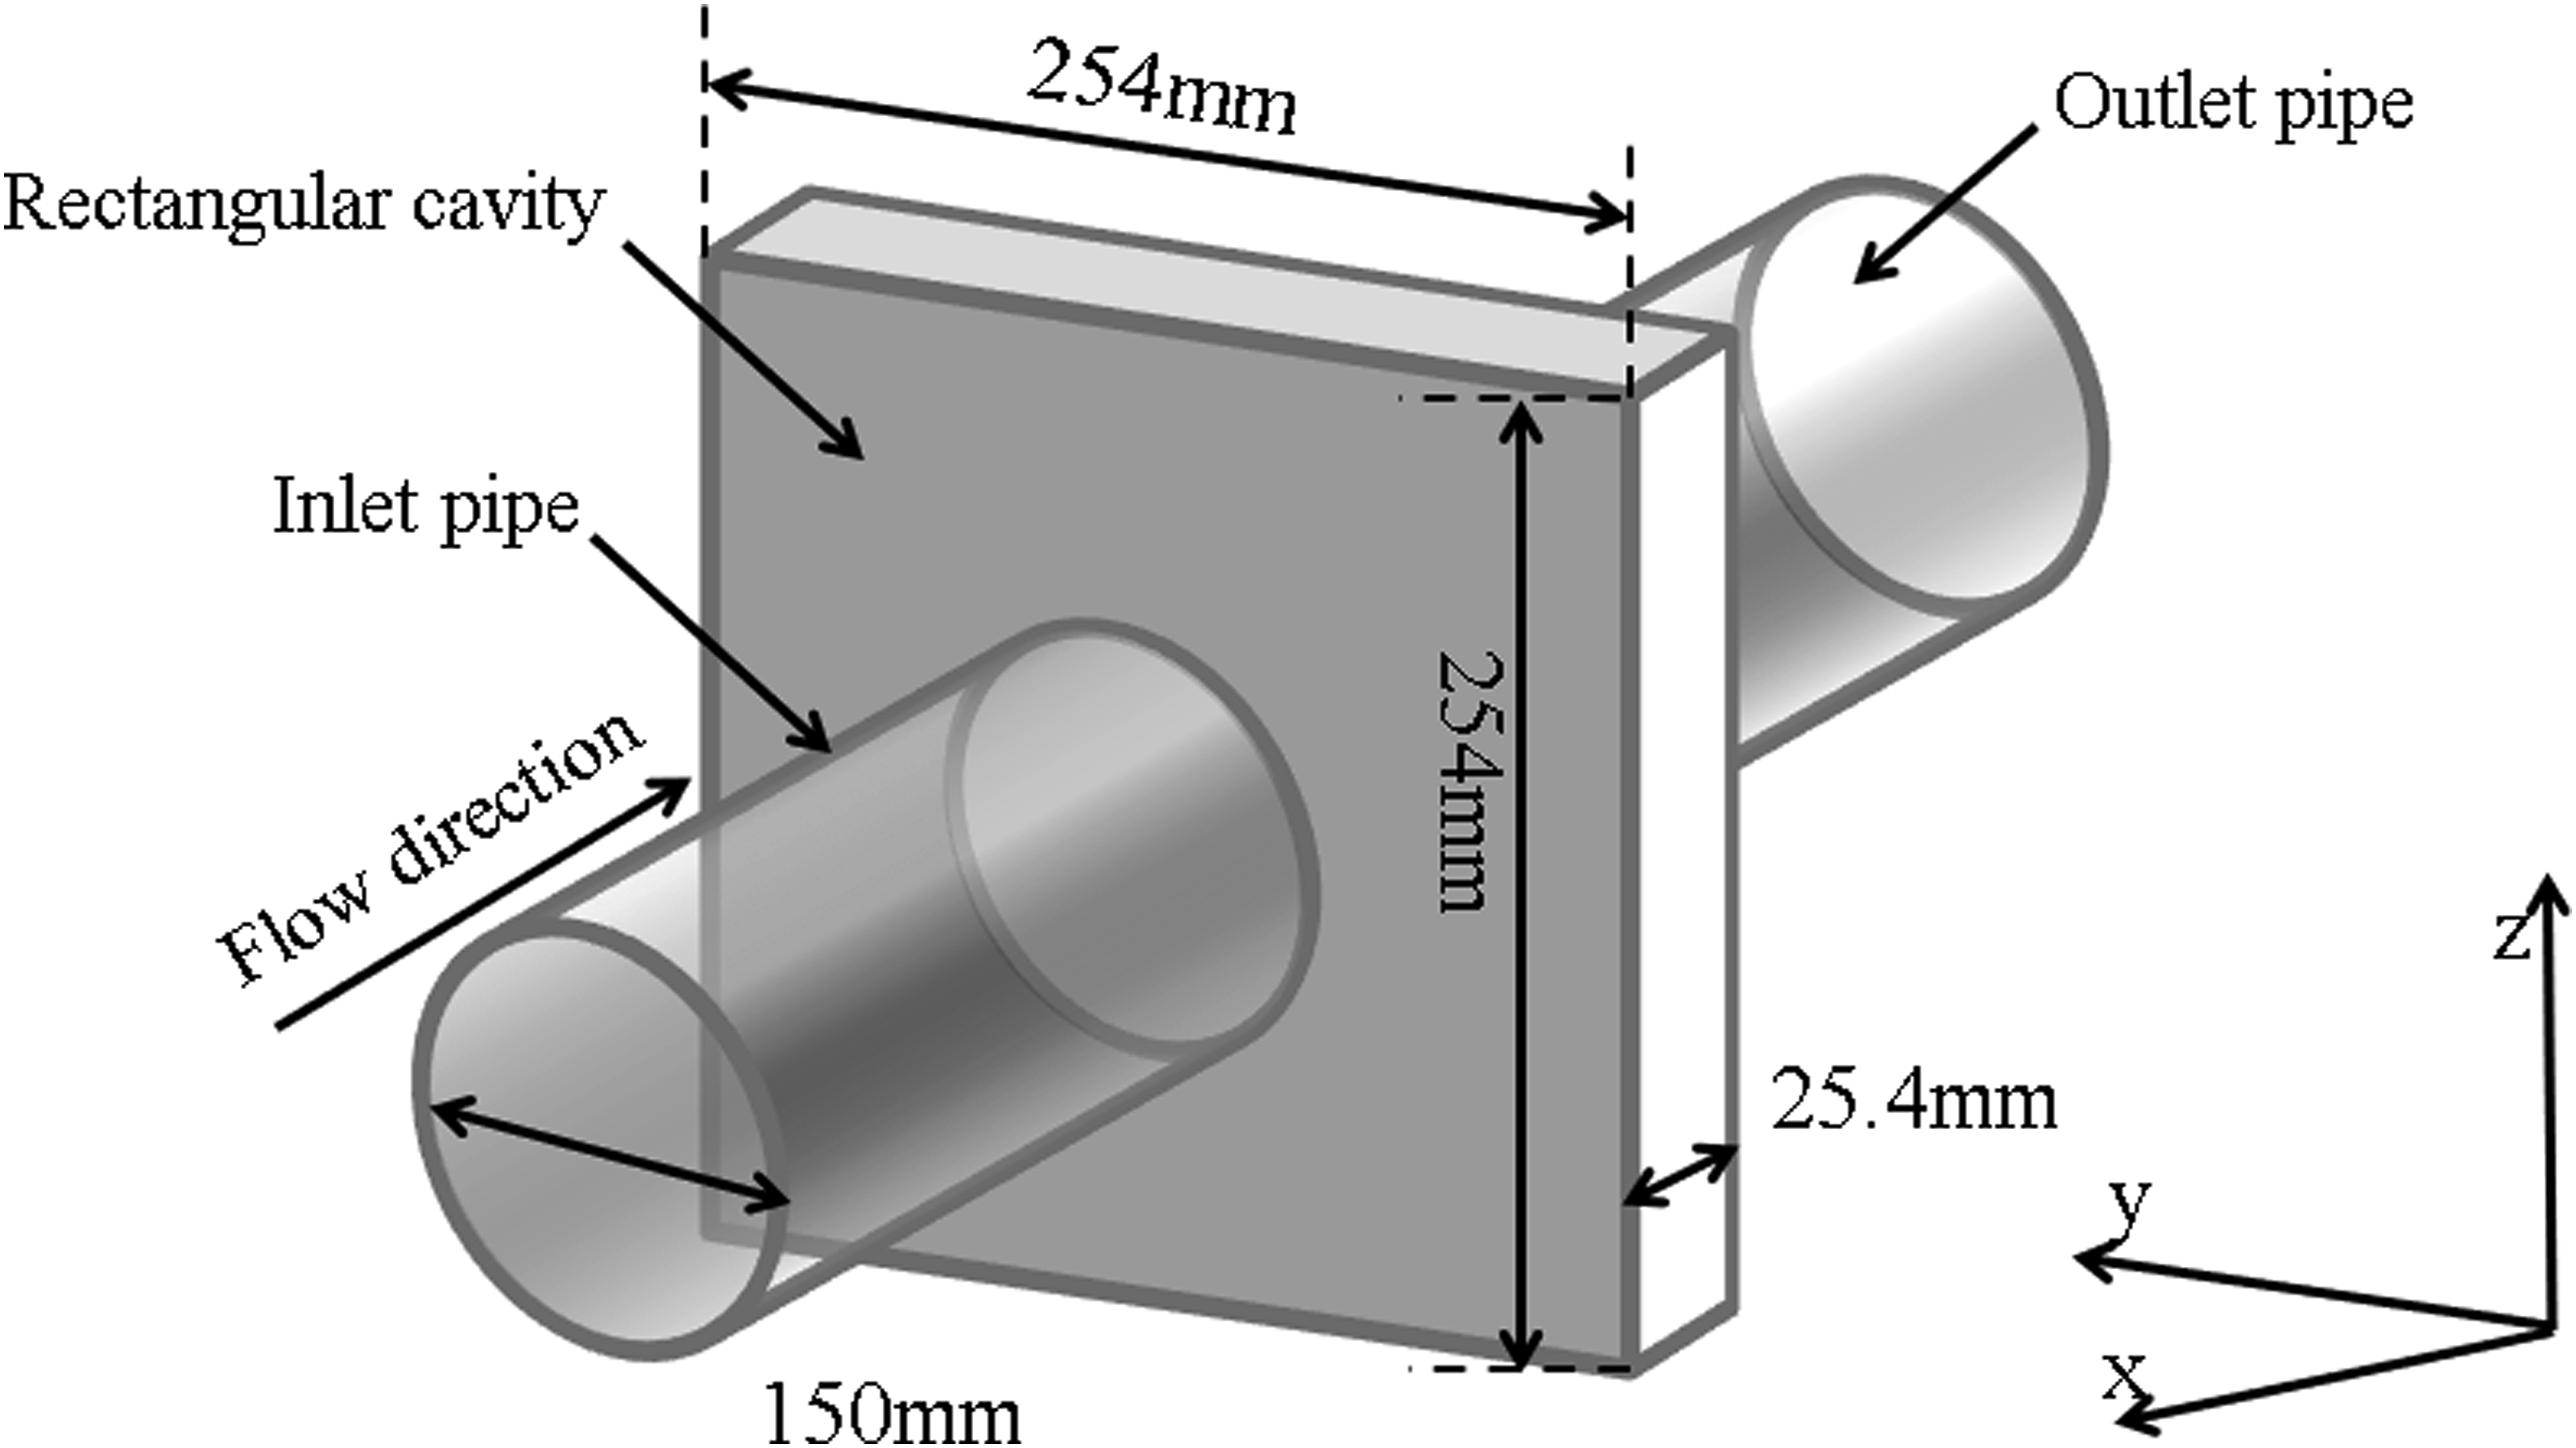
The method of aerodynamic acoustic calculation for the decoupling angle between flow field and sound field requires first conducting flow simulation flow field of the structure. Structured grid is selected for meshing the circular tube square cavity model with the maximum grid size of 2 mm. The grid in the boundary layer region of the wall is refined, the minimum grid size is set to 0.01 mm, the growth ratio is set to 1.1, the number of grids is close to 5,000,000. In order to ensure the stability of transient analysis, steady state analysis should be conducted first, and Sound propagation simulation model.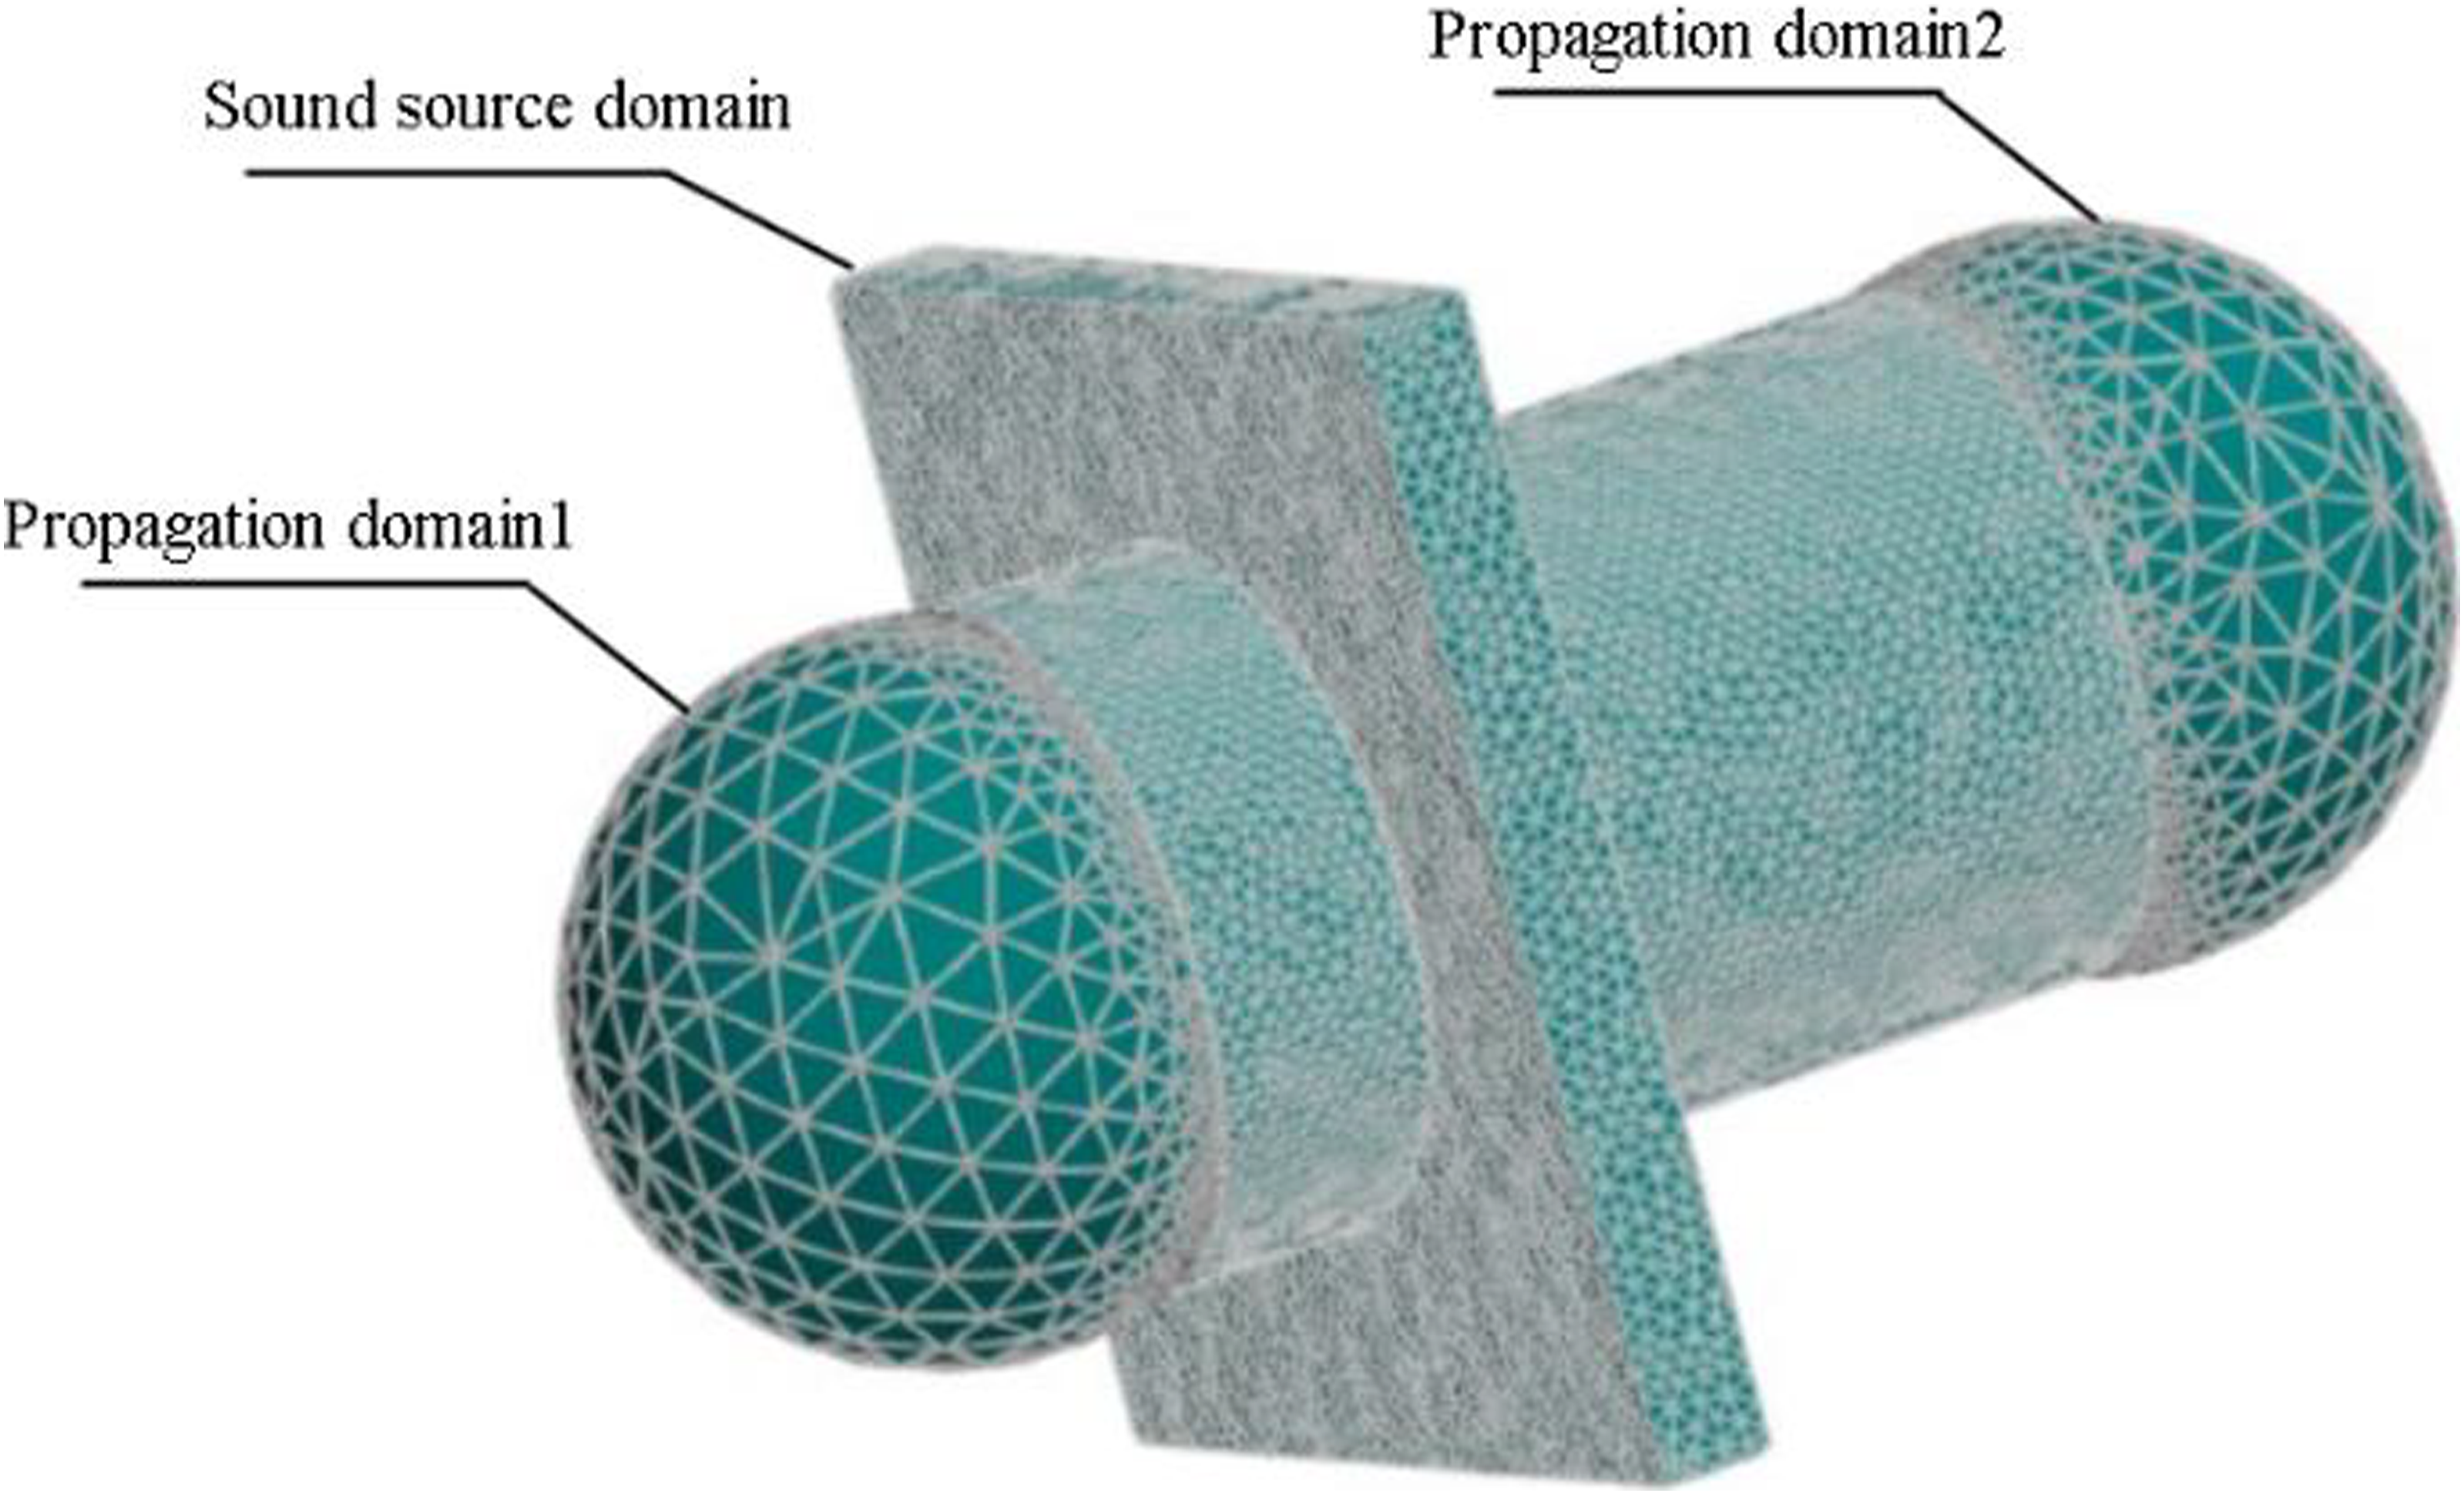
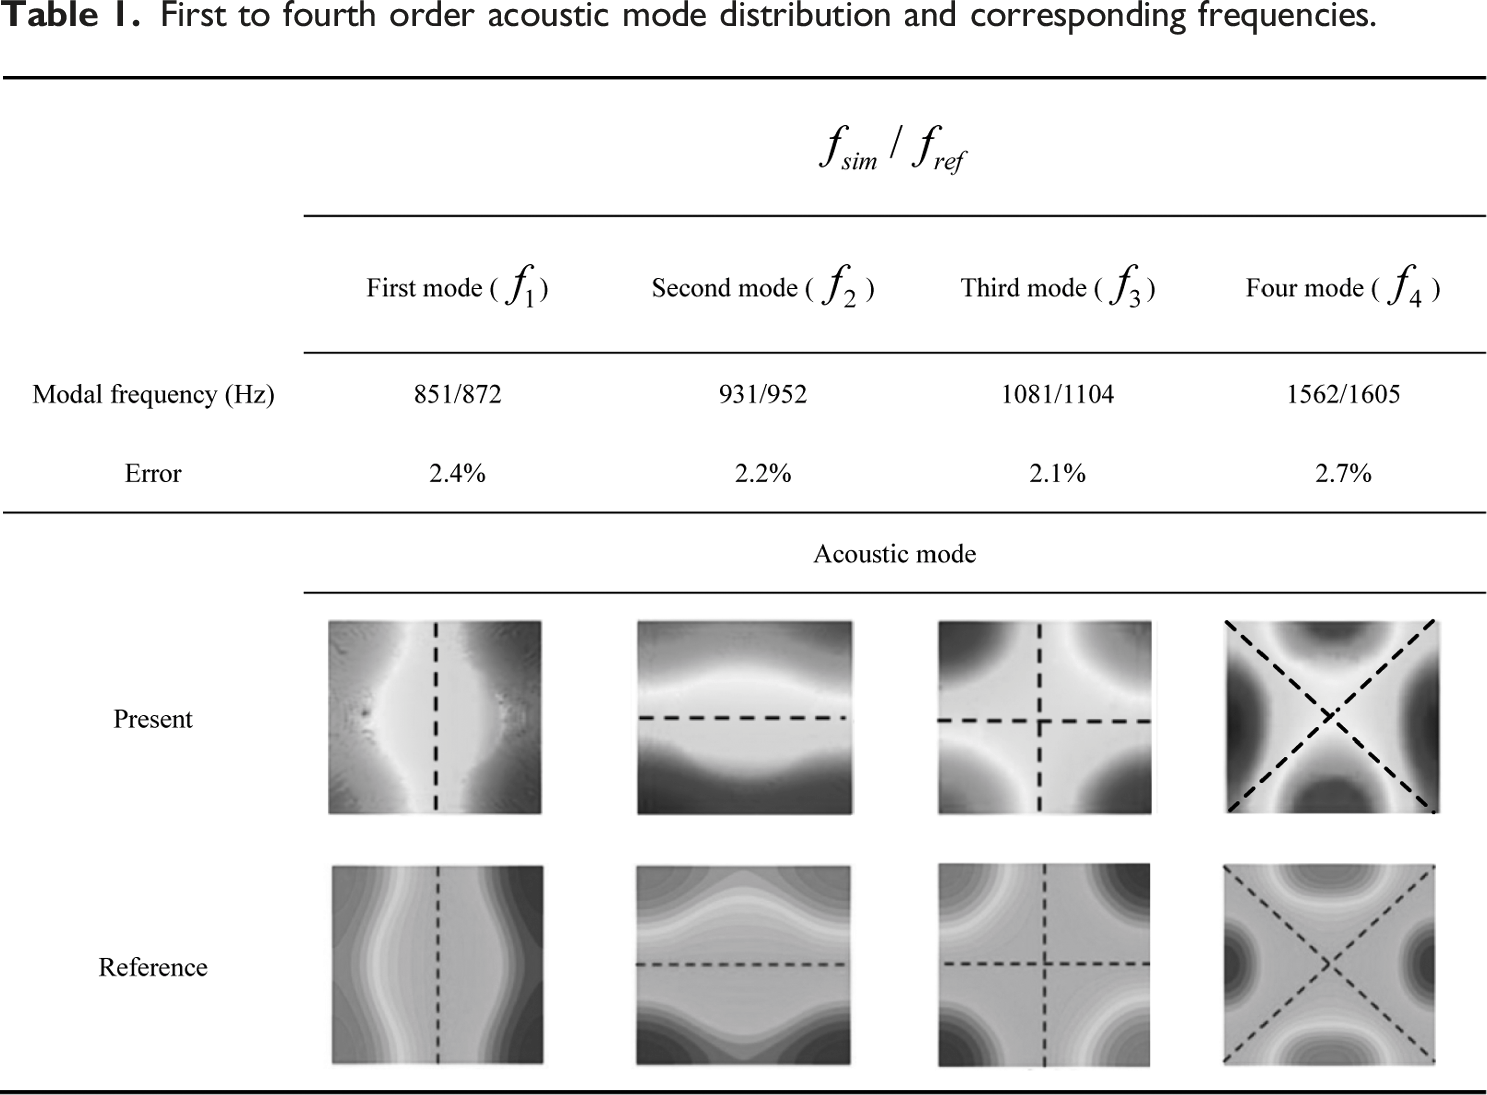
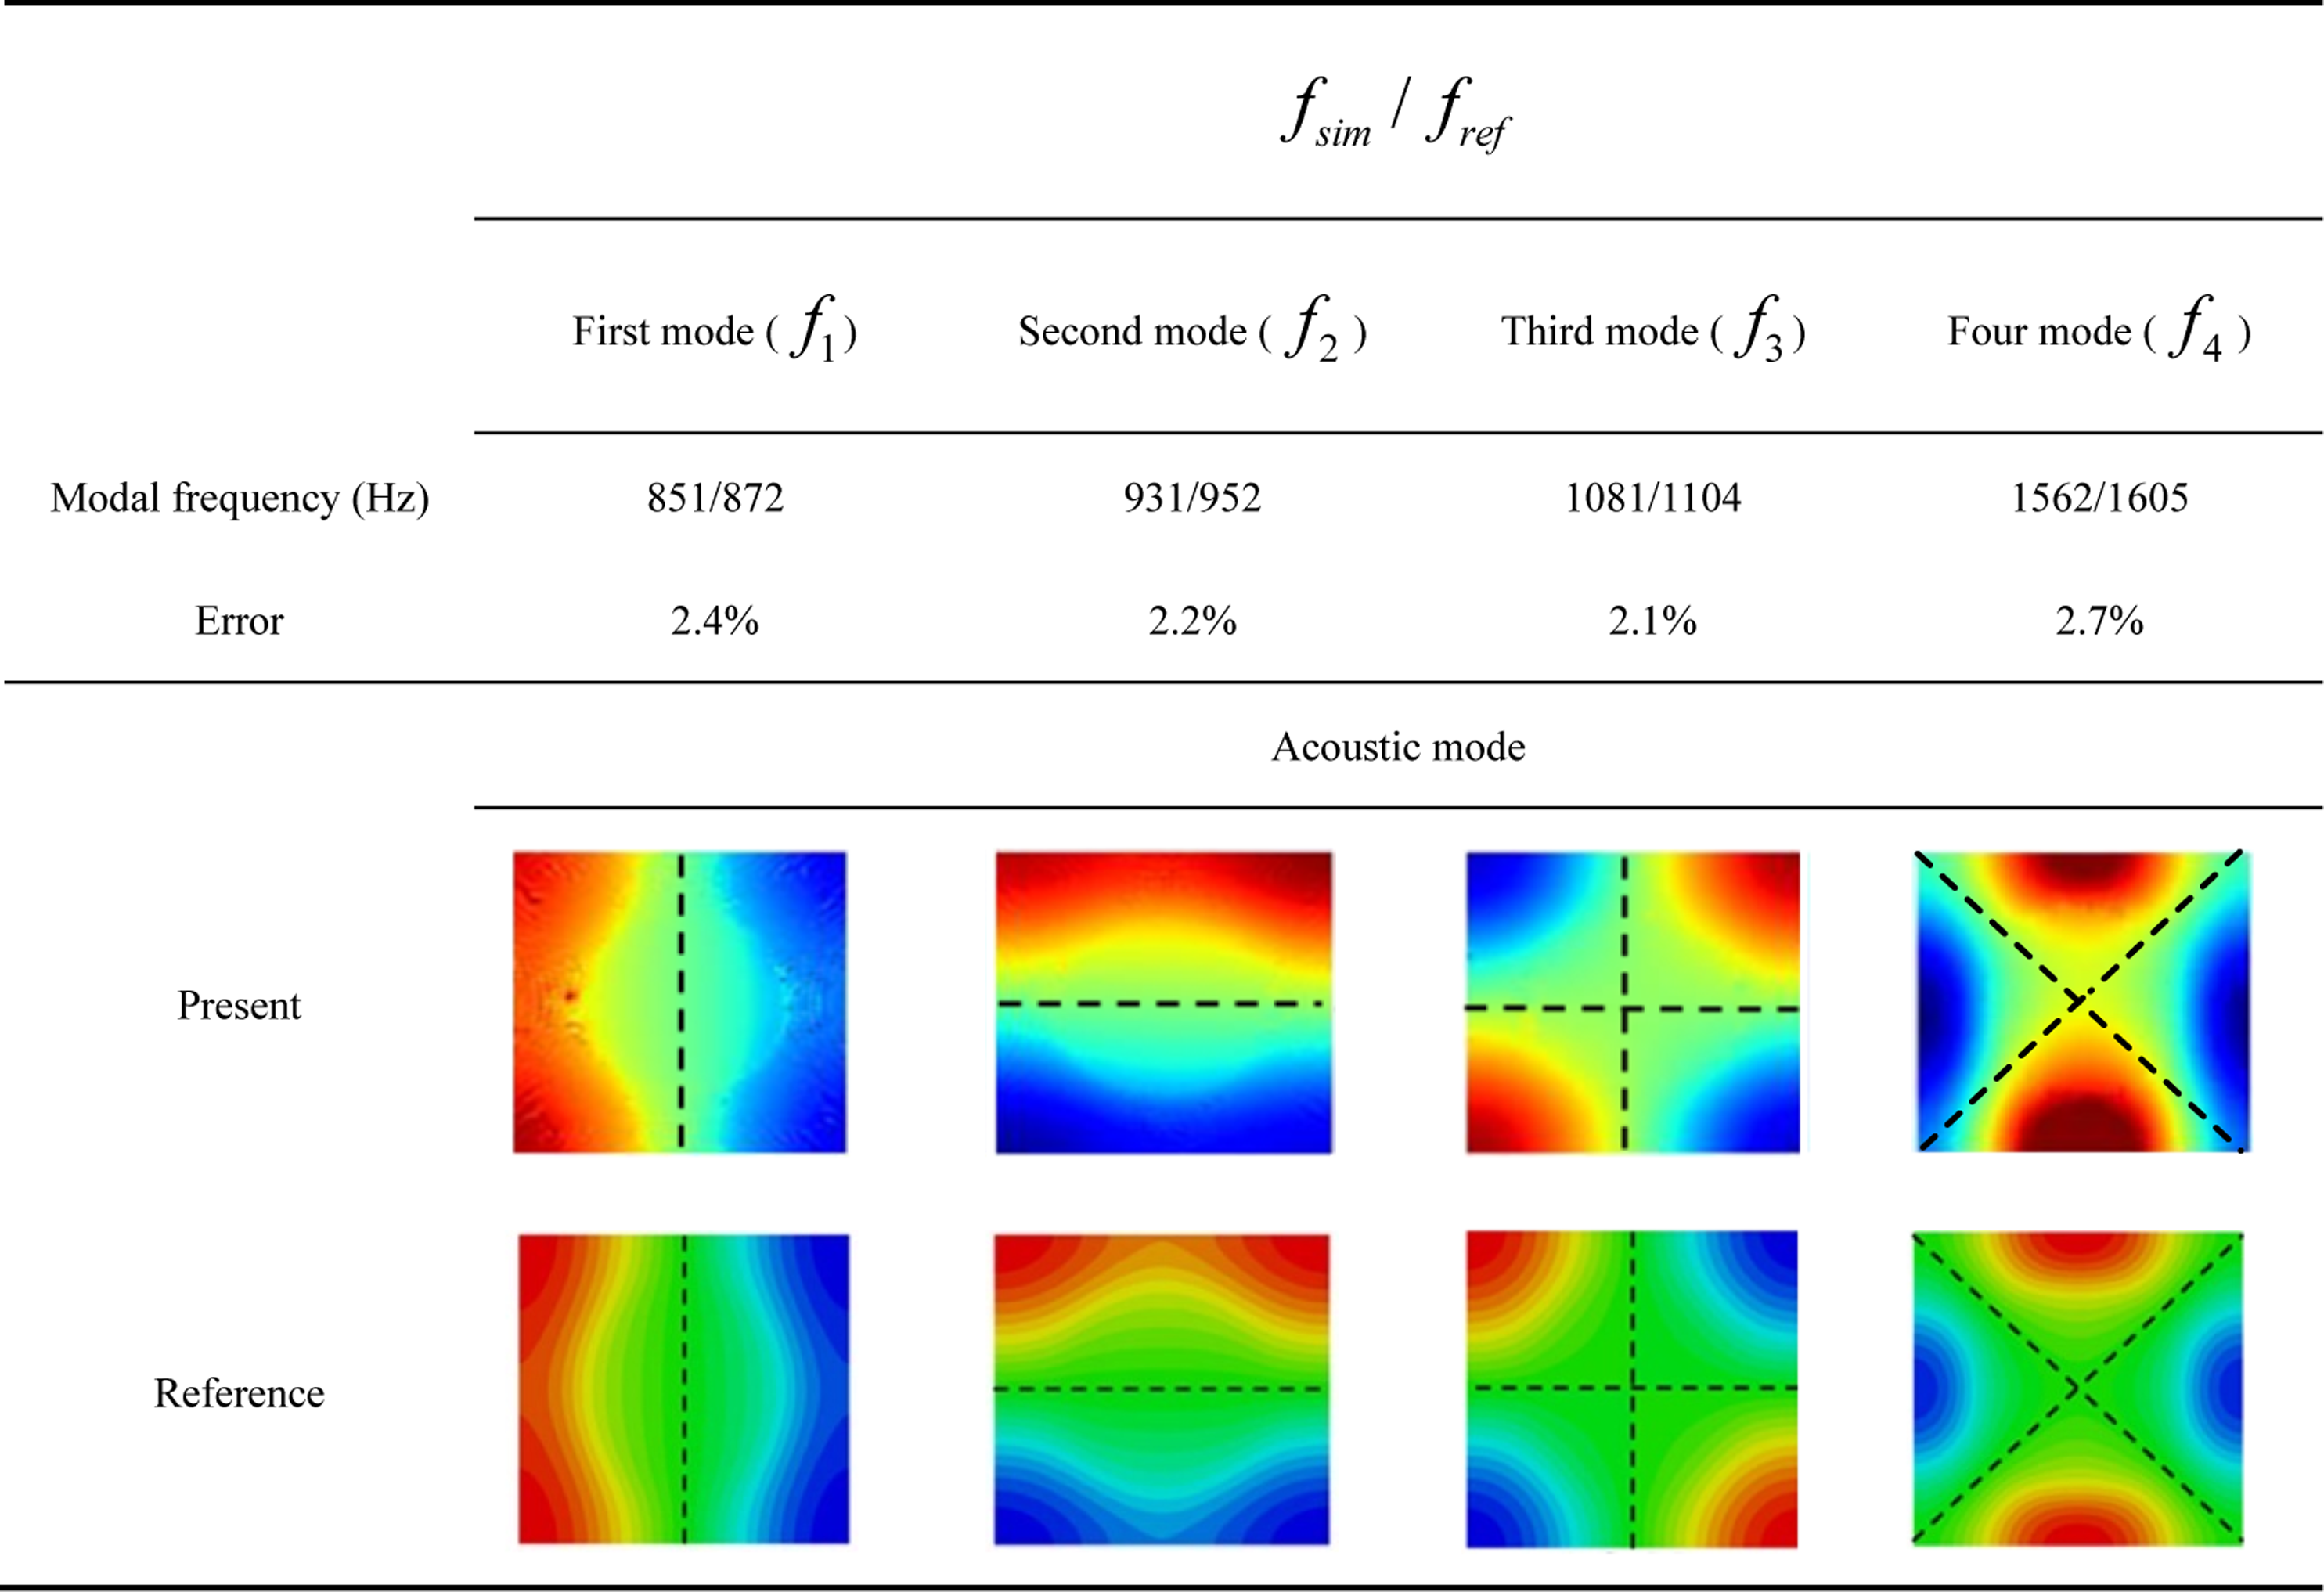
First to fourth order acoustic mode distribution and corresponding frequencies.
Acoustic response in annular disk cavity model
Numerical simulation studies
In the experimental research of the compressor noise, abnormal vibration of R1 and high-intensity noise of the compressor are detected, and the evolution law of the characteristic frequency signal is discovered when the high-intensity sound occurs. Therefore, a circular disk cavity model, based on the principle of acoustic feature similarity, is established to reproduce the typical characteristics of high-intensity sound in the compressor. The diagram of the annular disk cavity model and structure parameters are shown in Figure 9. Diagram of annular disk cavity model.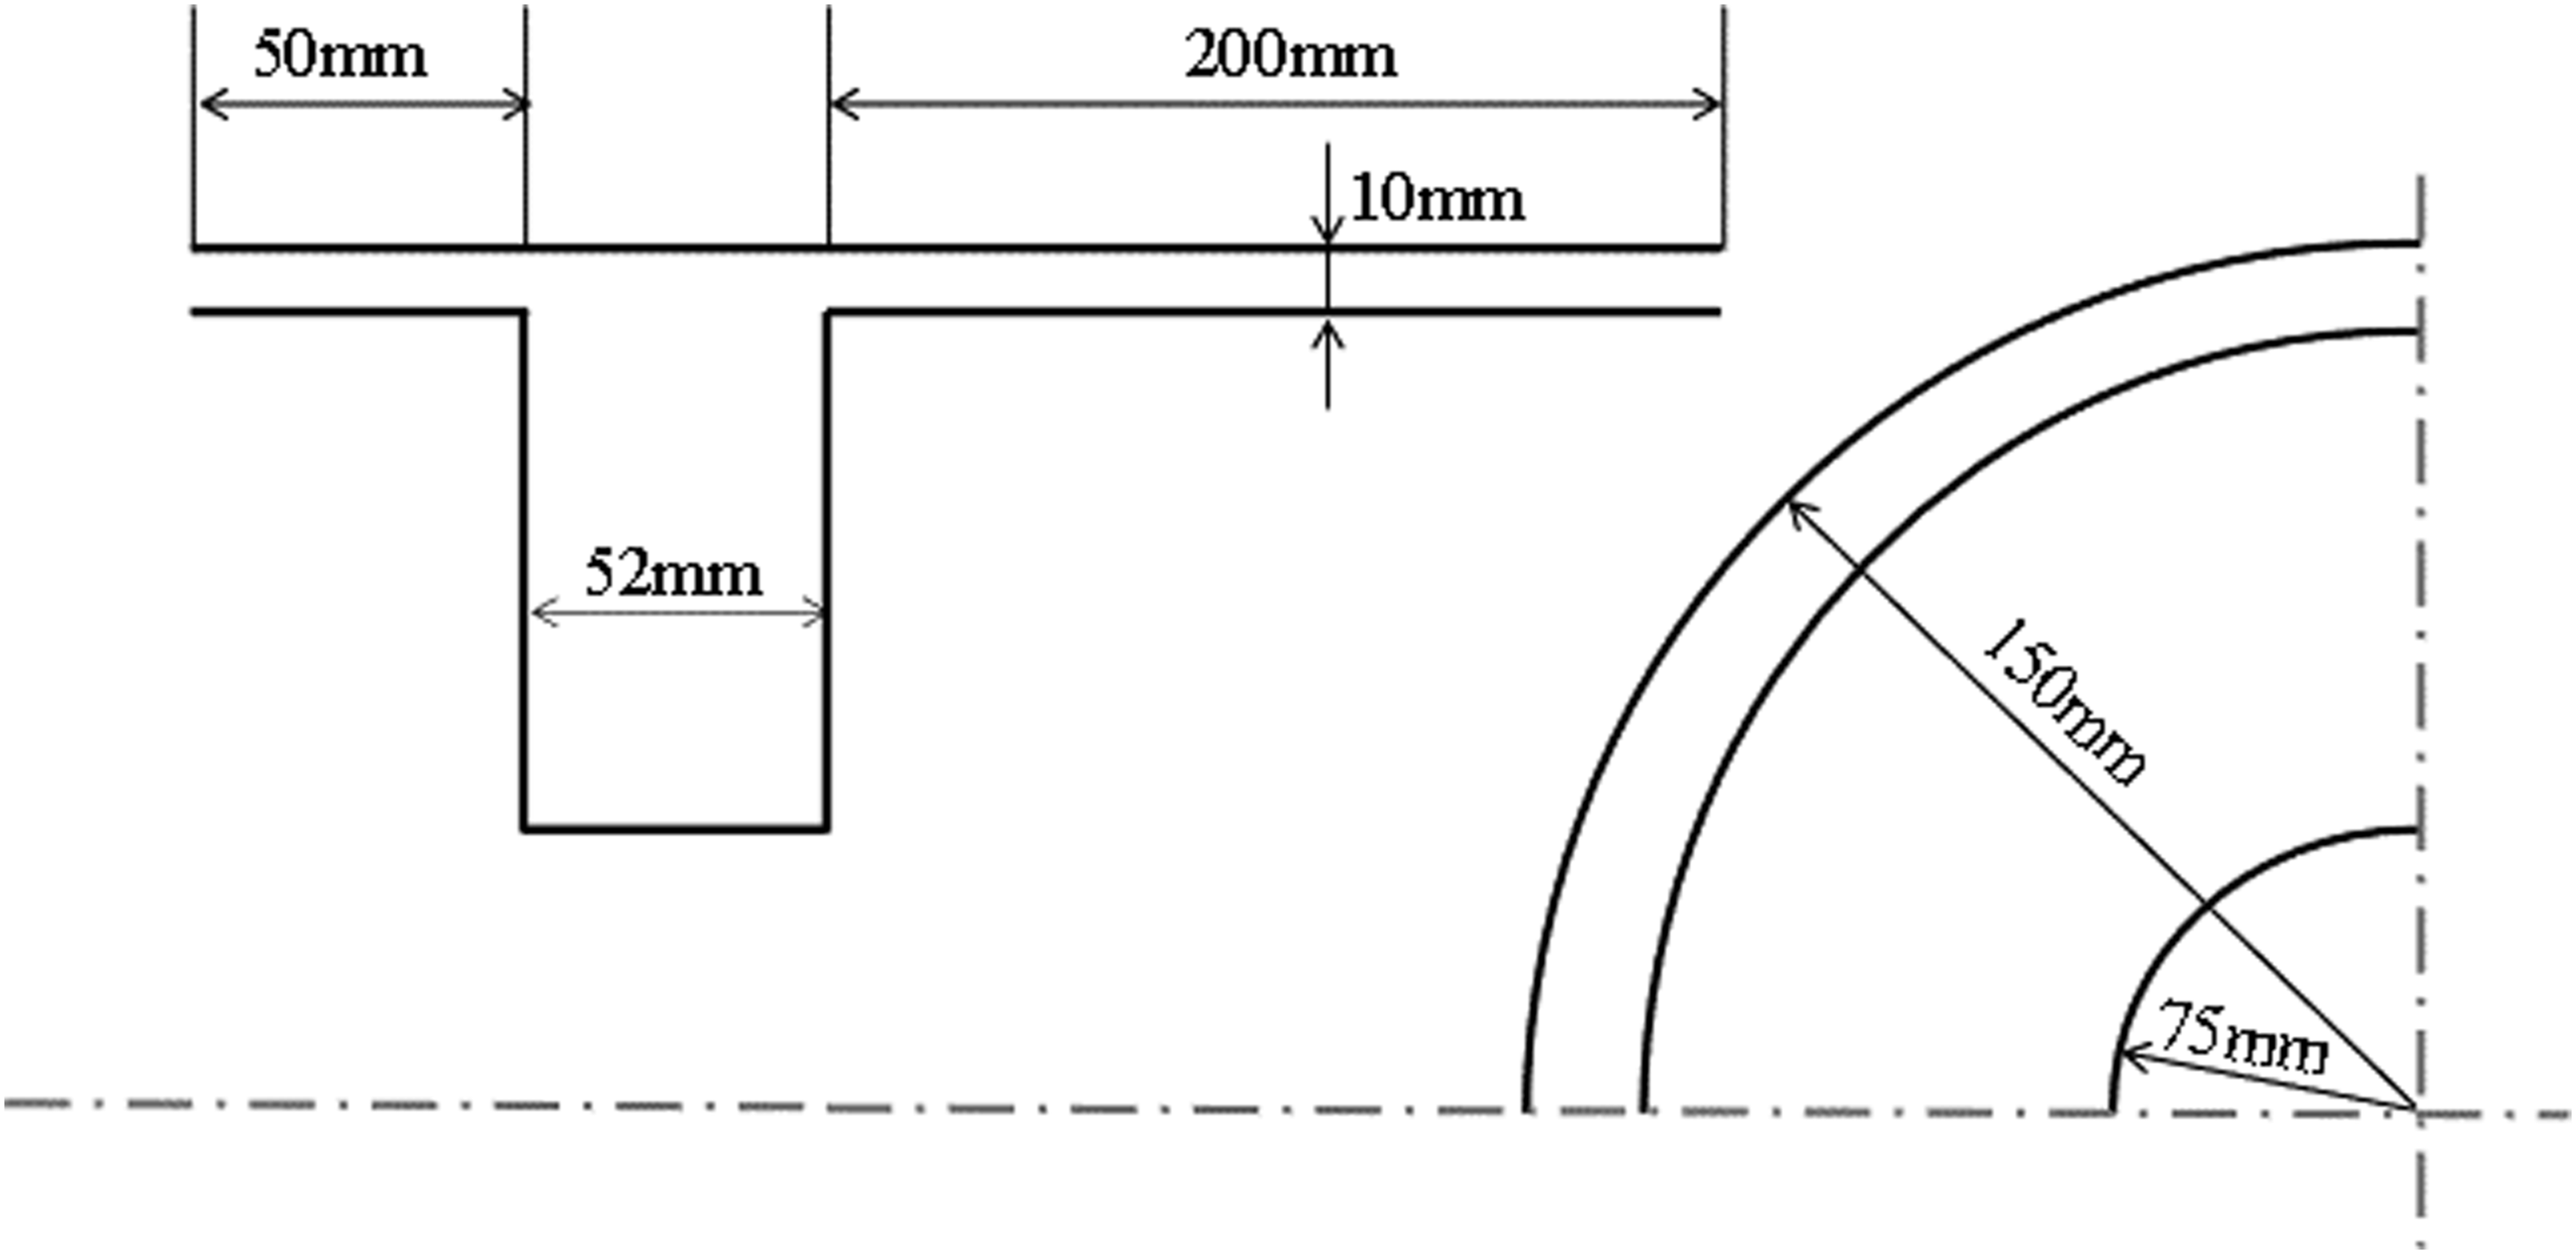
The circular disk cavity model is characterized by periodicity and symmetry, so the 30° region of the whole model is extracted as the calculation domain of the flow field, and compared its results with the results of the complete model as the calculation domain of the flow field, which proved the feasibility of extracting part regions for the calculation of the flow field. A structured grid is selected to divide the model with a maximum grid size of 1.2 mm, and mesh refinement in areas of intense structural change, including the leading edge, trailing edge, and velocity shear layer of the cavity, to capture the vortex in the cavity. Periodic boundary conditions are set on both sides of the structure, and the cavity area is selected as the sound source area, which is shown in Figure 10. Computational model of flow field in annular disk cavity structure.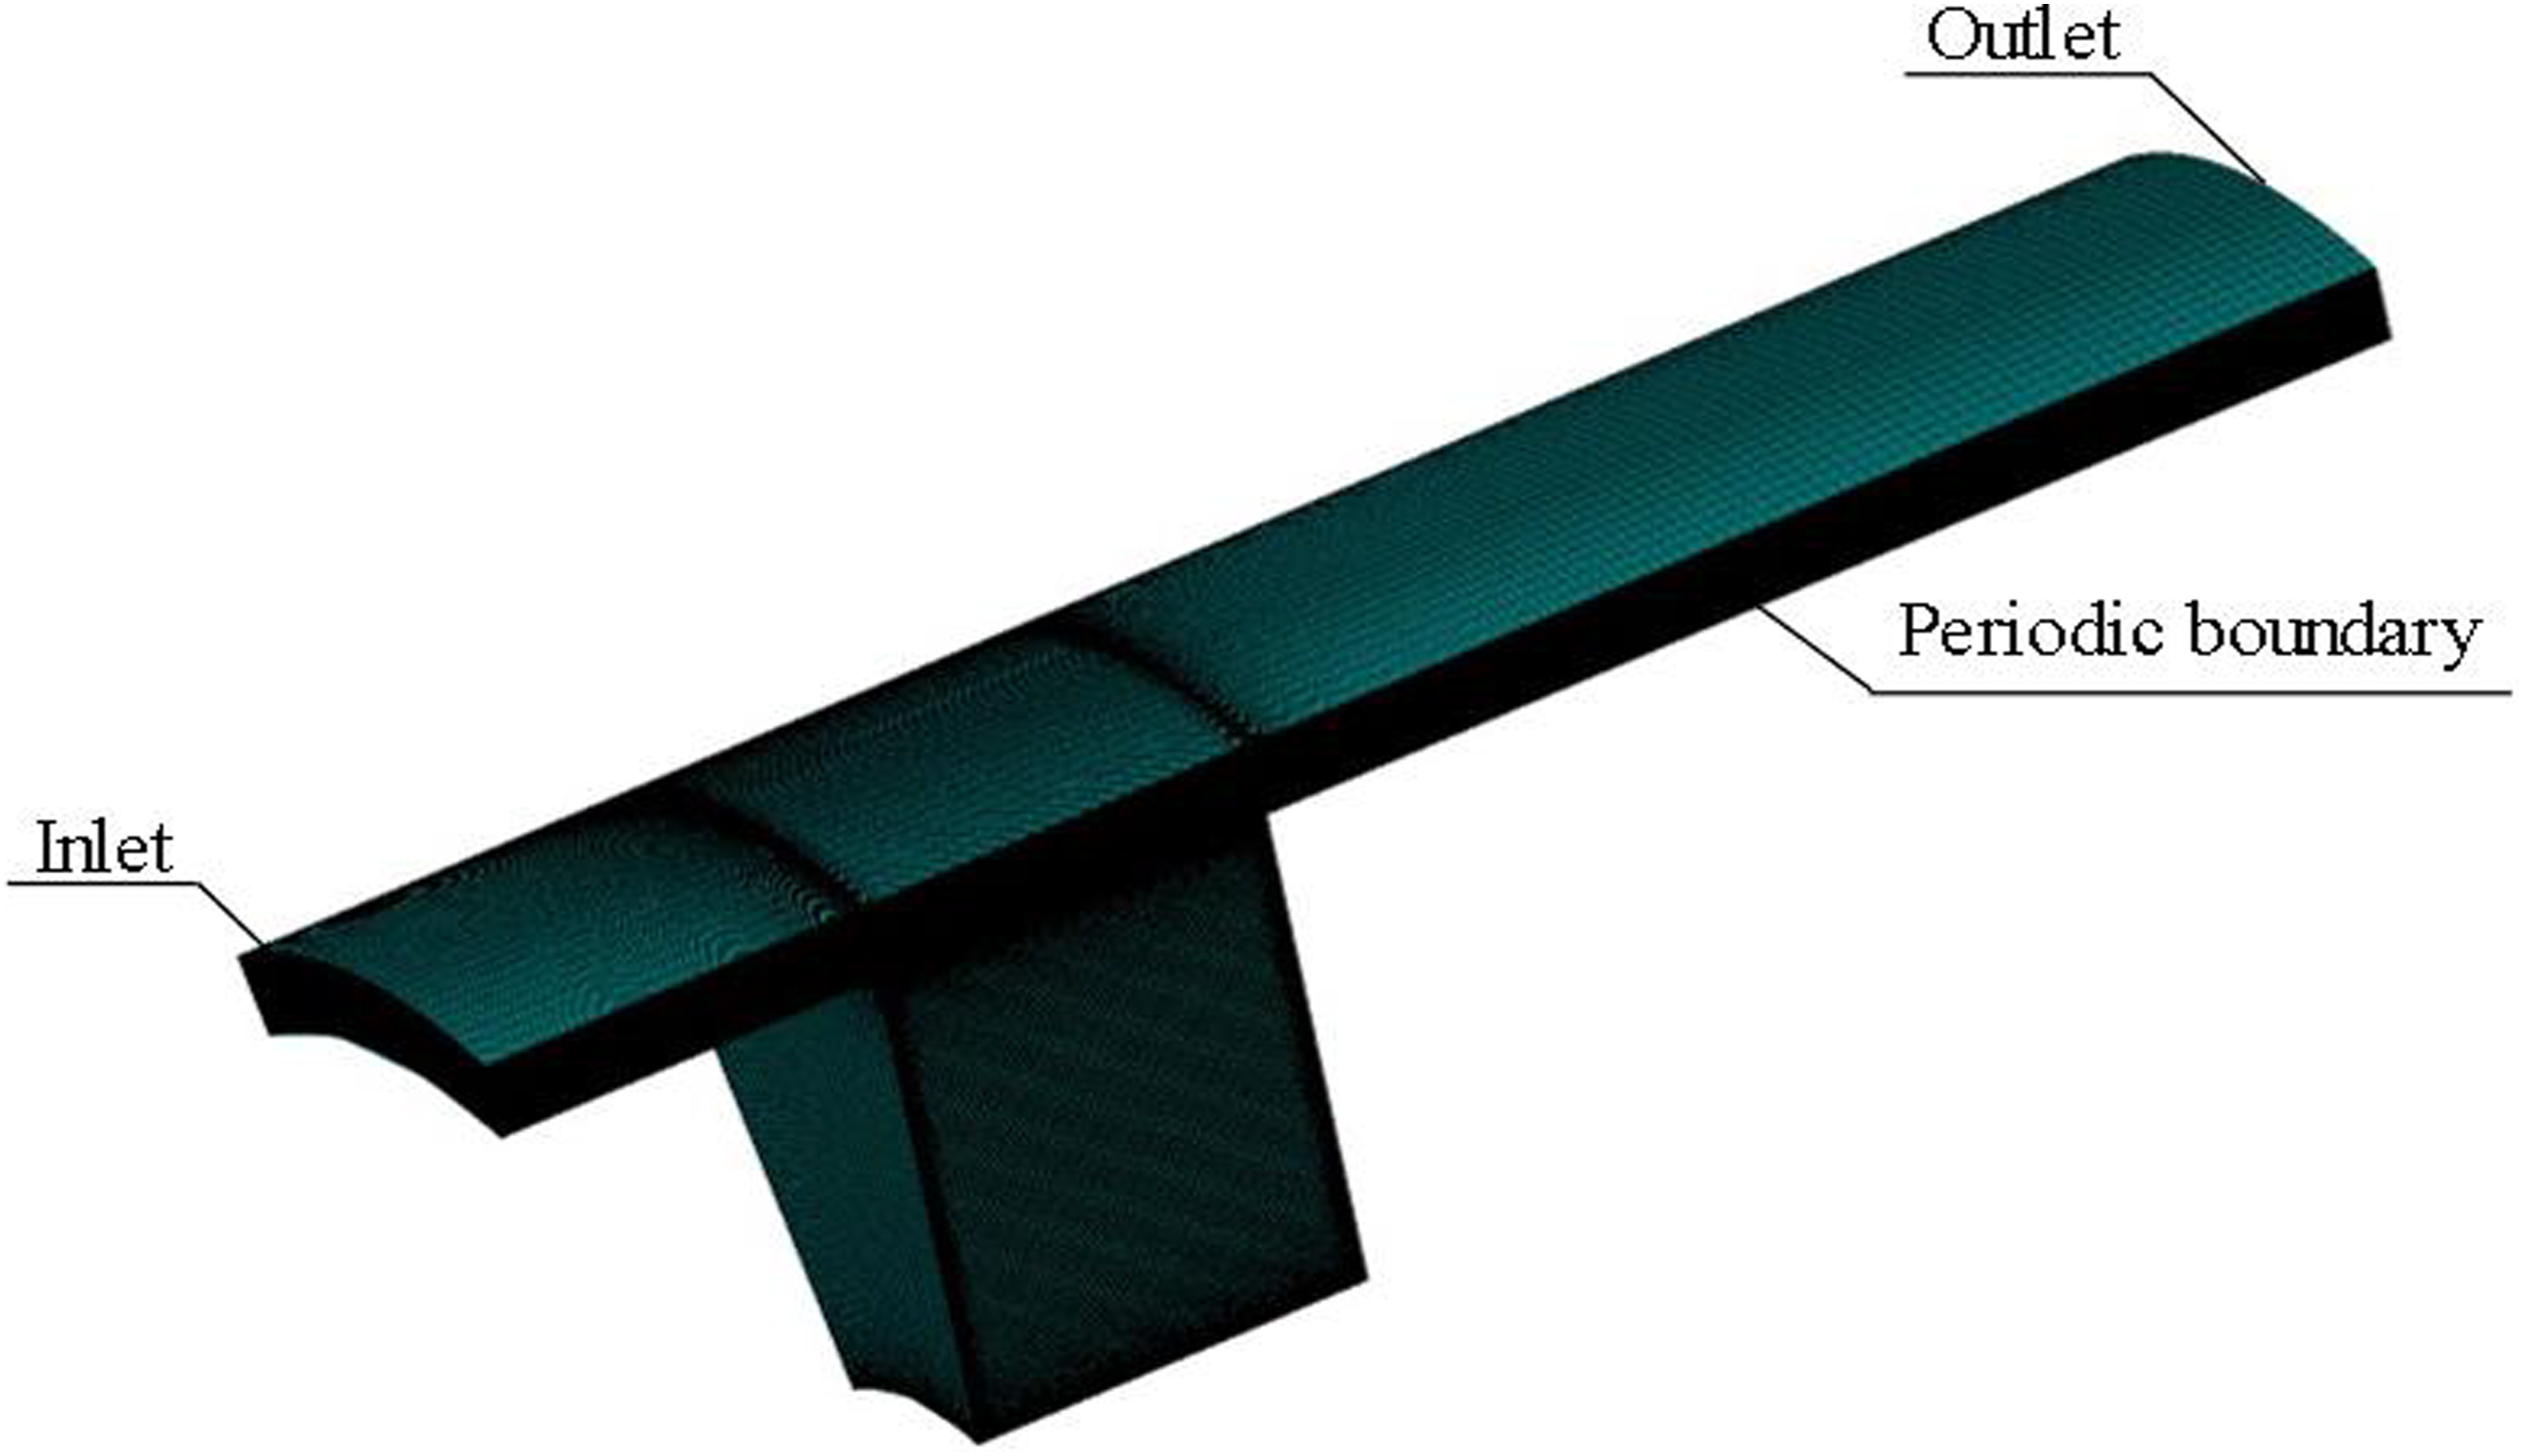
The motion of the vortex in the cavity, which is shown from part (a) to part (d).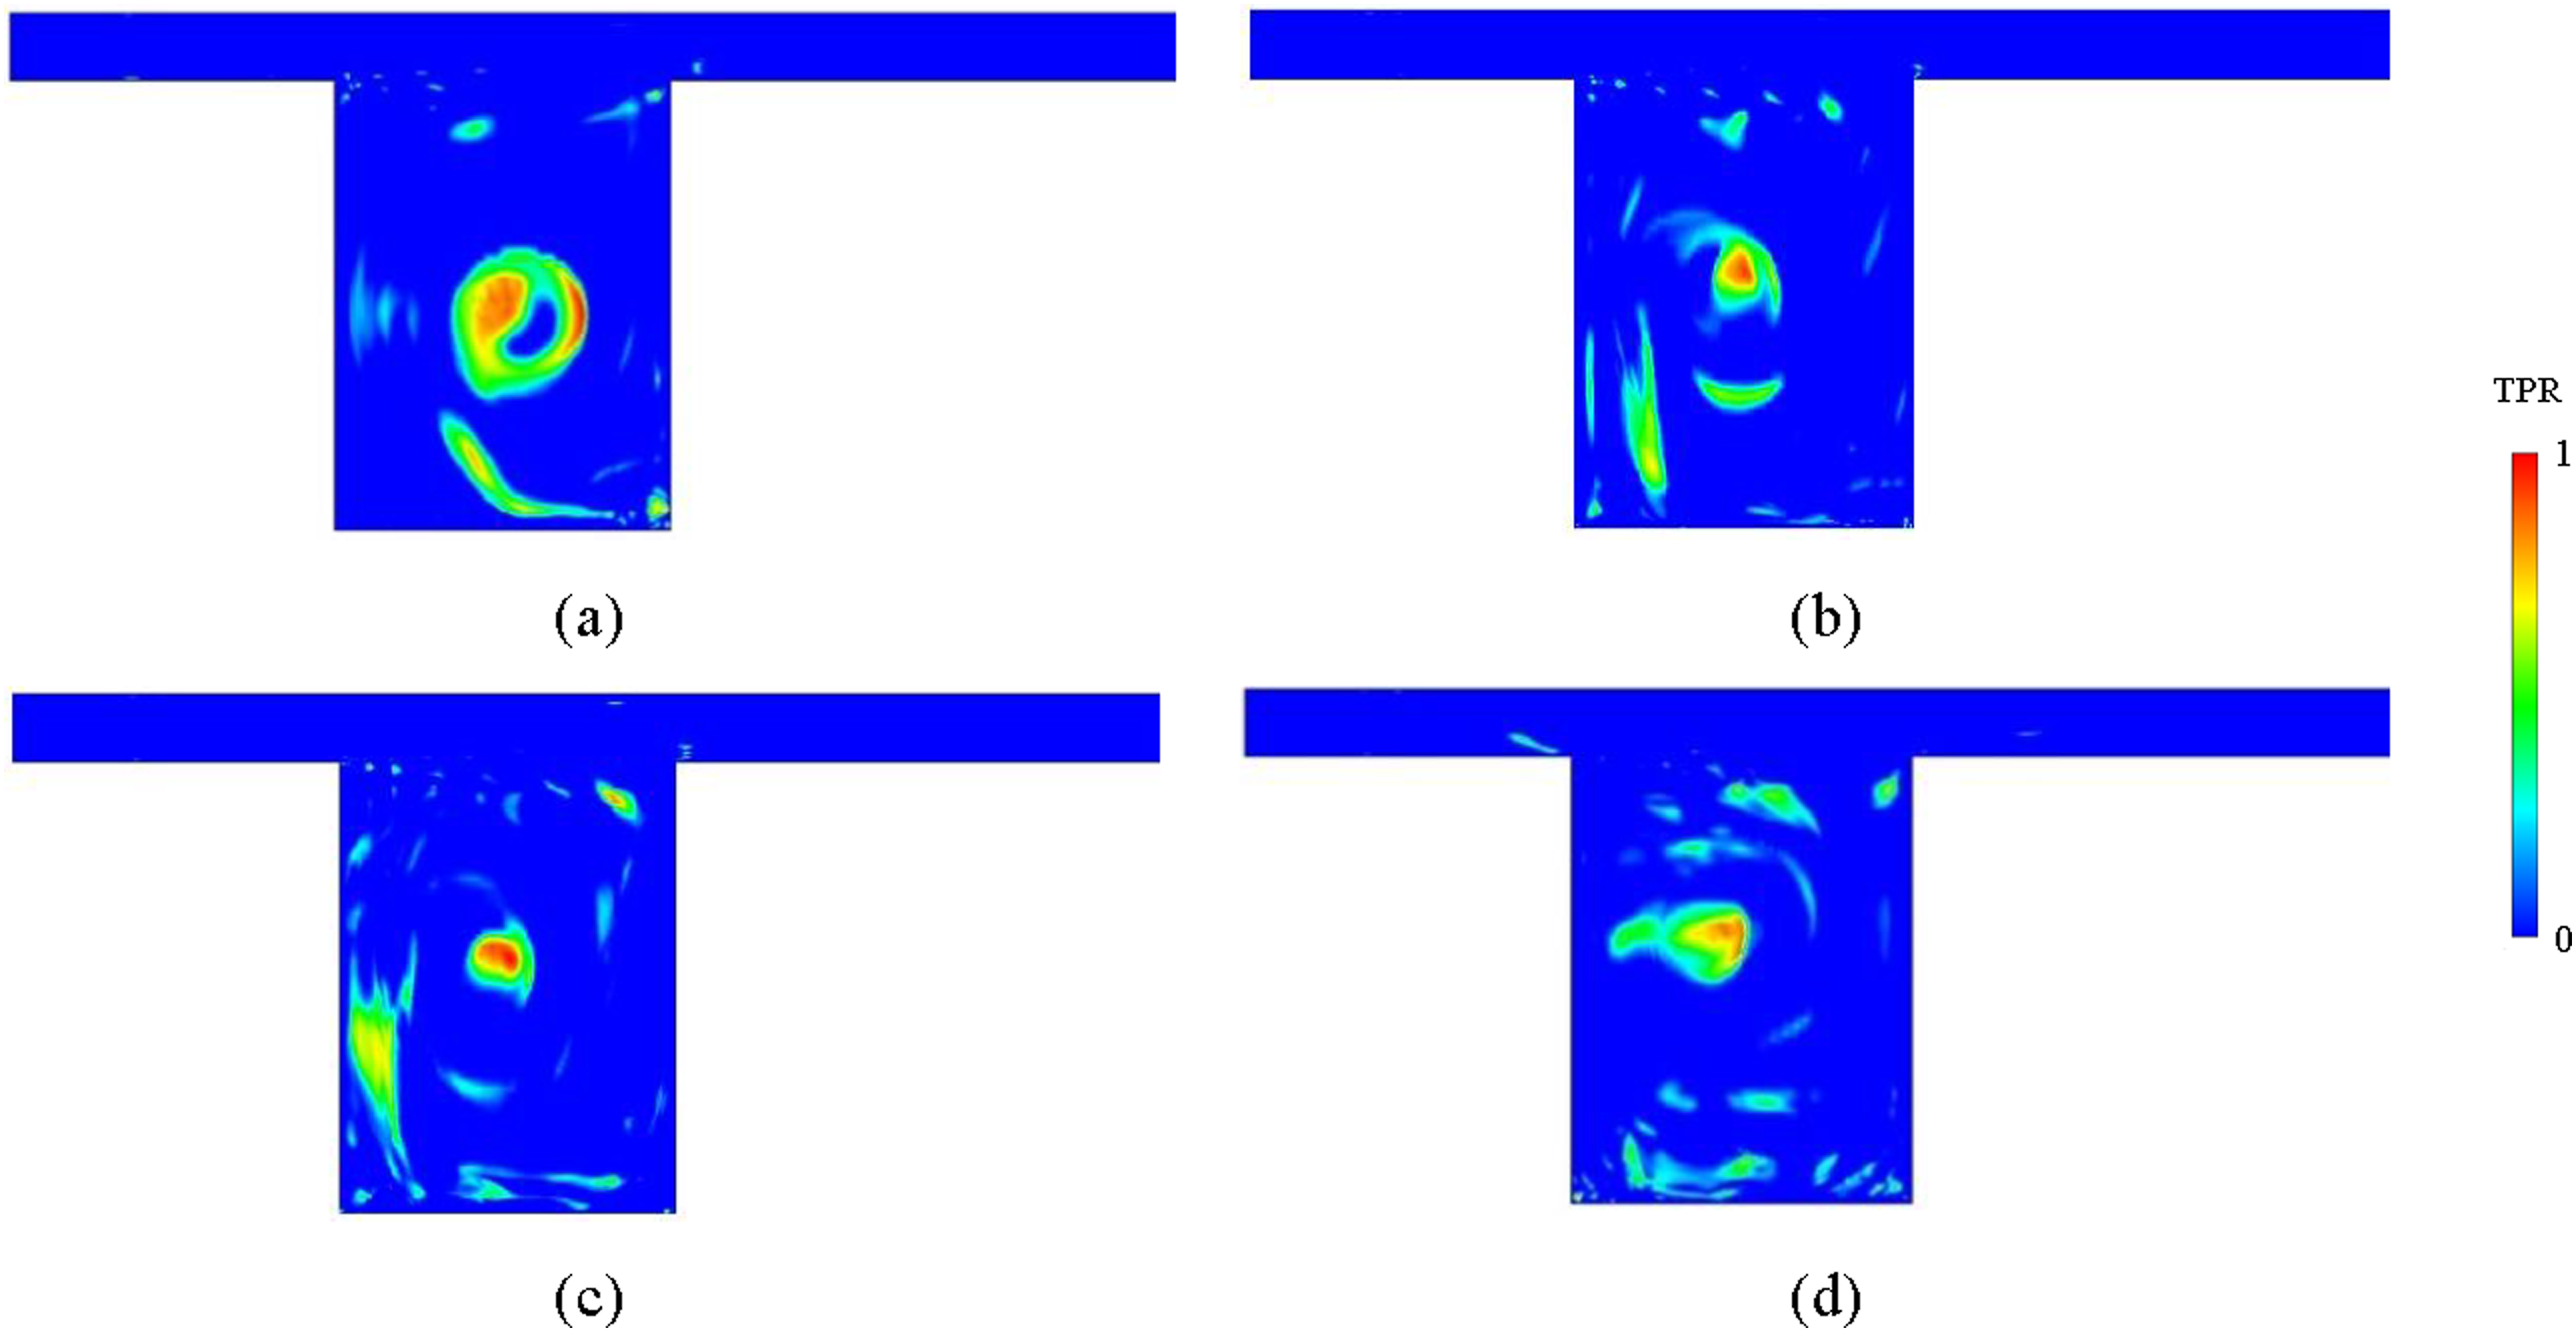
The flow inside a cavity is a self-excited oscillating process with the generation of vortex structures and the disestablishment of the body. The colors in Figure 11 represent TPR, which is the ratio of total pressure to maximum total pressure. The shape structural change of the leading edge of a structural cavity causes velocity shear layer instability in the boundary layer near the wall, thus vortex is generated on the leading edge of the cavity and moves downrange along the direction of flow. During the motion, the vortex structure constantly absorbs energy and gradually grows. The vortex structure flows to the trailing edge of the cavity and grows up to a maximum, then impacts the trailing edge of the cavity, and the vortex structure is broken. One part flows along the direction of flow to the outlet, and another part along the rear wall of the cavity to the front of the cavity. Thus, a whole cyclic process of the vortex is completed. Energy is concentrated primarily in the center of the cavity.
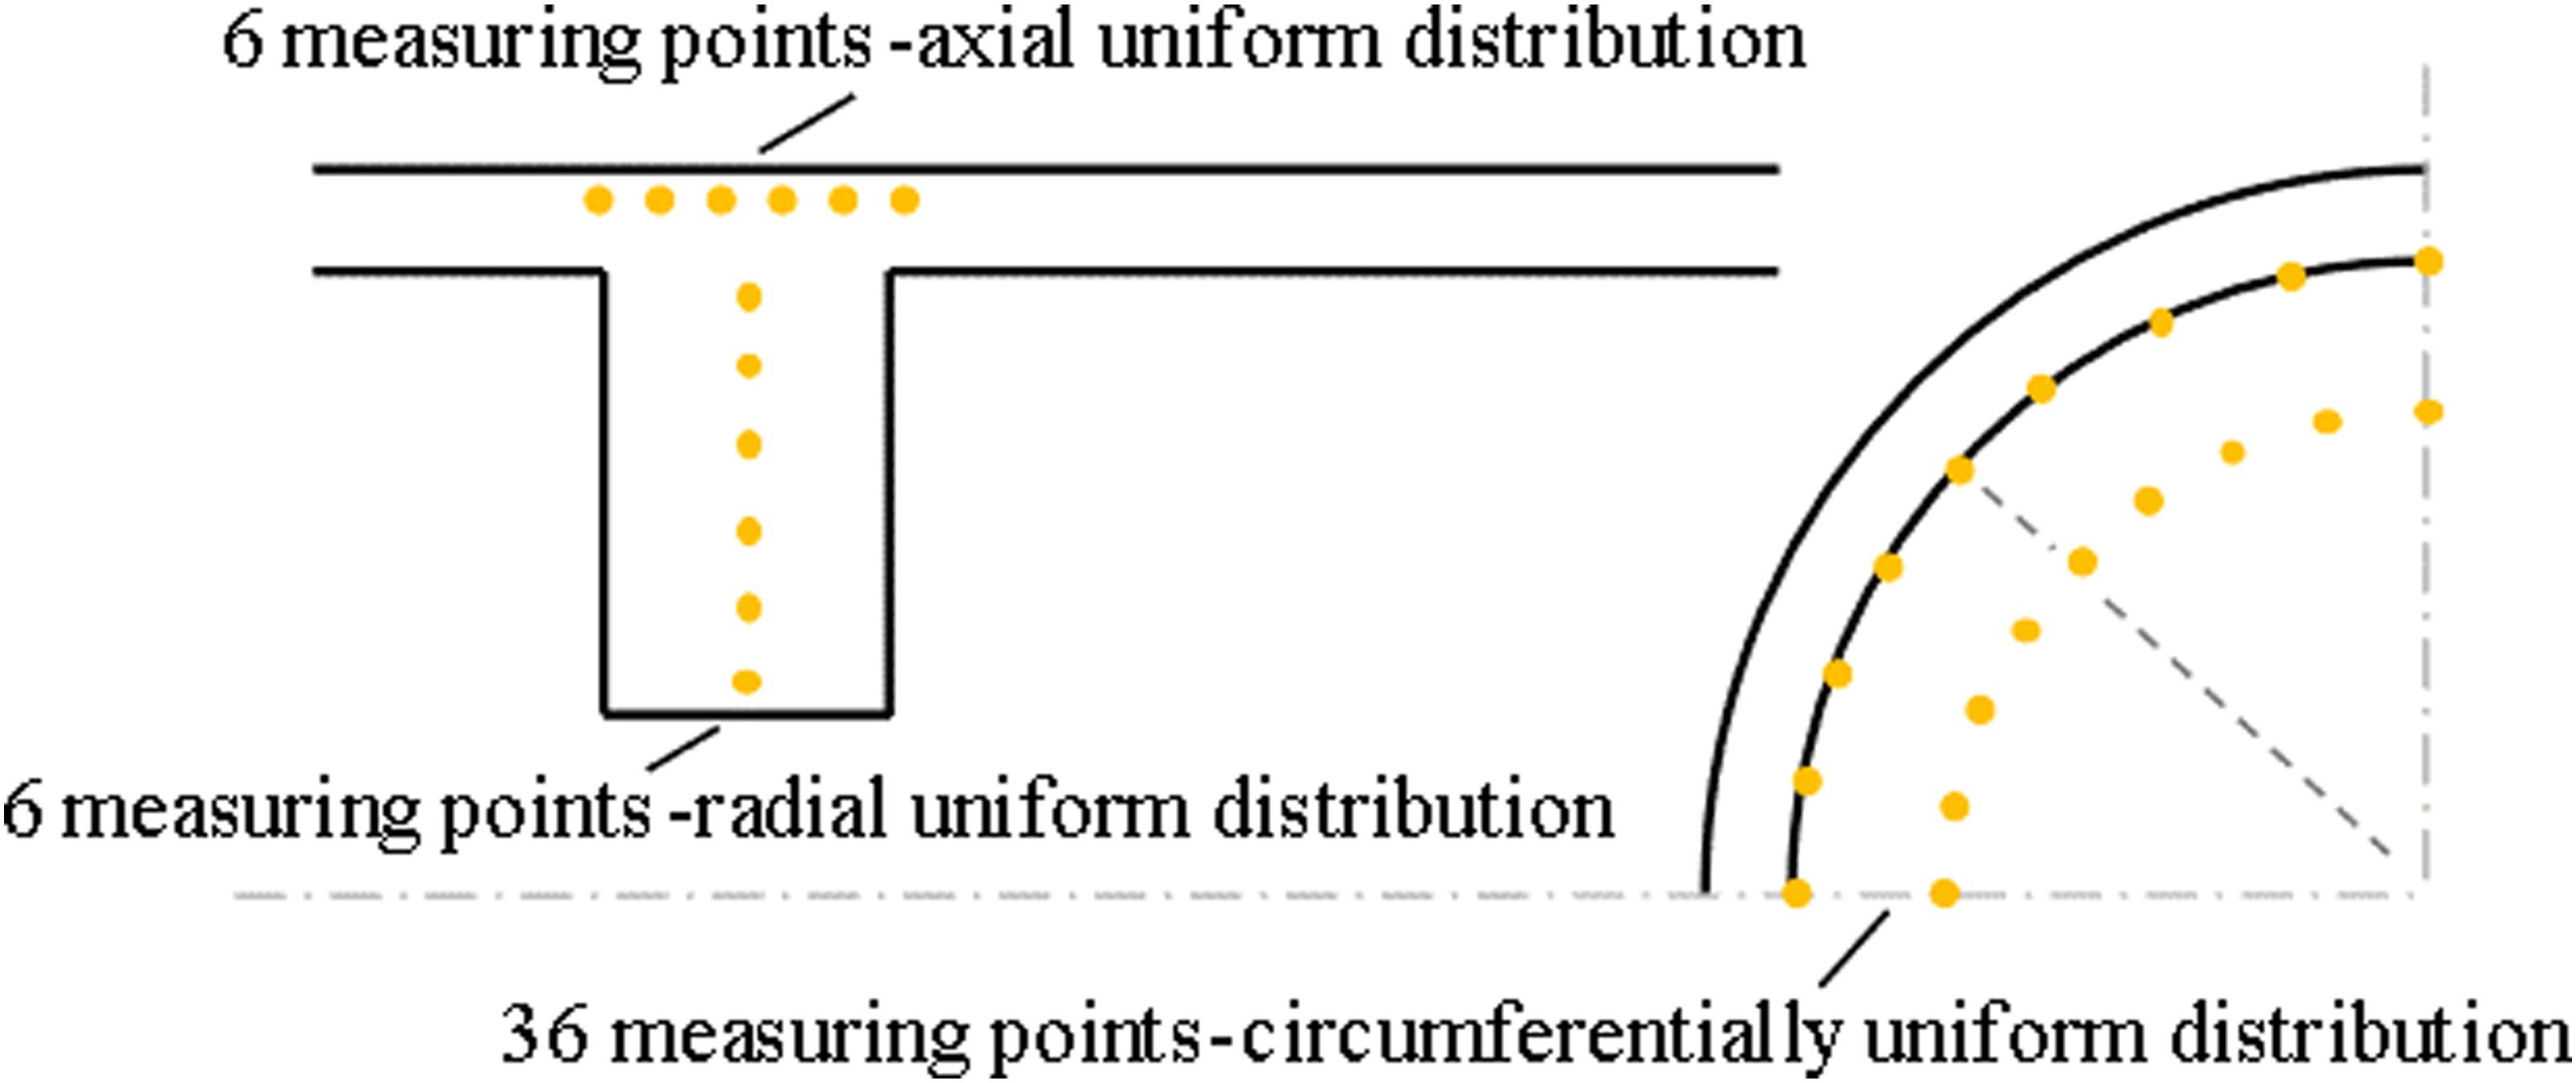
The acoustic analogy method is taken to calculate acoustic characteristics. The obtained flow field information in the sound source region is transformed into the sound source information, which is interpolated into the sound field grid through integral interpolation, which is not required for the consistency of the sound field grid with the flow field grid. The size of the sound field grid of the annular disc cavity structure is set as 8 mm to accurately captures the sound wave propagation characteristics. A hemispherical region is added in the inlet and outlet regions of the structure, with a mesh size of 20 mm, to simulate the free propagation process of the sound wave. An infinite element boundary is added to the surface of the hemispherical region, the sound field outside the infinite element region is calculated by interpolation, and the sound field calculation model of the circular disk cavity structure is shown in Figure 12. A set of microphone measuring points are set at the inlet section, the mid-position section, and the outlet section of the interior cavity respectively, to monitor the distribution of sound pressure within the cavity, which is shown in Figure 13. The acoustic field characteristics of the circular disk cavity model at Mach 0.2, 0.3, and 0.4 are calculated. The internal sound pressure spectral of the modal at different conditions is shown in Figure 14. The internal sound pressure at the different measuring point at Ma 0.2 are shown in Figure 15. Computational model of sound propagation in annular disk cavity structural. Distribution of sound pressure measuring point. Sound pressure spectrum curve at different flow speed and acoustic mode at 998 Hz. Sound pressure of different measurement points in cavity (WD1: the first stage of wheel disc; WD2: the second stage of wheel disc; BC: the bottom of cavity).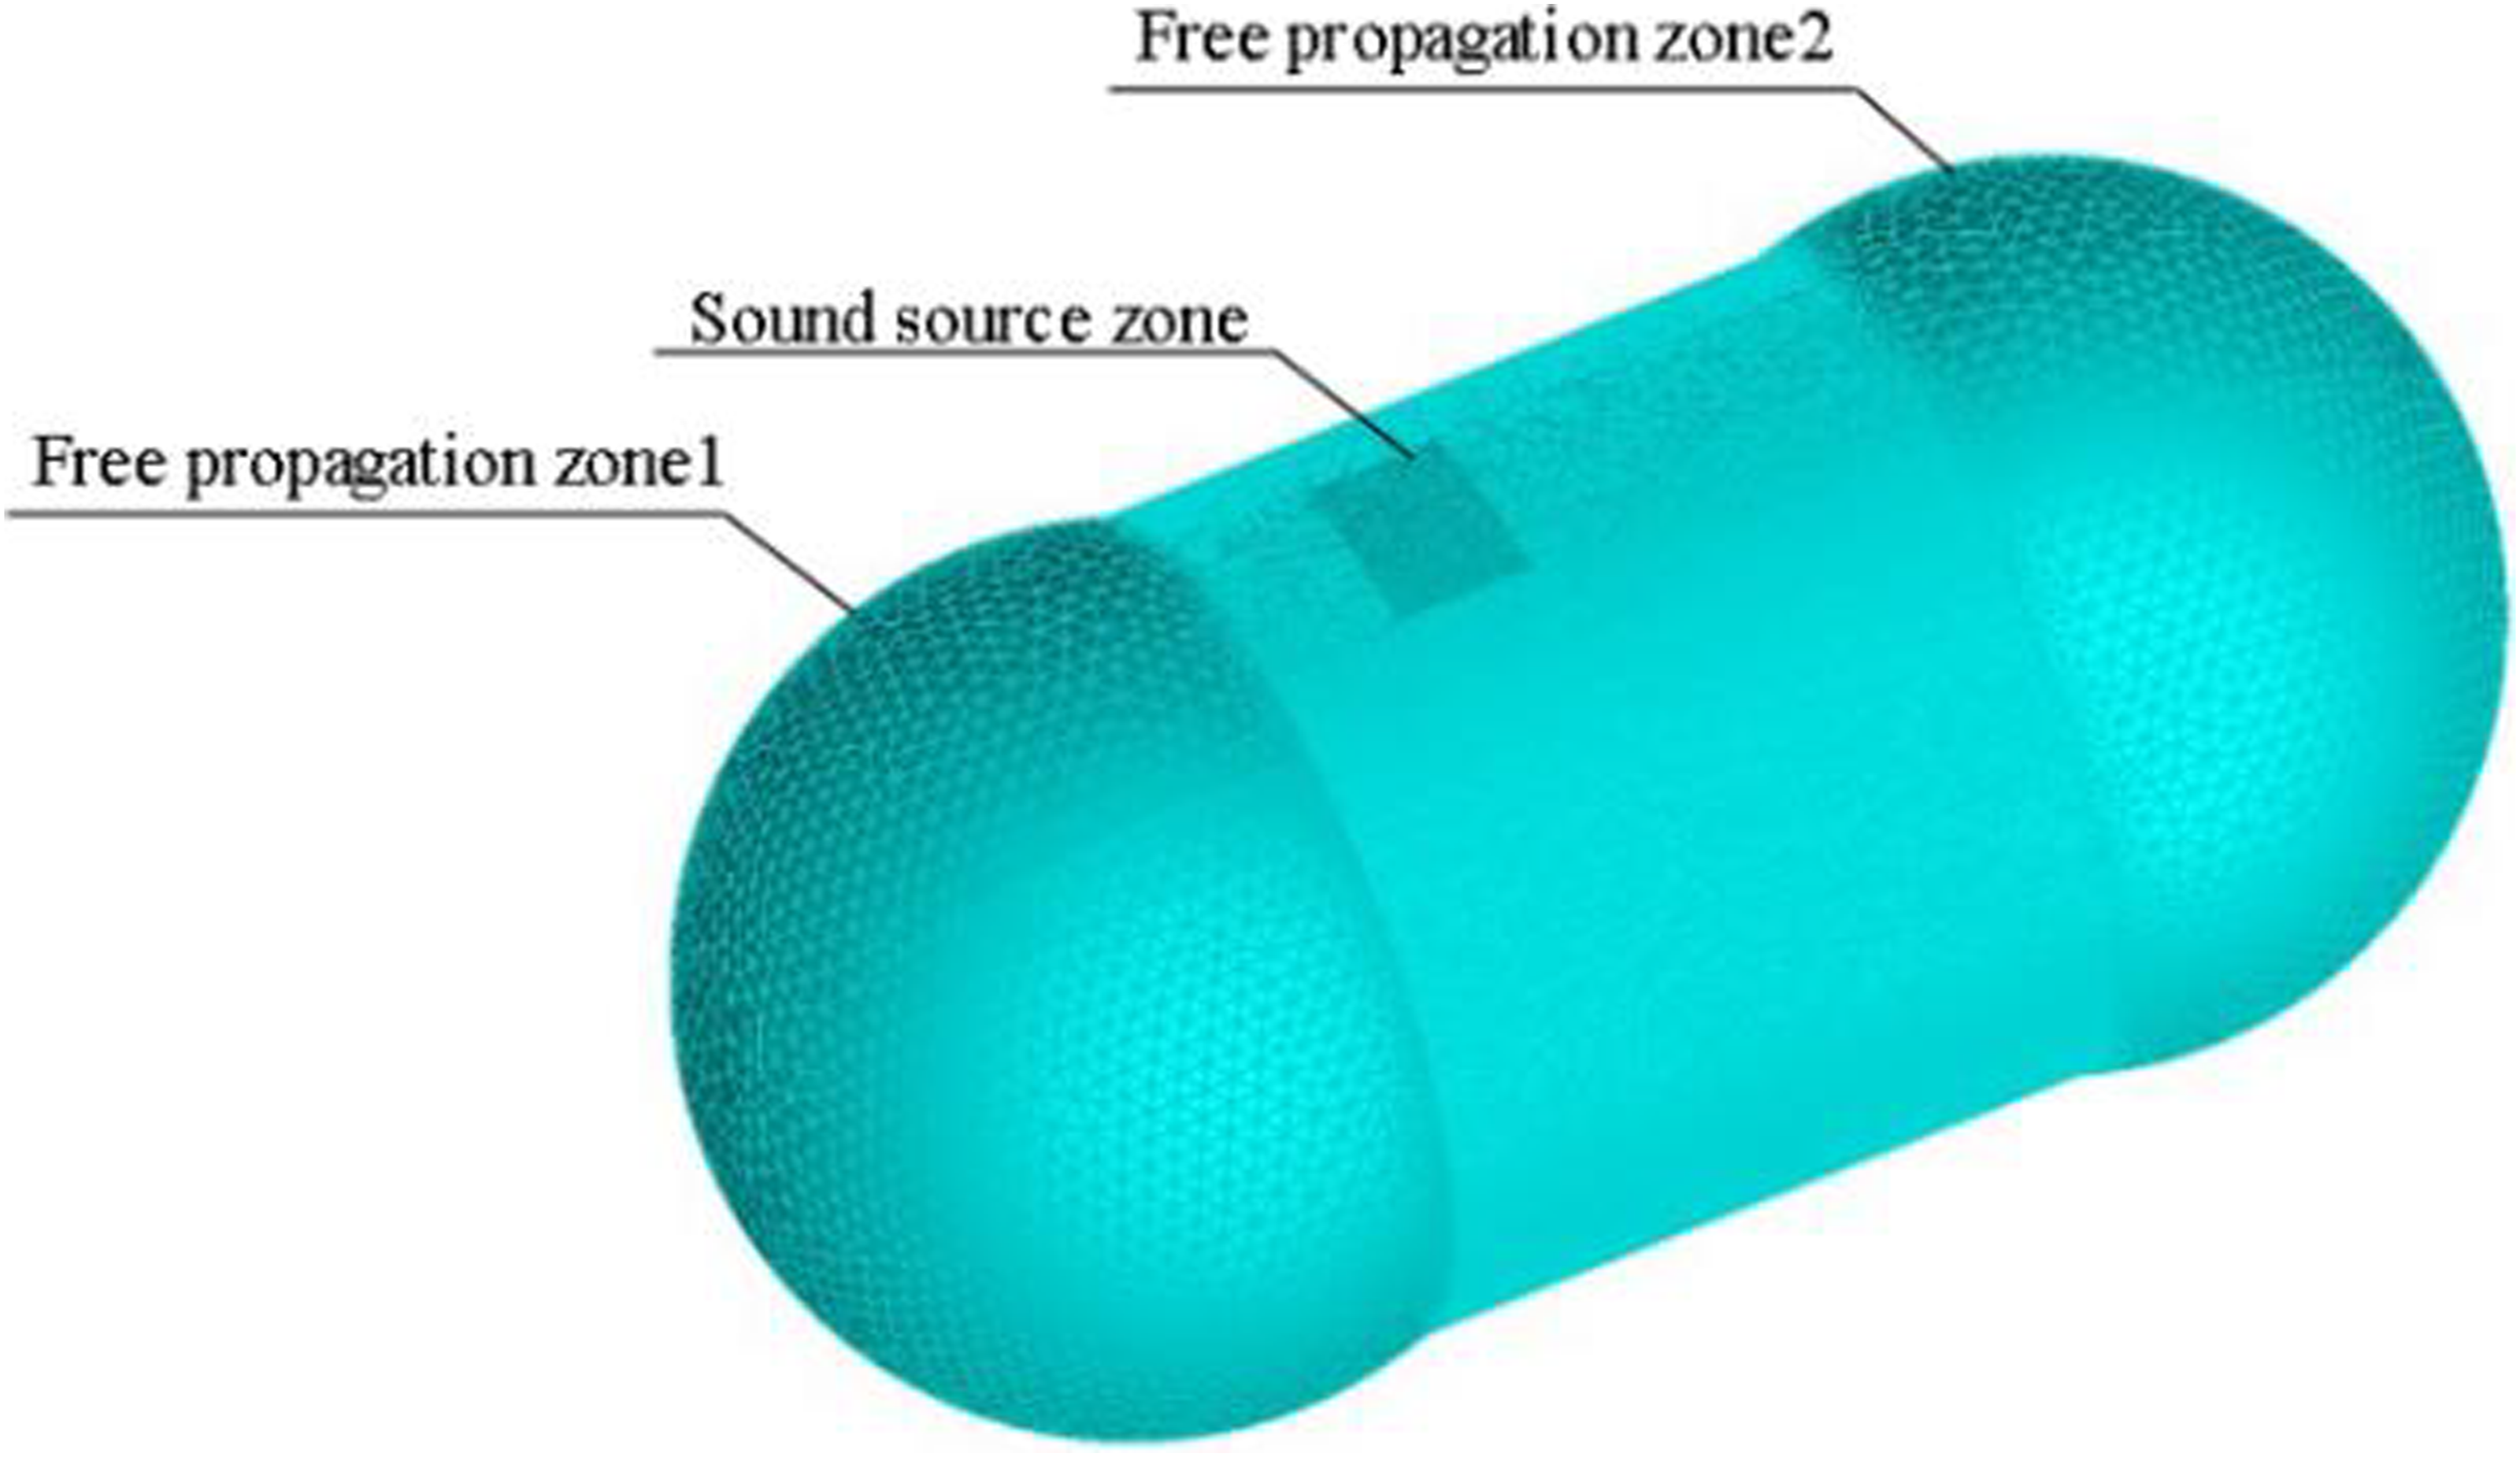
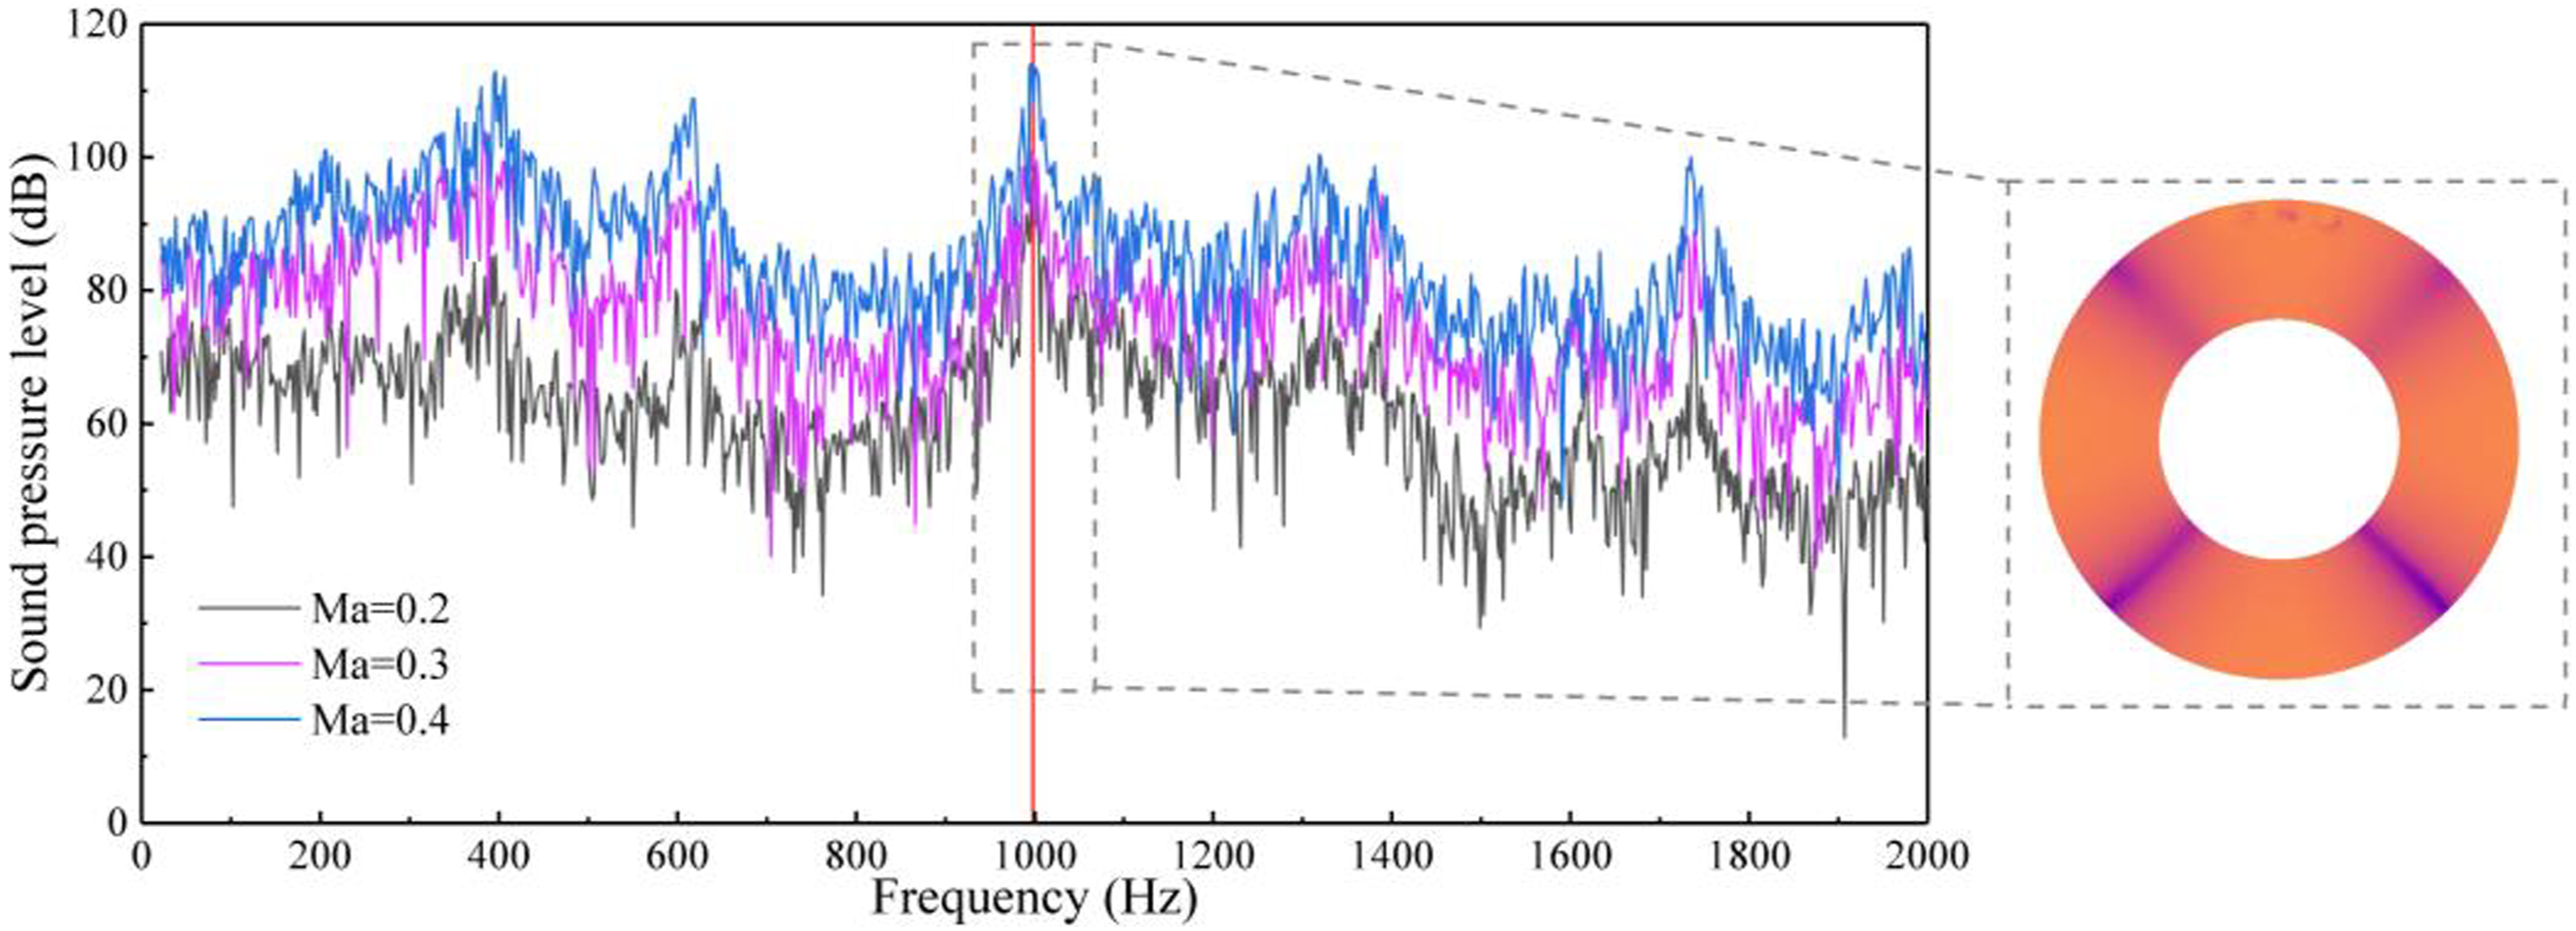
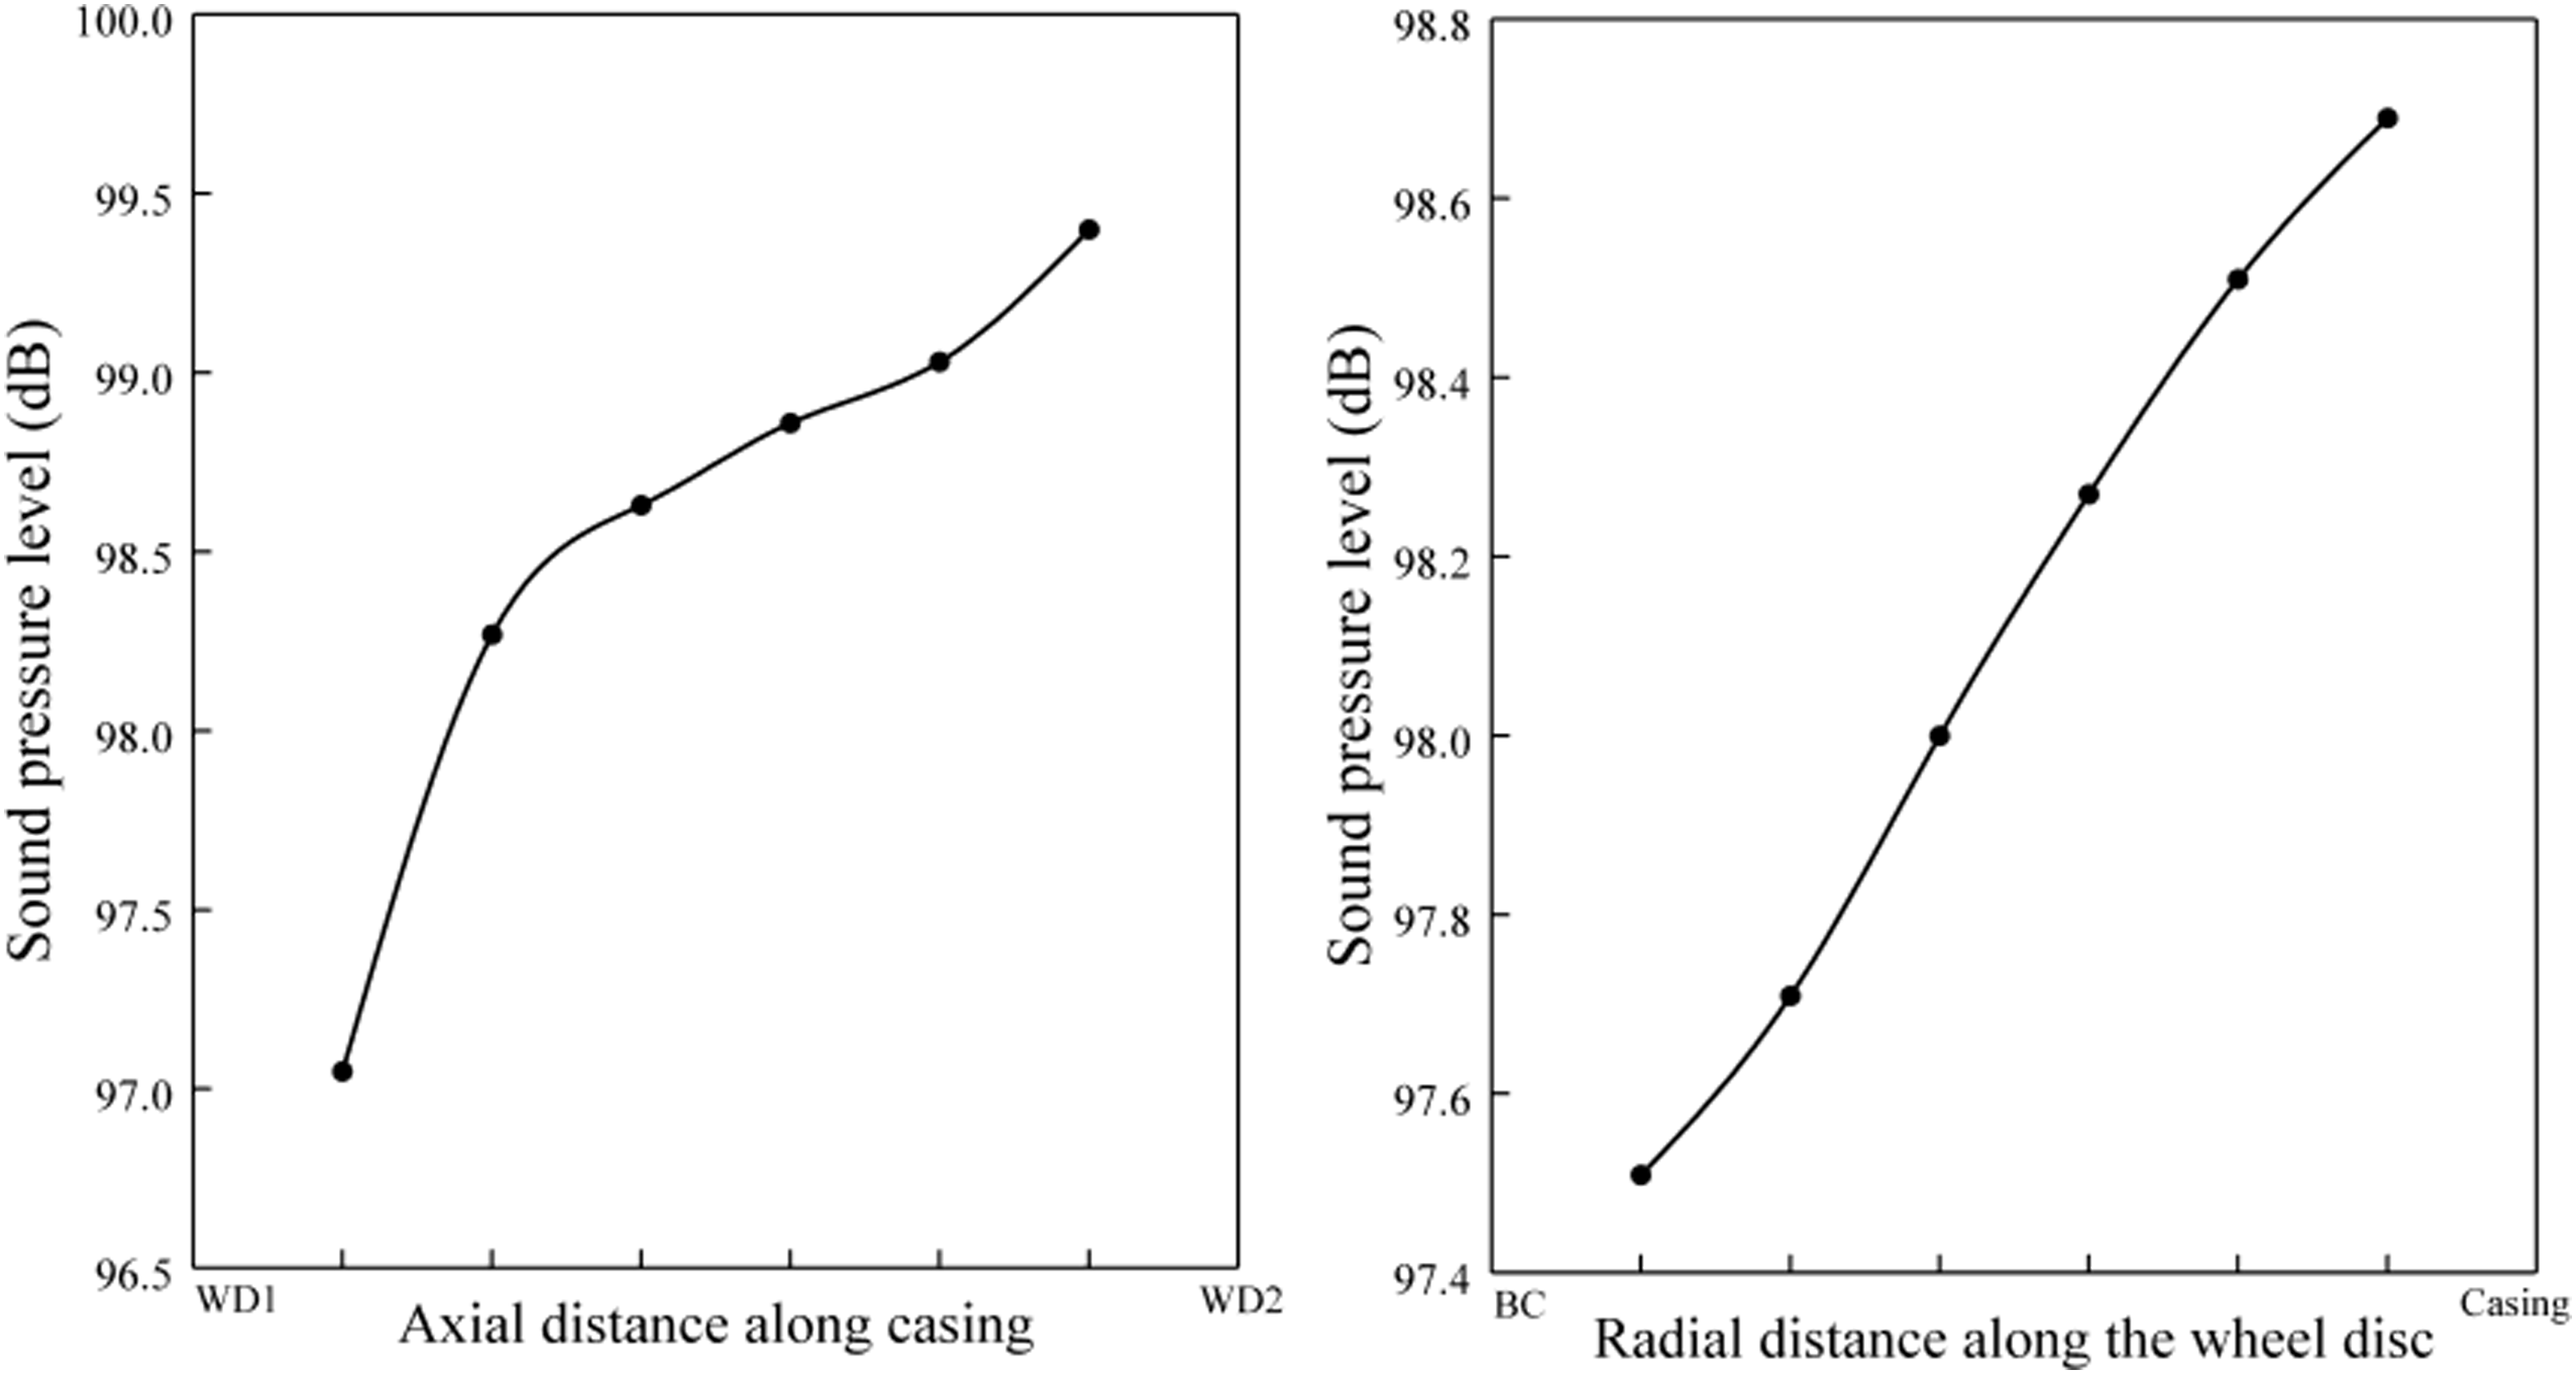
It can be found that a sharper peak at 998 Hz is presented in the sound pressure spectrum curve at flow speed Ma 0.2. The sound pressure level of this characteristic frequency is 99.4 dB which is 15 dB higher than the surrounding peak, and the acoustic mode of this frequency is a second-order circumference. Therefore, the high-intensity sound is excited at Ma 0.2. The sound pressure spectrum is characterized as broadband with no significant peak at flow speeds 0.3 and 0.4 and the overall sound pressure level in the cavity is gradually increased with flow speed. It is obvious that the sound pressure gradually increases along the radial direction of the wheel, and gradually increases along the axial direction of the model.
Experimental study of annular disk cavity model
An annular disk cavity structure is designed to simplify the high-pressure compressor to study the characteristic of high-intensity sound, which is shown in Figure 16. The experiment is conducted with multiple dynamic signal correlation analysis techniques, and the noise is measured by a Kulite high sound intensity pressure sensor. On the casing leading end of the first row of rotors, three static pressure measuring points are set along the circumference at two radial positions with equal space, to obtain performance parameters such as flow speed. A dynamic pressure sensor is mounted above the first-stage disk to measure the dynamic pressure and the frequency of the shedding vortex inside the disk cavity. The dynamic pressure of the casing wall is measured at six points along the circumference of the casing at the middle of the two disks, meanwhile, the amplitude, phase, and mode distribution of the circumferential acoustic wave in the disk cavity are captured. A measuring point of pressure pulsation is set on the bottom wall of the disk cavity to obtain the response of pressure pulsation in the cavity. The dynamic pressure on the wall is measured at three points along the axial direction between the two disks. Four points of dynamic pressure are distributed radially along the second stage disk to monitor the radial pressure distribution of the cavity. Diagram of annular disc cavity structure and monitoring points.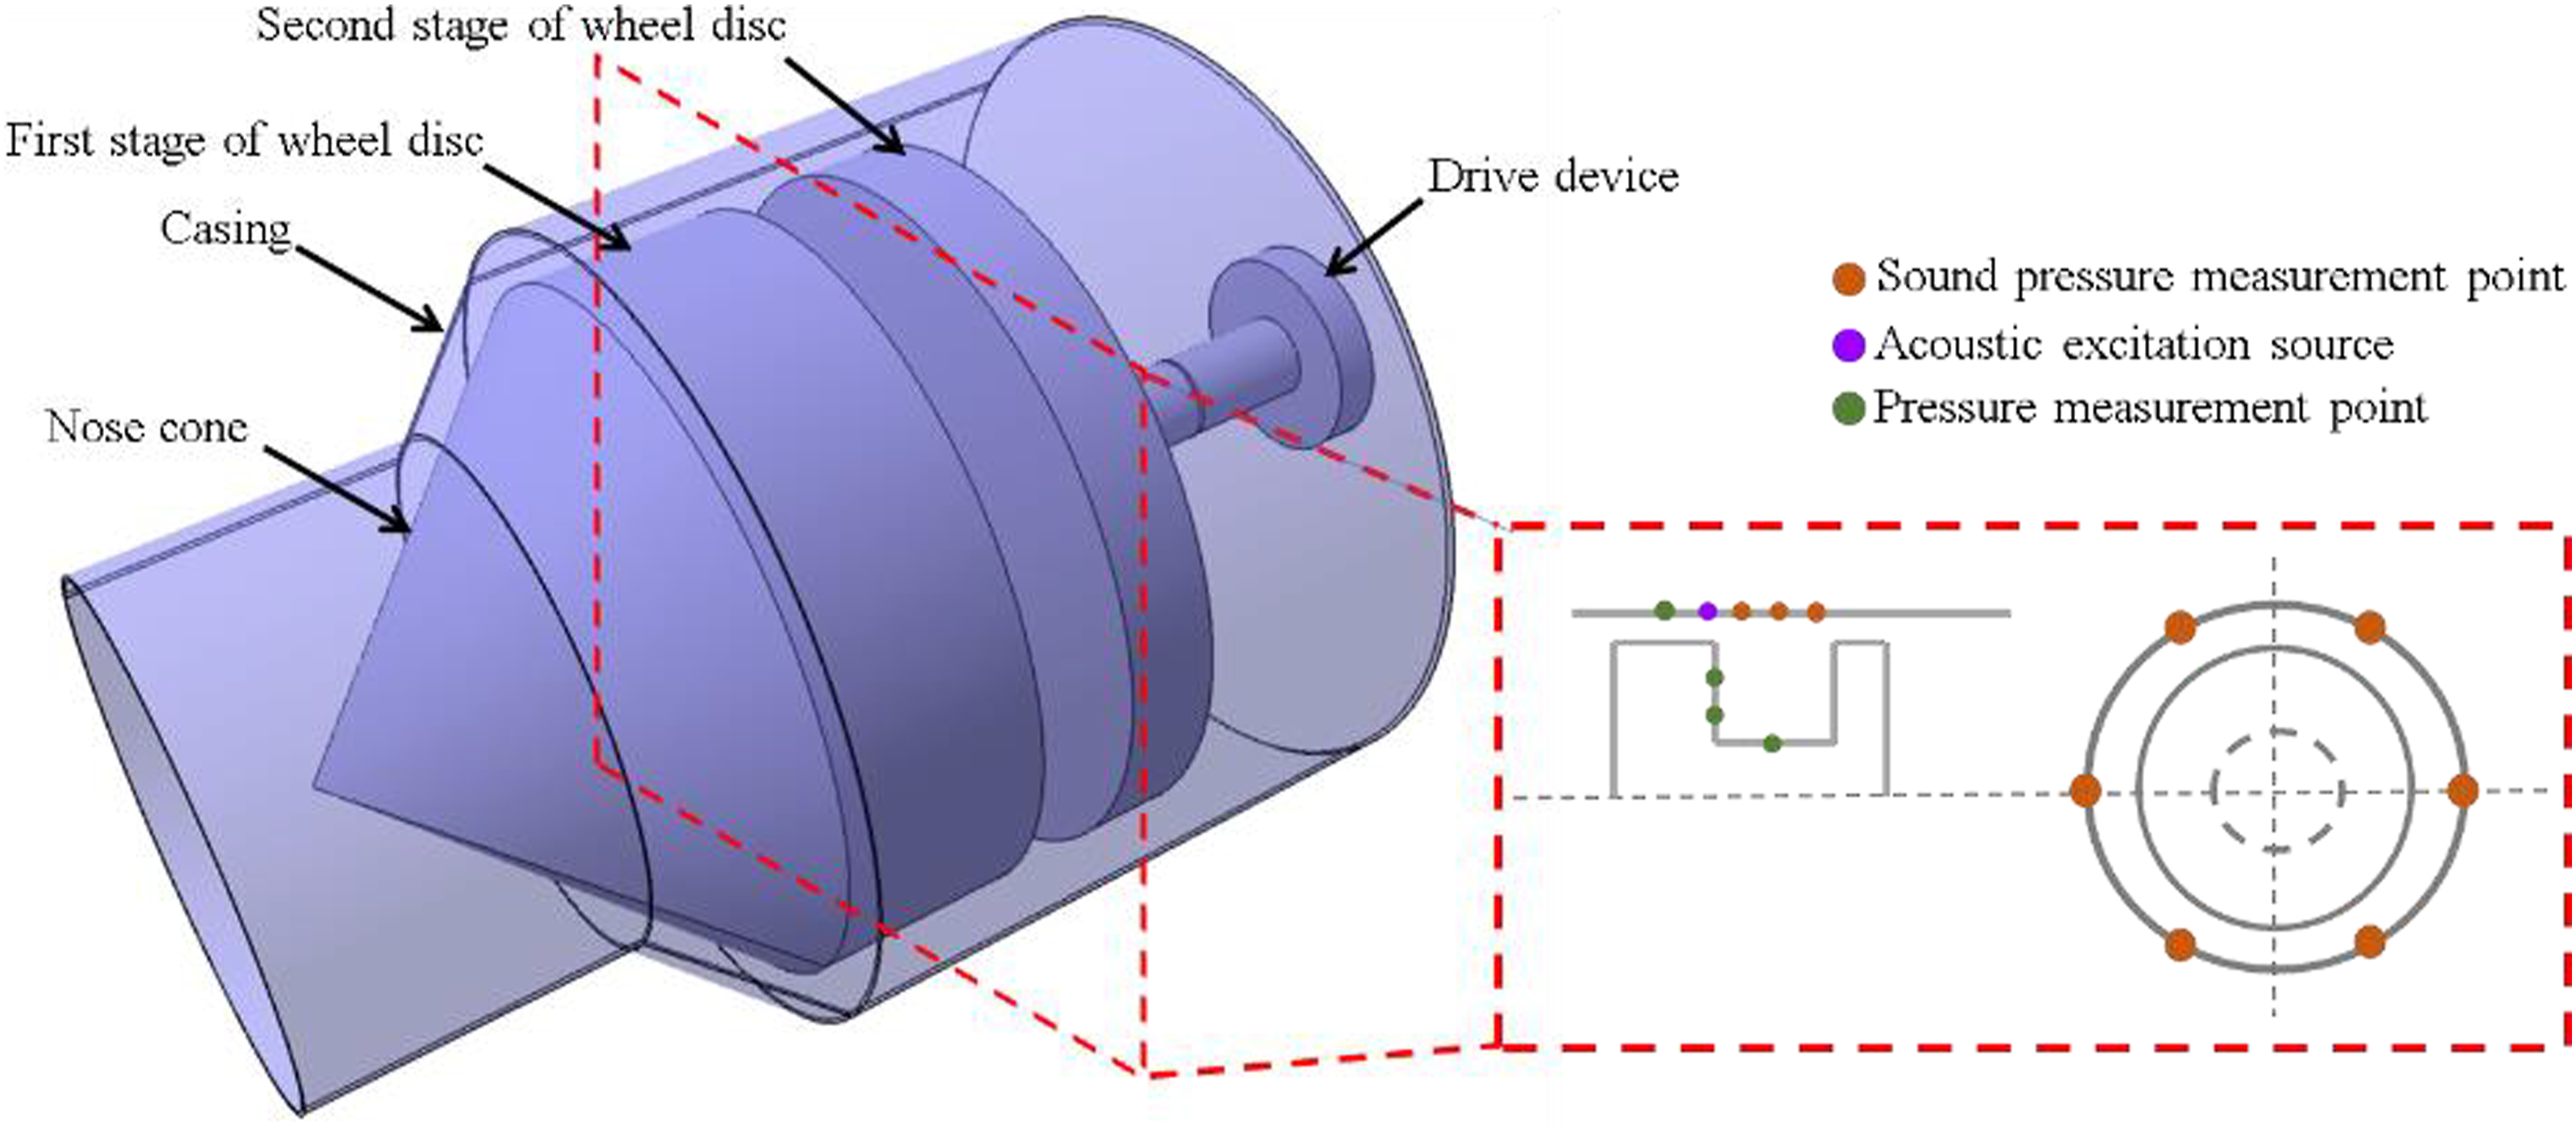
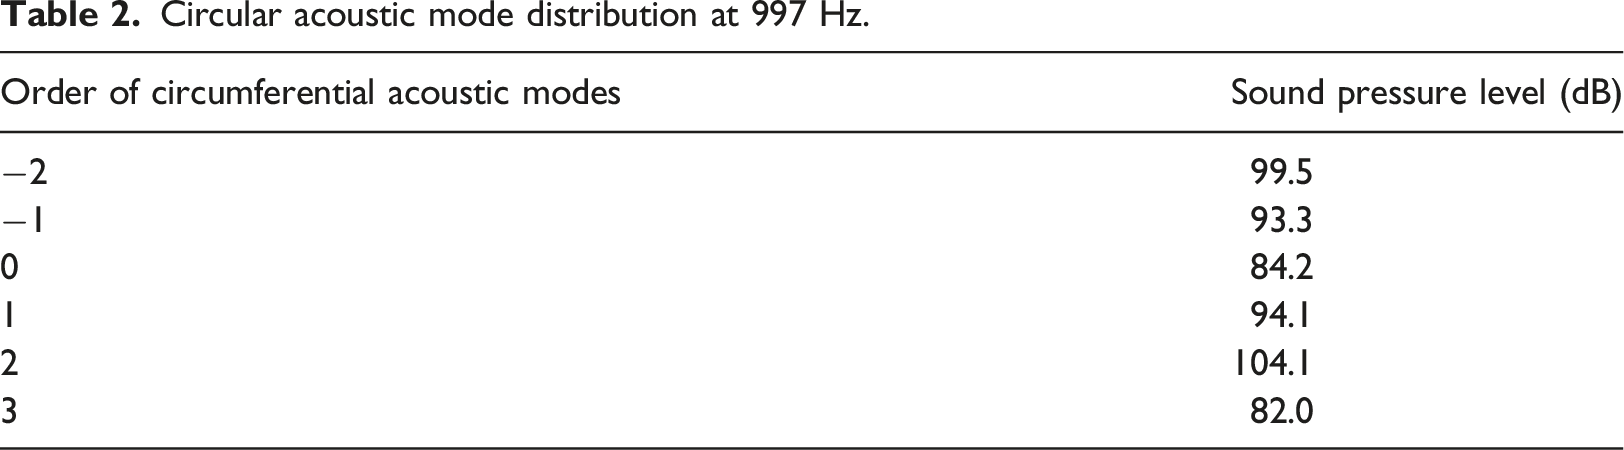
To obtain the acoustic mode of the annular disc cavity structural, conducting scanning tests of the modal with an acoustic horn, the result is shown in Figure 17. It can be seen that the first and second-order acoustic mode frequencies of the model are 610 Hz and 997 Hz respectively at the condition of flow speed Ma = 0. Acoustic mode at the frequency of 997 Hz is characterized by circumferential second-order acoustic mode, the acoustic mode results are shown in Table 2. Acoustic modes of an annular disk cavity structural under acoustic excitation. Circular acoustic mode distribution at 997 Hz.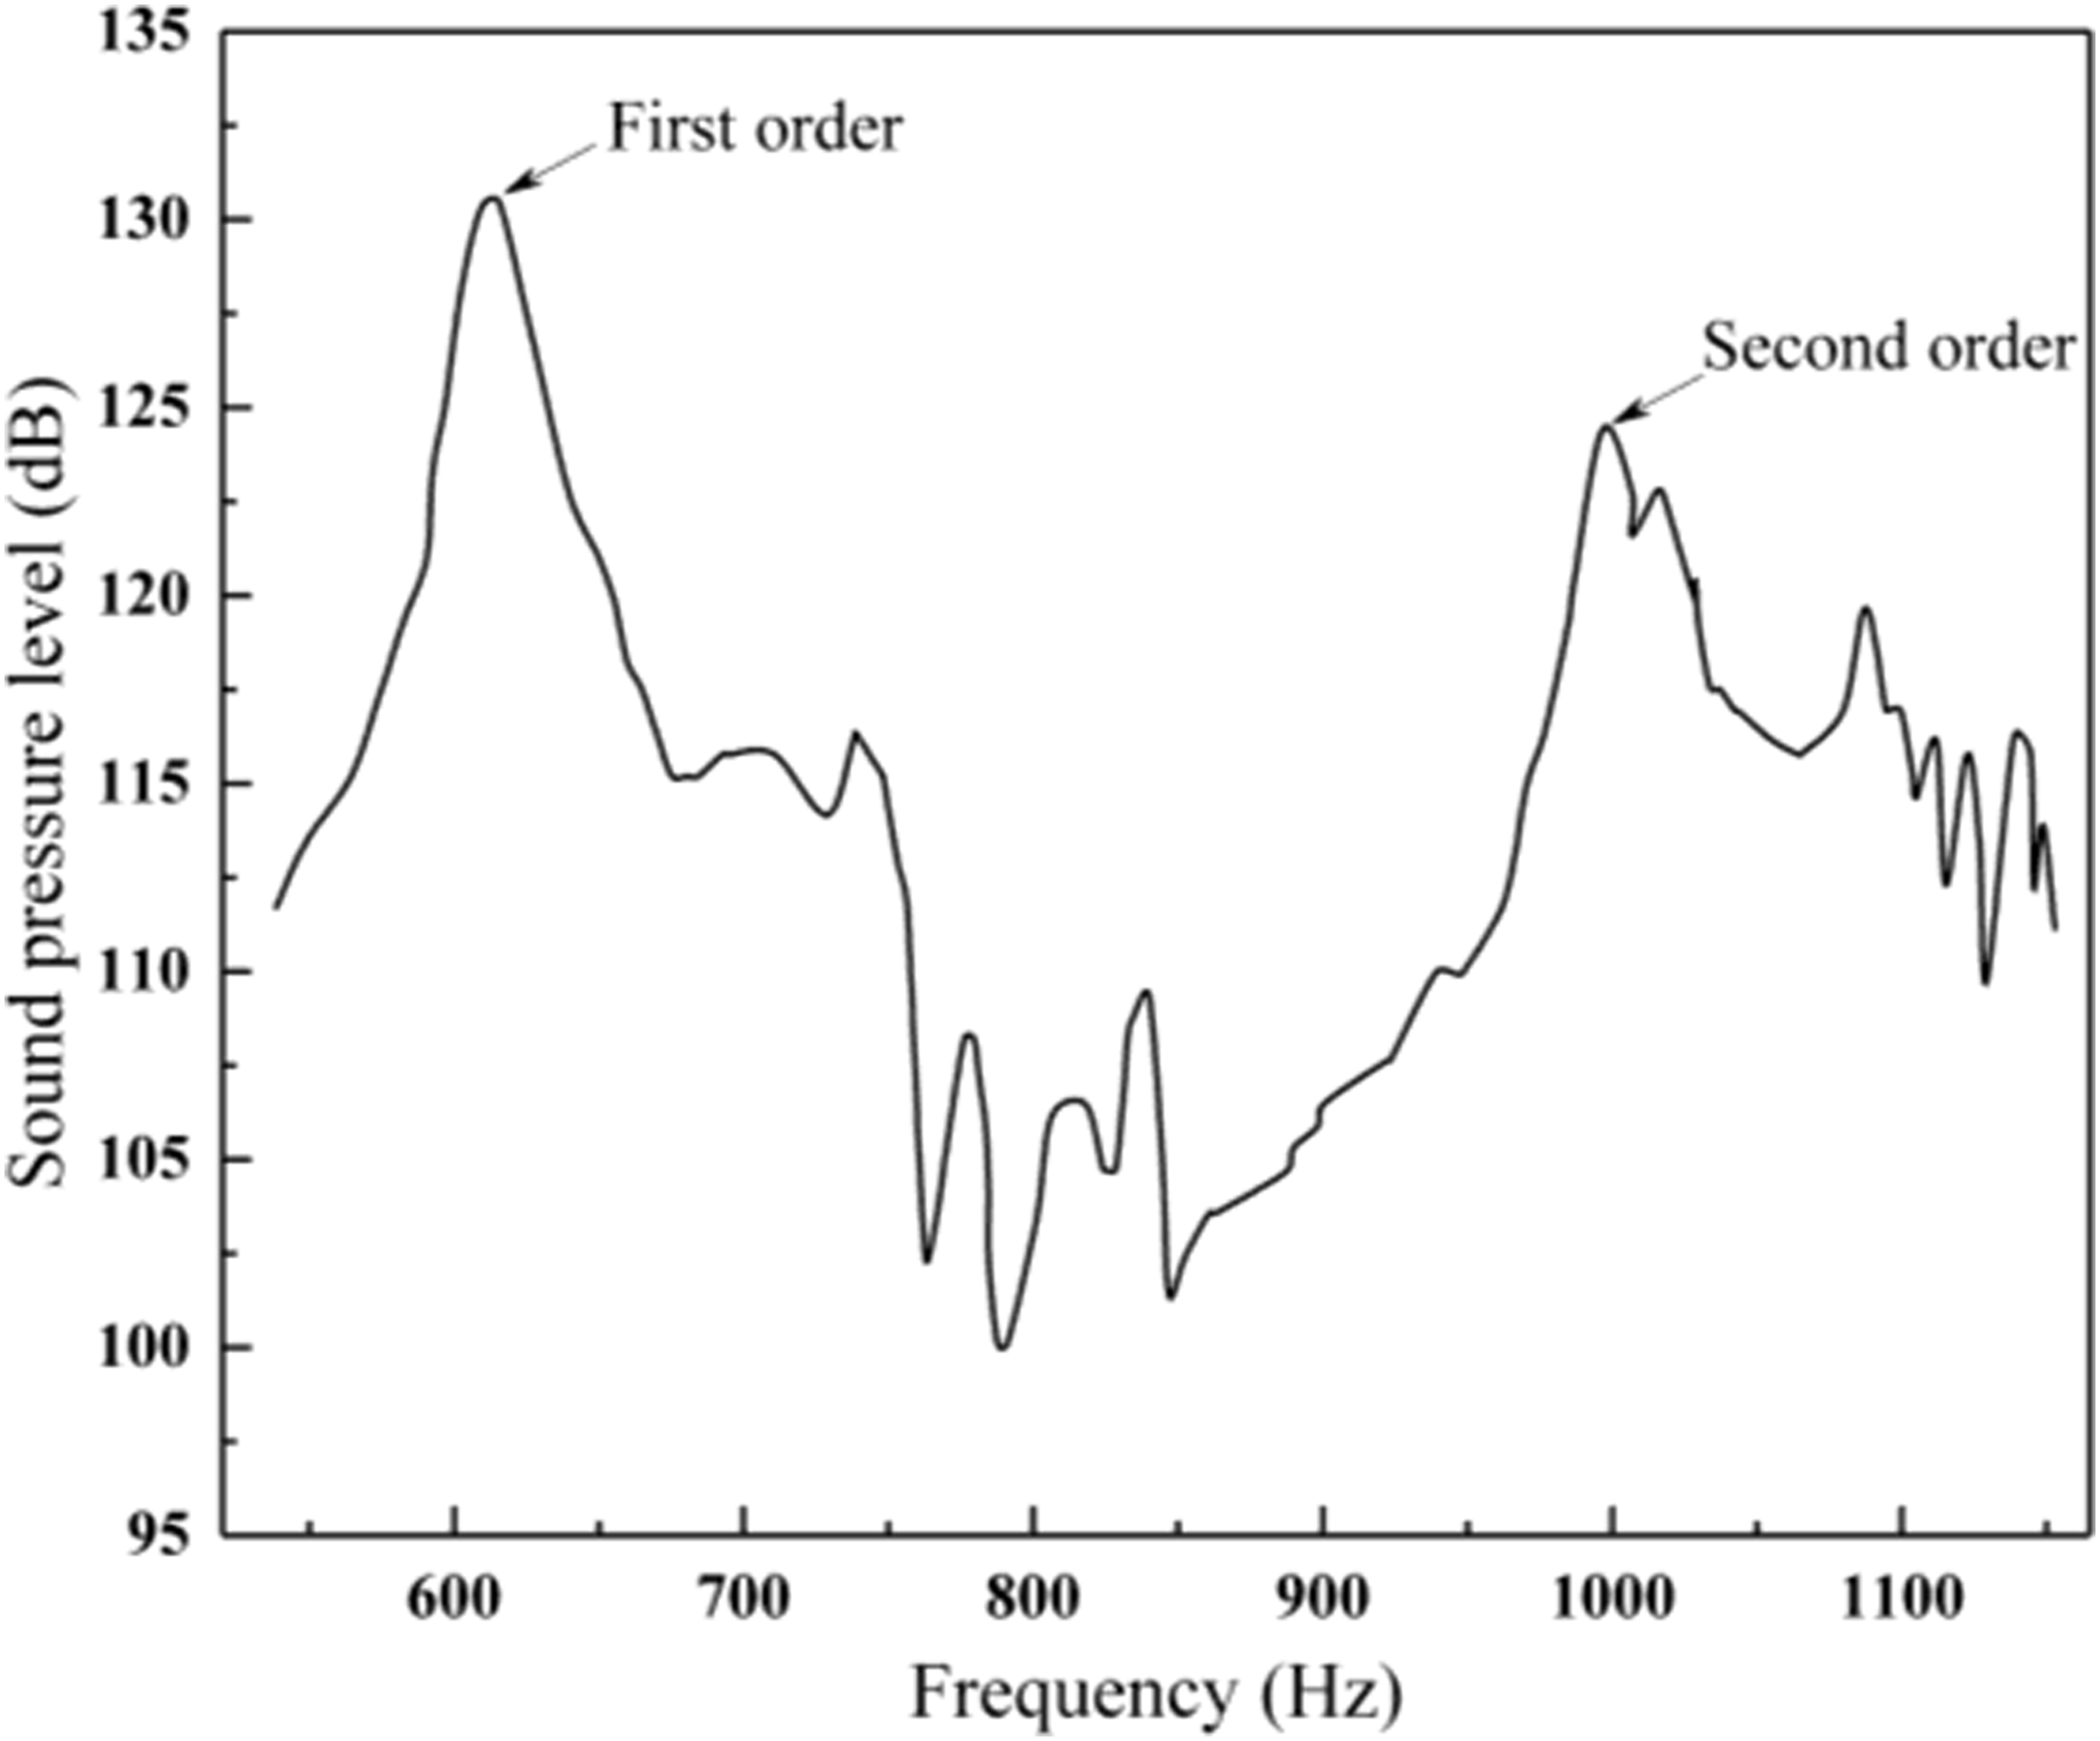
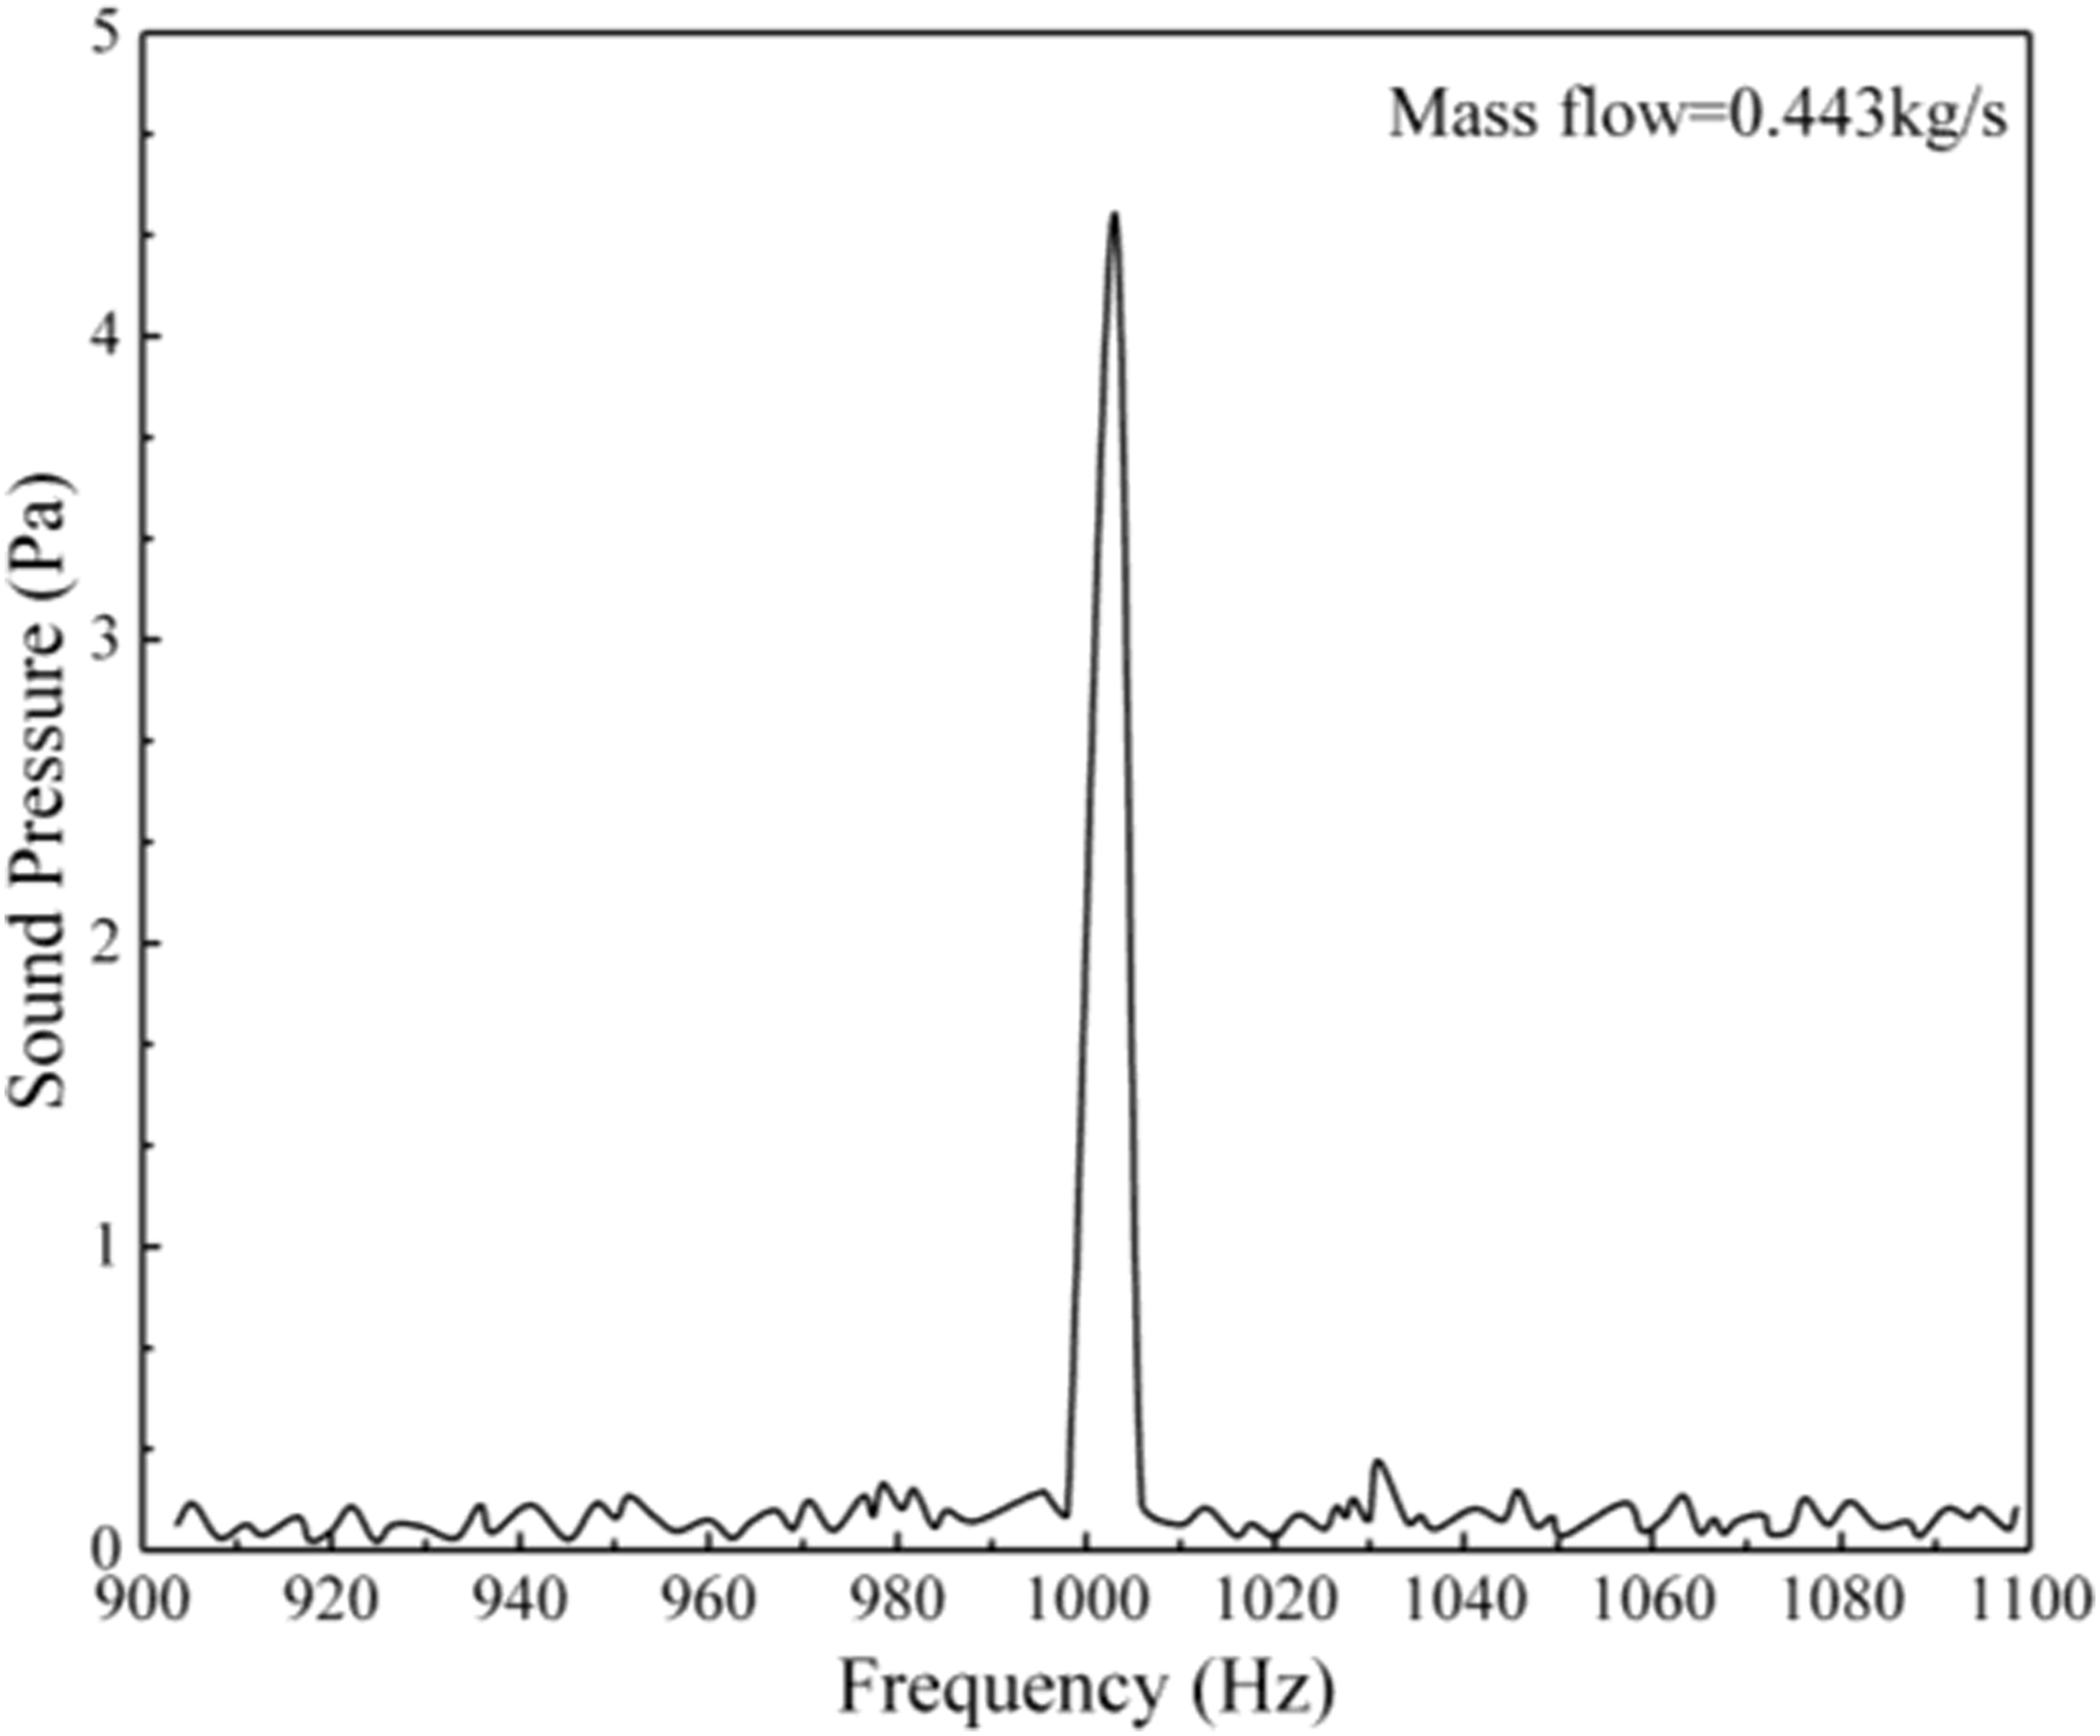
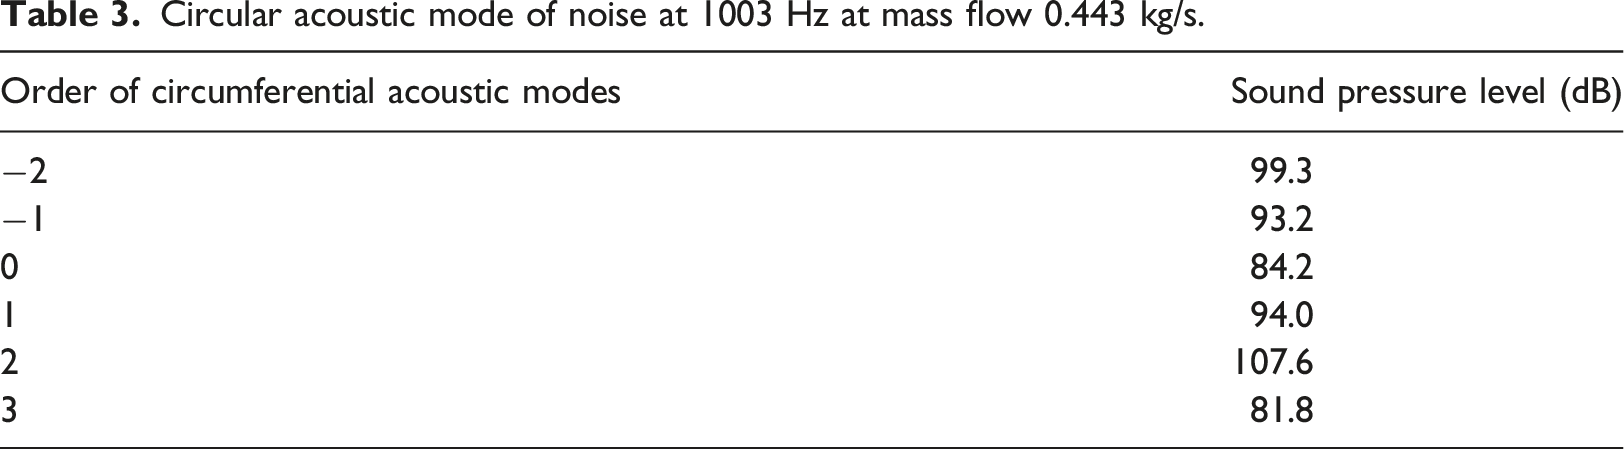
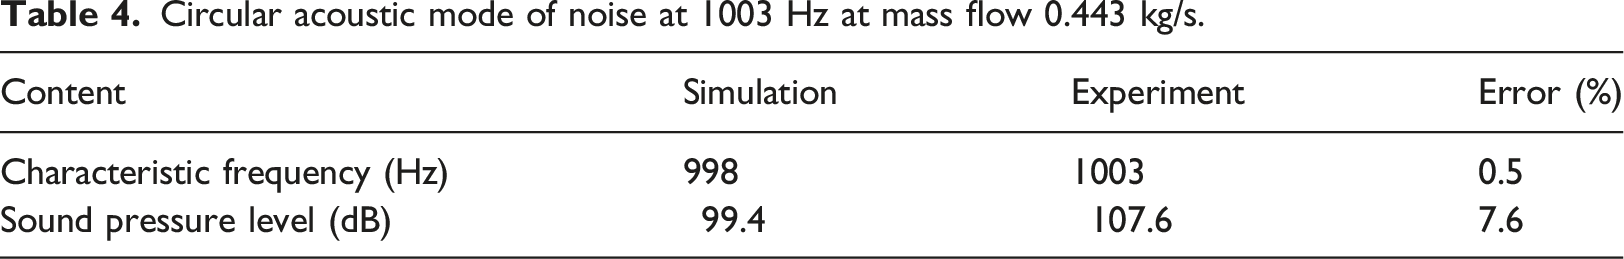
The flow adjustment is performed in the flow range of 0∼1.5 kg/s to change the operation condition during the test. High-intensity sound is found in the cavity and occurs around 1000 Hz within the flow speed range of 0.418 kg/s ∼ 0.48 kg/s. Figure 18 indicates the noise response in the structure at the operation conditions which are up and down flow regulation from 0.418 kg/s to 0.48 kg/s. There is a peak frequency of acoustic mode presented in the noise response, and the characteristic frequency is linear with the flow between 992 Hz and 1010 Hz. Figure 19 indicates the frequency response result of the noise at 0.443 kg/s. The domain peak frequency of noise is 1003 Hz and the peak amplitude corresponding is 107.60 dB, which is marked with the red line in the diagram. Modal analysis of the noise results at peak frequencies is conducted, which is shown in Table 3. The acoustic mode is characterized by the form of axial second order when high-intensity sound occurs. The characteristic frequency and sound pressure level corresponding obtained in simulation and experiment are shown in Table 4. The error characteristic frequency and sound pressure level corresponding obtained in simulation and experiment are 0.5% and 7.6%. Noise response results at different mass flow conditions. Noise response results at mass flow 0.443 kg/s. Circular acoustic mode of noise at 1003 Hz at mass flow 0.443 kg/s. Circular acoustic mode of noise at 1003 Hz at mass flow 0.443 kg/s.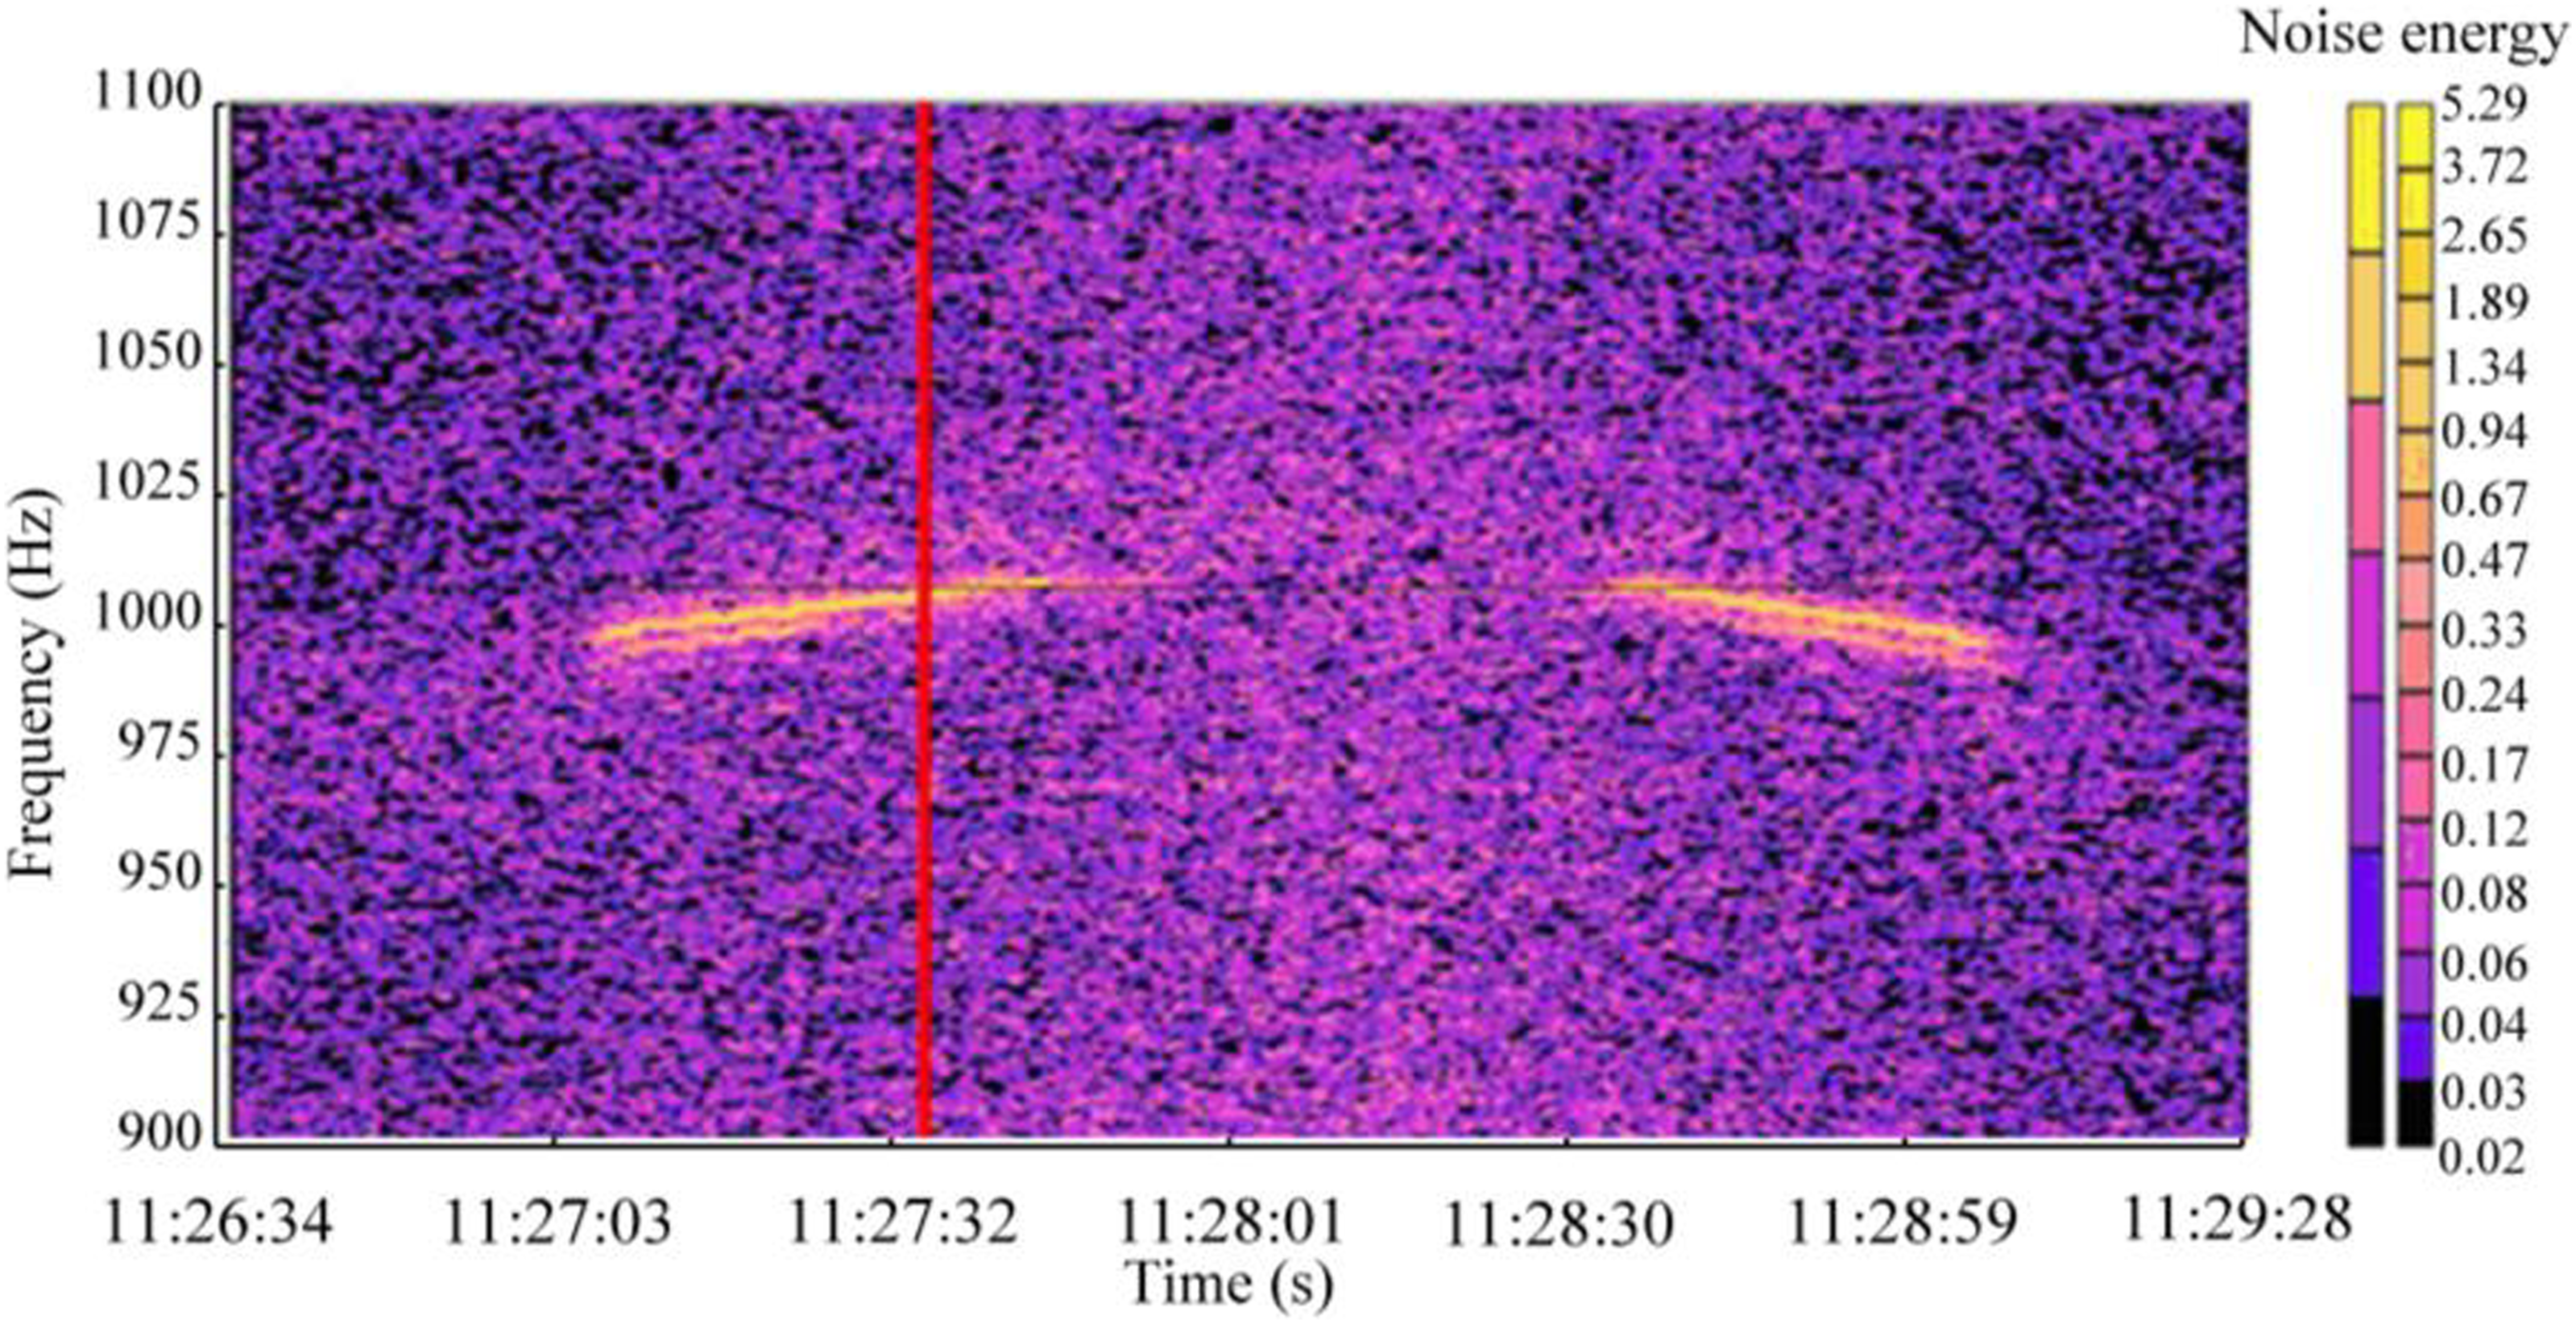
Conclusions
(1) An experiment is conducted to investigate the noise in the compressor and the vibration of the blade in a multistage high-pressure compressor. A characteristic frequency component is observed in the internal noise signal of the compressor flow channel, at the same time blade vibration with high amplitude is observed in the high-pressure R1. When abnormal vibration occurs in the high-pressure R1, a discrete pure tone characteristic frequency of 1402 Hz with high amplitude, a passing frequency of 6285 Hz for R1, and other peak noise frequencies are all detected at different axial positions of the compressor casing. The sound pressure level of noise signals at the characteristic frequency reaches the maximum at the time of occurrence of vibration of R1 with the highest amplitude, and the sound pressure level of characteristic frequency directly above R1 is the highest at all measurement points. Therefore, the high-intensity sound is certainly related to the abnormal vibration of the rotor blade. (2) The circular tube square cavity model based on Ziada’s model is established to study the characteristics of high-intensity sound by the method of decoupling between the flow field and the sound field. High-intensity sound of the pipeline is presented at the condition of flow speed at 83 m/s. The acoustic modal frequencies of the circular tube square cavity model captured by the calculation method in this article, as well as the distribution of acoustic modes inside the square cavity, all show great consistency with the literature. The error of frequency of acoustic mode at each order is within 3%. (3) An annular disk cavity structure is built, based on the cavity between the rotator and stator of a high-pressure compressor, to investigate the characteristic of the high-intensity sound in simulation and experiment. In the simulation, the high-intensity sound is excited at flow speed Ma 0.2, the characteristic frequency of acoustic mode is 998 Hz with sound pressure level 99.4 dB, and the acoustic mode of this frequency is circumferential second order. The sound pressure gradually increases along the radial direction of the wheel, and gradually increases along the axial direction of the model. In the experiment, the high-intensity sound is excited at mass flow 0.443 kg/s, the characteristic frequency of acoustic mode is 1003 Hz with a sound pressure level of 107.6 dB, and the acoustic mode of this frequency is also circumferential second order. The error of characteristic frequency and sound pressure level corresponding are 0.5% and 7.6% respectively between simulation and experiment, which indicate the feasibility of the method for analyzing the coupling between acoustic and solid compressors from the perspective of internal noise characteristics.
Footnotes
Declaration of conflicting interests
The author(s) declared no potential conflicts of interest with respect to the research, authorship, and/or publication of this article.
Funding
The author(s) disclosed receipt of the following financial support for the research, authorship, and/or publication of this article: This work was supported by the Scientific Research Foundation for Introduced Scholars of Shenyang Aerospace University [grant number 21YB01]; and Initiation Foundation Project of Doctor of Liaoning Province [grant number 2022-BS-221]. Additionally, it was supported by Shenyang Engine Research Institute of Aero Engine Corporation of China for the experimental test.