
Abstract
This paper addresses the usefulness of leading edge serrations for reducing aerofoil self-noise over a wide range of angles of attack. Different serration geometries are studied over a range of Reynolds number
Introduction
Leading edge serrations are well known to be able to enhance the aerodynamic performance of aerofoils1–3 and also in reducing their noise due to the interaction with turbulent in-flow.4–7 Leading edge serrations are also shown to provide noise reductions in self-noise at relatively low angles of attack, 7 In this paper we explore their potential for reducing aerofoil self-noise over a wide range of angles of attack, including pre-stall and post-stall conditions. Control of aerofoil self-noise at these range of attack angles and the reason behind it does not appear to have been addressed in previous literature.
The far-field self-noise generated by an aerofoil at low to moderate angle of attack is caused by the interaction between pressure fluctuations over the surface convecting past the trailing edge. At low AoA, where the flow remains attached over the entire surface, these hydrodynamic pressure fluctuations arise from the turbulent boundary layer in direct contact with the surface. At higher angles of attack, where the flow becomes separated from the trailing edge, the pressure fluctuations on the surface are the result of the near field from the turbulent shear layer.
A number of control techniques have been proposed aimed at reducing aerofoil noise at low AoA for which the flow is fully attached. Most of these methods involve introducing some kind of modification to the trailing edge, such as serrated edges,8–11 porous surfaces 12 and brushes. 13 , 14 All these different methods have been tested experimentally in low Reynolds number flow conditions and have been shown able to deliver a noise reduction between 3 and 7 dB at low angles of attack.
All these noise control techniques have been conceived and tested on aerofoils at relatively low AoA. In many situations, however, the aerofoil is required to operate at higher AoA, for which partial separation has occurred. Examples of this include a wind turbine operating in high wind sheared flows and outlet guide vanes operating at off-design conditions. In these cases, trailing edge serrations are unlikely to be effective in reducing self-noise and alternative solutions must be sought.
Leading edge serrations have been widely investigated as a means of enhancing aerodynamic performance, particularly near stall conditions. They have the same effect on the flow as tubercles on Humpback Whale flippers,
1
which are considered to act as lift-enhancement devices, capable of keeping the flow attached over a larger range of angles of attack thereby delaying stall
2
,
3
and increasing
The exact mechanism by which leading edge serrations on airfoils are able to delay stall is still not completely understood. 19 A number of previous studies 20 , 21 on leading edge serrations have demonstrated the formation of streamwise vortices behind the serration tip. Due to the acceleration of the flow in the troughs between the serration peaks, a region of low pressure is established. 22 This low-pressure region leads to an entrainment of the flow behind the peaks and generate a pair of counter-rotating vortices downstream of each trough. It has been suggested by Johari et al. 16 ; Custodio 20 ; Miklosovic et al. 23 that these vortices can induce a vortex lift or intensify the momentum exchange within the boundary layer and thus increase the flow attachment and postpone stall. 2 , 24 A number of researchers have suggested that leading-edge serrations are able to control stall via a mechanism similar to that of vortex generators which produce streamwise vortices that are typically on the scale of the boundary layer. 15 , 17 , 25 however, there is no consensus on the precise control mechanism since the serration wavelength and amplitude are commonly much larger than the boundary layer thickness on the aerofoil. It has been proposed by Van Nierop et al. 26 that the principal mechanism by which leading edge serrations are able to control stall is that they simply alter the pressure distribution on the aerofoil.
The purpose of this paper is to quantify and understand the balance between the effects on aerodynamic behaviour and noise obtained by the use of sinusoidal serrations introduced onto the aerofoil leading edge. The study will encompass a wide range of AoA, including pre-stall and post-stall conditions. The paper will investigate the sensitivity on aerodynamic and noise behaviour to variations in serration amplitude and wavelength. Detailed and simultaneous flow and acoustic measurements will be made to establish the noise reduction mechanism.
Aerofoil configurations and experimental setup
Aerofoil configurations
The effect of leading edge serrations on the noise and aerodynamics is investigated on a NACA65-(12)10 aerofoil, which is among a class of high-performance aerofoils, often used in cascades and turbines and designed to maximize the region of laminar flow over their surface.
27
Two models were investigated, having chords of 0.1 m and 0.15 m and a common span of 0.35 m. Measurements were made at various flow speeds in the range of
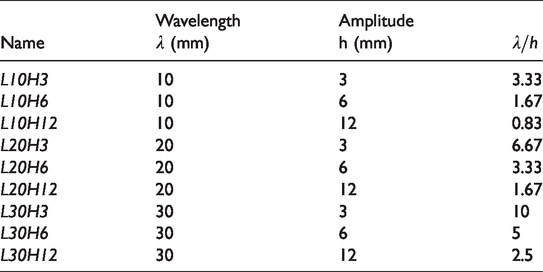
Characteristics of the different serration geometries.
The chord length c at any radial position r along the aerofoil is of the form 
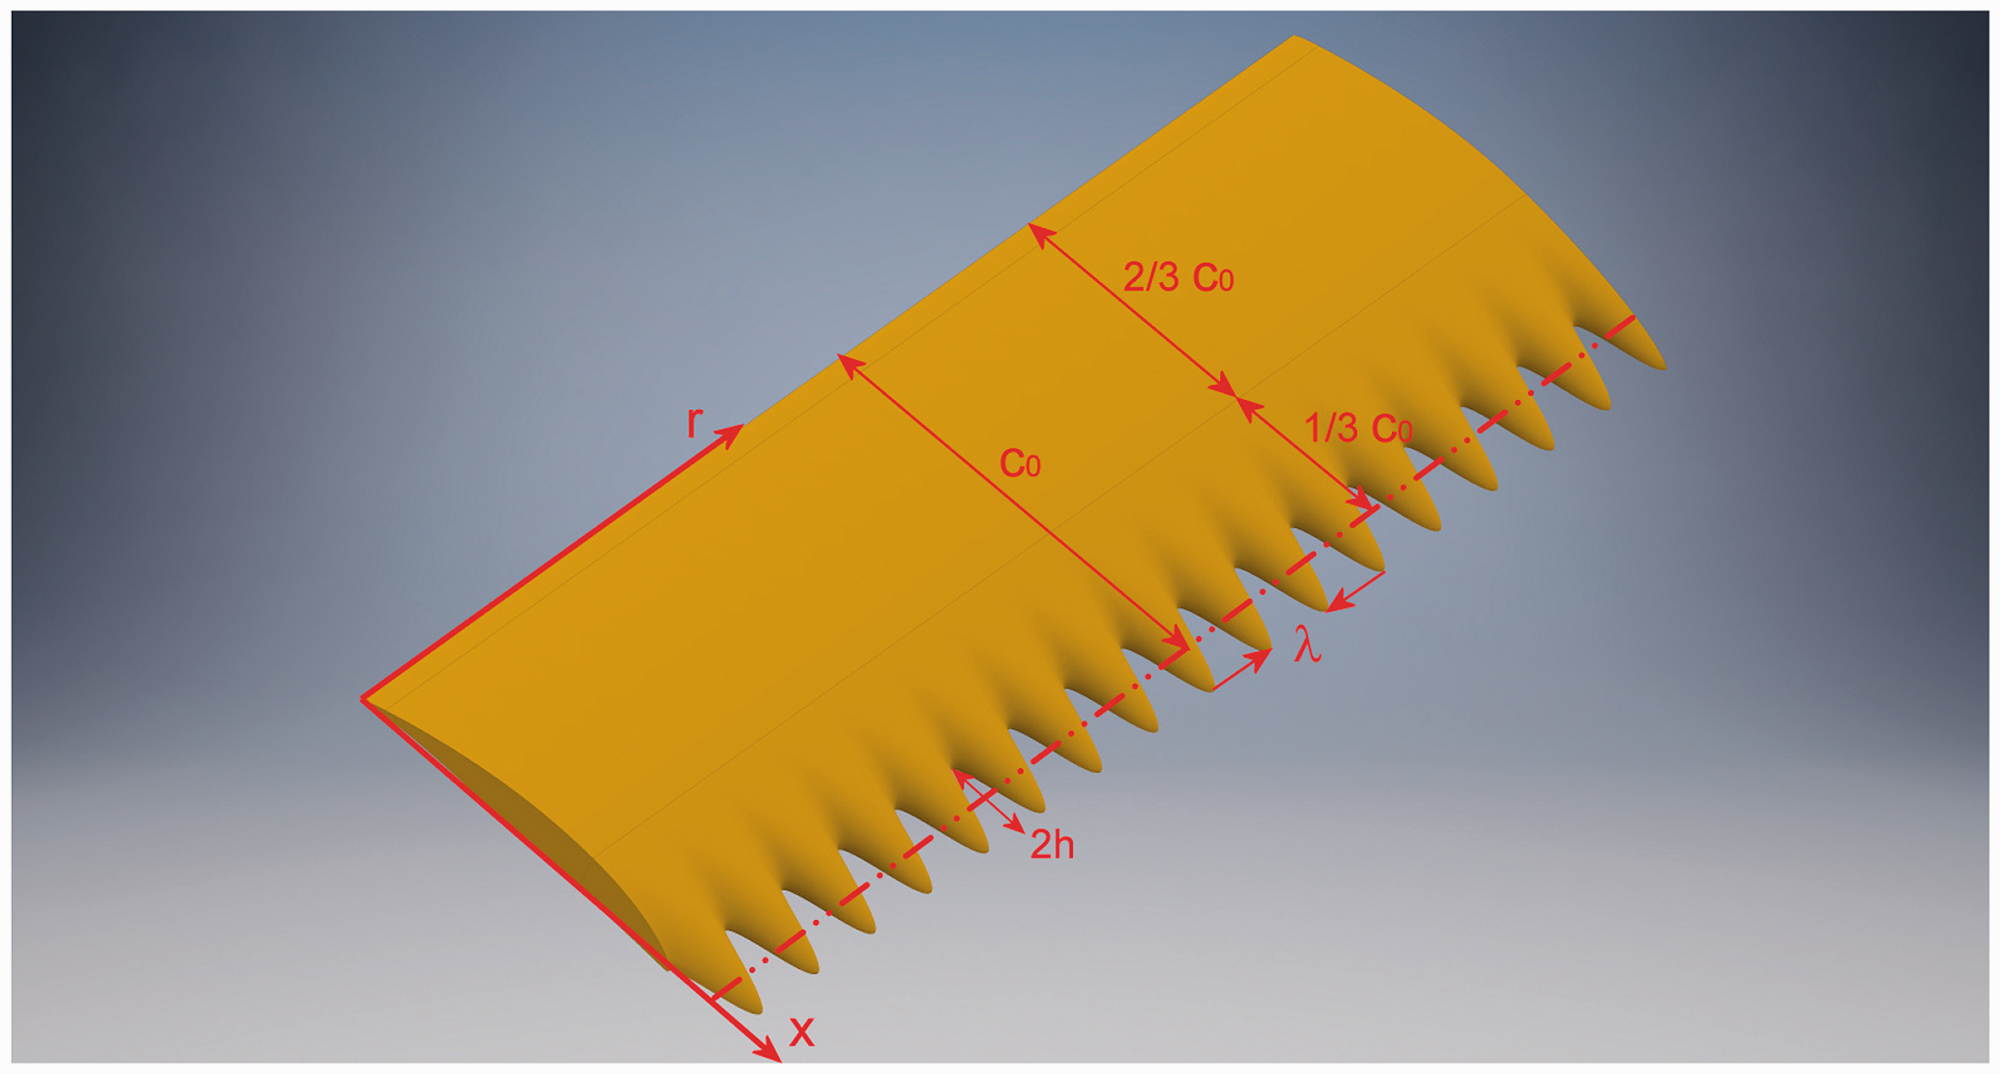
A sketch of the LE serrated aerofoil displaying its geometrical parameters.
Experimental facility
Most of noise and flow measurements were performed in the open jet wind tunnel facility at the Institute of Sound and Vibration Research (ISVR), at the University of Southampton. Photographs of the facility and the experimental set up are shown in Figure 2. A detailed description of the wind tunnel can be found in Chong et al.
28
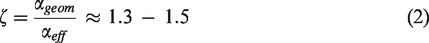
It is enclosed inside the university’s large anechoic chamber, sized 8 m × 8 m × 8 m, whose walls are acoustically treated with glass wool wedges to get a cut-off frequencies of 80 Hz. The nozzle dimensions are 0.5 m in height and 0.35 m in width. This height of nozzle together with the chord length of 0.1 – 0.15 m, ensures that the downwash deflection of the jet is sufficiently small to allow measurements near stall conditions. The ratio between the geometrical angle of attack αgeom and the effective angle αeff, i.e. after flow deflection has been taken into account, can be estimated from the relationship derived by Brooks et al.,
29
which applied to the current configuration, for c0=0.1 m and c = 0.15 m respectively, is:
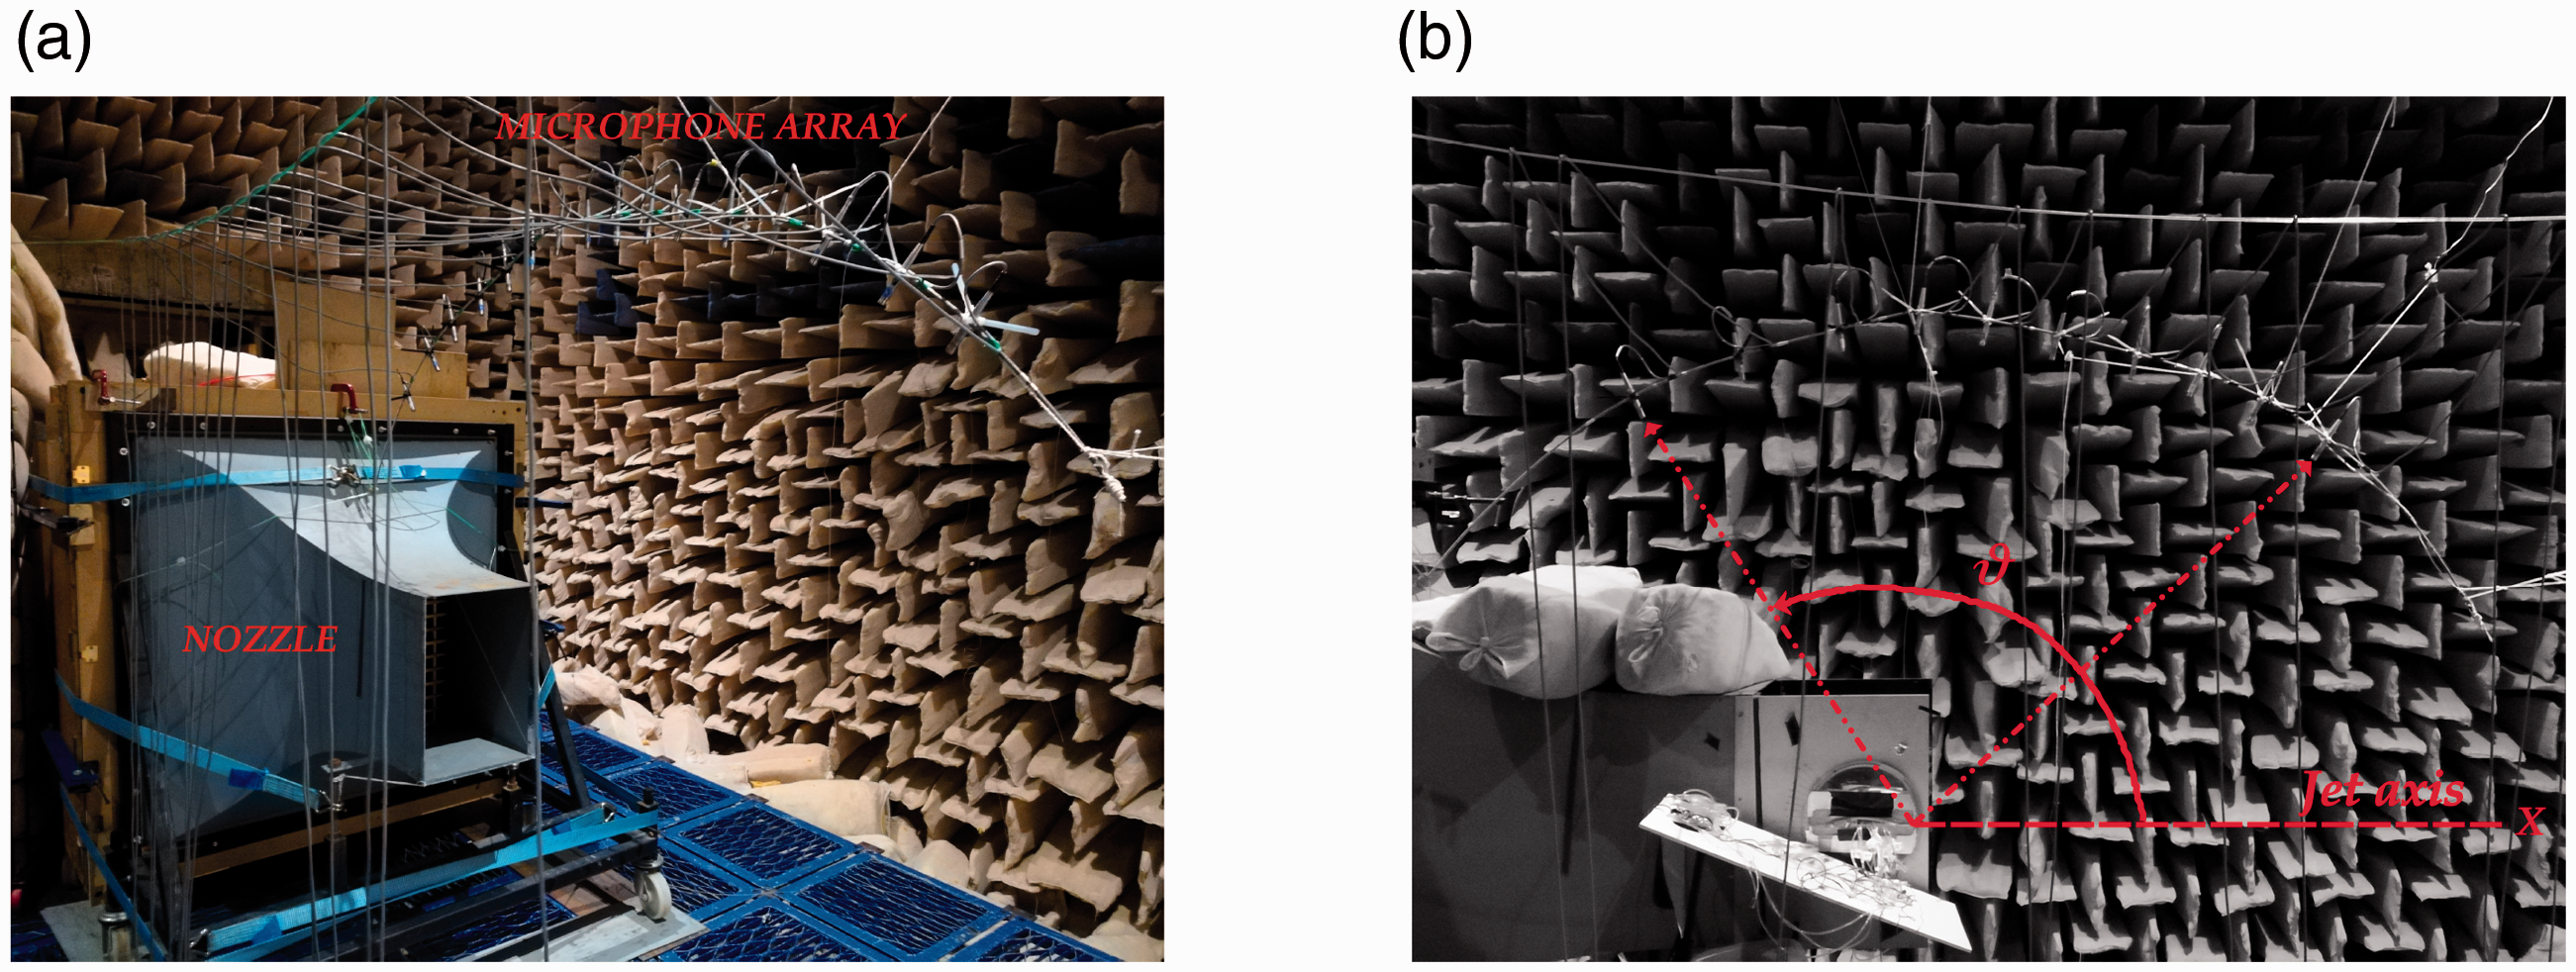
(a) Open wind tunnel and acoustic setup inside the ISVRmetanechoic chamber; b) Microphones emission angles.
Aerodynamic force measurements were carried out in an closed open-return wind tunnel at the University of Nottingham. The dimension of the test section is 0.91 m wide × 0.75 m high and 1.5 m long. In these tests, a vertically installed aerofoil model was positioned at the mid-span, 0.1 m above the floor and 0.7 m downstream from the inlet of the test section. A schematic and more details of the experimental set-up is shown in Jung-Hoon Kim et al. 30 The aerofoil was connected to a force balance by an aluminium strut which was covered by an aerodynamic shaped fairing fixed to the wind tunnel floor. A circular plate in 150 mm diameter was attached to the bottom of the aerofoil, which was set in a circular hole provided by a 360 mm × 260 mm rectangular endplate. This allows the aerofoil to rotate through its transverse axis to change the angle of attack during the measurements. A 3-component force transducer (Kyowa, LSM-B-SA1, rated capacity: 10 N) was used to measure the drag and the lift on the aerofoil. The force balance was mounted on a turntable which was connected through a 2:1 gear to a stepping motor. As the aerodynamic measurements are performed on closed circuit wind tunnel, the effective AoA, αeff is same as geometric AoA, αgeo.
Measurement procedure
Acoustic pressure measurements were made using a polar array of ten half-inch condenser microphones (
Steady and unsteady pressure on aerofoil surface
The surface pressure spectra over the aerofoil surface were estimated with remote microphone method, with a number of capillary tubes that run below the aerofoil surface between pressure taps, along the aerofoil chord and along the span close to the trailing edge, and a number of T-junctions connected to miniature microphones. The microphones are 2.5 mm diameter omni-directional electret condenser microphones (Knowles Electronics 206 FG-3329-P07). On the opposite side of the T-junction are additional capillary tubes, approximately 3 m in length, to avoid reflections from the closed end. Surface pressure measurements were likewise acquired for a duration of 20 s at a sampling frequency of 40 kHz. Special care was given to the sealing of the microphone within the T-junction block, which was found to affect the pressure measurements. The miniature microphones were calibrated in-situ against a reference
PIV measurement
The velocity field around the aerofoil was investigated by means of the Time Resolved Particle Image Velocimetry (TRPIV) setup shown in the photograph in Figure 3. Velocity data was obtained at a frequency of 4 kHz and based on the acquisition of roughly 20,000 images, corresponding to 5 s of data. A Nd:YLF laser capable of a high-repetition rate of up to 10 kHz was used to generate a light beam, then converted by a system of cylindrical and spherical lenses into a light sheet of 1 mm thickness with which to illuminate the vertical plane along the chord of the aerofoil in the streamwise direction. Two high speed Phantom v641 cameras, set at a resolution of 1024×512 pixels (0.5 MP) and in a T-shape configuration, were used to frame the area around the aerofoil, primarily on the suction side, as shown in Figure 3 (Right). The cameras have a 10 μm sensor pixel size and are equipped with an 85 mm focal length lens. The flow was seeded using a Martin Magnum 1200 smoke machine, positioned at the inlet of the centrifugal fan of the wind tunnel, which provided a uniform particle distribution of the flow from the nozzle with diameters of roughly 1 μm. From the raw images, the average particle image size was assessed to be approximately 2.2 pixels and the number of particles per pixel
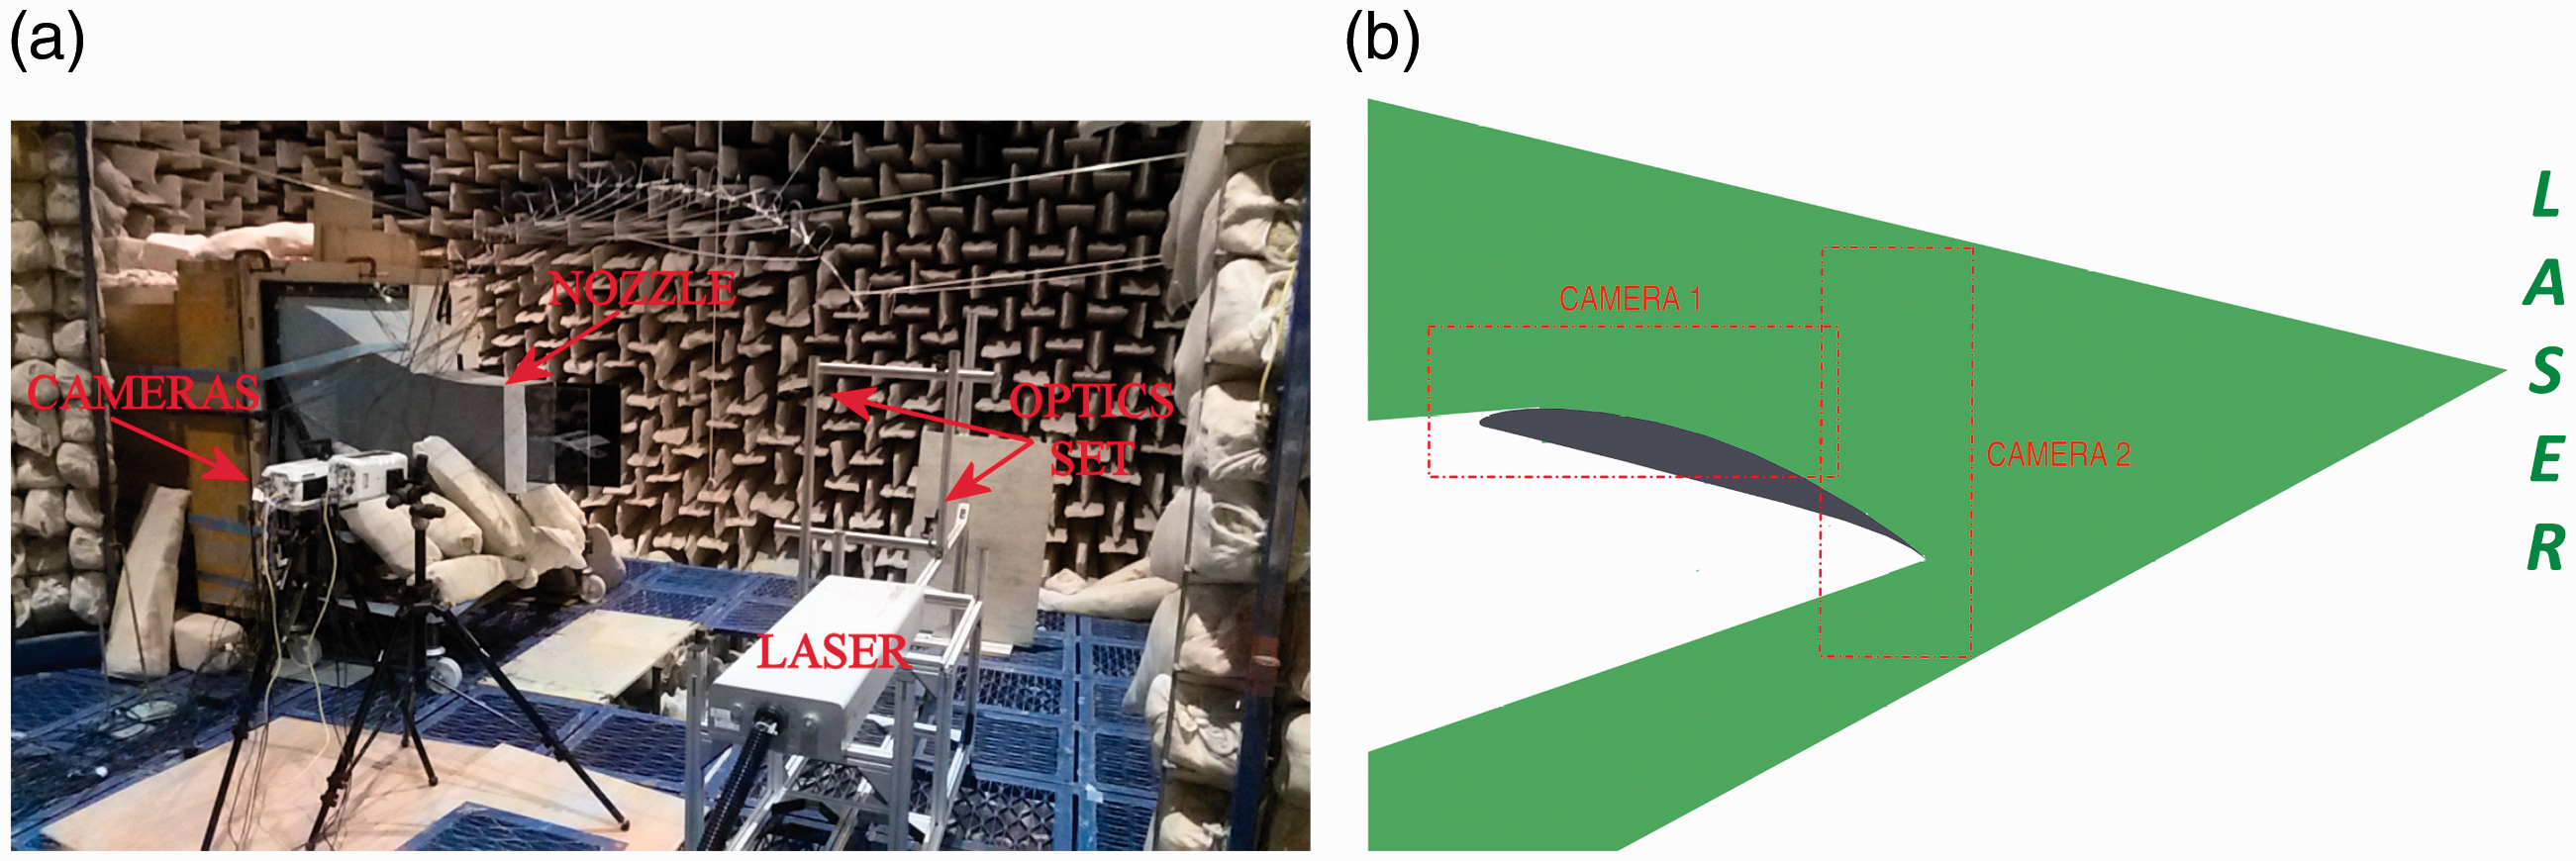
(a) TRPIV setup inside the ISVRic setup inside the I(b) Sketch showing the PIV cameras fields-of-view (dashed lines) and the total framed area.
The PIV images were processed using digital cross-correlation analysis. 32 A multi-grid/multi-pass algorithm, 35 with an iterative image deformation36–39 was applied to compute the instantaneous velocity fields, setting the final interrogation window size as 32x32 pixels with an overlap factor of 75%. Spurious vectors are eliminated by means of a vector validation algorithm, based on a regional median filter, 40 with a kernel region of 3 × 3 vectors, and group removing.
Results
Aerodynamic characteristics of baseline aerofoil
Most of the aerodynamic and aeroacoustic measurements presented in this paper were performed with an aerofoil 0.1 m chord. Before investigating the aerofoil noise characteristic over the range of angles of attack, including pre-stall and post-stall conditions, we first consider the variation in the Cp distribution and lift and drag over this range of angles. The main purpose of this measurement is to quantify the development of the separated flow region with increasing AoA. The aerodynamic measurements were made in the closed wind tunnel at the University of Nottingham at a free-stream velocity of
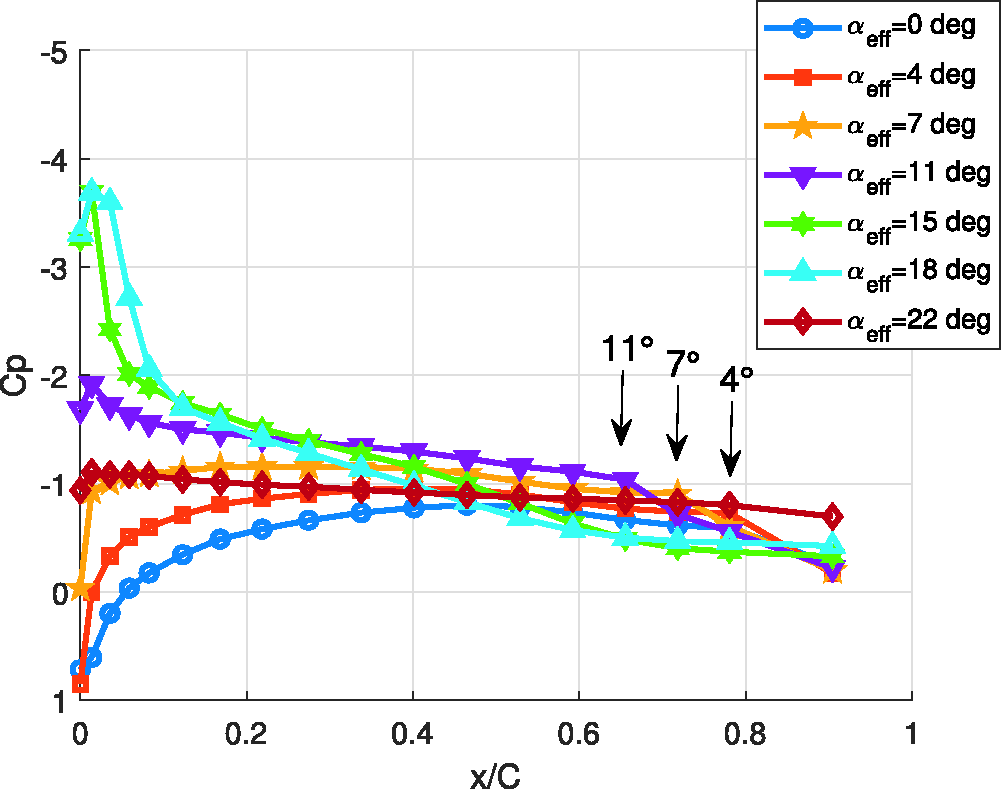
Pressure distribution on the NACA65(12)10 aerofoil suction side at different angles of attack.
Figure 4 provides clear evidence of separation even at very low angles of attack. At
A comparison of the overall lift and drag coefficient variation with AoA is shown in Figure 5. The lift coefficient variation can be observed to increase at a constant slope until about
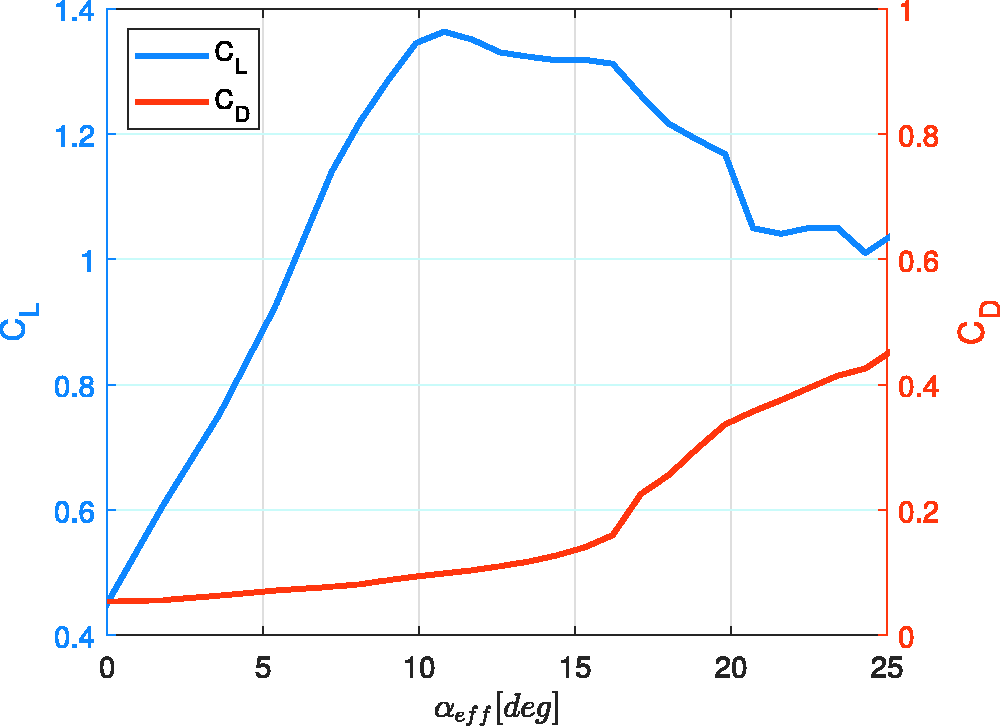
Lift and drag curves versus angle of attack.
Noise characteristics due to baseline aerofoil
Before presenting the measured noise reductions due to leading edge serrations we first investigate the noise characteristics of the untreated baseline airfoil. Aerofoil noise at high angles of attack has been measured in a number of previous studies.42–46The noise spectrum associated with flow separation is characterized by a spectral hump centred at relatively low frequencies determined by the dimensions of the separated zone, such as the boundary layer thickness 42 or the distance from the trailing edge at which separation occurs. 46 We conclude from these findings that the noise spectrum is predominantly determined by the eddy structures within the separated flow.
Figure 6 is a colour map showing the variation in sound power level versus frequency and effective angle of attack (obtained from the correction of equation (1)), relative to the noise at
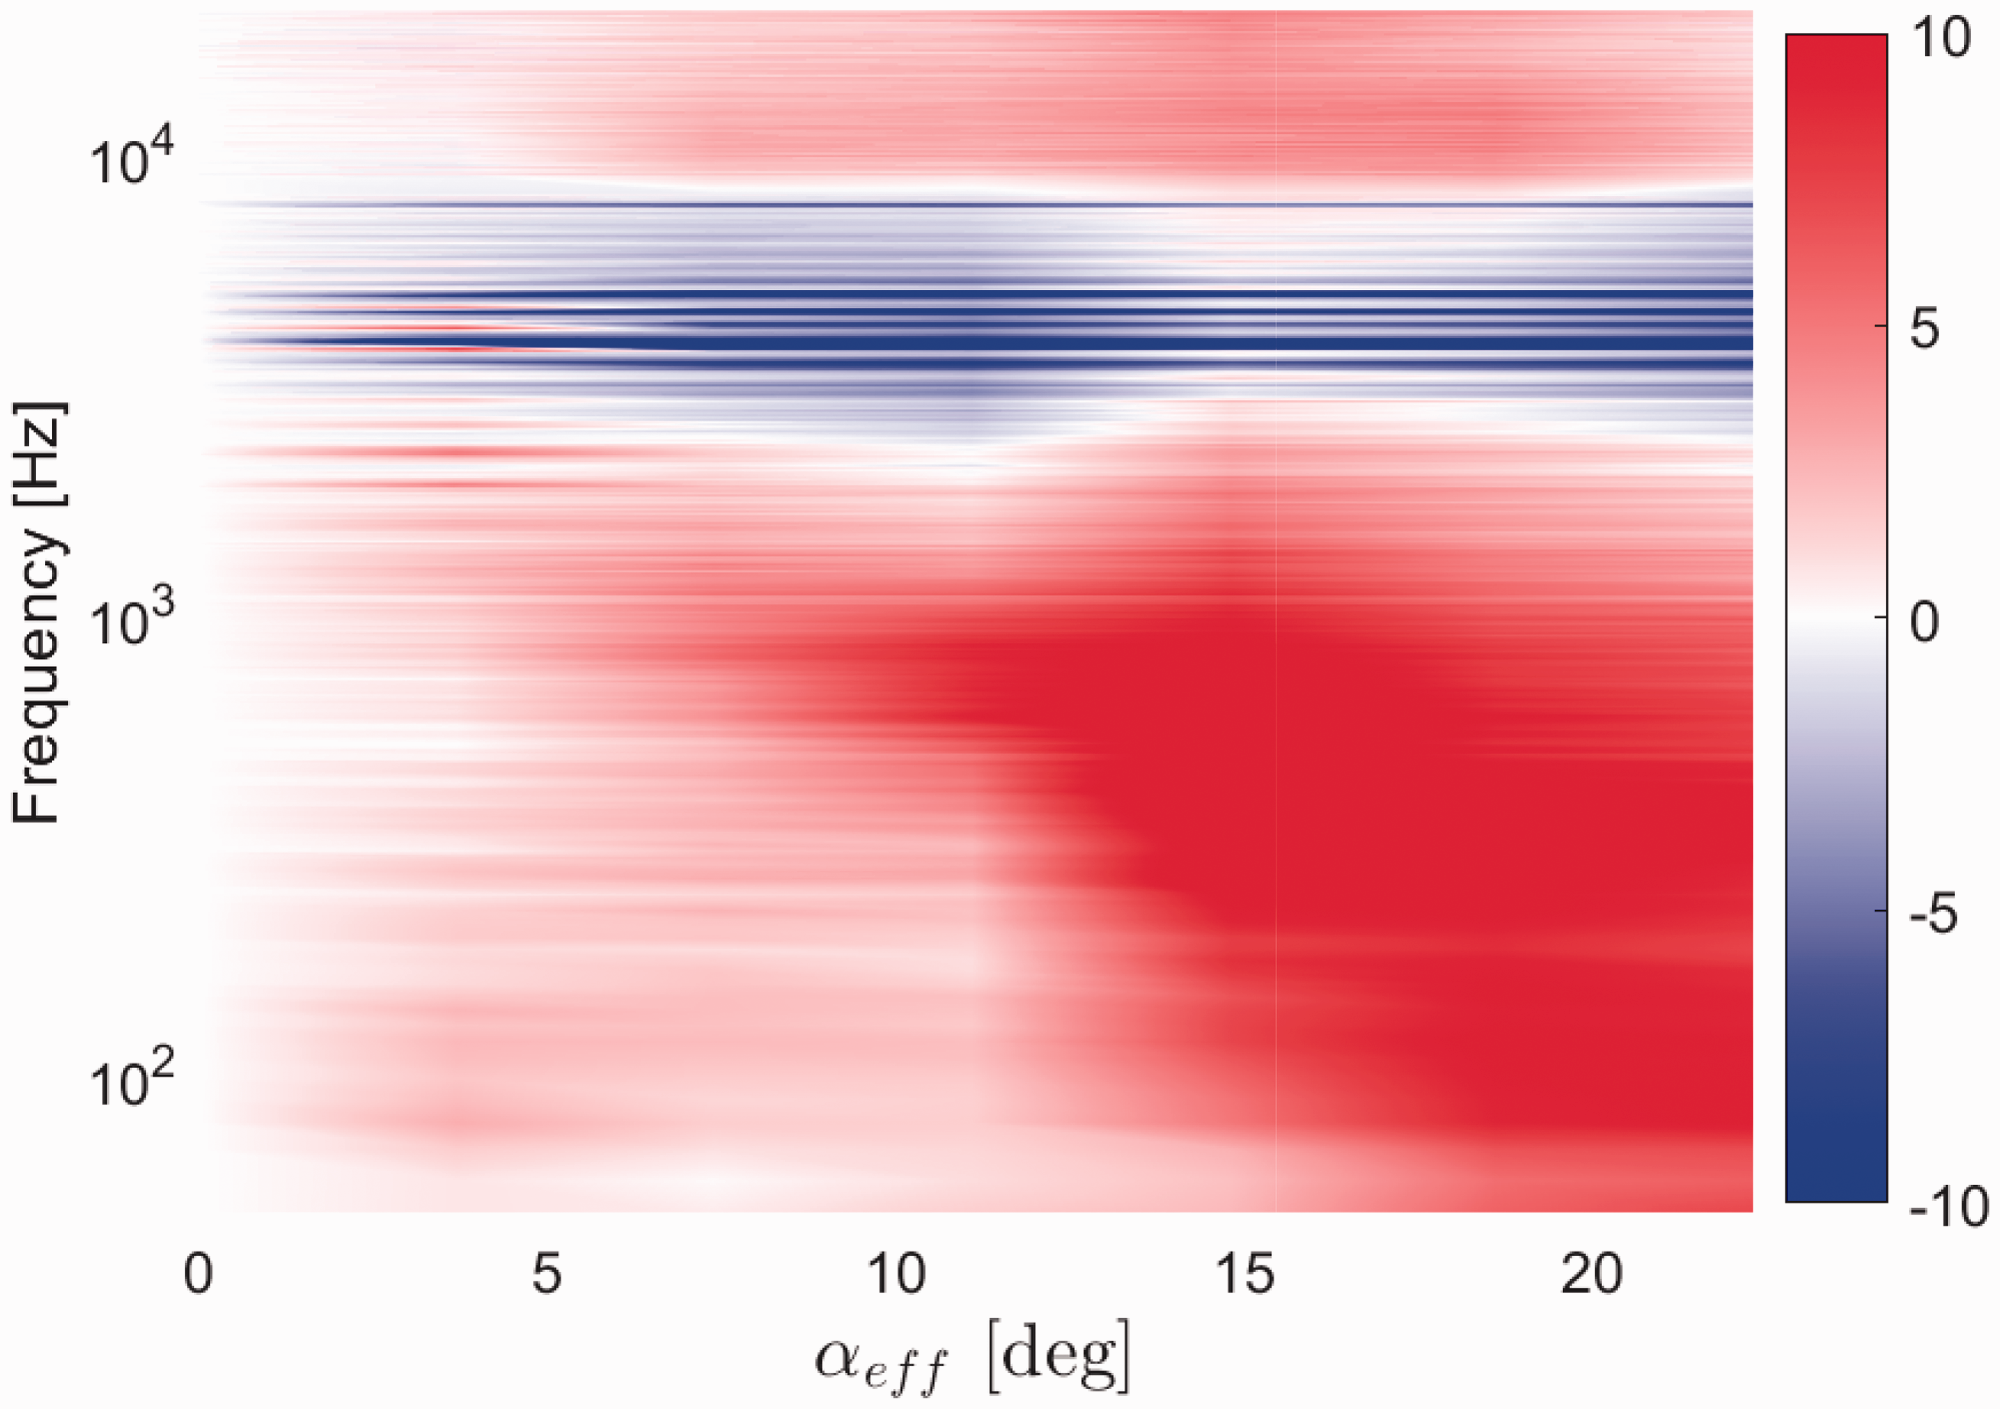
Change in sound power level (
The bandwidth of the spectral hump characteristic of separation noise can be observed to increase while its centre frequency decreases with increasing AoA. Particularly striking is the sharp increase in noise at
The behaviour of the noise spectra with AoA is more clearly seen in Figure 7, which shows the Sound Power Level spectra compared at seven angles of attack between 0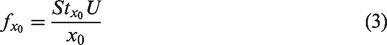
Noise results for the baseline NACA65(12)10 aerofoil at
Noise characteristics due to serrated aerofoils
In this section we present the noise reductions for the serration geometries introduced in Table 1, comprising all combinations of the three serration amplitudes of 3, 6 and 12 mm (
Trend of the reduction of separation noise
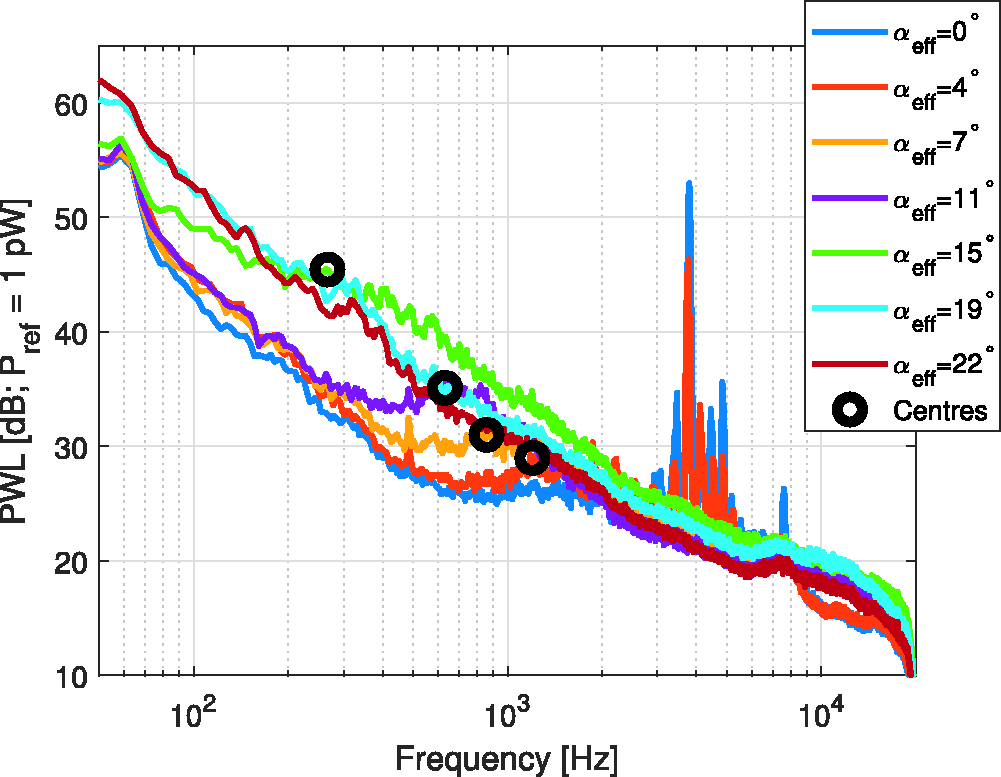
The variation in overall noise reductions versus AoA can be observed to fall into three angle regimes I, II and III corresponding approximately to
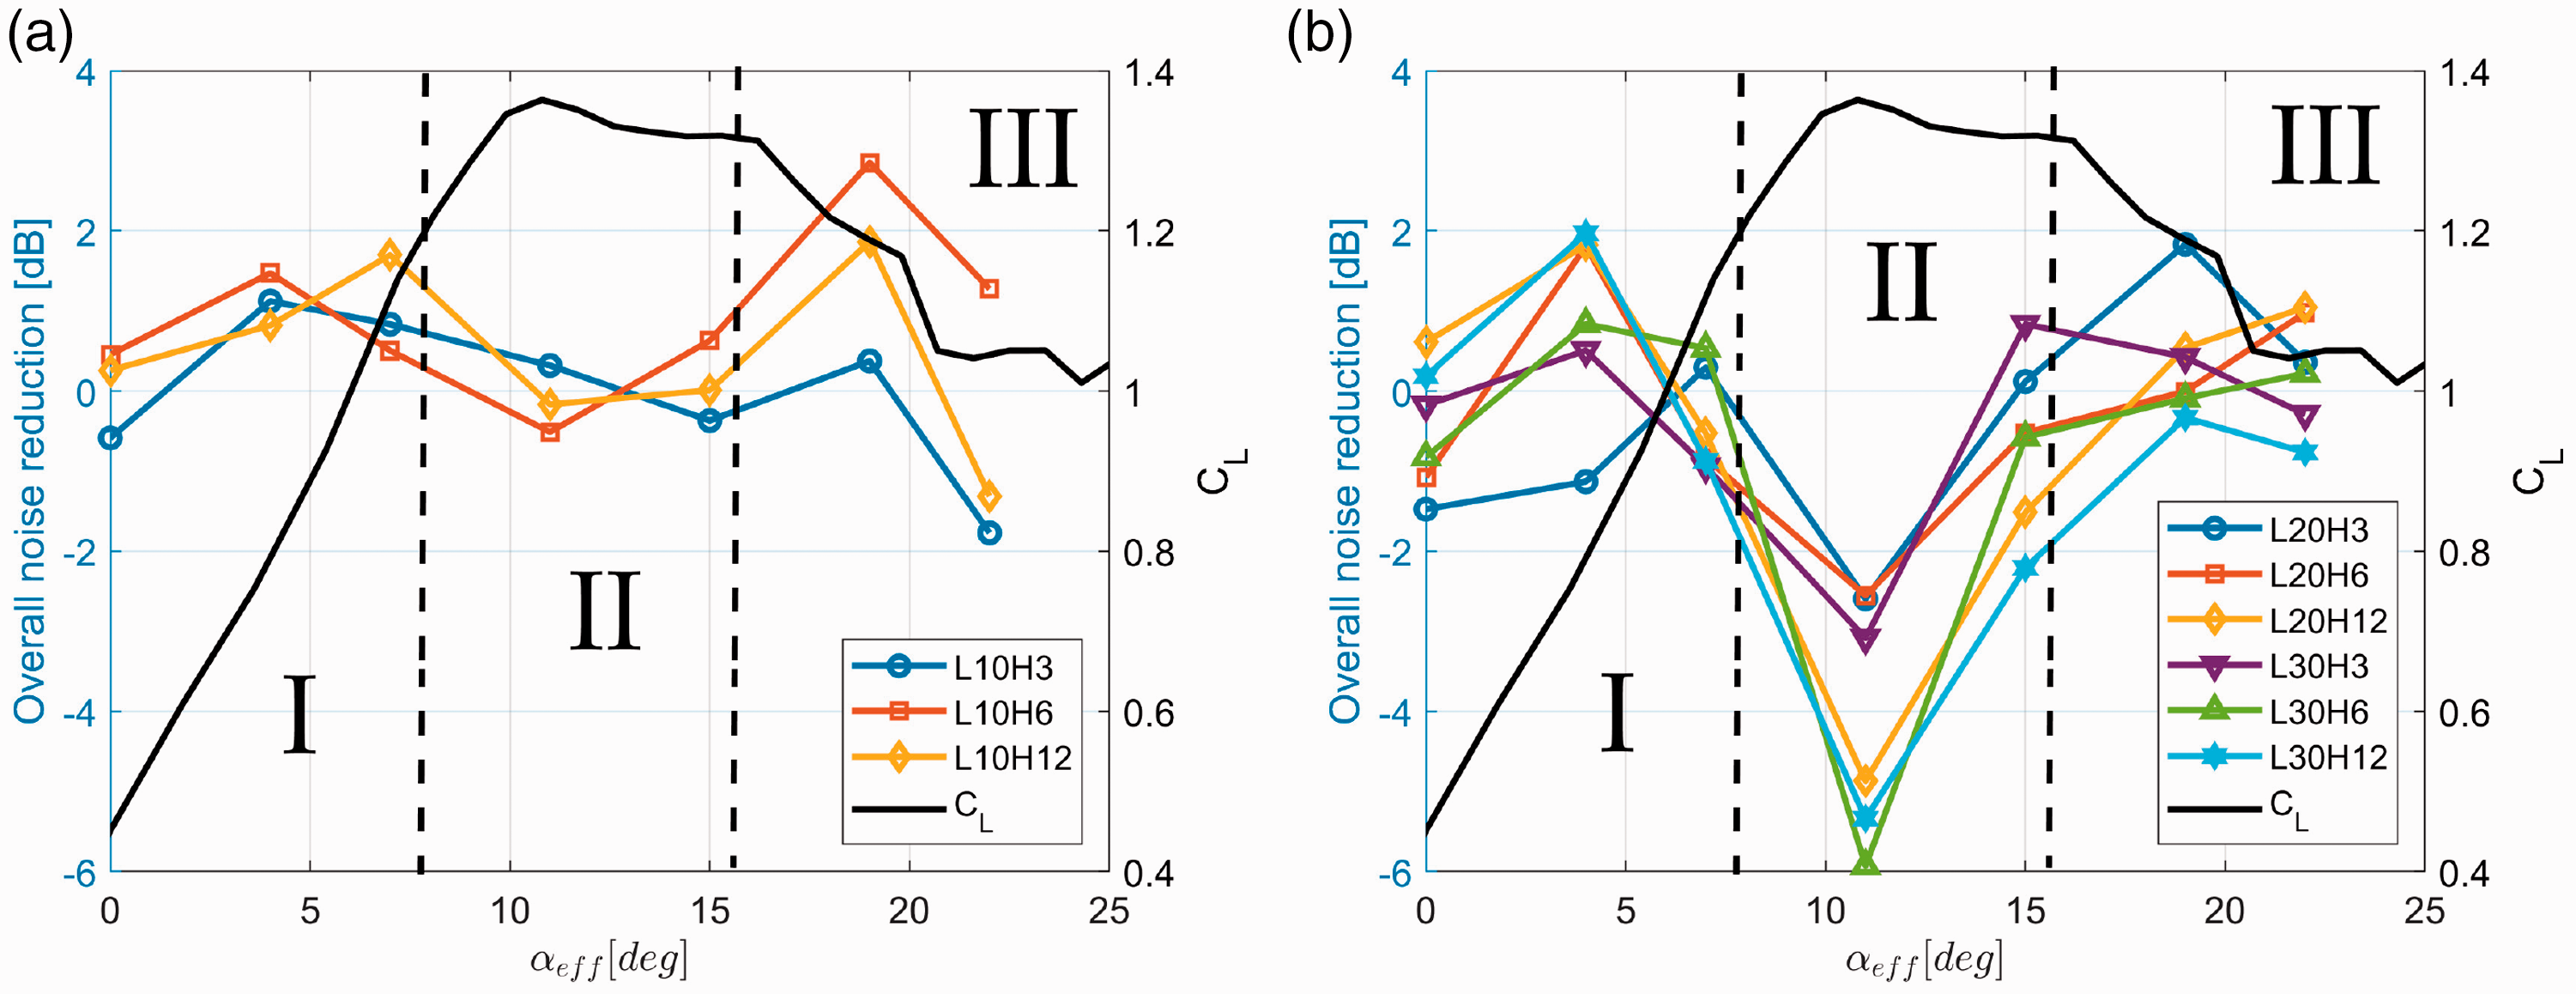
To understand the noise reduction mechanisms in the three angle regimes, we investigate the noise reduction spectra for a representative angle in each regime. Figure 9(a) to (c) below shows a comparison of the Sound Power Level spectra for the baseline aerofoil and the L10H12 serration at the three representative AoA of
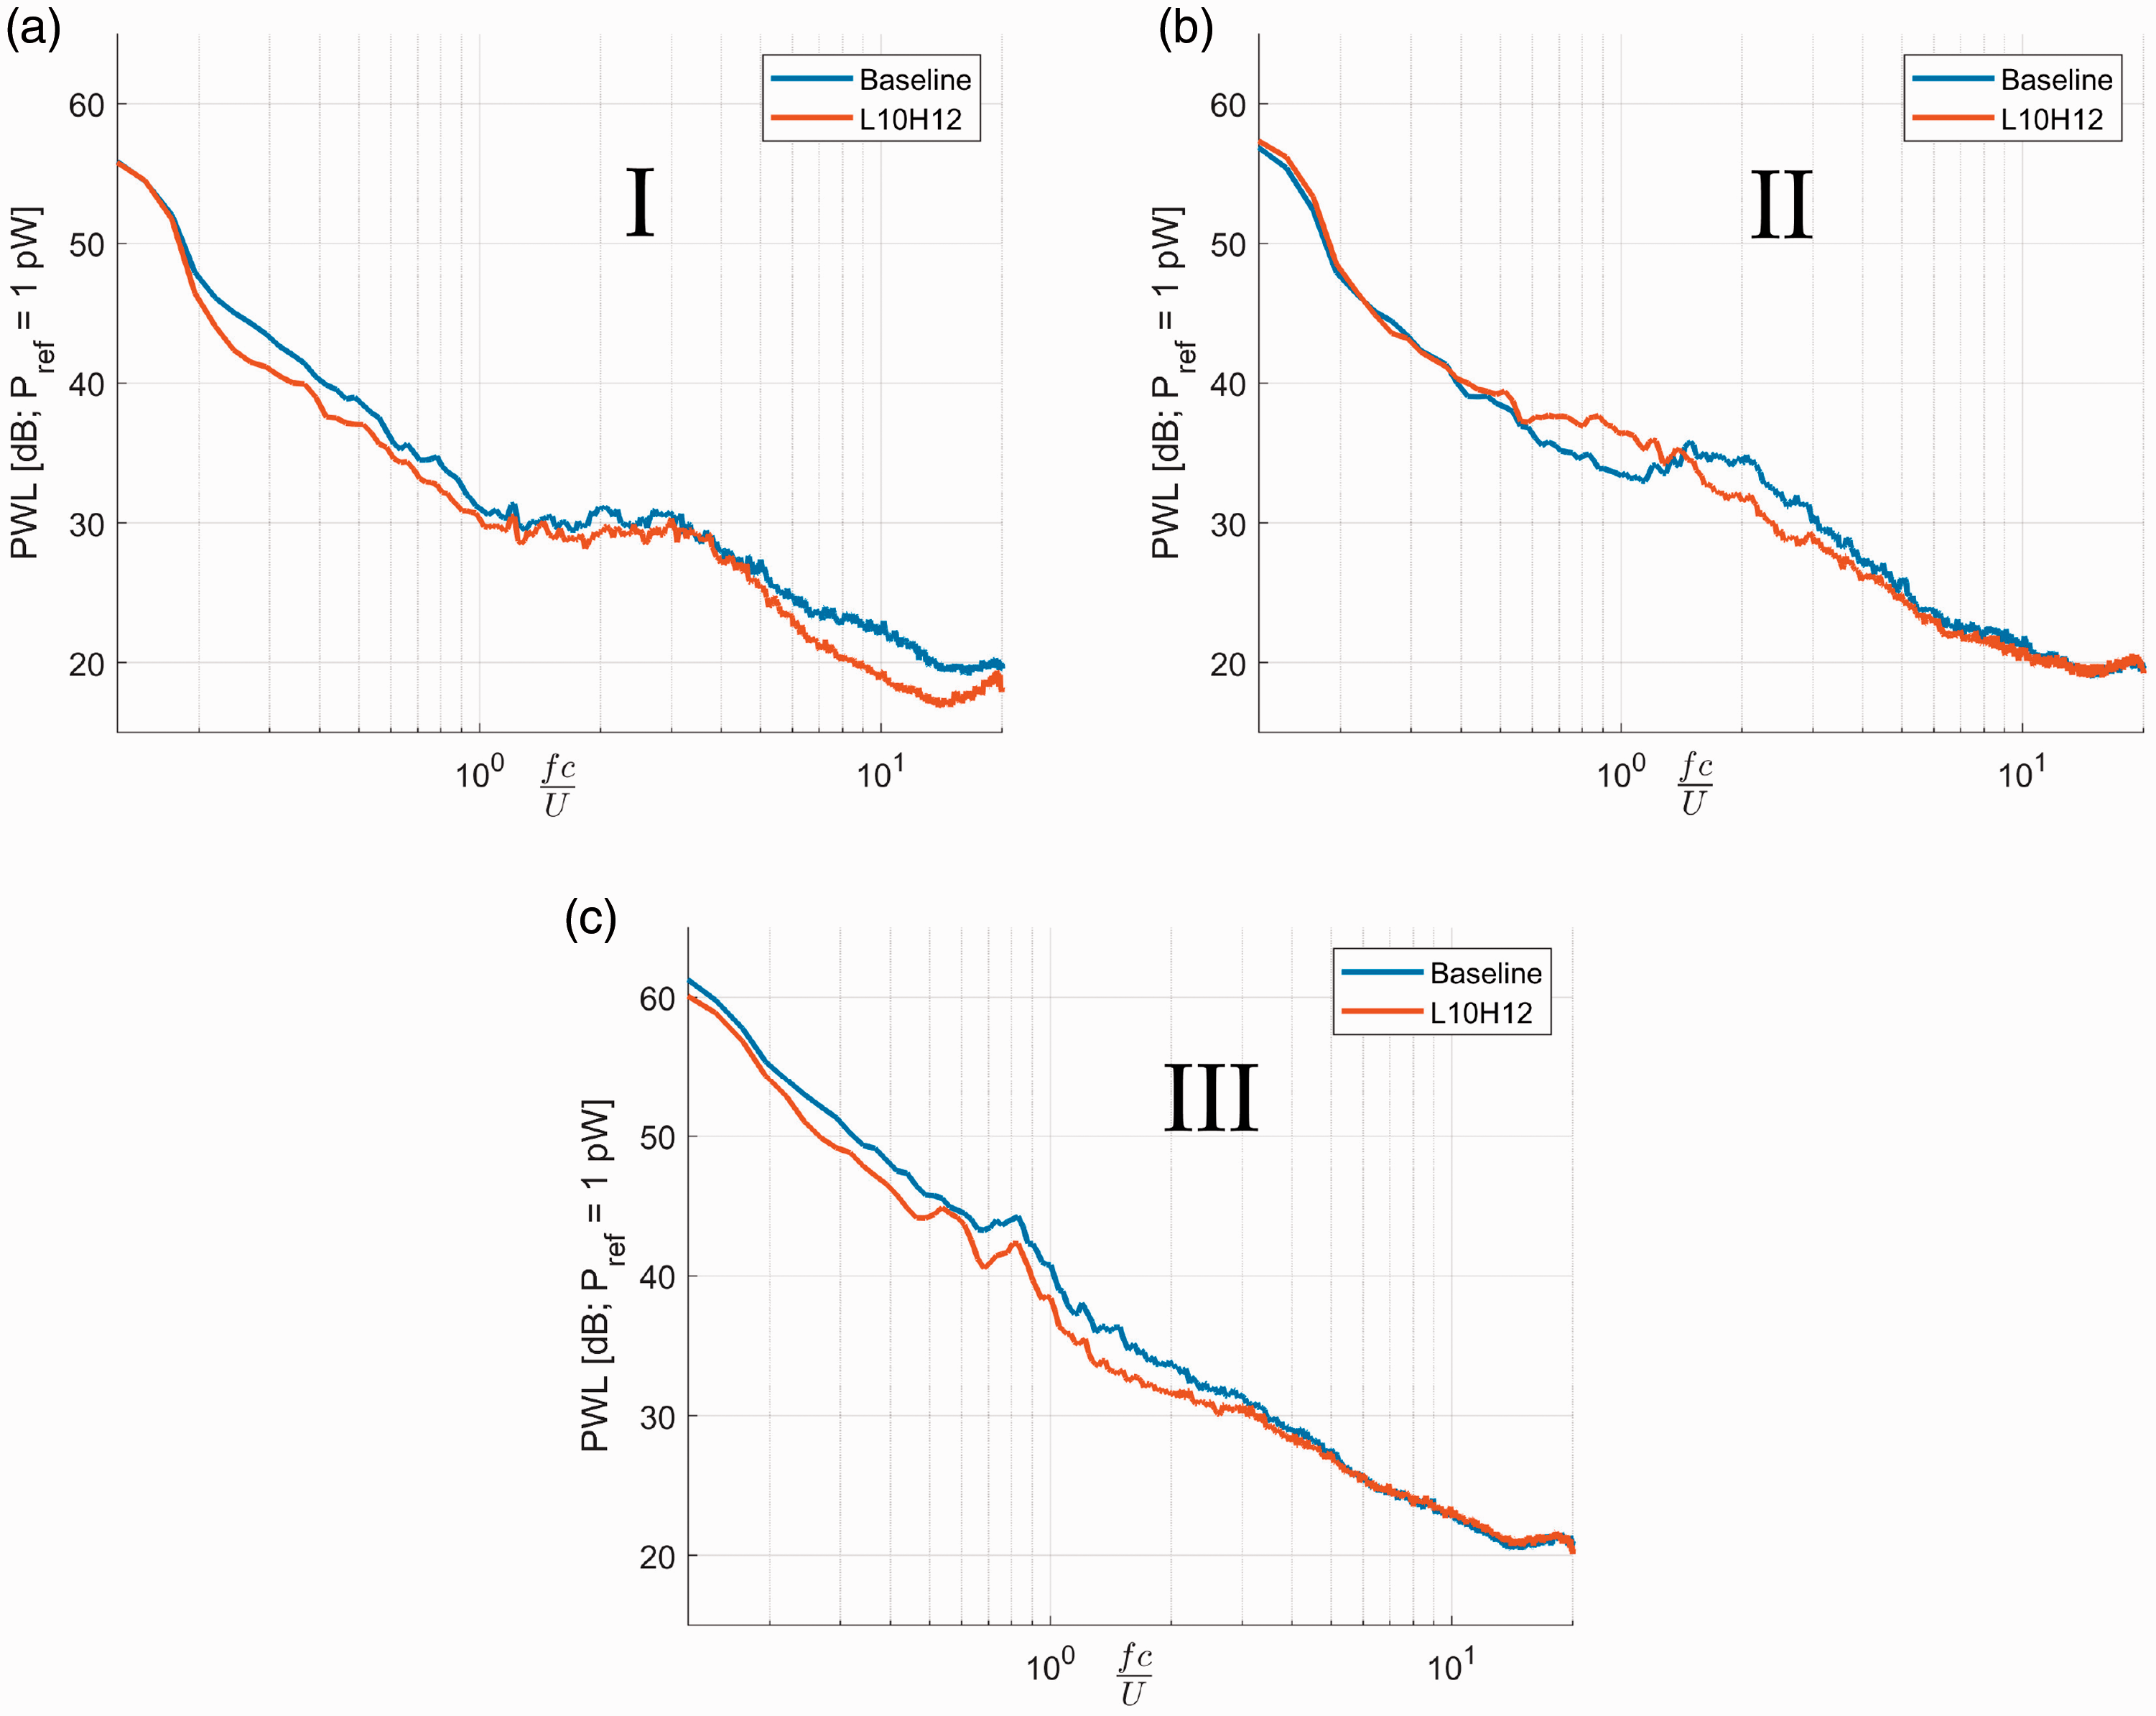
Far-field noise emitted spectra of the baseline and serrated aerofoils (L10H12) at different angles of attack: (a)
From hereon all noise reduction spectra will plotted against non-dimensional frequency
At AoA =
Figure 8(a) has demonstrated that, for the leading edge serration with the smallest wavelength under consideration, it is possible to obtain noise reductions over a wide range of angles of attack. We now consider the effect on the noise reductions of increasing the serration wavelength. Figure 8(b) shows the variation in overall noise reduction in the frequency range between 100 Hz and 1000 Hz versus AoA for six different serration profiles comprising all combinations of two wavelengths of 20 mm and 30 mm and three serration amplitudes of 3 mm, 6 mm and 12 mm. Again we overlay the variation in lift of the baseline aerofoil for comparison.
A similar trend with AoA can be observed for these six cases as was observed for the smallest wavelength plotted in Figure 8(a), with the general behaviour being grouped into three angle regimes. In general, noise reductions are obtained at low AoA for which the flow is partially attached, and at high AoA for which full separation occurs. However, relatively large increases in noise are now observed in the range of AoA in between.
Finally, to understand in greater detail the dependence of noise reductions due to serration geometry, the noise reduction data plotted in Figure 8(a) and (b) are shown again in Figure 10(a) and (b) now plotted against the ratio
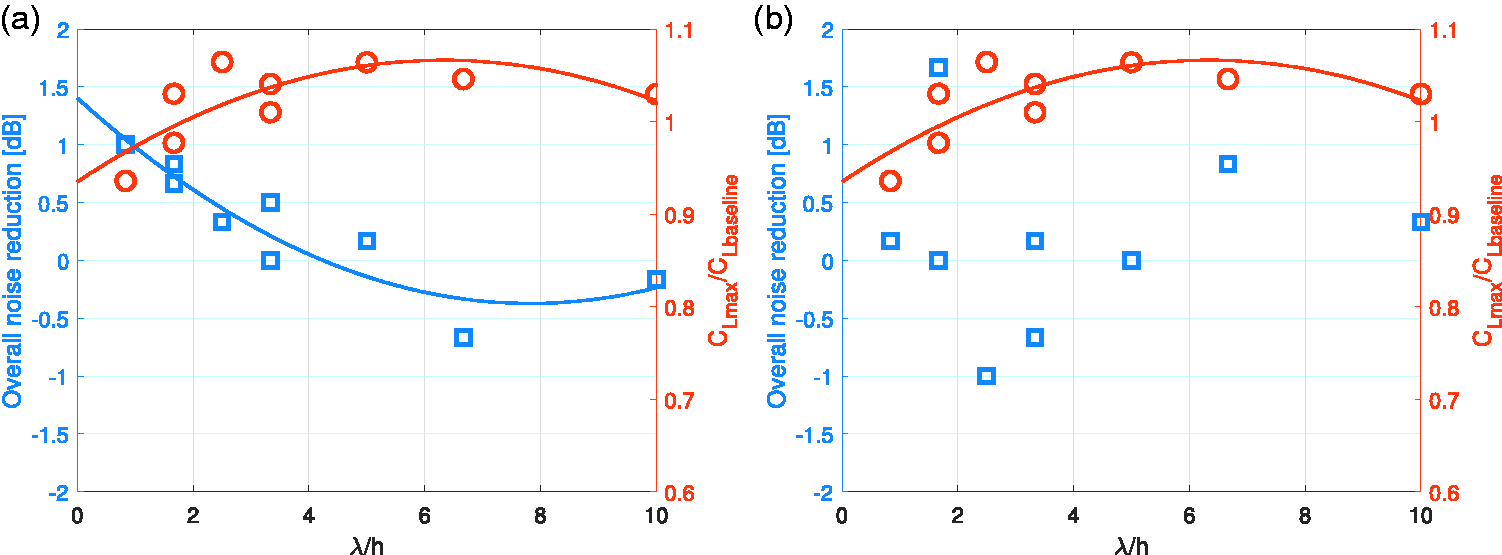
Average noise reduction in the frequency range
The noise reductions in Figure 10(a) show a clear trend with
By contrast, no clear trend is evident in Fig 10(b) for the variation in the noise reductions versus
Serrated aerofoil lift
An important requirement for design modification to an aerofoil geometry is that its aerodynamic performance is not too adversely affected. The lift generated by the baseline aerofoil and the two serration geometries L10H12 and L30H6 were measured by means of a 3-component force transducer (Kyowa, LSM-B-10NSA1, 10 N). The lift versus AoA is shown in Figure 11.
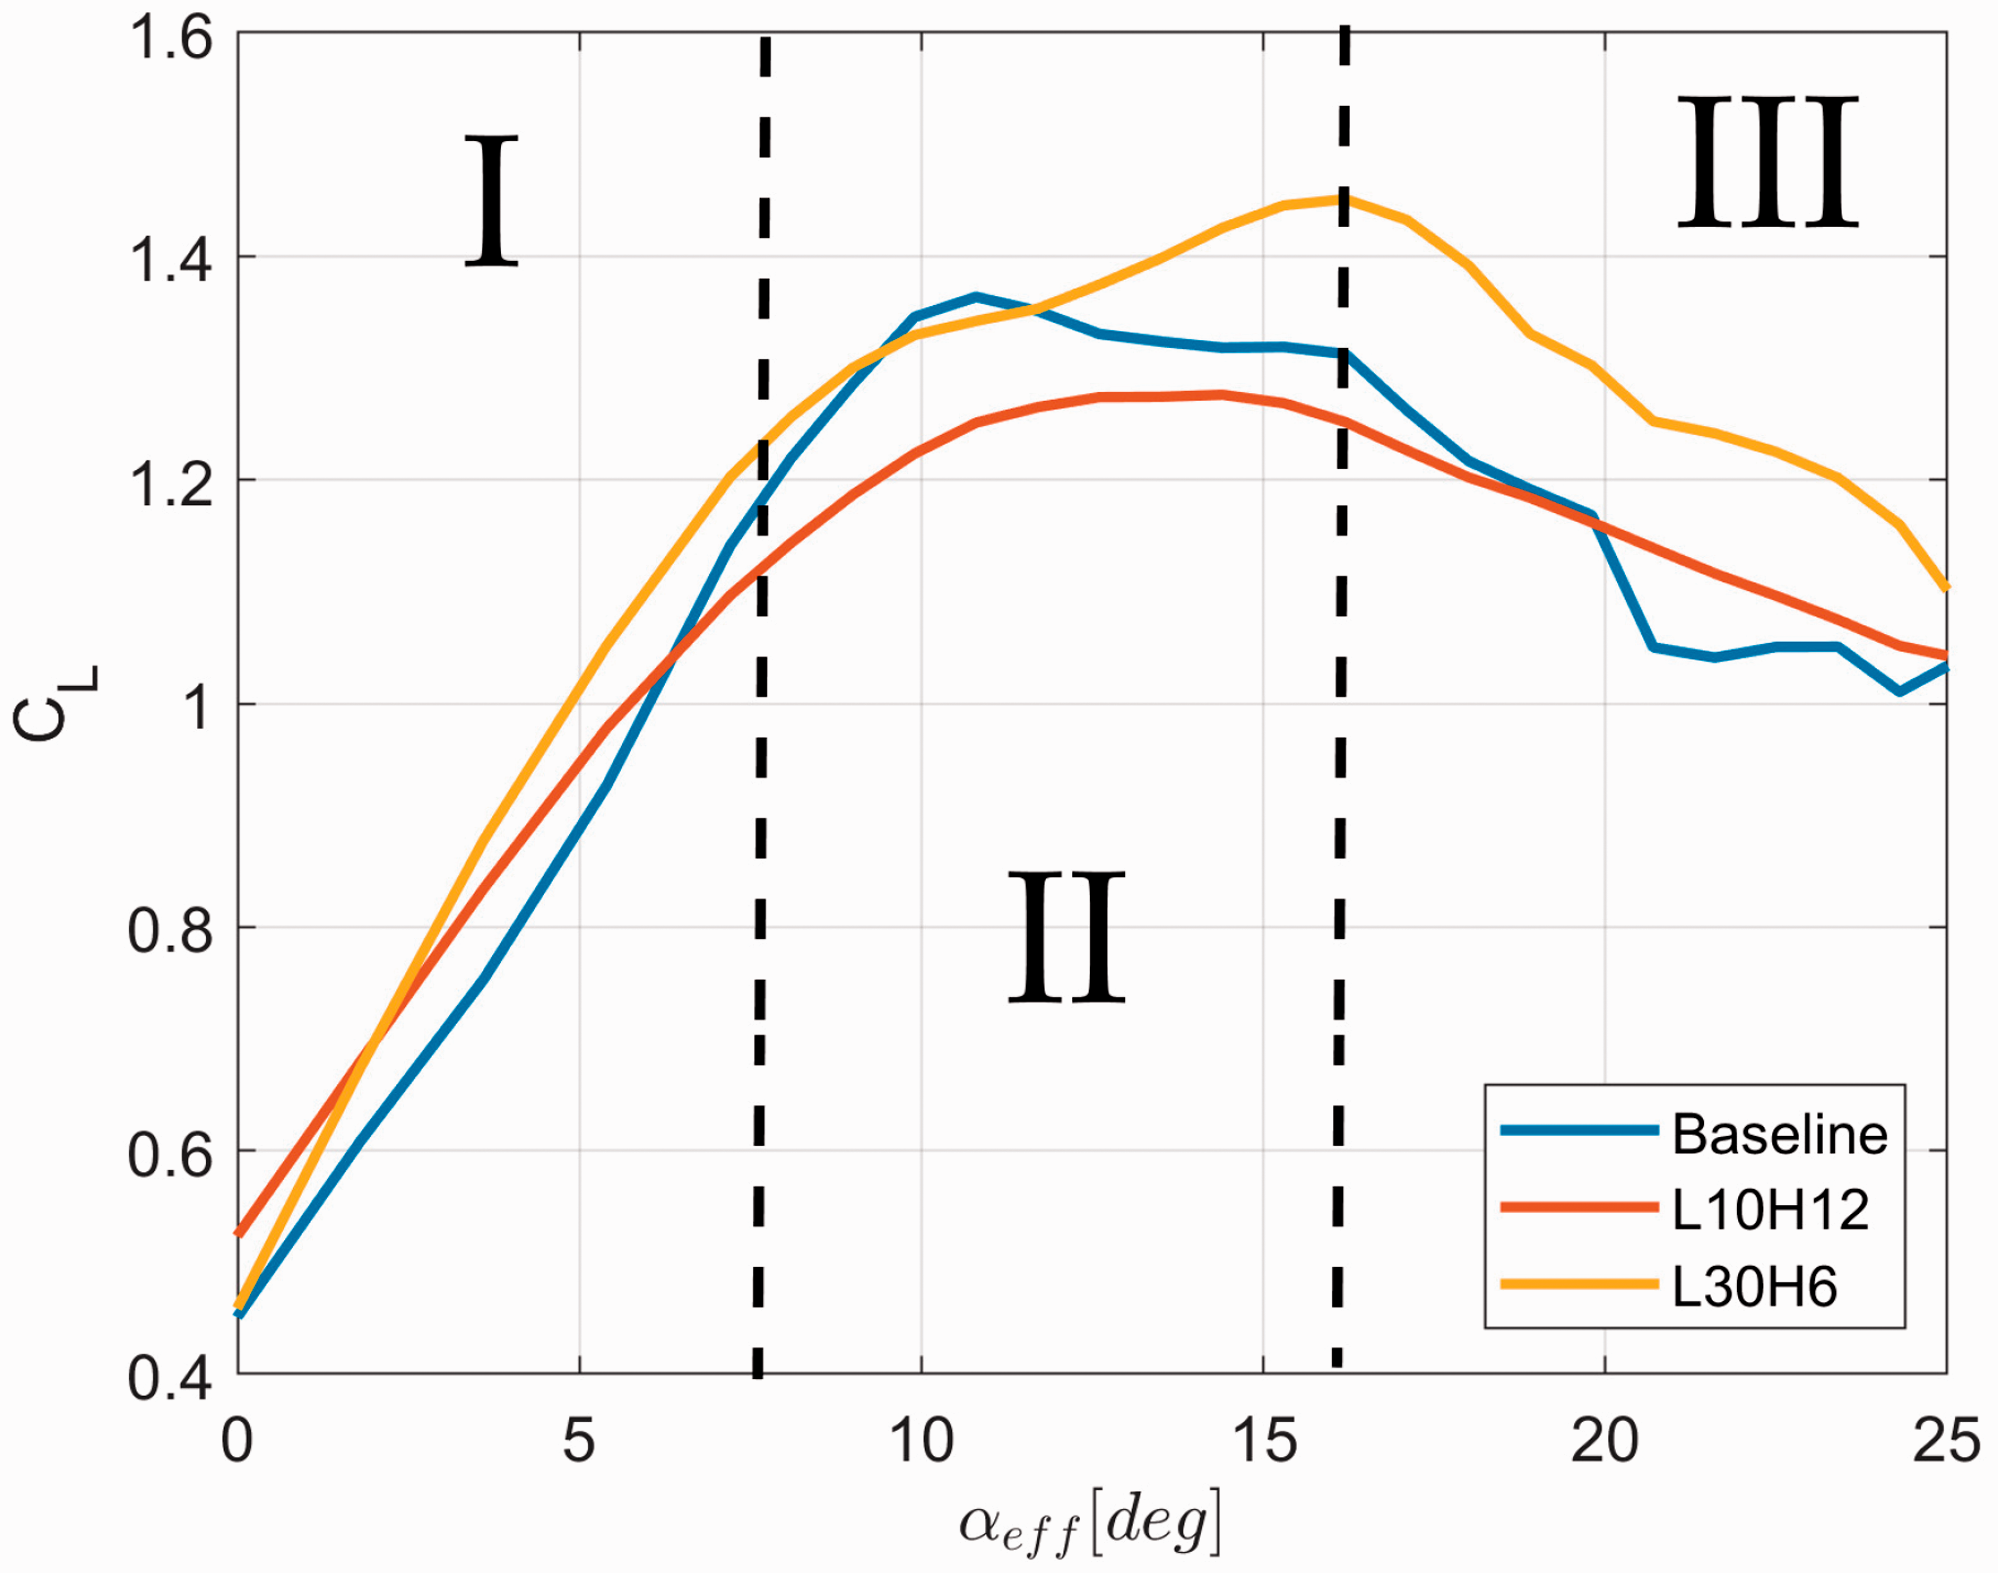
Lift coefficient for the baseline and two different serrated aerofoils (L10H12; L30H6).
The L30H6 serration with the largest wavelength can be observed to provide improved lift performance over all AoA compared to the baseline aerofoil. Less improved performance can be observed for the serration with the smaller wavelength, except near stall where the lift is lower. This behaviour is opposite to the behaviour observed for the noise reductions shown in Figure 8 providing further confirmation that aerodynamic and acoustic behaviour exhibit opposite trends.
Reduction mechanisms
This section is concerned with the understanding of the noise reduction mechanisms associated with leading edge serrations for each of the three angle regimes identified above. We now consider each of these in turn.
Angle regime I: Low angles of attack
; partial separation
For the three angles of attack lying in angle regime I indicated in Figure 8, clear overall noise reductions can be observed. In order to understand the mechanism associated with this reduction we first investigate the flow field around the aerofoil by means of a planar PIV measurement for a baseline aerofoil and the L30H6 serrated aerofoil. This serration was previously shown to provide greater lift over all AoA compared to the baseline aerofoil (see Figure 11) as well as providing overall noise reductions of approximately 1 dB at AoA below about
Figures 12(a), (c) and (e) on the left hand side of this figure show the RMS value of the streamwise velocity component
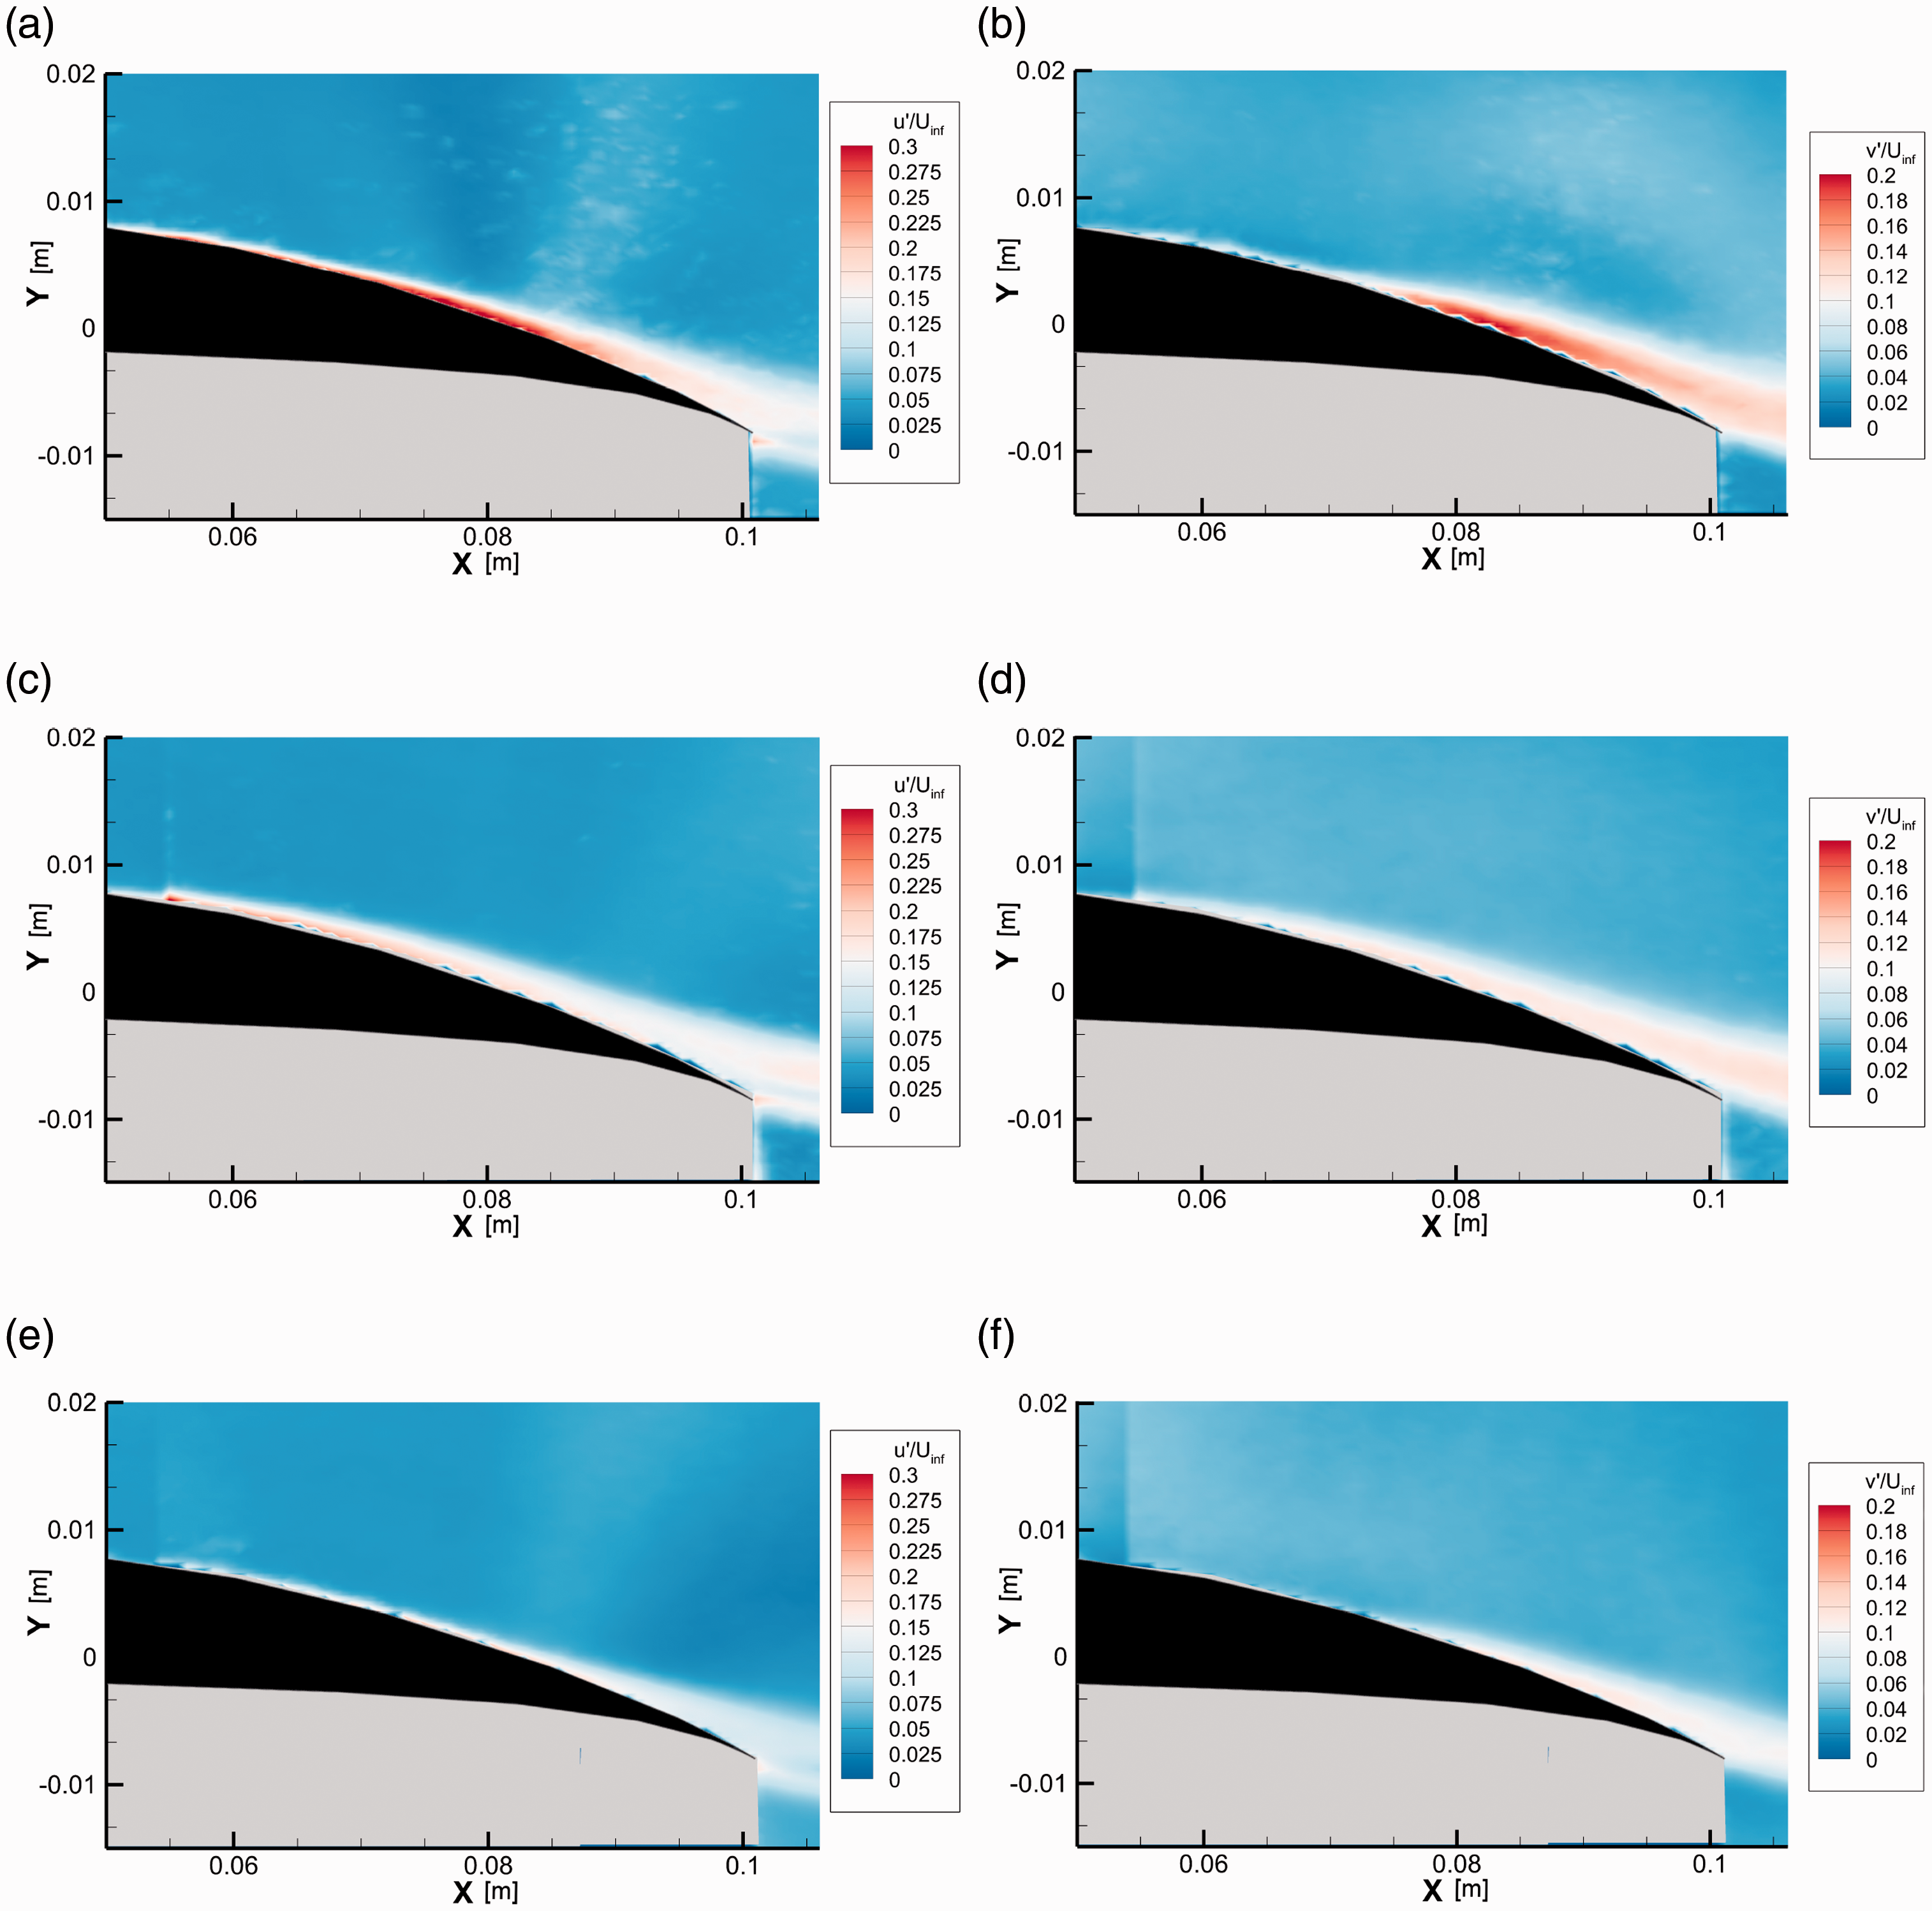
Contour plot of the two components of the velocity fluctuations as measured around the downstream part of the aerofoil at
Introducing serrations at the leading edge can be observed to have a clear effect on the boundary layer near the trailing edge where reductions in turbulent RMS velocity of about 50% can be observed in both root and tip planes for both velocity components. Improved spectral information on the turbulence velocity near the trailing edge was obtained using Hot Wire anemometry. This velocity information will be used in the next section as input data to the TNO model to assess whether the reduction in far field noise is consistent with the modification to the boundary layer caused by the introduction of leading edge serrations. A single hot wire was traversed vertically 1 mm downstream of the trailing edge, 5 cm above and below the trailing edge in 50 equal intervals. This range of heights above and below the trailing edge provides a good representation of the boundary layer close to the trailing edge on both pressure and suction sides for both baseline and serrated L30H6 aerofoils. Here, the measurements were performed near the root of the serration, since this was the location where the minimum reduction of fluctuations compared to baseline aerofoil are observed, or in other words the maximum level of fluctuating velocities for the serrated aerofoil. It is also known from previous studies that the root is the dominant source of noise due to enhanced streamwise vortices.
7
Velocity data was acquired for 10 s at a 20 kHz sampling frequency at
The velocity spectra measured closest to the trailing edge for the baseline and serrated aerofoils is shown in Figure 13. The leading edge serration can be observed to provide substantial reductions in the mean square velocity by about 10 dB at frequencies fc/U below about 4. Above this frequency, the spectra begin to converge and the reduction falls to about 2 dB. Clearly, therefore, leading edge serrations have greatest influence on the boundary layer at low frequencies, This behaviour is broadly consistent with the difference in noise reduction spectra plotted in Figure 9(a), with the exception being in the frequency range
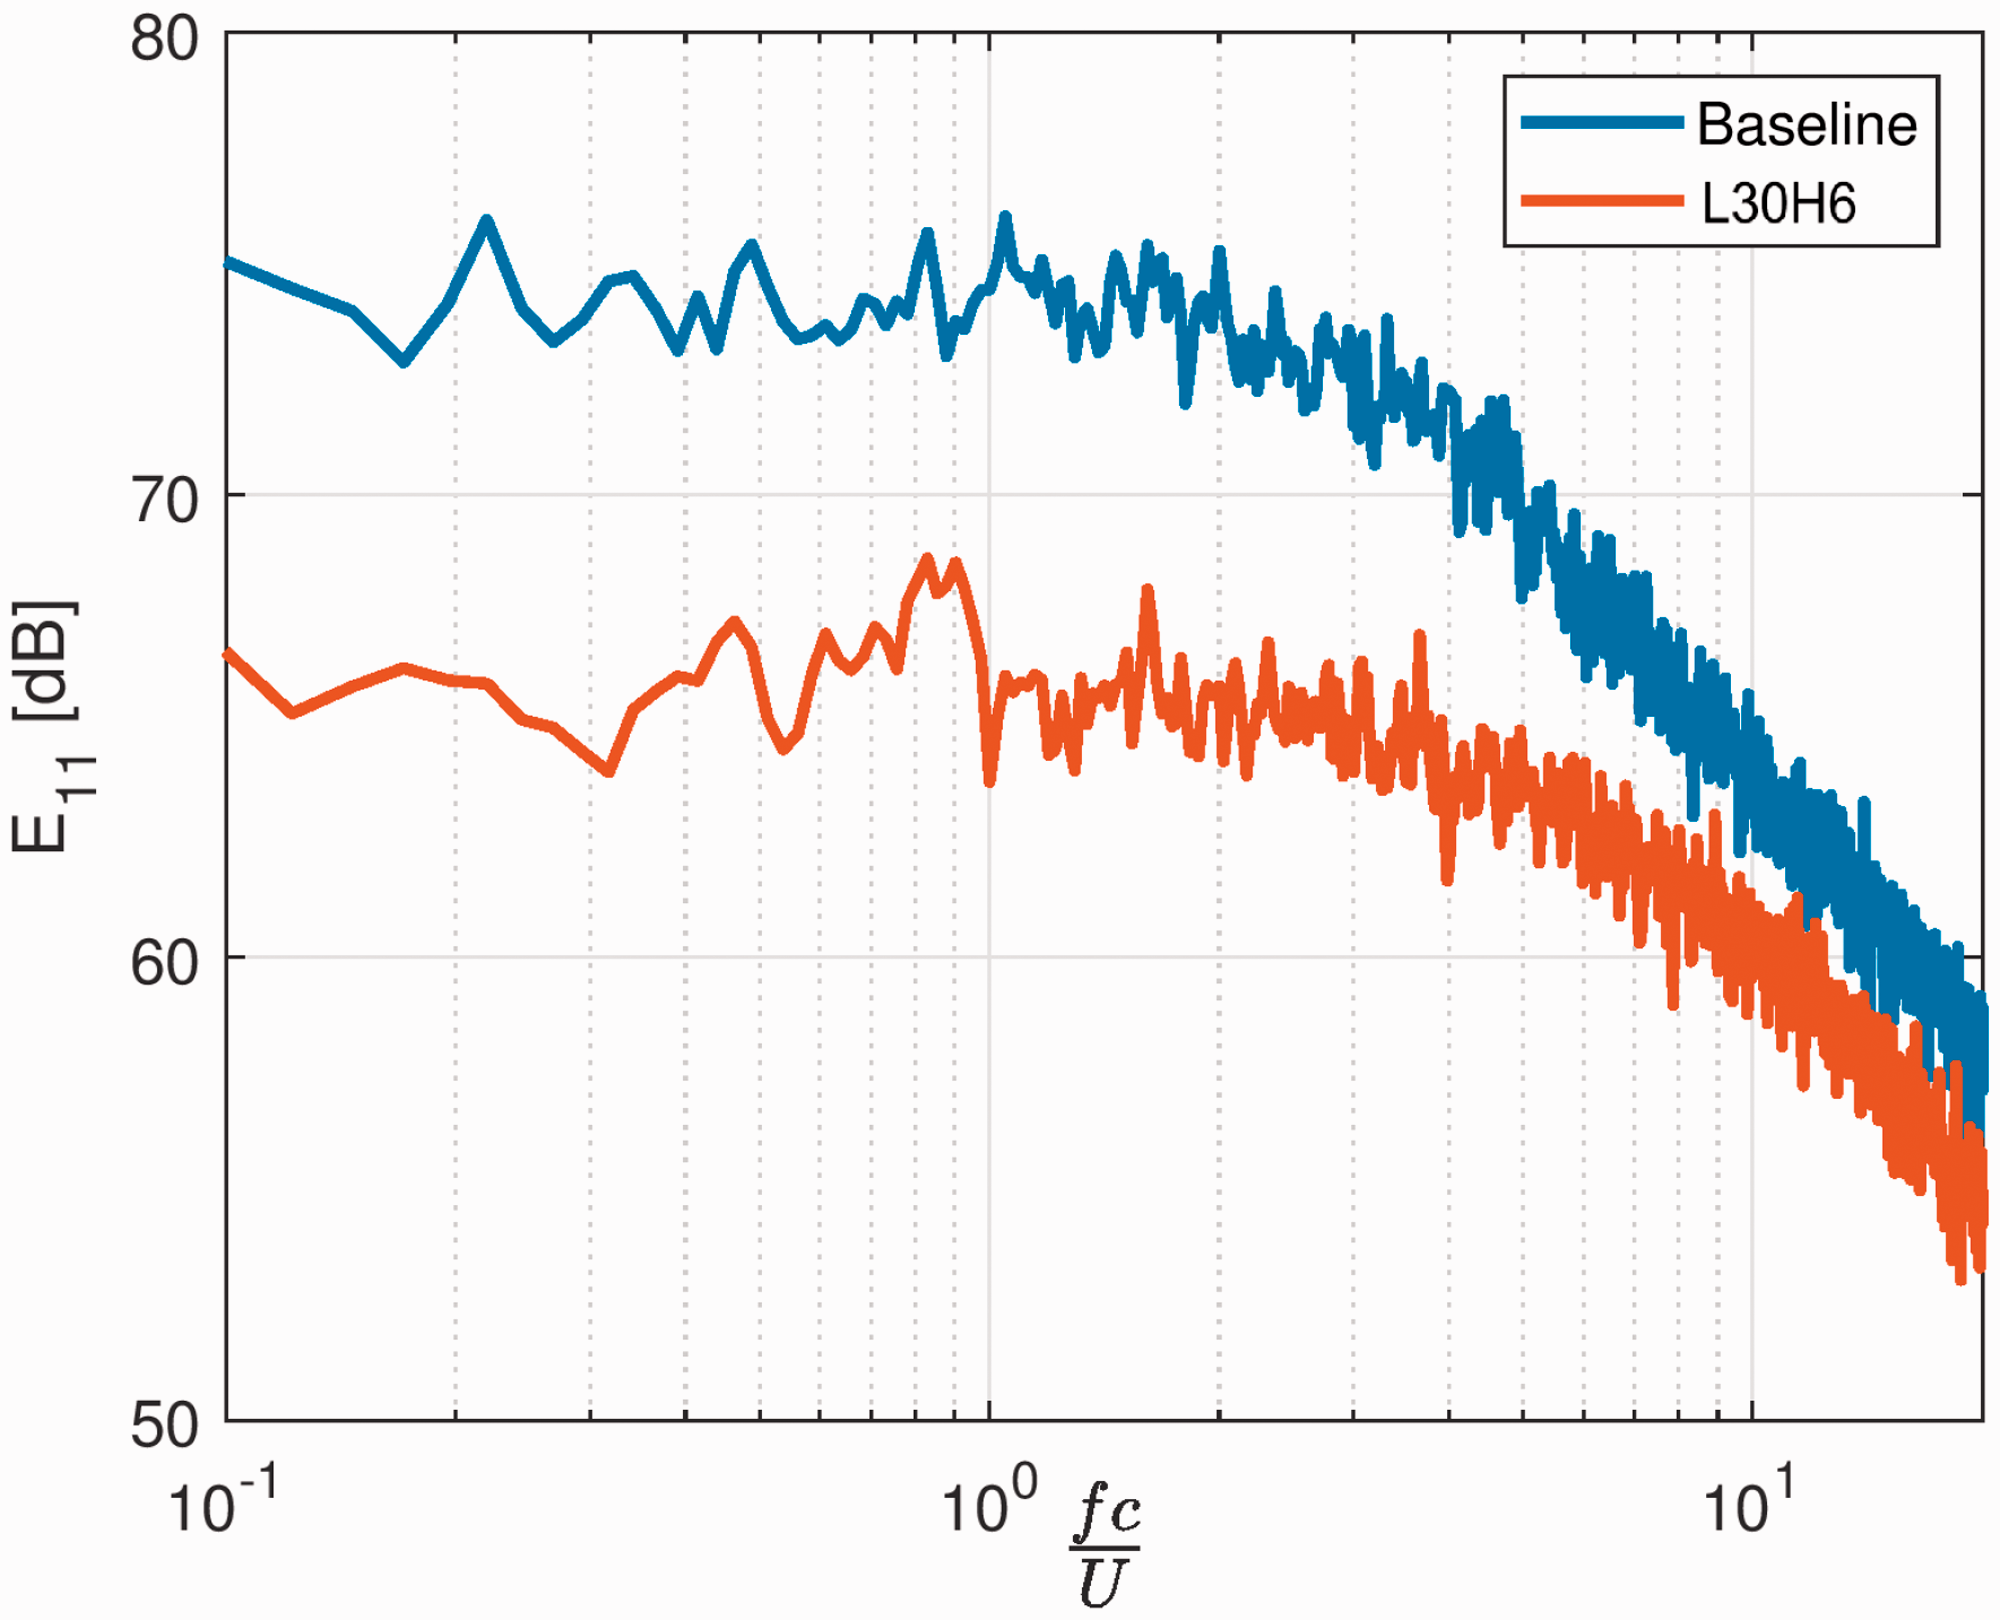
Power spectral densities of the axial velocity component E11 for baseline and serrated aerofoils at
TNO model
PIV velocity data shown in Figure 12 has clearly demonstrated that leading edge serrations can reduce the turbulence in the boundary layer close to the trailing edge at low to moderate AoA. In this section the hot wire velocity data is input into the classical TNO model for predicting the surface pressure spectrum beneath the boundary layer.
50
,
51
The aim of this investigation is to assess whether the modification to the turbulent boundary layer is consistent with the reduction in far field noise. The classical theory due to Amiet
52
has demonstrated a direct relationship between the far-field radiated power spectral density of acoustic pressure
The surface pressure wavenumber - frequency spectrum 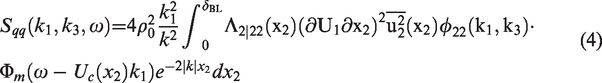
In this expression ρ0 is the fluid density, δBL is the boundary layer thickness and
The Hot Wire velocity data was used to compute the boundary layer thickness δBL, the mean shear rate 
Predictions of the difference in surface pressure spectra
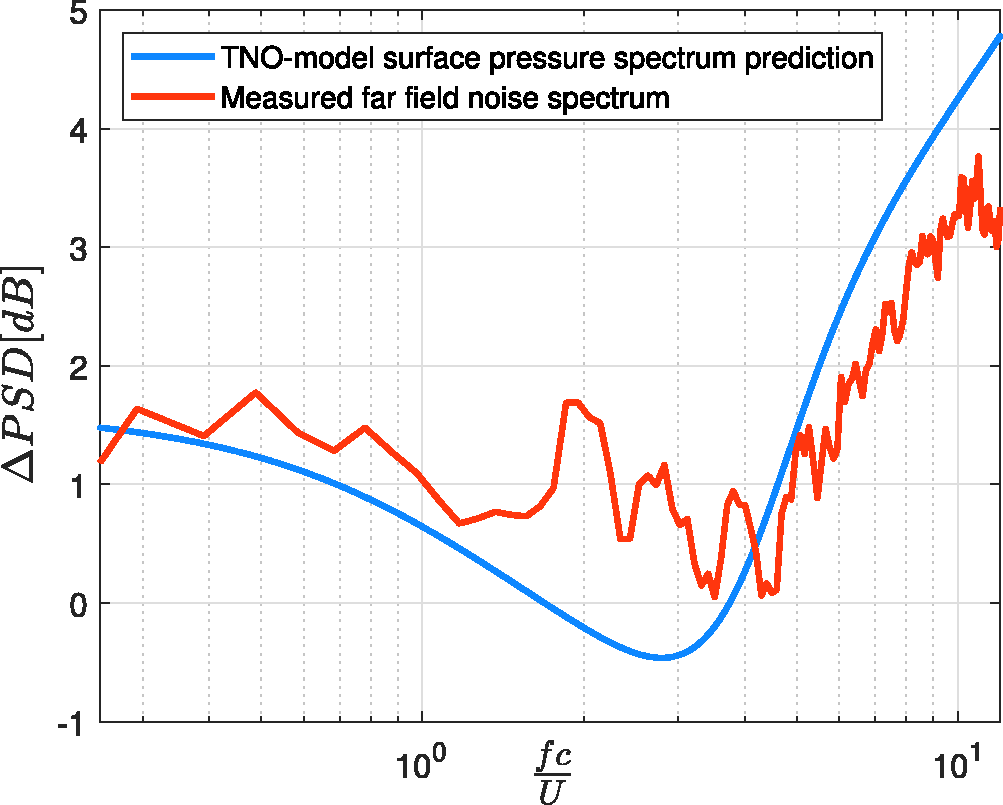
Comparison between the predicted reduction in surface pressure spectrum by TNO model and the measured reduction of far field noise spectrum.
Good qualitative agreement between the difference in predicted and measured spectra can be observed suggesting that the reduction in far field noise resulting from the introductions of leading edge serration is consistent with the modification to the turbulent boundary layer.
Simultaneous surface pressure and far field noise
Finally, to gain further insight into the noise reduction mechanism at this low angle of attack the coherence spectrum was measured between a pressure sensor located 5 mm from the suction side trailing edge and a far field microphone located 1.2 m directly above the trailing at mid-span. In order to locate the pressure probes close to the trailing edge a larger aerofoil was used of 0.15 m chord. Note that in this study we are only concerned with providing a qualitative understanding of the noise reduction mechanism. The coherence spectrum is plotted in Figure 15 against non-dimensional frequency fc/U. High coherence levels are indicative of coherent structures that radiate strongly to the far field and establish a causal relationship between a point in the far field and a single point on the trailing edge.
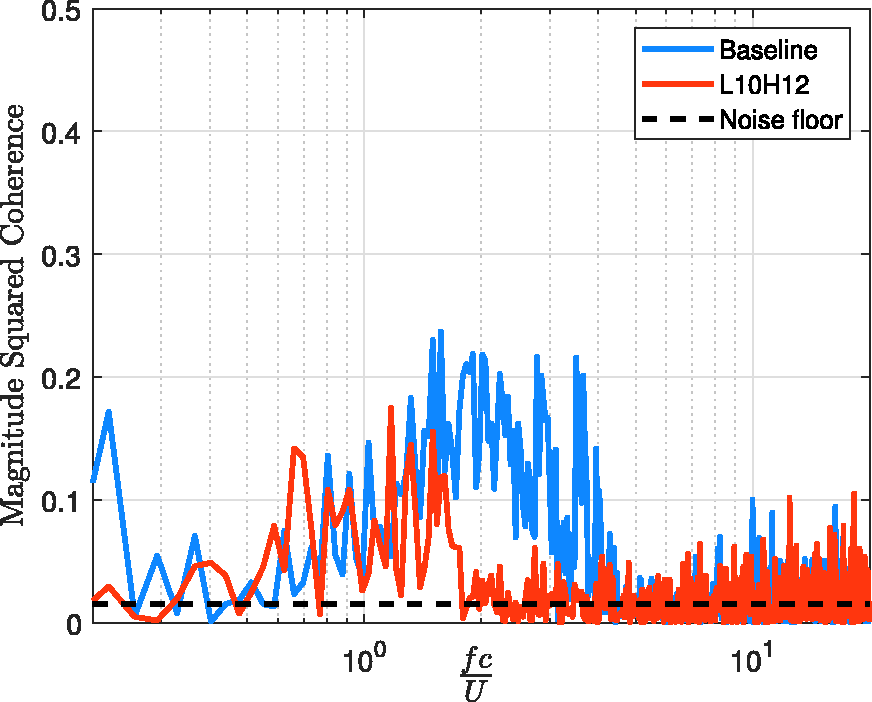
Coherence between noise and surface pressure at TE for baseline and serrated aerofoils at
This figure can be directly compared to Figure 9(a) for the baseline and serrated aerofoil noise spectra. The coherence is negligible for both baseline and serrated aerofoils at low frequencies (
Leading edge serrations are therefore an effective means of reducing boundary layer turbulence at small to moderate AoA, however, the mechanism by which this occurs is currently not well understood.
Angle regime II. Mid angles of attack
, partial to full separation
Figure 8 has indicated a range of moderate angles of attack (
Velocity results
We first provide an overview of the effect of leading edge serrations on the flow behaviour of the L10H12 serration at the angle of attack of
Figure 16 shows the mean of the streamwise and vertical velocity components for the baseline and serrated aerofoils. Introducing leading edge serrations at this mid-AoA can be seen to have the major effect of shifting the separation further upstream, which is consistent with a shifting of the peak in radiated noise to lower non-dimensional frequencies fc/U, as shown in Figure 9(b). Unlike at low AoA, no difference in noise is apparent at frequencies below and above the frequency range where separation noise is dominant.
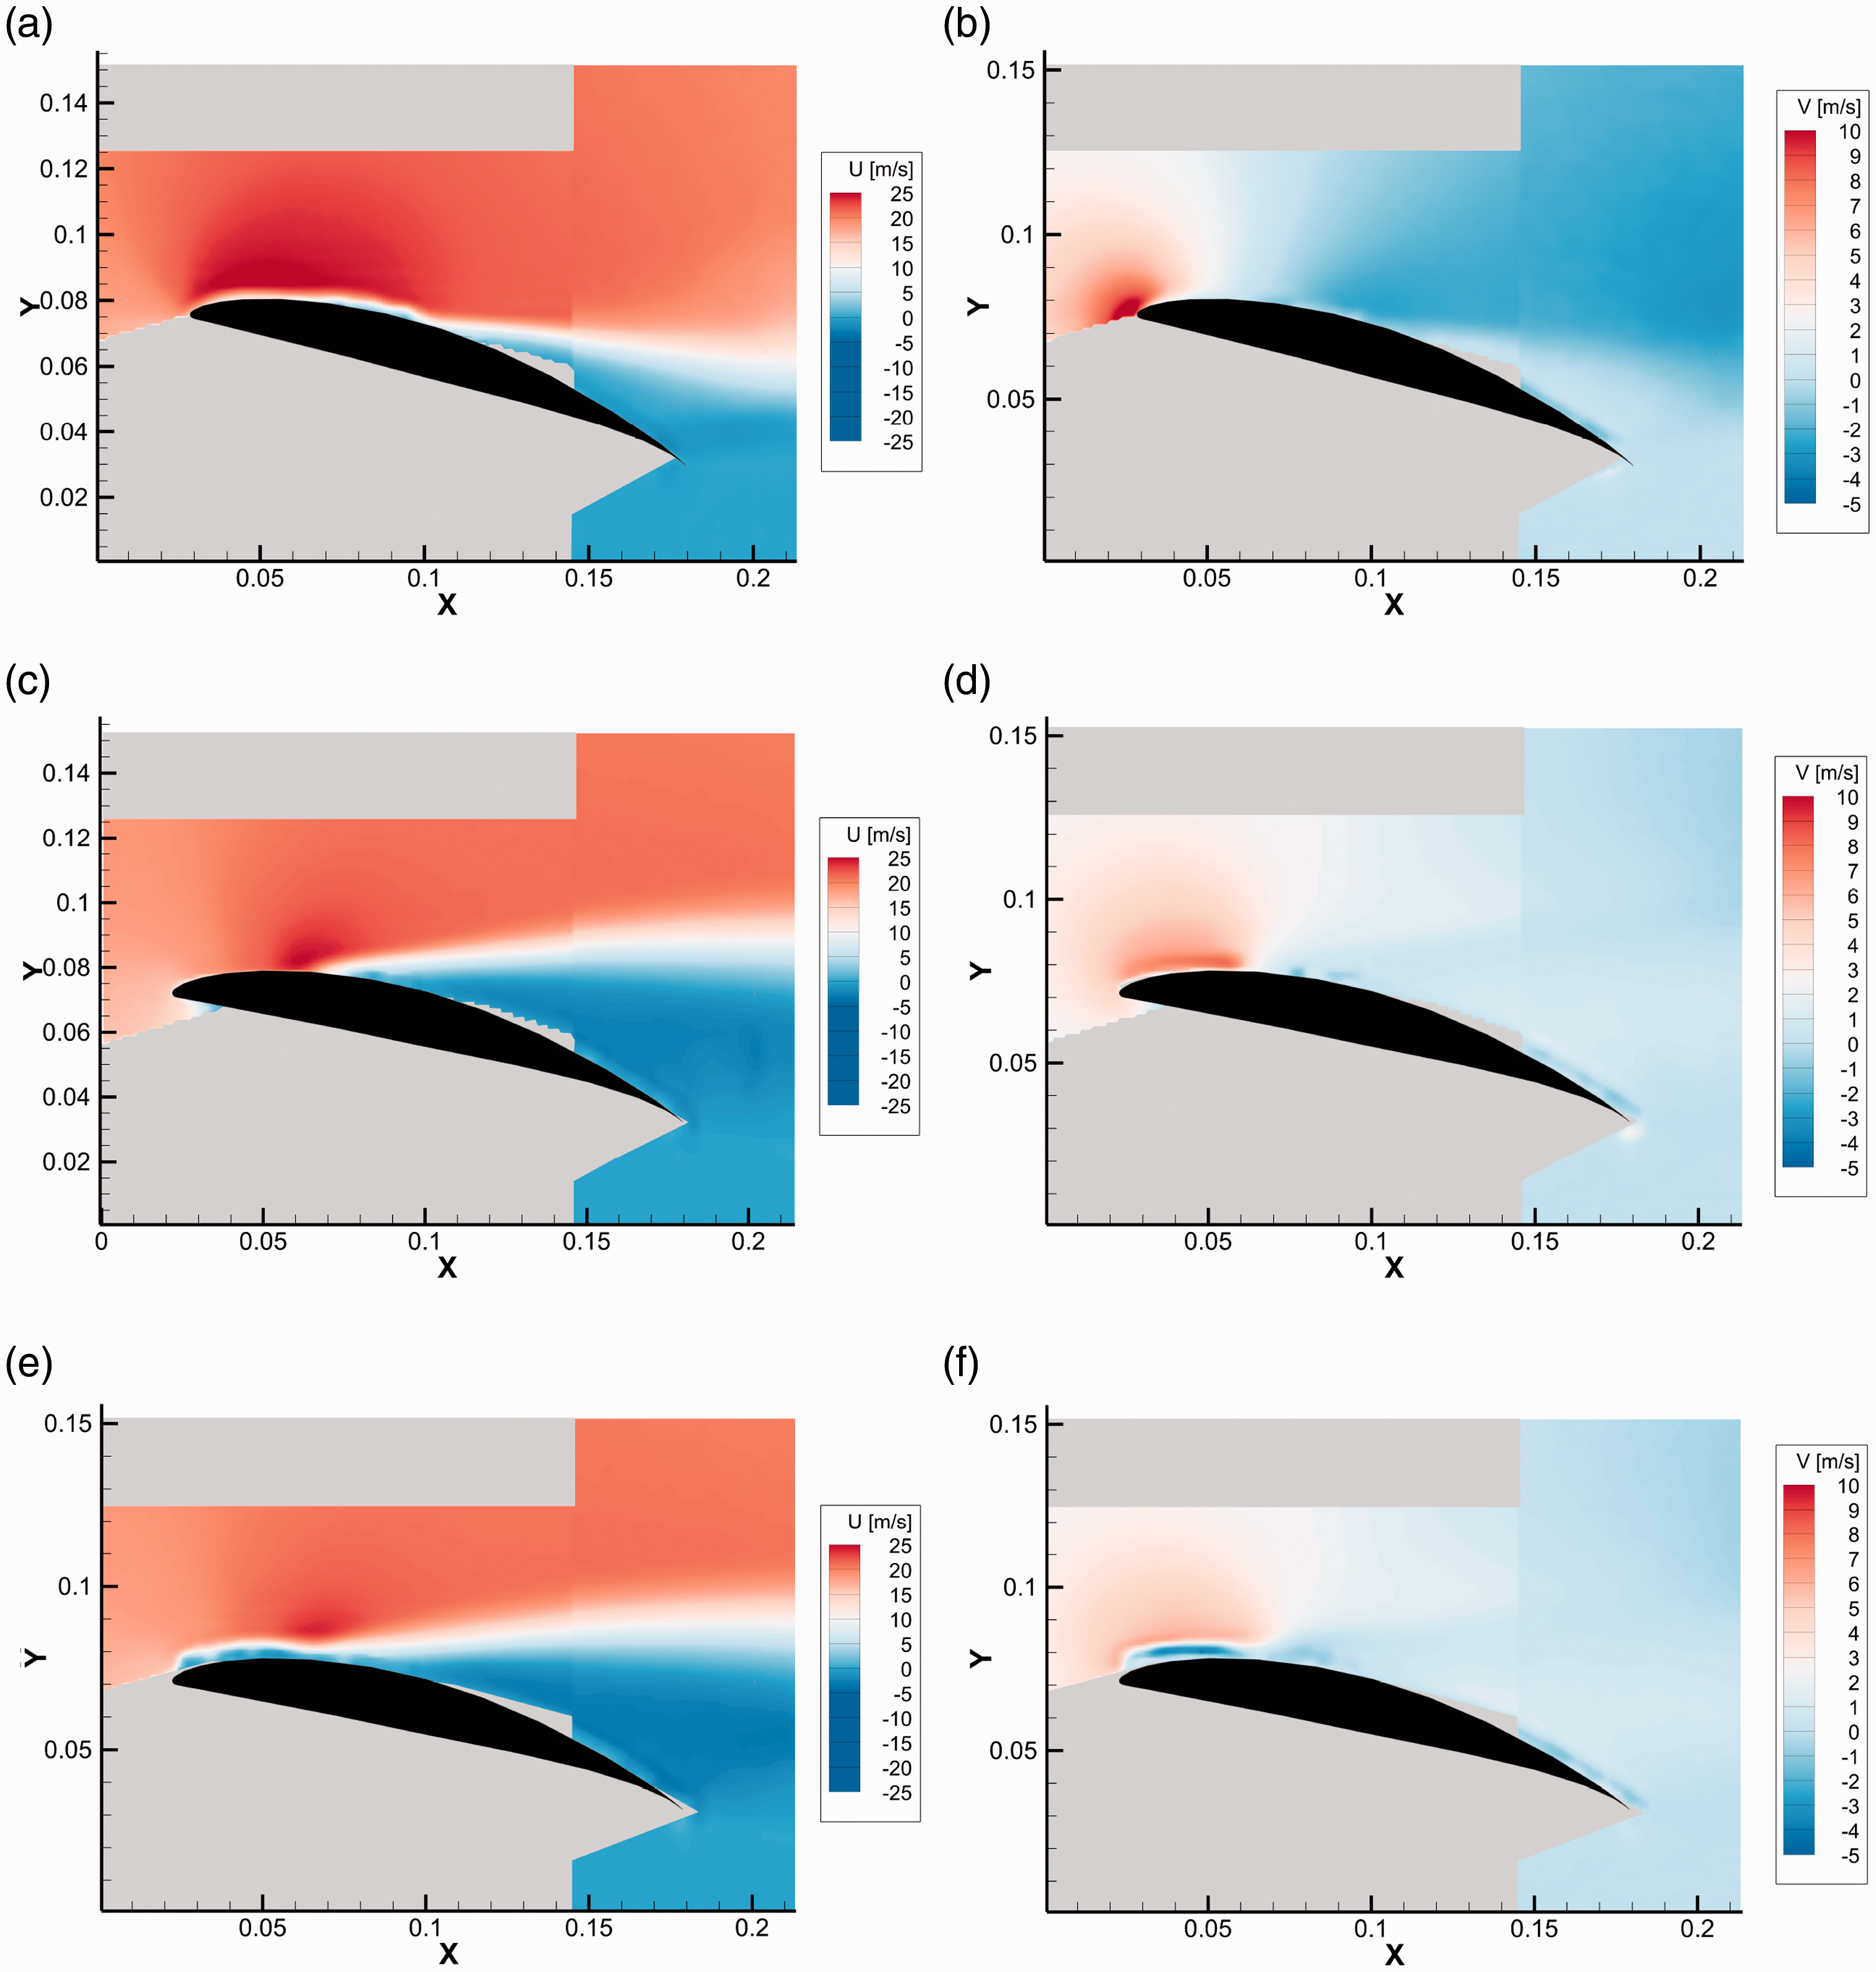
Mean velocity field around the aerofoil for the (a,b) Baseline configuration; (c,d) Plane crossing the root of the LE serrated configuration; (e,f) Plane crossing the tip of the LE serrated configuration. (a) Baseline - Streamwise component. (b) Baseline - Vertical component. (c) Root - Streamwise component. (d) Root - Vertical component. (e) Tip - Streamwise component. (f) Tip - Vertical component.
The RMS values of the fluctuating velocity components are shown in Figure 17. The shear layers in each case are clearly defined corresponding to regions of maximum turbulence. The velocity fluctuations are typically 20% greater for the serrated aerofoil compared to the baseline case but are located further from the aerofoil surface. Clearly, therefore, the higher levels of turbulence located further from the aerofoil surface have no appreciable effect on the noise radiation in the frequency range where separation noise is not dominant.
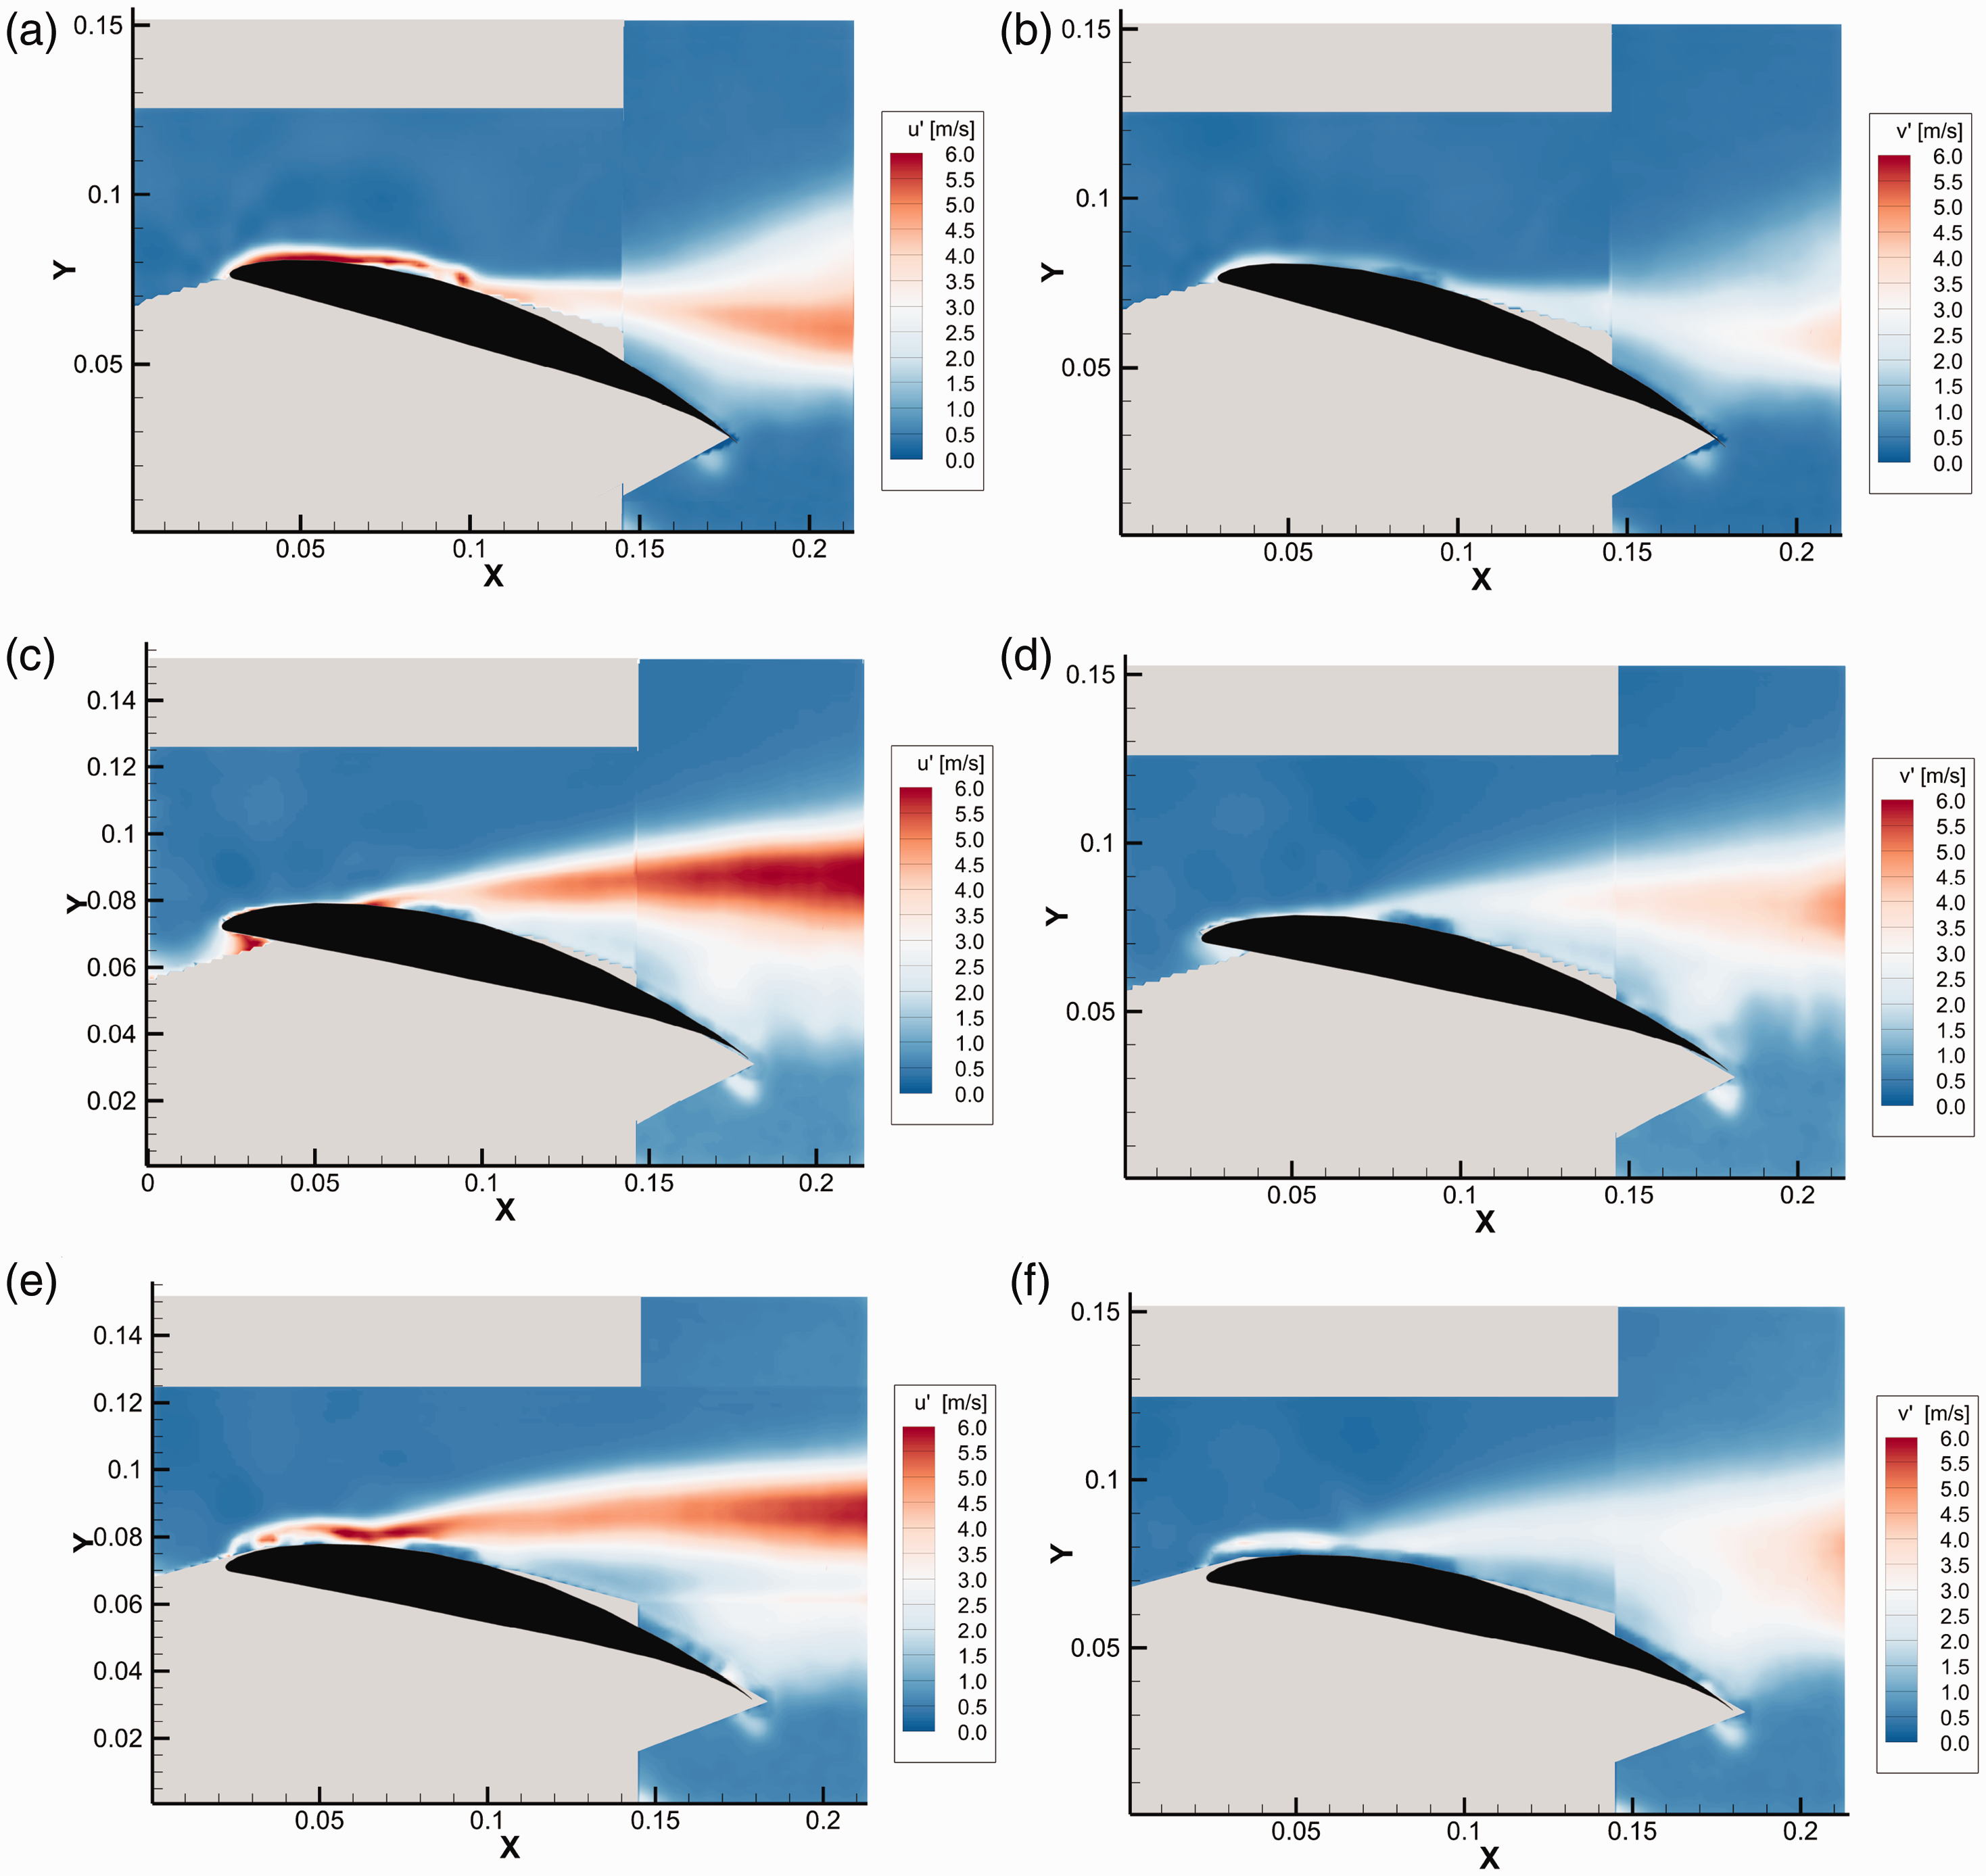
Fluctuating velocity field around the aerofoil for the (a,b) Baseline configuration; (c,d) Plane crossing the root of the LE serrated configuration; (e,f) Plane crossing the tip of the LE serrated configuration. (a) Baseline - Streamwise component. (b) Baseline - Vertical component. (c) Root - Streamwise component. (d) Root - Vertical component. (e) Tip - Streamwise component. (f) Tip - Vertical component.
Simultaneous surface pressure and far field noise
The previous section has shown that separation occurs further upstream when leading edge serrations are introduced, resulting in the peak radiation occurring at lower frequencies. To quantify the effect of serrations on the causal relationship between pressure fluctuations near the trailing edge and the far field noise, coherence spectra were measured between them using the procedure described in Section 6.1 above. The coherence spectra were measured for both the baseline aerofoil and the L10H12 serrated aerofoil.
Figure 18 shows the coherence spectra between the pressure measured on the aerofoil suction side closest to the trailing edge (5 mm upstream) and the noise at 1.2 m immediately above the trailing edge at an AoA
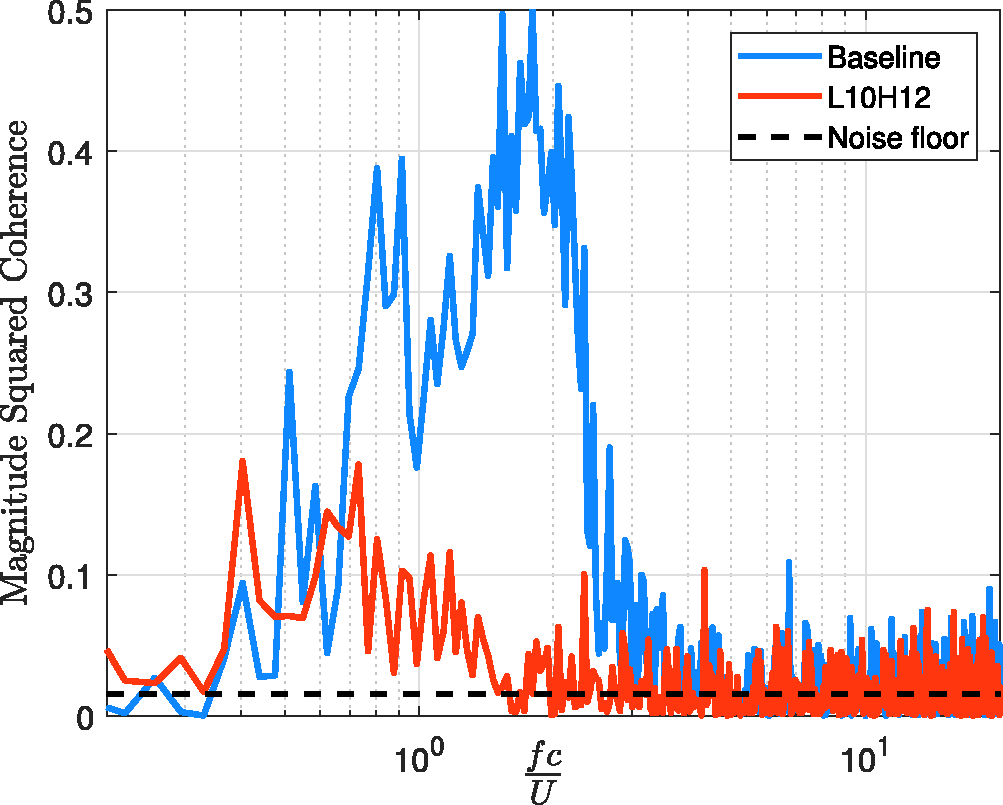
Coherence between noise and surface pressure at TE for baseline and serrated aerofoils at
Simultaneous velocity and unsteady surface pressure measurements
We now investigate the coherence between the streamwise velocity fluctuations measured by a single hot wire at various heights above the trailing edge and the surface pressure fluctuations near the trailing edge. The objective of this measurement is to identify the regions in the flow responsible for the surface pressure fluctuations, which in turn radiate to the far field as quantified in the coherence measurements of Figure 18. The measurement was repeated for the baseline and L10H12 serrated aerofoil at the AoA of
Figure 19 shows colour contours images of the coherence between the measured fluctuating velocity and the surface pressure close to the trailing edge versus non-dimensional frequency Stc and height above the trailing edge. Results are shown for the baseline (left side) and serrated (right side) aerofoils.
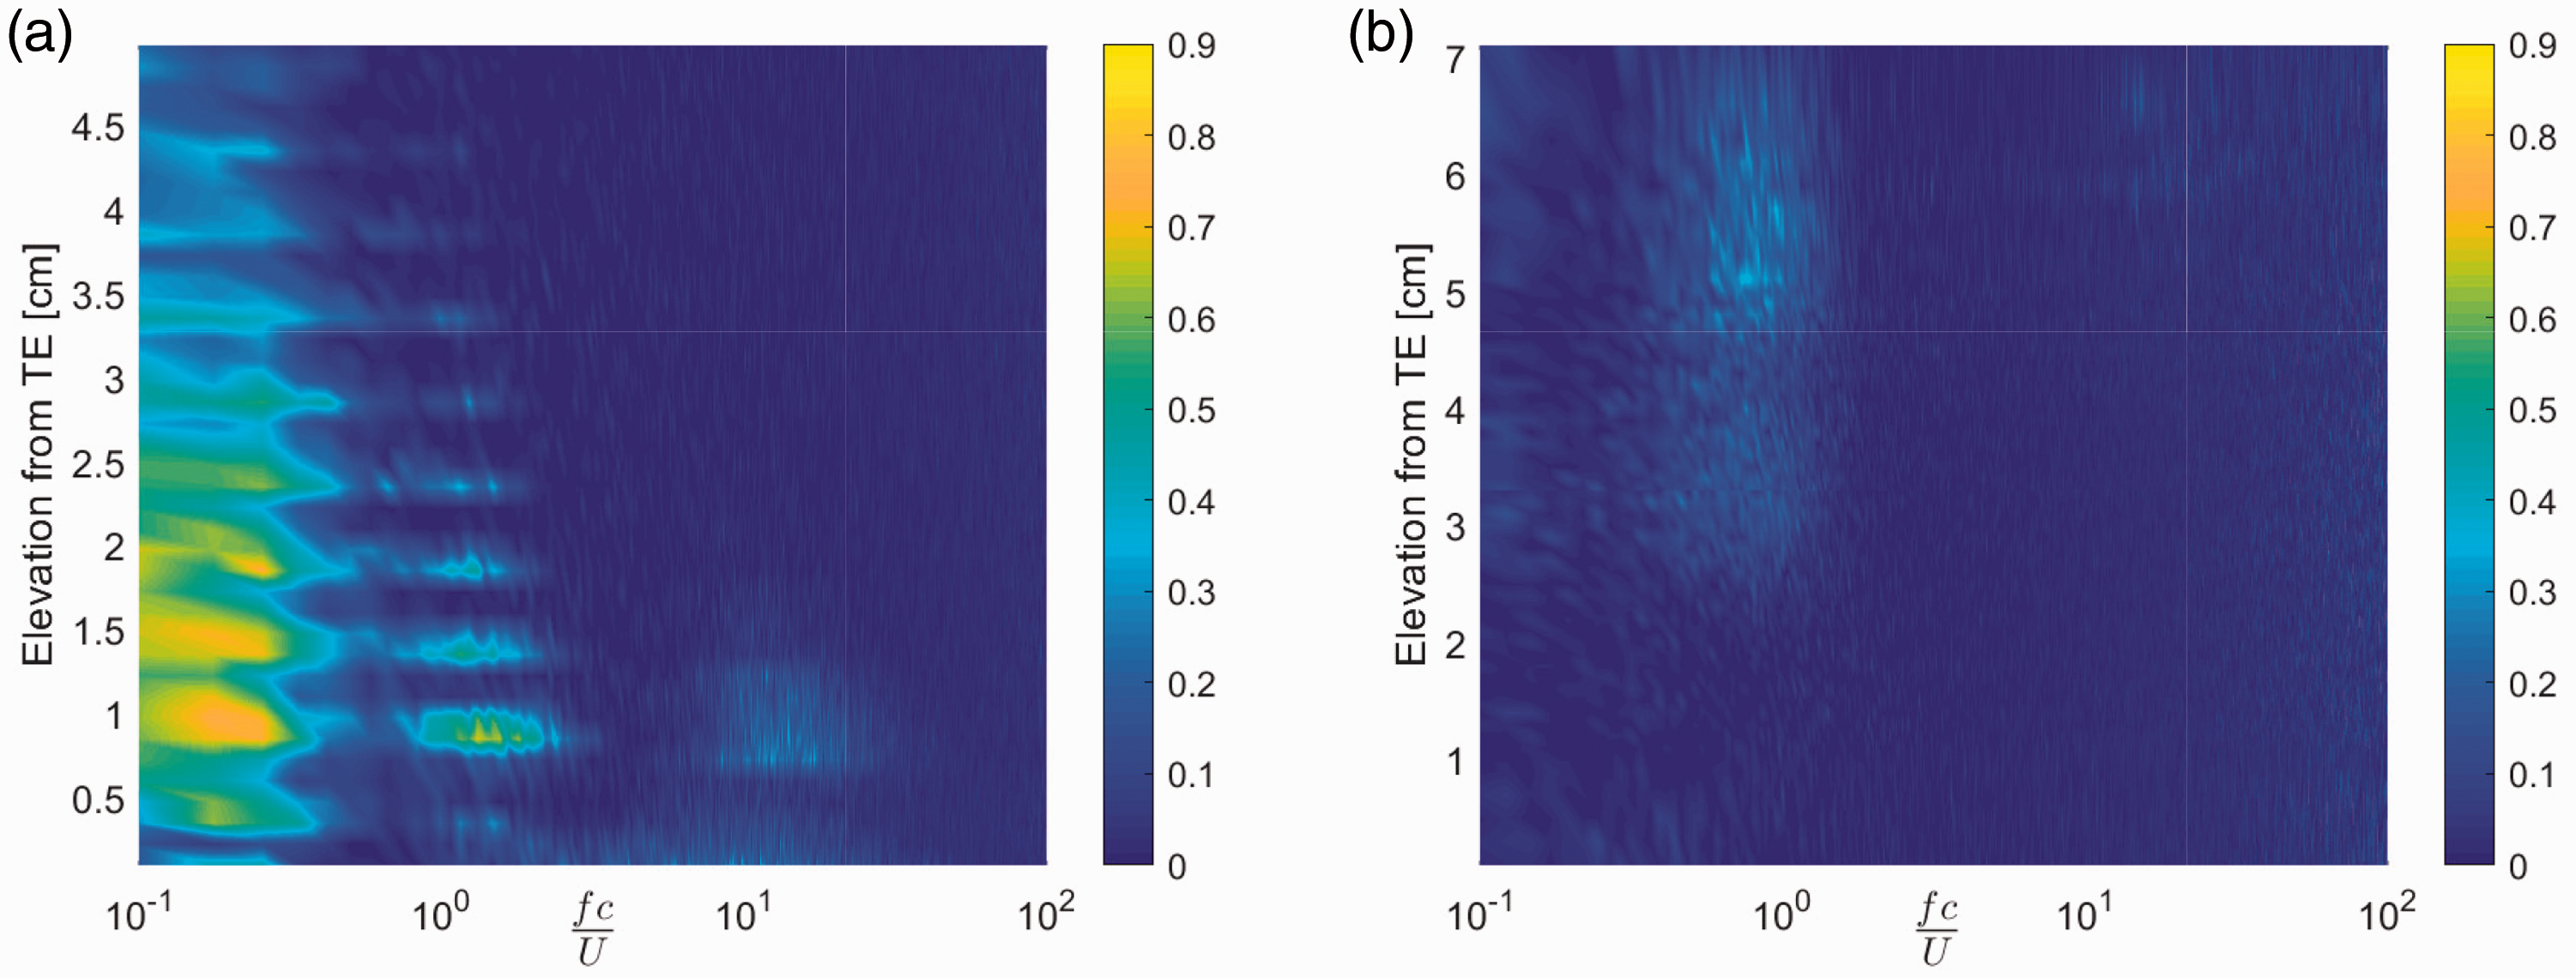
Magnitude squared coherence between velocity and surface pressure at the trailing edge as a function of frequency and spatial location at
The coherence contour for the baseline aerofoil can be seen to reveal at least three frequency regions of relatively high coherence (>0.2). The lowest frequency occurs at
In summary, therefore, the introduction of leading edge serrations at mid AoA for which the flow is partially to fully separated, has been shown to have a significant effect on the steady and unsteady flow behaviour. The principal effect of the serration is to cause the flow to separate further upstream thereby shifting the peak frequency associated with separation noise to lower frequencies. In the low and high frequency range, for which separation noise is negligible for both the baseline and serrated aerofoils (
However, the noise radiation from the baseline aerofoil when the AoA is increased further until the flow has fully separated has been shown in Figure 9(c) to be significantly reduced by the introduction of leading serration. The reduction mechanism associated with this high AoA regime (regime III) is explored in the next section.
High angles of attack
Figure 8(a) and (b) indicate that leading edge serrations on an aerofoil at high angles of attack, for which the flow has fully separated, are capable of producing overall noise reductions of up to 3 dB. The noise reduction spectra plotted in Figure 9(c) shows noise reductions over most of the frequency range unlike at low and moderate AoA for which the flow is partially attached.
For completeness the coherence spectrum between the surface pressure close to the trailing edge and the far field microphone for the baseline and L10H12 serrated aerofoil is shown in Figure 20 at
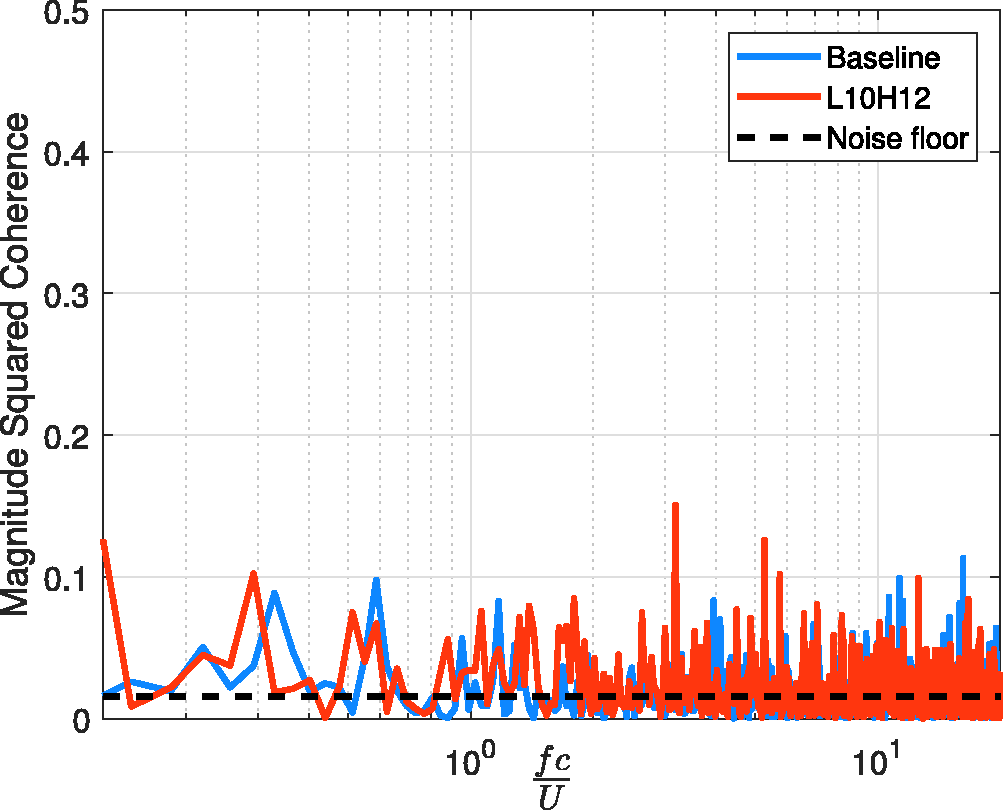
Coherence between noise and surface pressure at the TE for baseline and serrated aerofoils at
The absence of any peak in the far field noise spectra plotted in Figure 9(c) and of any peaks in the coherence suggests that noise radiation occurs through the interaction of small-scale turbulence in the shear layer with the aerofoil. This contrasts the radiation mechanism at lower AoA where there is evidence of coherence structures resulting from flow separation.
Two possible mechanisms exist to explain the noise reductions observed at these high AoA. Either the velocity fluctuations in the shear layer have been diminished by the leading edge serrations or the shear layer has been moved further from the aerofoil surface. In the latter case, surface pressure fluctuations will be weaker owing to a larger decay of hydrodynamic pressure from the shear layer to the surface. Unfortunately no velocity data was collected for this high AoA case but it is highly likely that shifting of the shear layer is the dominant noise reduction mechanism, as can be seen in the PIV velocity data at the lower AoA of
Conclusions
This paper has investigated the performance of leading edge serrations for reducing aerofoil self- noise over a wide range of angles of attack, including pre-stall (flow separated) and post-stall conditions. A comprehensive range of measurements have been realised to quantify the noise reductions for various serration parameters and angles of attack, and also to attempt to understanding the noise reduction mechanism. The study has focused on the NACA65-(12)10 aerofoil, which is amongst a class of high performance aerofoils designed to maximize the region of laminar flow over the surface. While details in the performance may differ for different aerofoils we expect the general behaviour reported here to be broadly valid for a range of different aerofoils.
The main conclusions from this work can be summarized as follows:
The performance of leading edge serration in reducing aerofoil self noise has been shown to fall into three distinct angle of attack regimes, I, II and III. Leading edge serrations are able to reduce by up to 3 dB aerofoil self-noise noise at relatively low AoA For the range of relatively low angles of attack under consideration The self-noise reduction at relatively low angles of attack can be attributed to a reduction in the boundary layer velocity fluctuations. The modification to the turbulent boundary layer caused by the leading edge serration has been shown to be consistent with the corresponding reduction in far field noise. The poor acoustic performance of leading edge serrations at intermediate angles of attack At high angles of attack
Footnotes
Declaration of conflicting interests
The author(s) declared no potential conflicts of interest with respect to the research, authorship, and/or publication of this article.
Funding
The author(s) disclosed receipt of the following financial support for the research, authorship, and/or publication of this article: The authors recognize the financial support from the EPSRC Research Grant No: EP/N020413/1 on the “Quiet Aerofoils of the Next Generation” at the University of Southampton.