
Abstract
The aim of this study is to investigate the effectiveness and mechanism of wind buffeting noise suppression using a new bionic structure inspired by the quiet flight of owls. Firstly, the new bionic schemes based on NACA0012 wing with two sinusoidal leading-edge serrations and one straight leading-edge curve are used in a cavity after verifying the simulation. Then, the results of the three bionic schemes are compared and analyzed. It is found that the schemes with leading-edge serrations and surface ridges can suppress wind buffeting noise effectively. In particular, the sinusoidal scheme with a wavelength λ = 0.24c (chord length c) can significantly reduce resonance energies above 21 dB over a wide range of speeds. Furthermore, the study reveals that in the bionic scheme, only the negative pressure core moves in the opening and hits the trailing edge, which reduces the pressure fluctuation in the cavity. The boundary layer thickness (BLT) also fluctuates in span under the influence of the leading-edge serration and the surface ridge, which is favorable for suppressing wind buffeting noise. However, the suppression effect is not solely related to the fluctuation of BLT in the span at the trailing edge but is also influenced by the minimum BLT at this point. Therefore, if the BLT has a certain intensity fluctuation in the span, and the minimum BLT at the trailing edge is close to that of the smooth airfoil scheme, the noise suppression effect is significant.
Keywords
Introduction
In various fields such as aviation, high-speed trains, and automobiles, the issue of controlling wind buffeting noise has become a fundamental problem. This type of noise, which can reach levels exceeding 120 dB, is caused by high-intensity airflow over a cavity. Not only can it lead to fatigue damage in mechanical structures, 1 but it can also cause significant discomfort for drivers and passengers in the passenger compartment. 2 As a result, there is a need for effective solutions to mitigate this issue.
Generally, control methods for wind buffeting noise suppression can be divided into two categories, active control and passive control. Active control methods, such as active jet 3 and active deflector, 4 can effectively suppress wind buffeting noise. However, due to limitations in the actuator’s bandwidth and the energy required, the practical application of these methods is currently rare or uncommon. 5 Therefore, passive control methods such as deflectors, 6 sub-cavities, 7 leading-edge shapes, 8 etc., are still widely used. For example, Wang et al. 9 and Zhang et al. 10 improved the leading-edge shapes to increase the thickness of the boundary layer at the leading edge, resulting in a reduction of cavity noise by more than 10 dB. Li et al. 11 achieved a reduction of wind buffeting noise by more than 10 dB by minimizing the interference between the shear layer and the recirculation in the cavity using a porous floor. Despite various attempts to disrupt the feedback mechanism and effectively suppress wind buffeting noise, 12 finding an efficient and practical method remains challenging.
Inspired by the silent flight of owls, researchers have explored passive control schemes on wings as a promising approach to reduce aerodynamic noise (typically with a Mach number of less than 0.2).13–15 These schemes not only comb the vortices in the flow field, 16 but also effectively reduce aerodynamic noise.15,17 Long-term studies of silent flight in birds have shown that barn owls have the most outstanding ability to fly silently, 18 which is mainly due to the three distinct characteristics of their wings: 19 (1) the serrated leading edge with comb-like feathers, (2) the downy wing surface with the elongated pennula, and (3) the trailing edge with fringe-like feathers. Recently, Wagner et al. 16 summarized the flow field characteristics of these features, the results demonstrated that the leading-edge serrations can effectively reduce the maximum Reynolds stress on the wing and maintain laminar flow in the boundary layer for extended periods, resulting in reduced noise levels. In addition, Kim et al. 20 conducted a study and found that the wavy leading-edge airfoil had minimal impact on the aerodynamic performance, and reducing the spanwise pressure correlation could effectively suppress noise. Tong et al. 21 also reported that wavy leading-edge blades are capable of reducing aerodynamic noise levels by decreasing the correlation of wall pressure fluctuations. In addition, among the various types of leading-edge modifications investigated, the sinusoidal serrated leading edge has garnered the most attention as it has been shown to reduce noise levels by approximately 7 dB. 22 However, Wang et al. 23 demonstrated that the iron-shaped leading-edge airfoil, which is based on the NACA0012 airfoil, can achieve noise suppression of approximately 14.3 dB, which is superior to both sinusoidal and serrated airfoils. The iron-shaped leading-edge airfoil structure can effectively reduce the spanwise correlation coefficient by breaking down the large tubular vortices into smaller horseshoe vortices, which helps to attenuate sound energy and achieve significant noise reduction.23,24 However, to the best of our knowledge, the owl wing inspired coupling structure has not yet been utilized for wind buffeting noise suppression.
The typical speed of a car is around 0.1 Mach, which falls within the range of research conditions for wing noise reduction, <0.2 Mach. 20 Meanwhile, wind buffeting noise in a cavity is directly related to vortex shedding from the leading edge of the object, 25 which is similar to the sound source generated by vortex shedding in a wing. 23 In addition, during wind buffeting, the vortex structures in the upstream thin boundary layer exhibit similarities and display complete coherence between dynamic modes.26,27 At present, it is still uncertain whether breaking the spanwise pressure correlation in the upstream boundary layer can effectively suppress wind buffeting noise. It is also unclear whether the passive control scheme inspired by owl wings is capable of suppressing wind buffeting noise. Further research is needed to investigate these questions.
In order to explore the potential of wing structures with leading-edge serrations and surface ridges in wind buffeting noise suppression in a cavity with a speed of less than 0.1 Mach, further research is needed. This will involve validating the grid and numerical method followed by investigating the suppression capability of two sinusoidal serrated leading-edge structures with surface ridges and one smooth leading-edge structure without surface ridges placed upstream of the cavity opening, based on the NACA0012 airfoil. Finally, the noise reduction mechanism will be studied using various parameters such as spanwise pressure correlation, shear layer, boundary layer thickness (BLT), and Q criterion.
Numerical method
WALE model
As we all know, the LES method
28
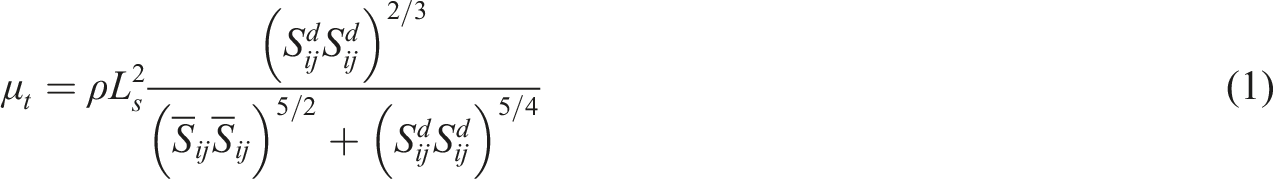
filters vortices of different scales on the Navier–Stokes (N–S) equation. Then, the large-scale vortices can be calculated by the N–S equations, the small-scale vortices are calculated by the wale adapting local eddy viscosity (WALE) model, which can well capture the flows caused by complex geometric shapes. WALE is defined as


Geometry model and boundary conditions
The experimental model of Wang et al.8,9,29 was adopted in this work, as shown in Figure 1. This model is a deep cavity model which is commonly used to investigate the feedback mechanism and control schemes for wind buffeting noise reduction.8,30 Computational domain.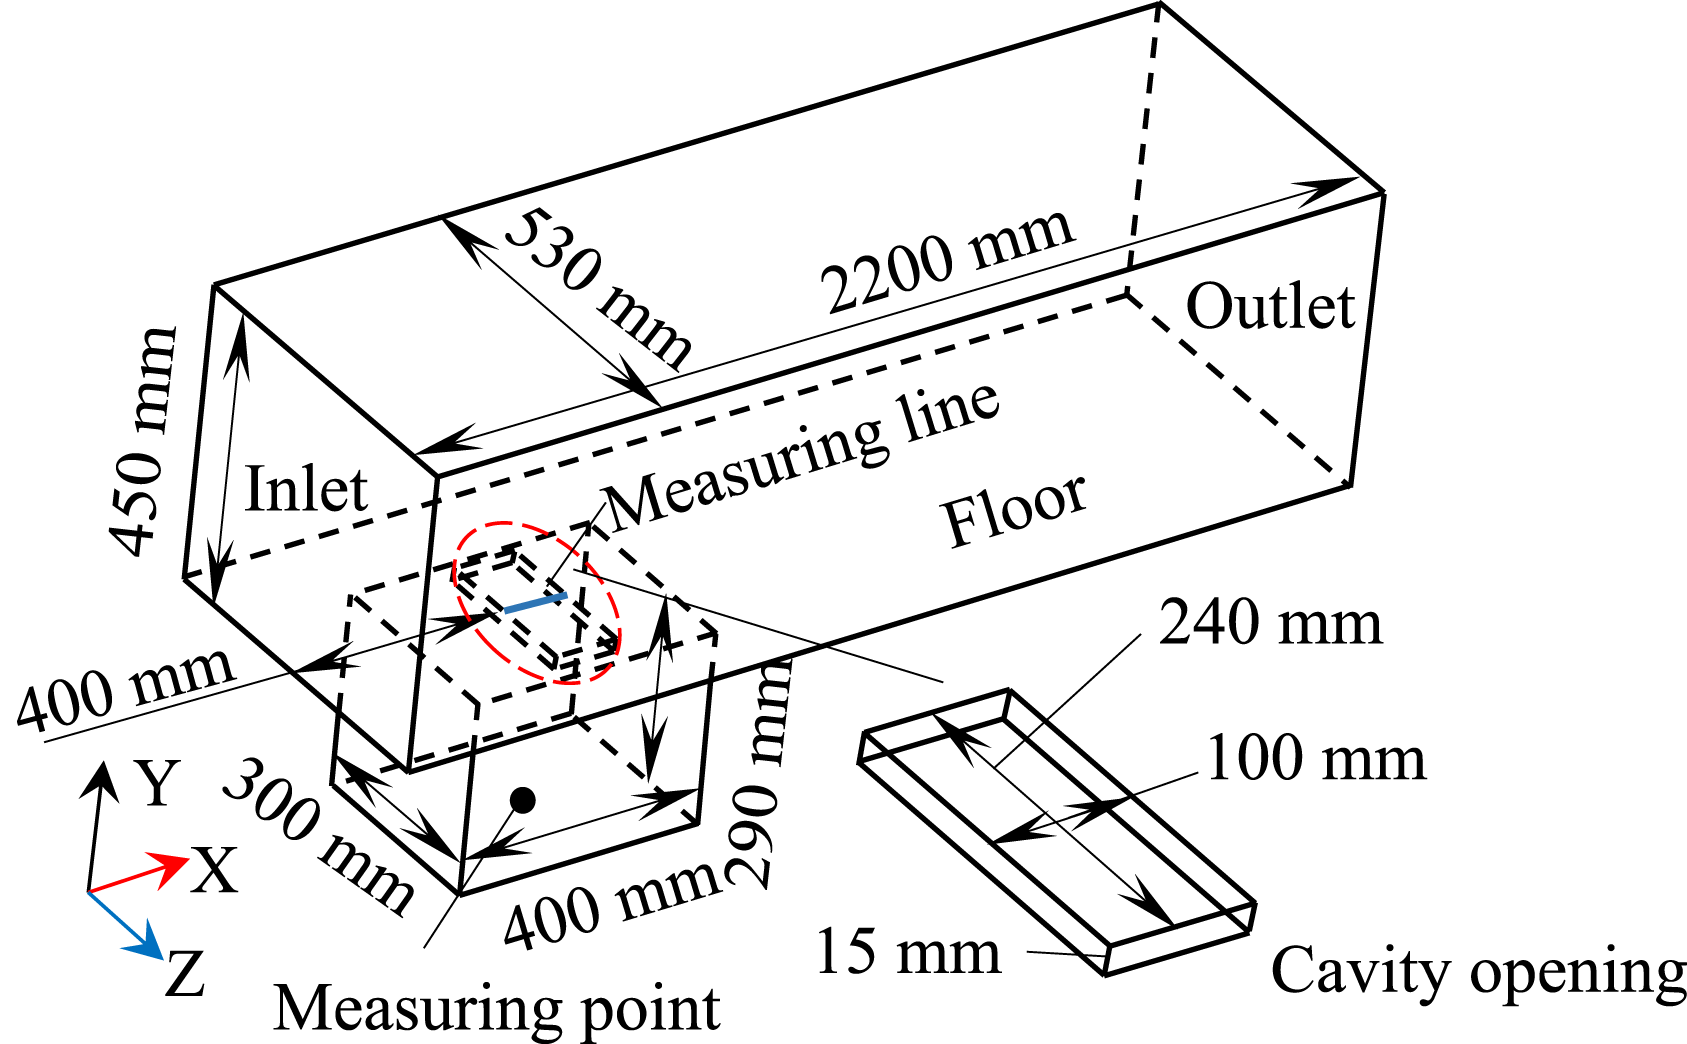
The wind tunnel inlet was set as a speed inlet of 25 m/s, the outlet was a pressure outlet of 0 Pa. The top, left, and right sides of the wind tunnel were set as symmetrical boundary conditions. In the commercial software Star CCM+, the Semi-Implicit Method for Pressure-Linked Equations (SIMPLE) was used. The shear stress transport model SST k-ω with two equations was used in the steady-state simulation. With the exception of the central differencing scheme for the continuity equation, the second-order upwind scheme was used for the discretization of the other equations. During the transient simulation, LES was activated with the Wale Adapting Local Eddy Viscosity (WALE) model, the second-order implicit scheme was used for the time difference equation discretization, and the bounded central differencing scheme was used for the momentum equation discretization. The second-order convection scheme was used to discretize the energy equation. The hybrid Gauss-LSQ method was used to calculate the gradient of the variables. Since the buffeting energy of the cavity is mainly concentrated at about 100 Hz, the simulation time step was set to 5 × 10⁻⁴ s with a simulation duration of 2.5 s. The internal iteration steps were set to 15, the residual is <1 × 10⁻⁴.
To balance computational efficiency,
31
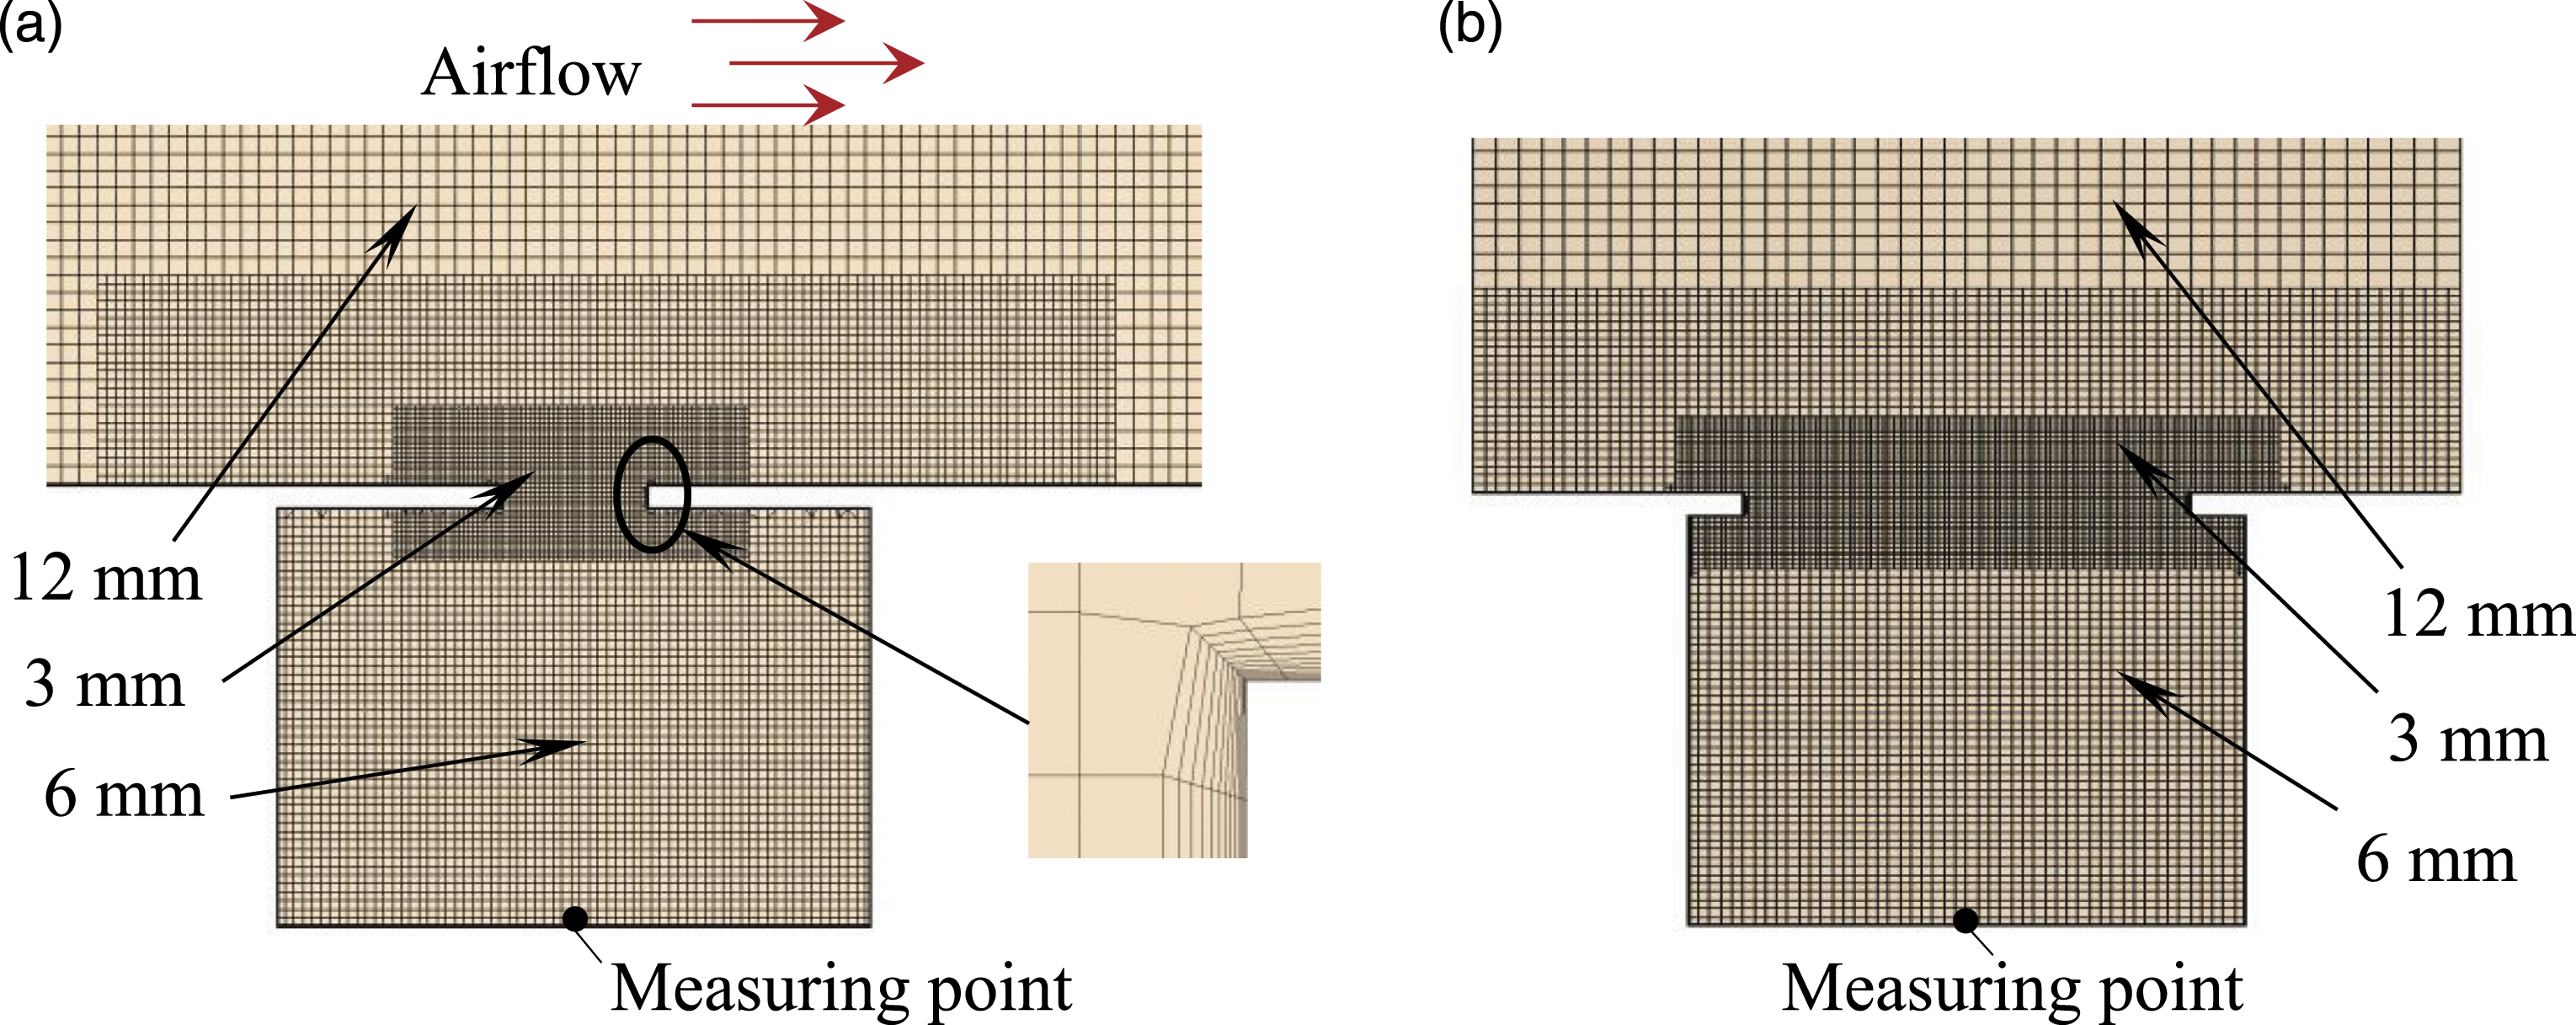
several sets of grid independence tests were performed. For convenience, the flow velocity was measured by using the blue measurement line shown in Figure 1, the results of which are shown in Figure 2. The results show that the 1.5 million grid is in good agreement with the 5 million and 9 million grids. Therefore, a grid of 1.5 million was chosen for this work and the grid method is given in Figure 3. Hexahedral mesh was selected and refined according to the criteria in Figure 3. The boundary layer has 12 layers with a thickness growth rate of 1.15, its total thickness is 1.5 mm, and the mesh type is a quadratic grid. The wall-normal resolution is guaranteed to be y+ ≤ 1. Mesh resolution. Grid in the cross section which passes through the measuring point: (a) X-Y plane; (b) Y-Z plane.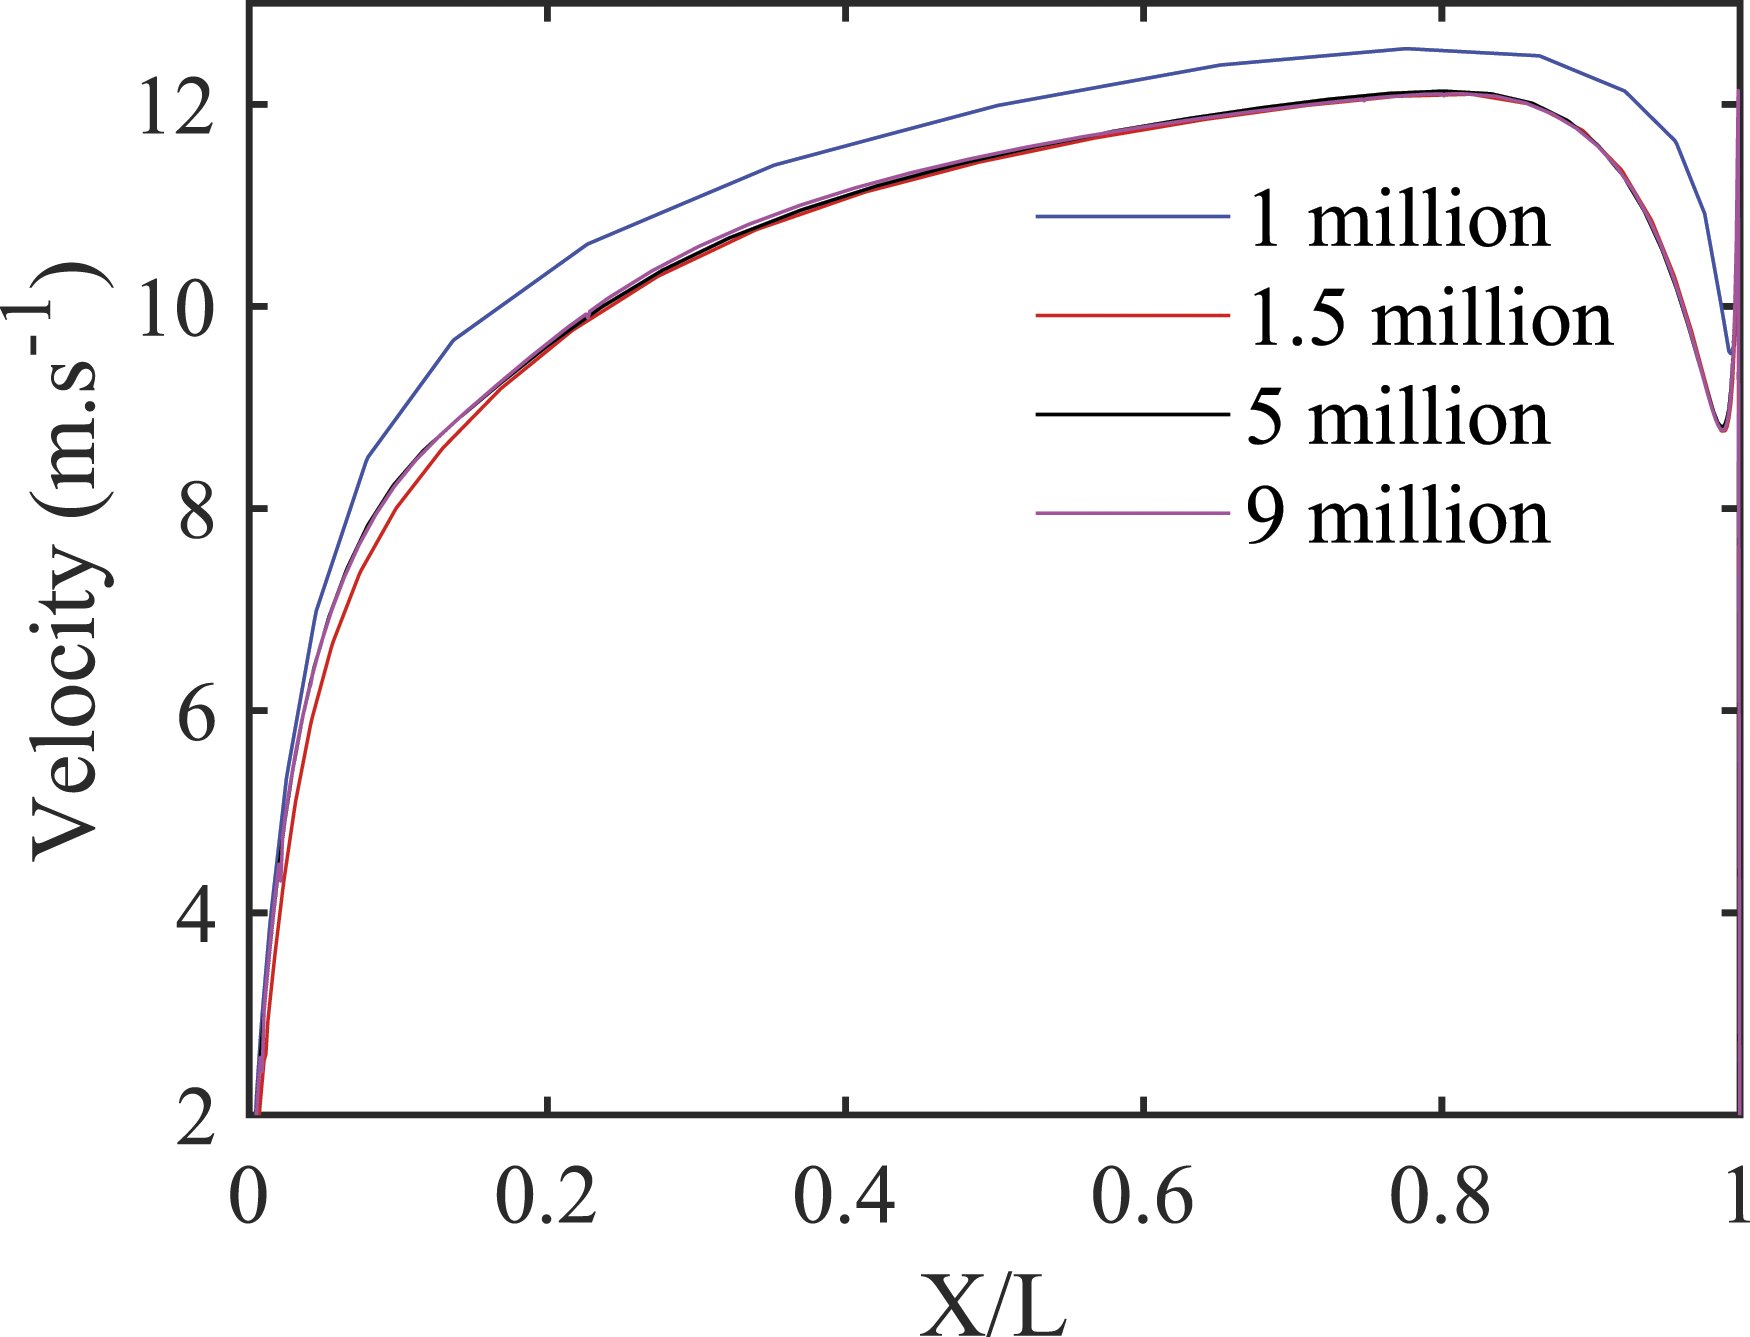
Validation for numerical methods
To verify the reliability of the numerical method, the pressure (P) at the measuring point located at the bottom center of the cavity was compared to experimental data from 0.5 s to 2.5 s. The corresponding spectral plot is given in Figure 4. The experimental and simulation results for the pressure are in good agreement at the first resonance peak. The error is 0.99% at the peak frequency (101 Hz) and 6.51% at the peak value (122.3 dB). Although the peak error is larger than that reported by Yang et al.,
32
the peak frequency is still captured accurately. The spectrum at the measuring point: frequency interval 1 Hz, Hanning window, overlap rate 50%.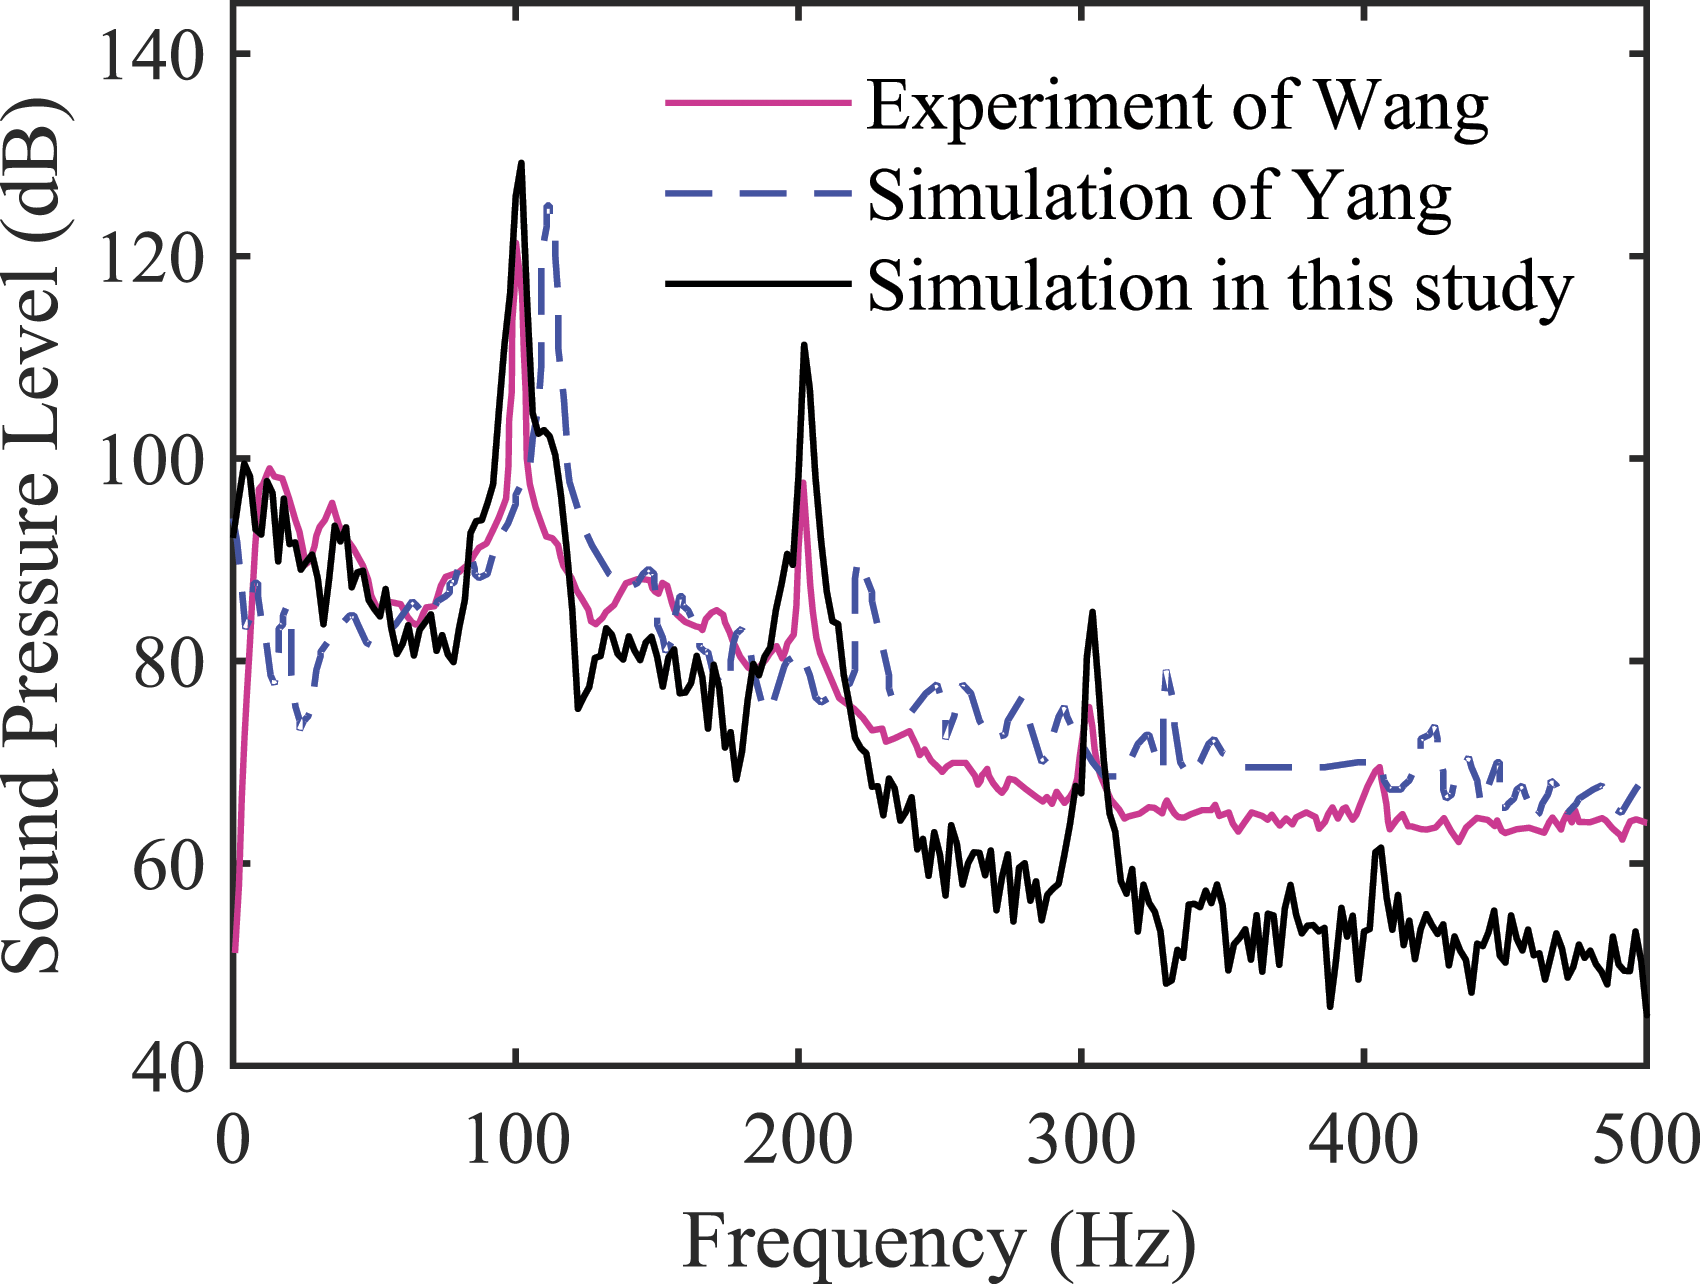
Furthermore, Wang et al. 29 have observed that the Helmholtz resonance frequency of the cavity is around 118.6 Hz, which is quite different from 101 Hz. Therefore, when the airflow velocity is 25 m/s, the sound pressure level peak at 101 Hz is generated by fluid-acoustic interaction mode, which is not a particular cavity mode. In other words, the backflow induced by vortex impingement on the cavity creates acoustic waves, which propagate towards the leading-edge boundary layer. At this point, the leading edge periodically sheds vortices, but the dominant frequency of the vortex shedding is not locked in at the Helmholtz resonance frequency of the cavity. 9
Passive control scheme based on NACA2012 airfoil
Bionic schemes
Three bionic schemes based on the NACA0012 airfoil have been adopted, including two bionic schemes with sine-shaped leading-edge serrations on the surface and one bionic scheme with a smooth leading edge without surface serrations, as illustrated in Figure 5. These three bionic structures are located at the upstream position of the cavity opening, and their leading-edge curves have a minimum distance of 0 mm from the cavity opening, as shown in Figure 5(a). Additionally, the average chord length c and spanwise length l of these schemes are 100 mm and 240 mm, respectively, which correspond to the width and length of the cavity opening. The cross-sectional shapes of these schemes in the X-Y plane are identical to the sectional parameters of the NACA0012 airfoil suction surface, and the sectional profiles of these schemes in the X-Y plane are shown in Figure 5(b). The cross-sectional shape of the smooth airfoil bionic scheme remains unchanged at different spanwise positions, and its chord length c
sm
satisfies the relationship in equation (5), where c
sm
= 100 mm, and the starting and ending points of this scheme in the x-direction are −94 mm and 6 mm, respectively. However, the cross-sectional shape of the other two sine-shaped bionic schemes varies with the spanwise position, and the chord length c
s
changes according to the relationship in equation (6). Both sine-shaped bionic schemes share the same starting point in the x-direction, which is −100 mm, while their ending points range from −6 mm to 6 mm. According to Wang et al.,
23
the wavelength of the sine-shaped leading-edge curve in the two sine-shaped bionic schemes is set to 0.1c (λ = 0.1c), and the amplitude is set to 0.12c (a = 0.06c). To further explore the influence of the wavelength λ on the noise reduction effect, while keeping other parameters unchanged, λ = 0.1c is randomly adjusted to λ = 0.24c. To provide a more straightforward view of the leading-edge curve changes of the three schemes along the spanwise direction, Figure 5(c) presents the results of these changes. Passive control schemes: (a) Geometry; (b) the outline of the three schemes in the X-Y plane; (c) leading-edge curves at Y = 0 m.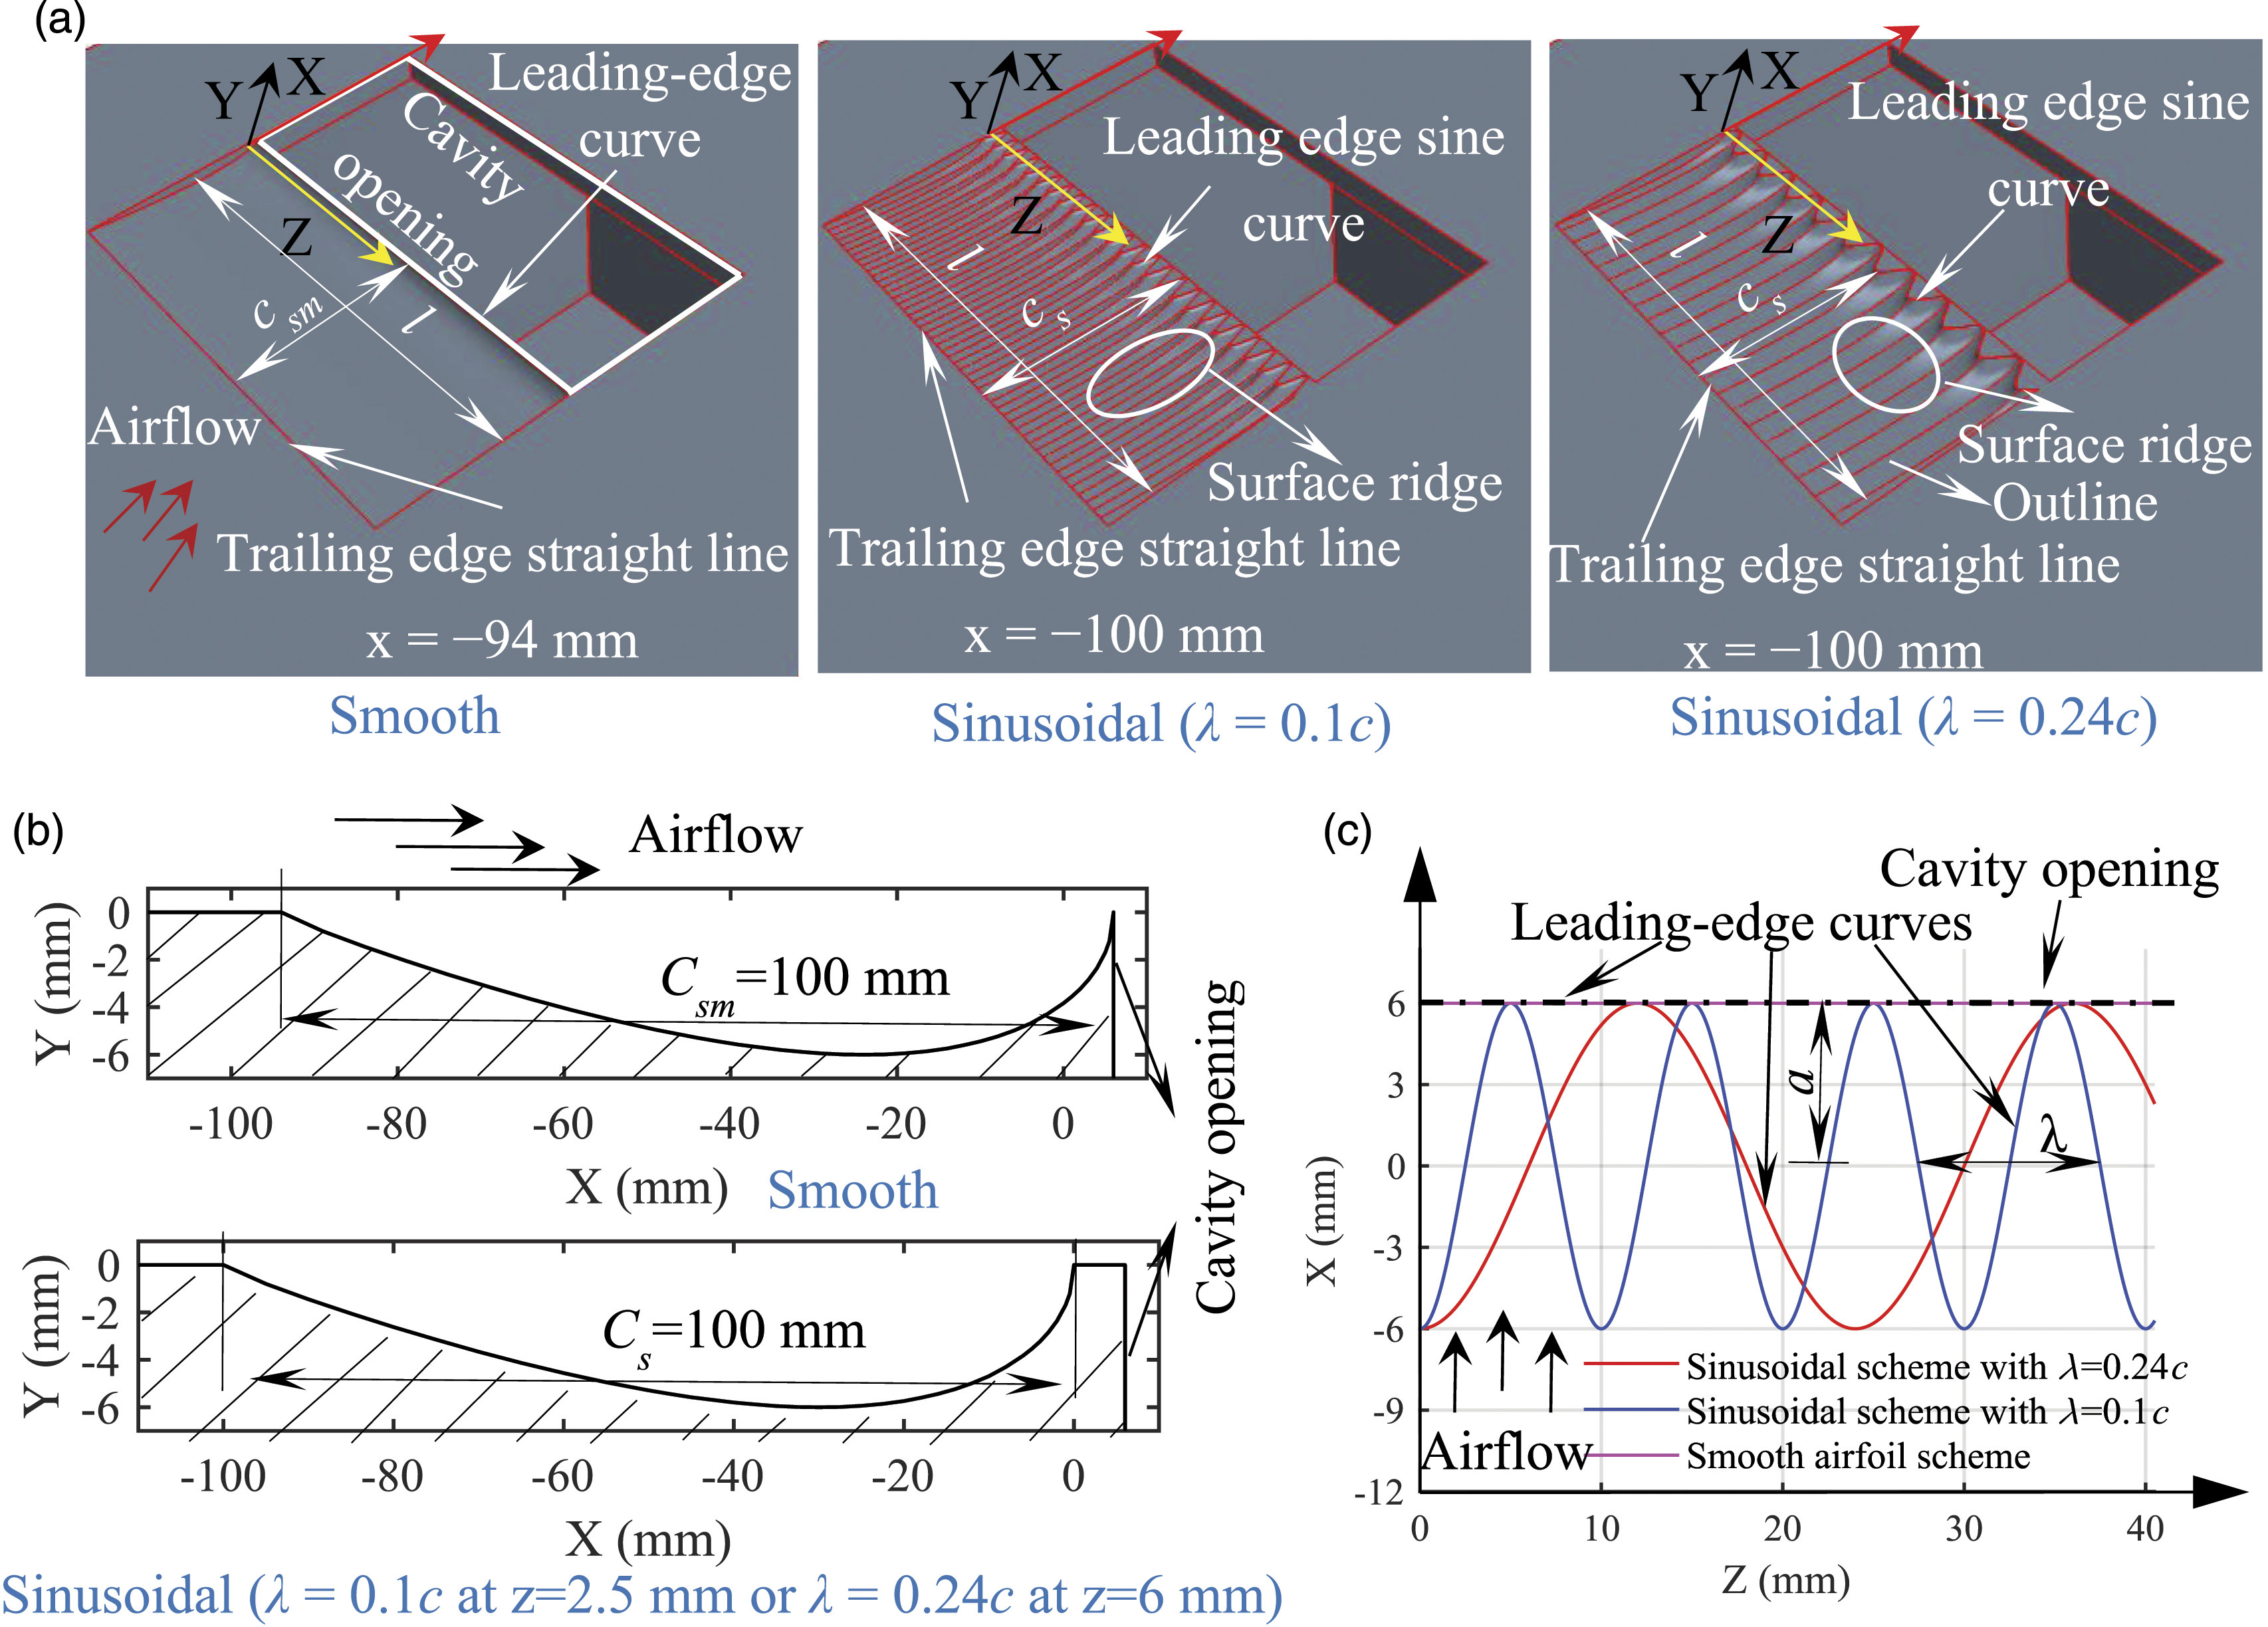
After defining the contour parameters of the bionic schemes, the geometric models of the three schemes were automatically generated using the scan command in the commercial software CATIA P3 V5R21. Initially, the flow direction profile of the biomimetic scheme was made to conform the contour parameters of the NACA0012 airfoil’s suction surface contour, which was defined as the scanning line. Then, the trailing edge straight line and leading-edge curve were defined as the guide wires. Finally, the biomimetic structure was completed using the scanning command and arranged in the form of pits upstream of the cavity opening, and its leading edge fits snugly against the cavity opening.


Spectral analysis
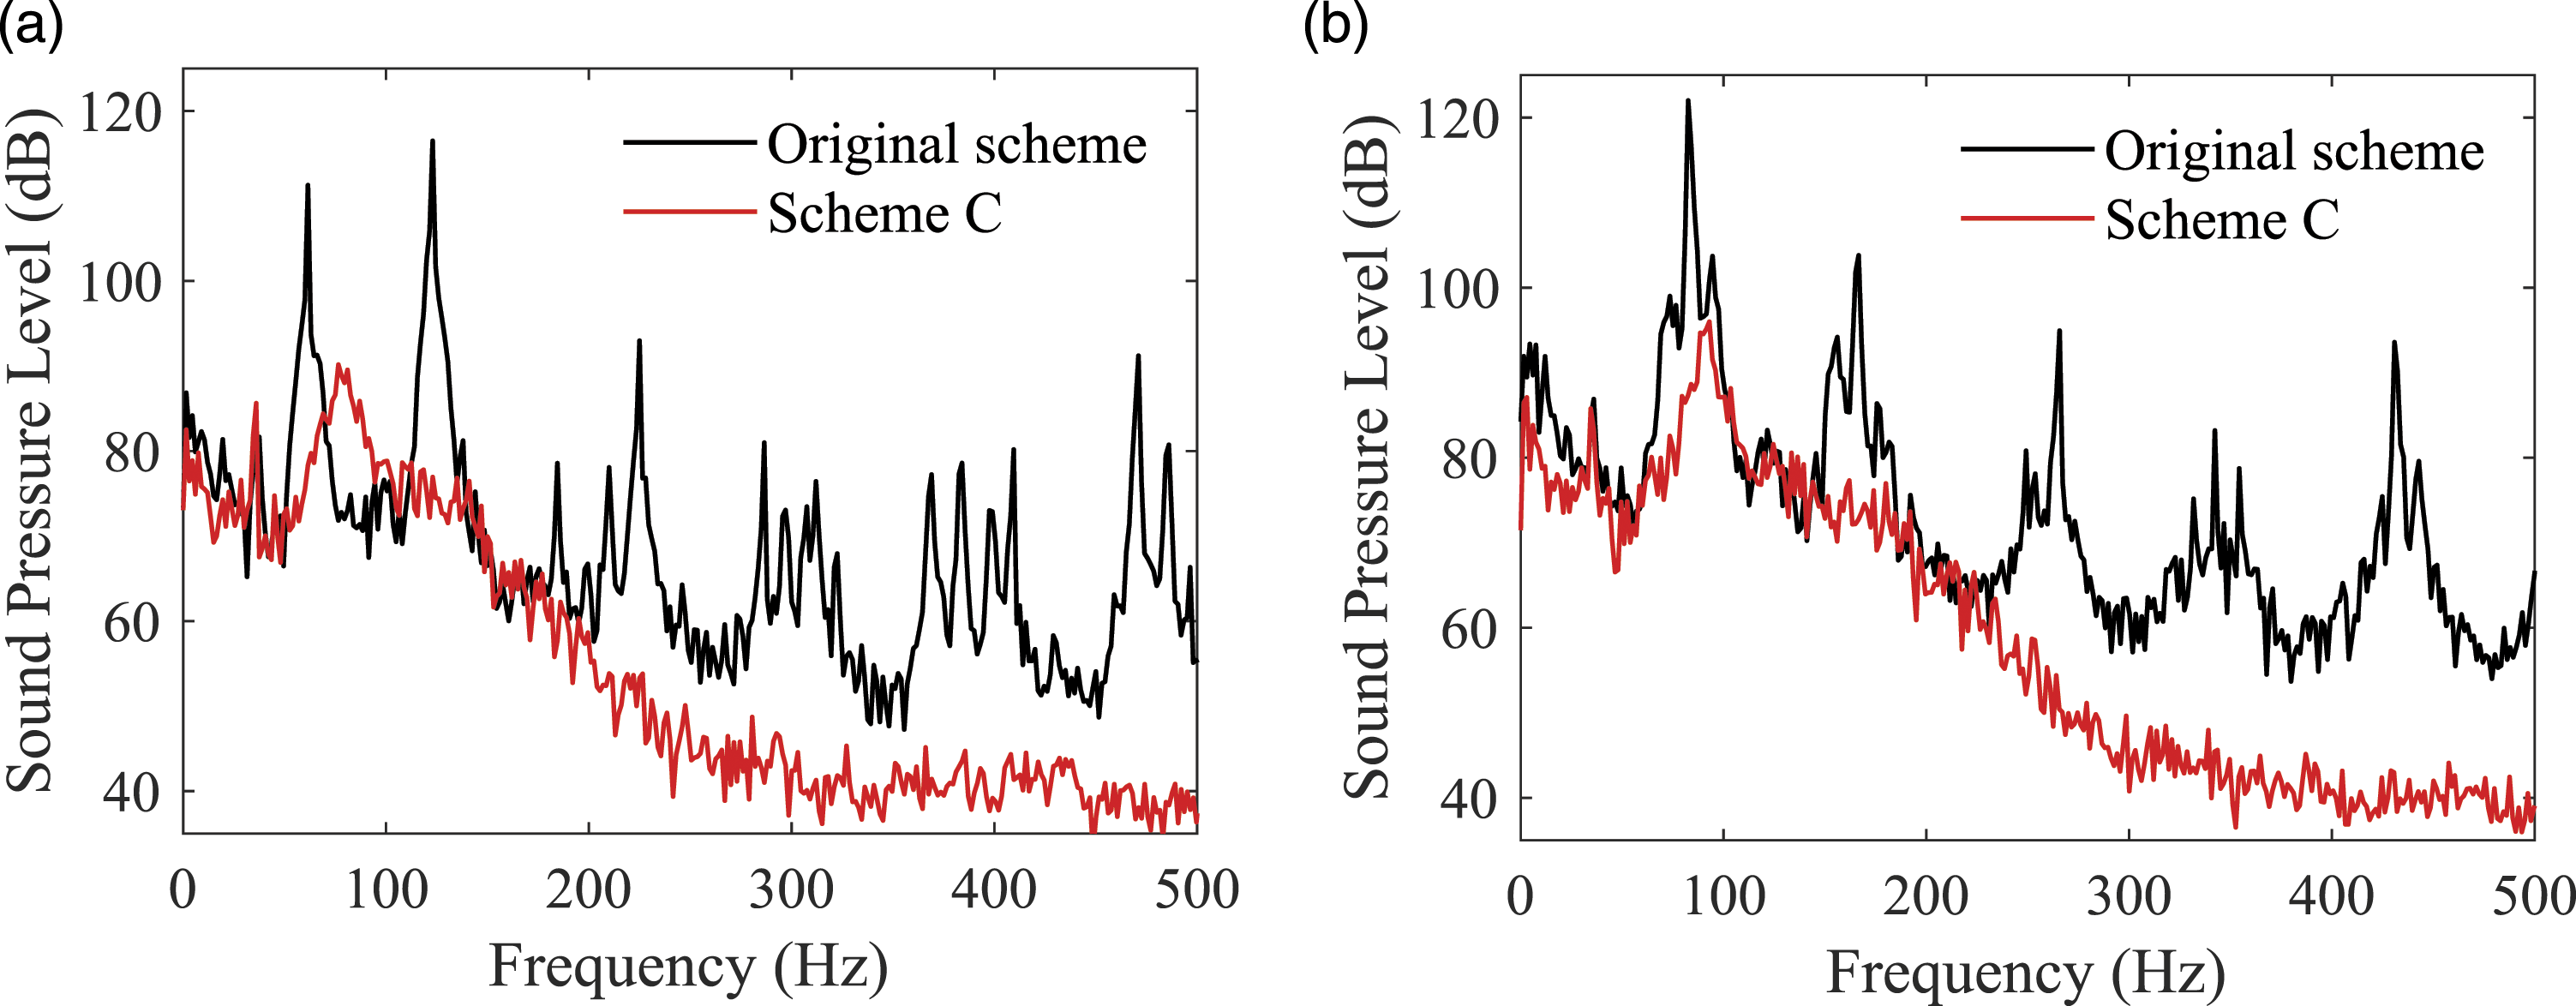
To compare the effectiveness of the three different schemes (the smooth airfoil scheme (Scheme A), the sinusoidal scheme with λ = 0.1c (Scheme B), the sinusoidal scheme with λ = 0.24c (Scheme C)), the pressure spectra were plotted for an airflow velocity of 25 m/s, as shown in Figure 6. All three schemes were observed to significantly suppress wind buffeting noise when compared to the original scheme, with first-order energy being reduced by more than 7.7 dB. The most significant suppression was observed in the second-order energy, which showed a reduction of up to 24.8 dB. Additionally, there was a notable increase in frequency for all orders. Spectrum of different schemes at 25 m/s.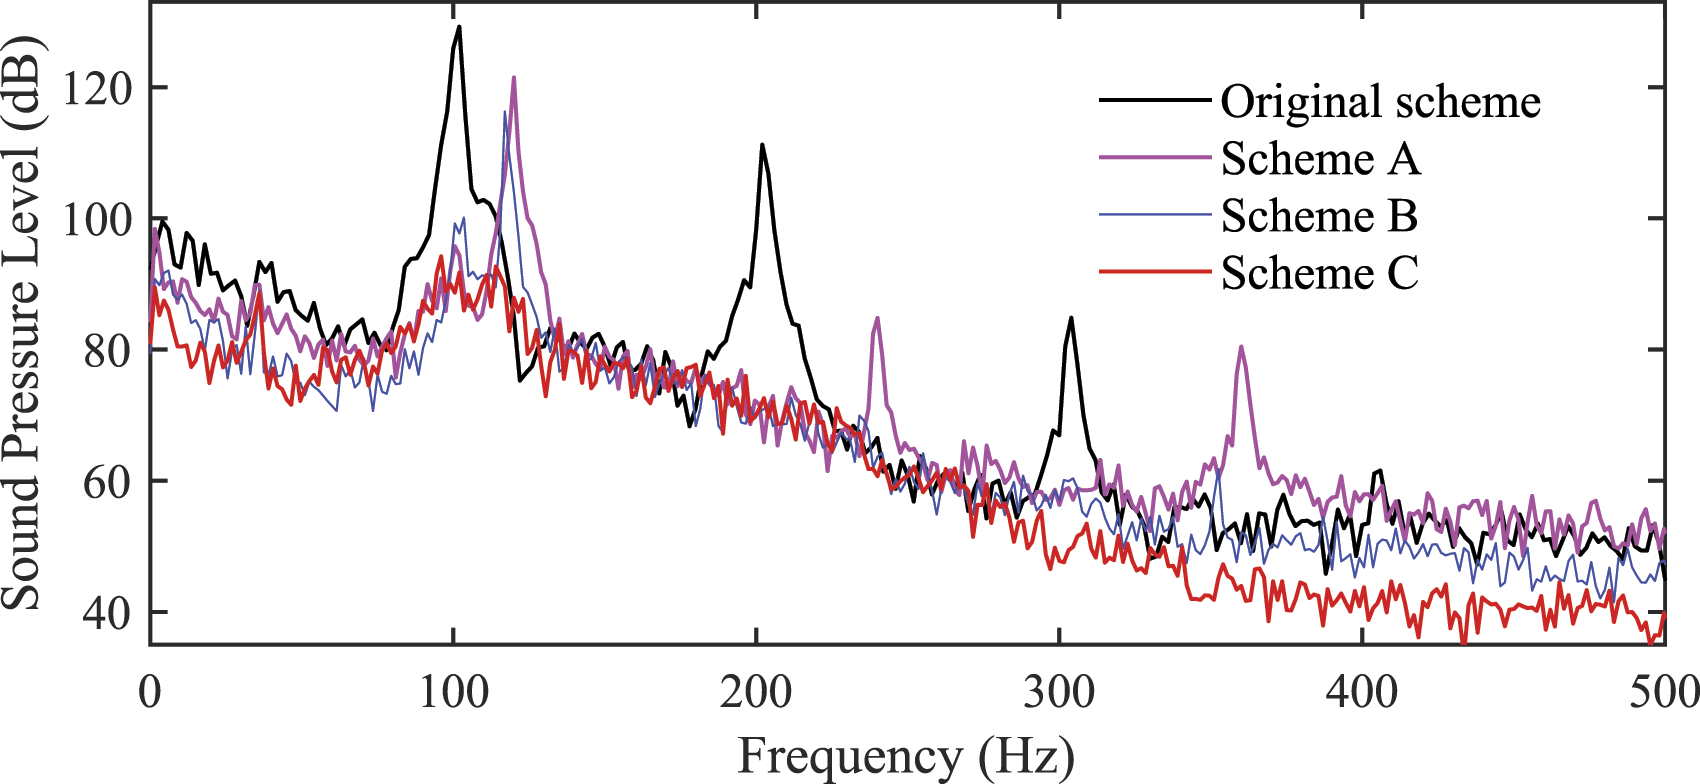
Scheme C was found to have the lowest first-order energy, with a reduction of approximately 35.0 dB and 27.3 dB compared to Schemes A and B, respectively. Furthermore, the second and third order buffeting energies were almost completely suppressed in the two sinusoidal schemes, with reductions of over 20 dB compared to Scheme A. Additionally, Scheme C exhibited stronger noise suppression compared to Scheme B, indicating that an appropriate value of λ is beneficial for wind buffeting noise reduction.
Working conditions
First-order buffeting energy.
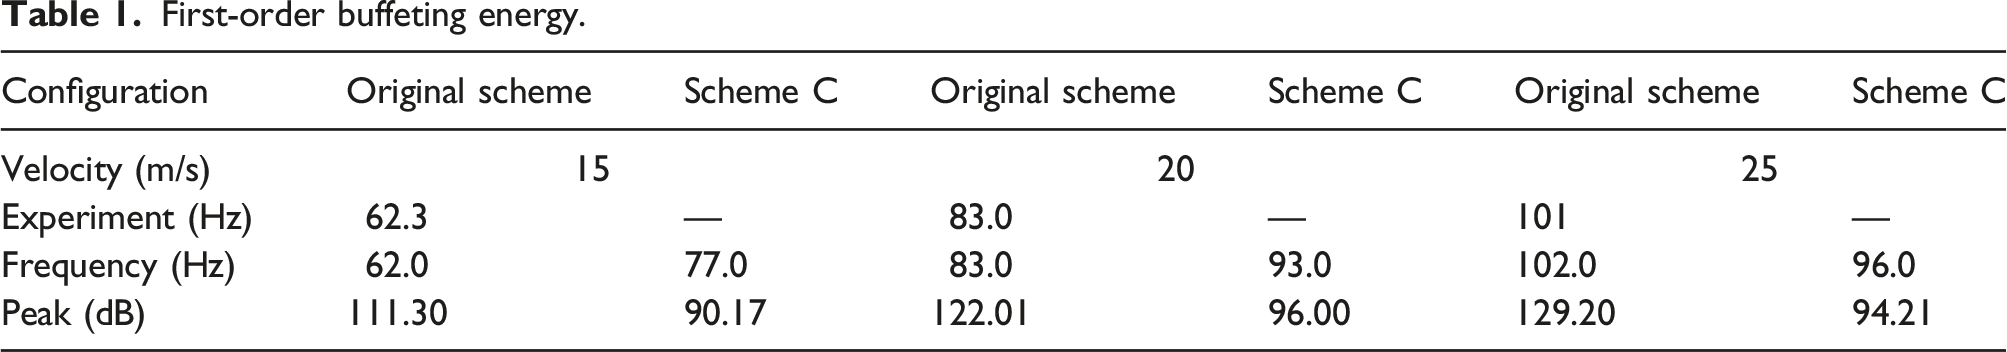
Spectrum analysis: (a) 15 m/s; (b) 20 m/s.
Wind buffeting noise reduction mechanism
Spanwise pressure correlation
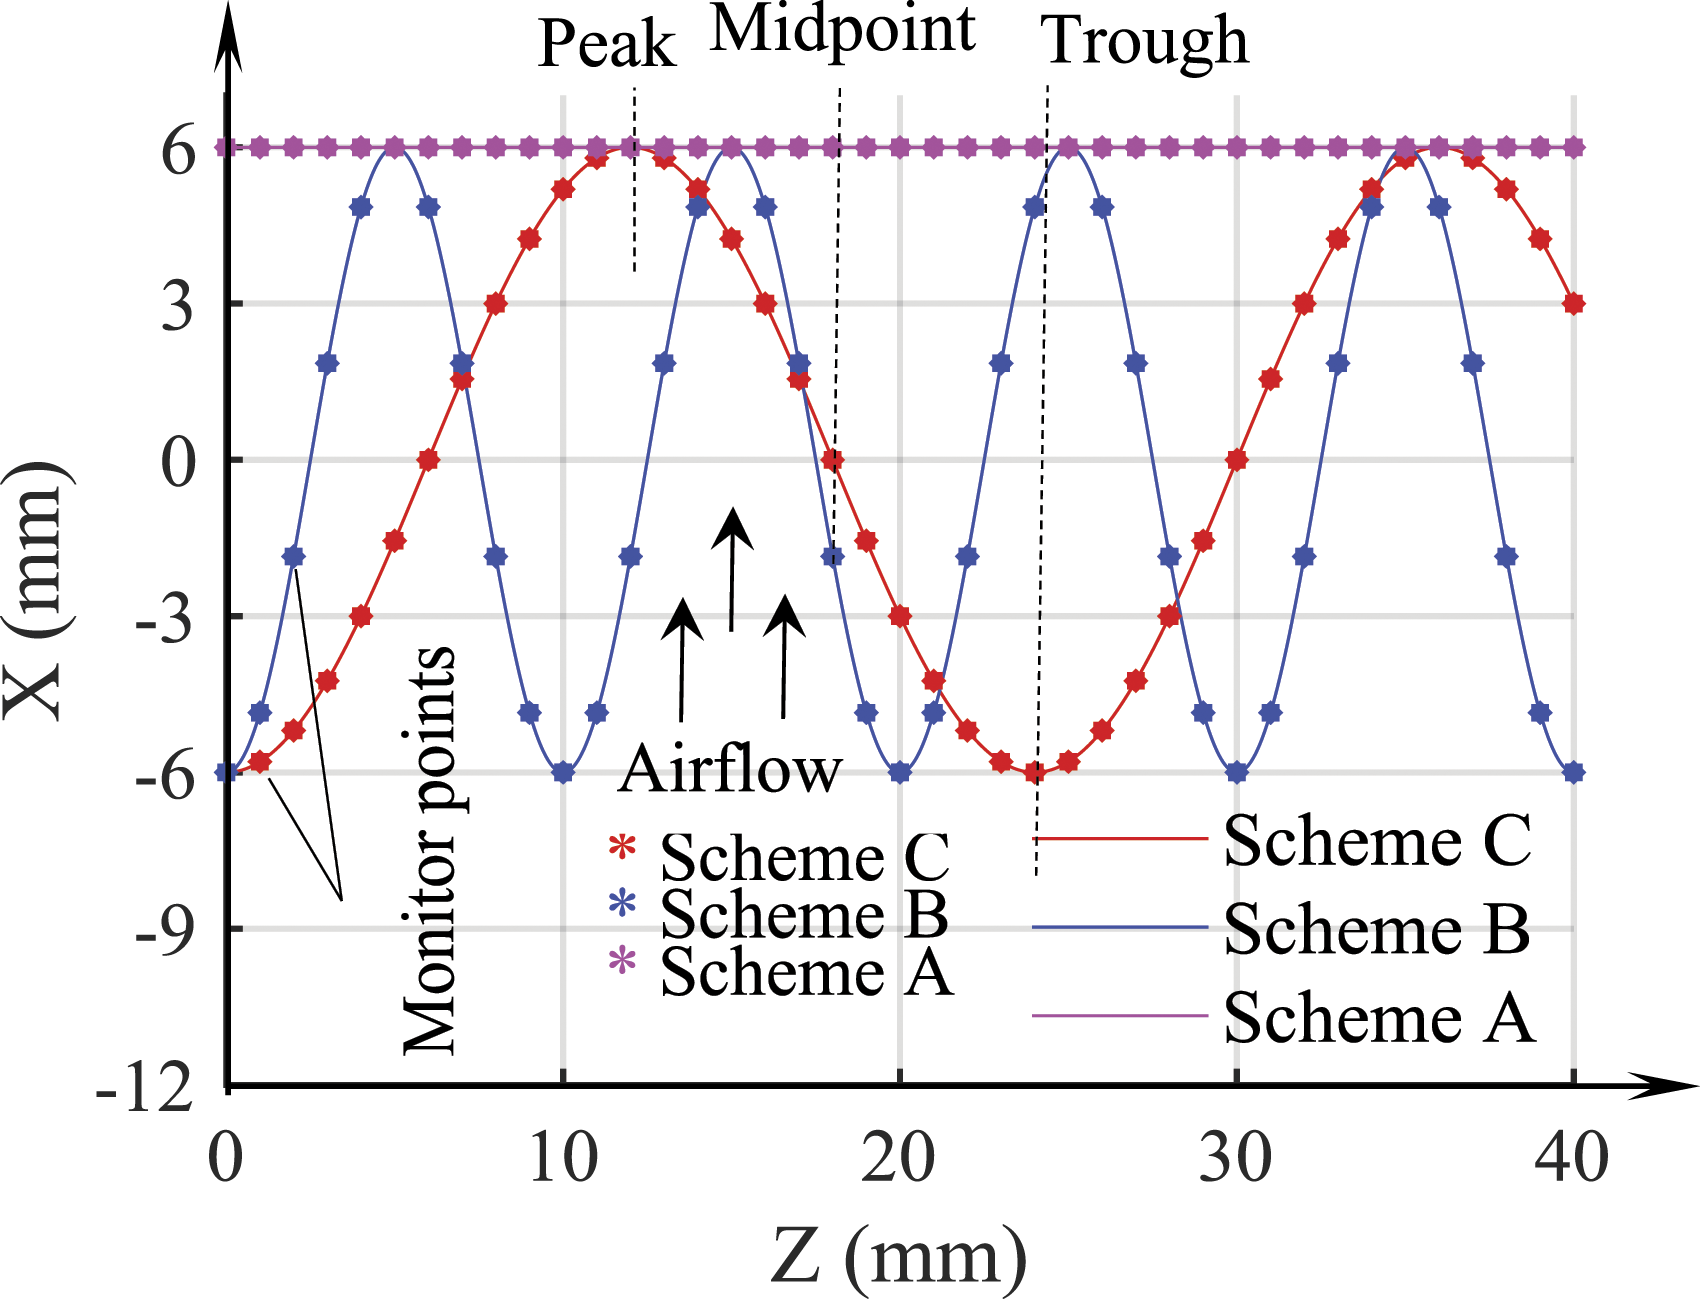
To observe the relationship between spanwise pressure correlation and wind buffeting noise for different schemes. Spanwise pressure correlation Rpp(•)
20
is defined as Schematic illustration of monitoring points on leading-edge curves for Scheme A, Scheme B, and Scheme C. Spanwise pressure correlation.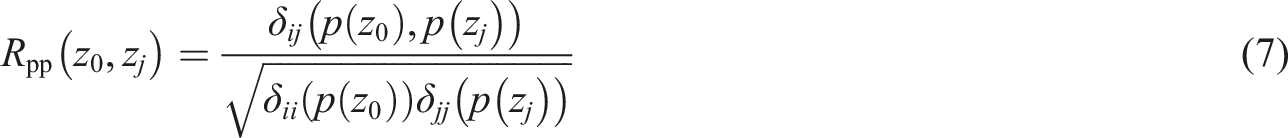
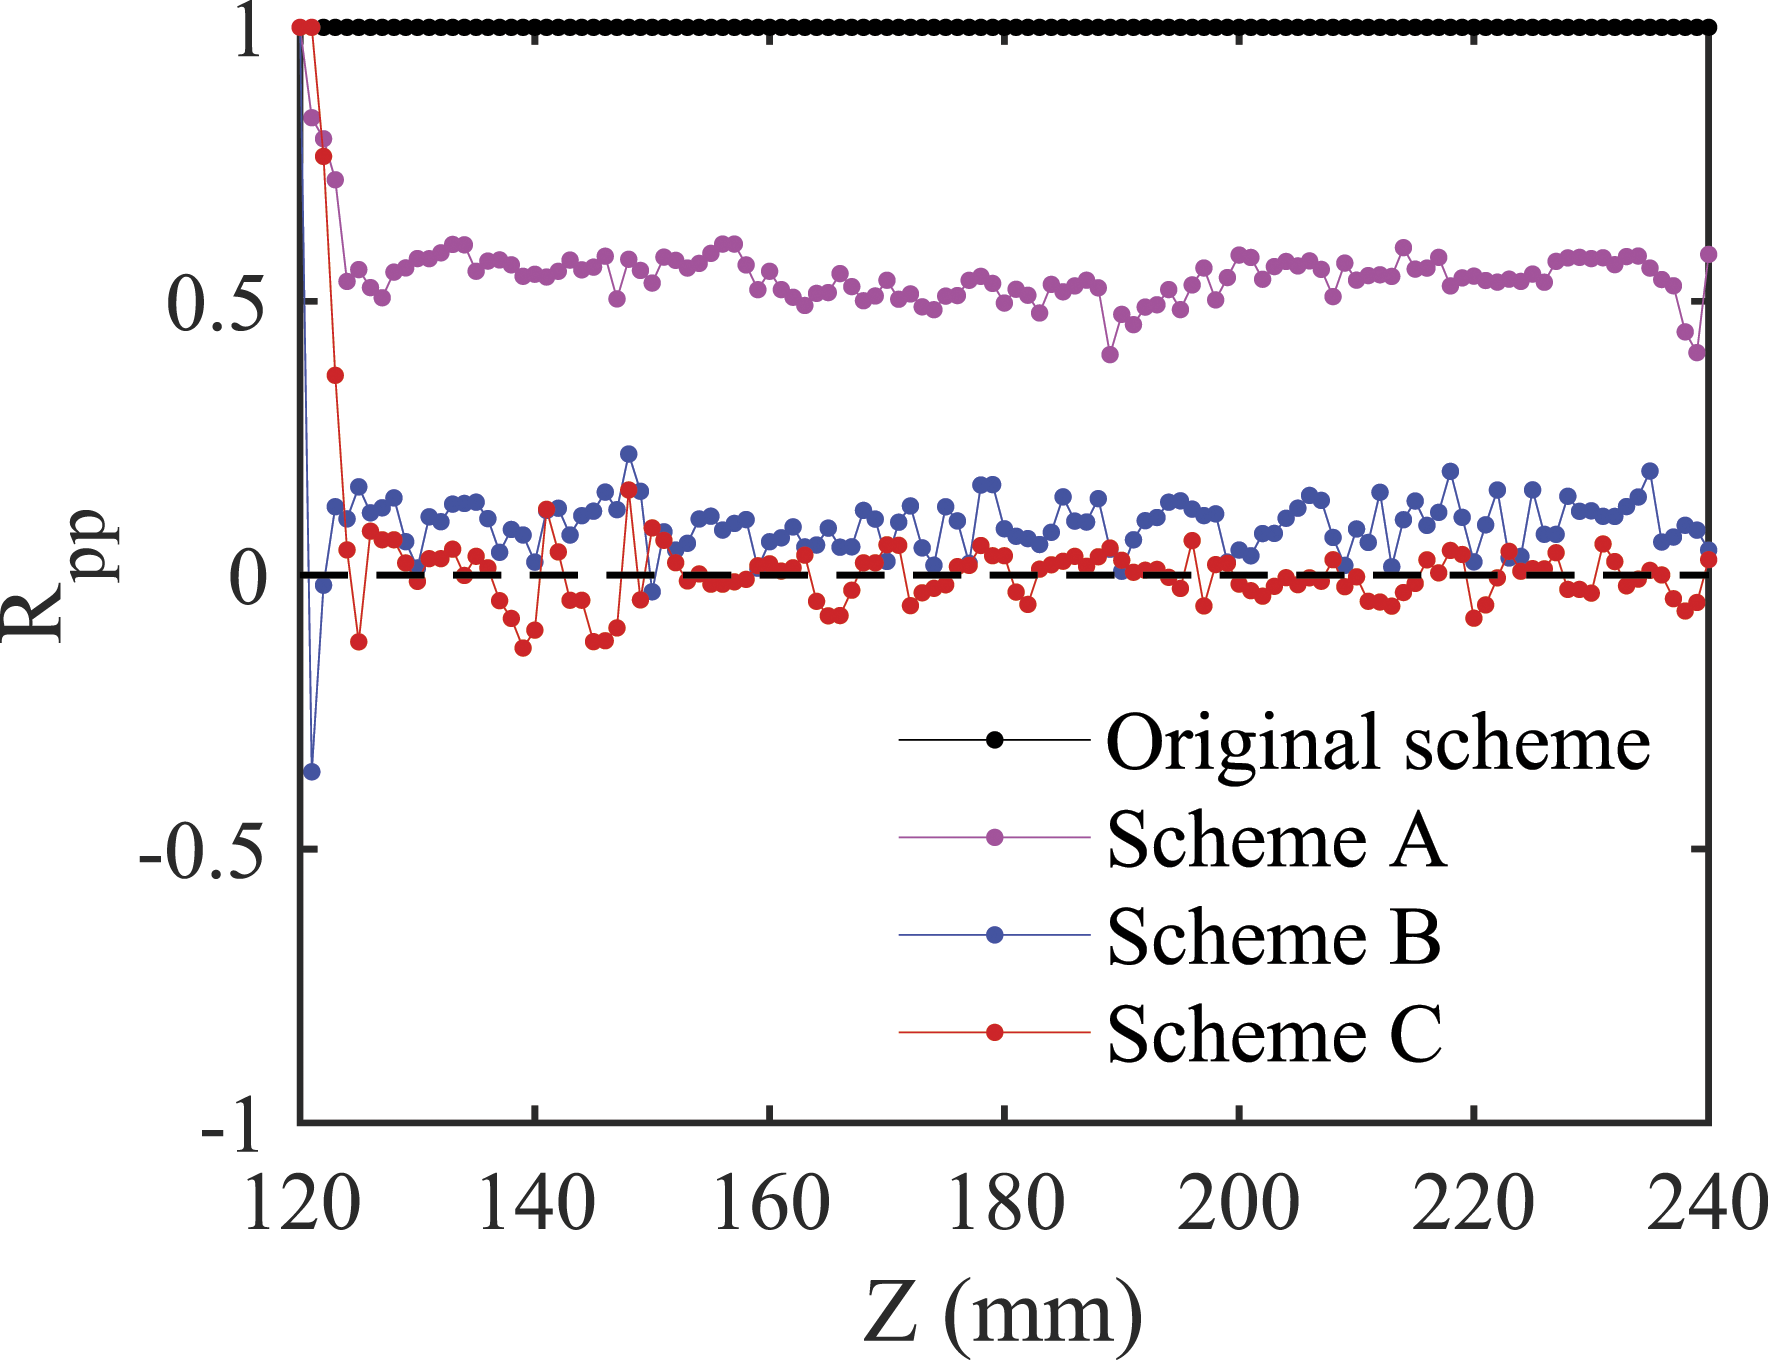
As Rpp is related to the turbulence-induced vortex shedding, it may provide some insights into the underlying noise reduction mechanism. In Figure 9, Rpp has a value of 1.0 in the original scheme. When the biomimetic structure of Scheme A is placed upstream of the cavity, Rpp decreases to 0.5. Further reduction in Rpp is observed when the leading-edge serration and surface ridge are added in the sinusoidal schemes. Scheme B resulted in an Rpp of approximately 0.1, while Scheme C achieved an Rpp value of 0.0, highlighting the effectiveness of these modifications in reducing spanwise correlation. These findings are consistent with previous research indicating that the closer the Rpp to 0.0, the greater the noise reduction effect.20,23
Shear layer
Many studies9,10 have shown that the shear layer has a significant impact on wind buffeting noise. Therefore, the time-averaged velocity is shown in Figure 10. Figure 10 displays the time-averaged velocity at different planes located at specific locations: z = 120 mm, z = 122.5 mm, z = 125 mm, z = 126 mm, and z = 132 mm, which correspond to the troughs, midpoints, and peaks of Scheme B and Scheme C depicted in Figure 8, respectively. Time-averaged velocity cloud: (a) Original scheme; (b) Scheme A; (c) Scheme B; (d) Scheme C.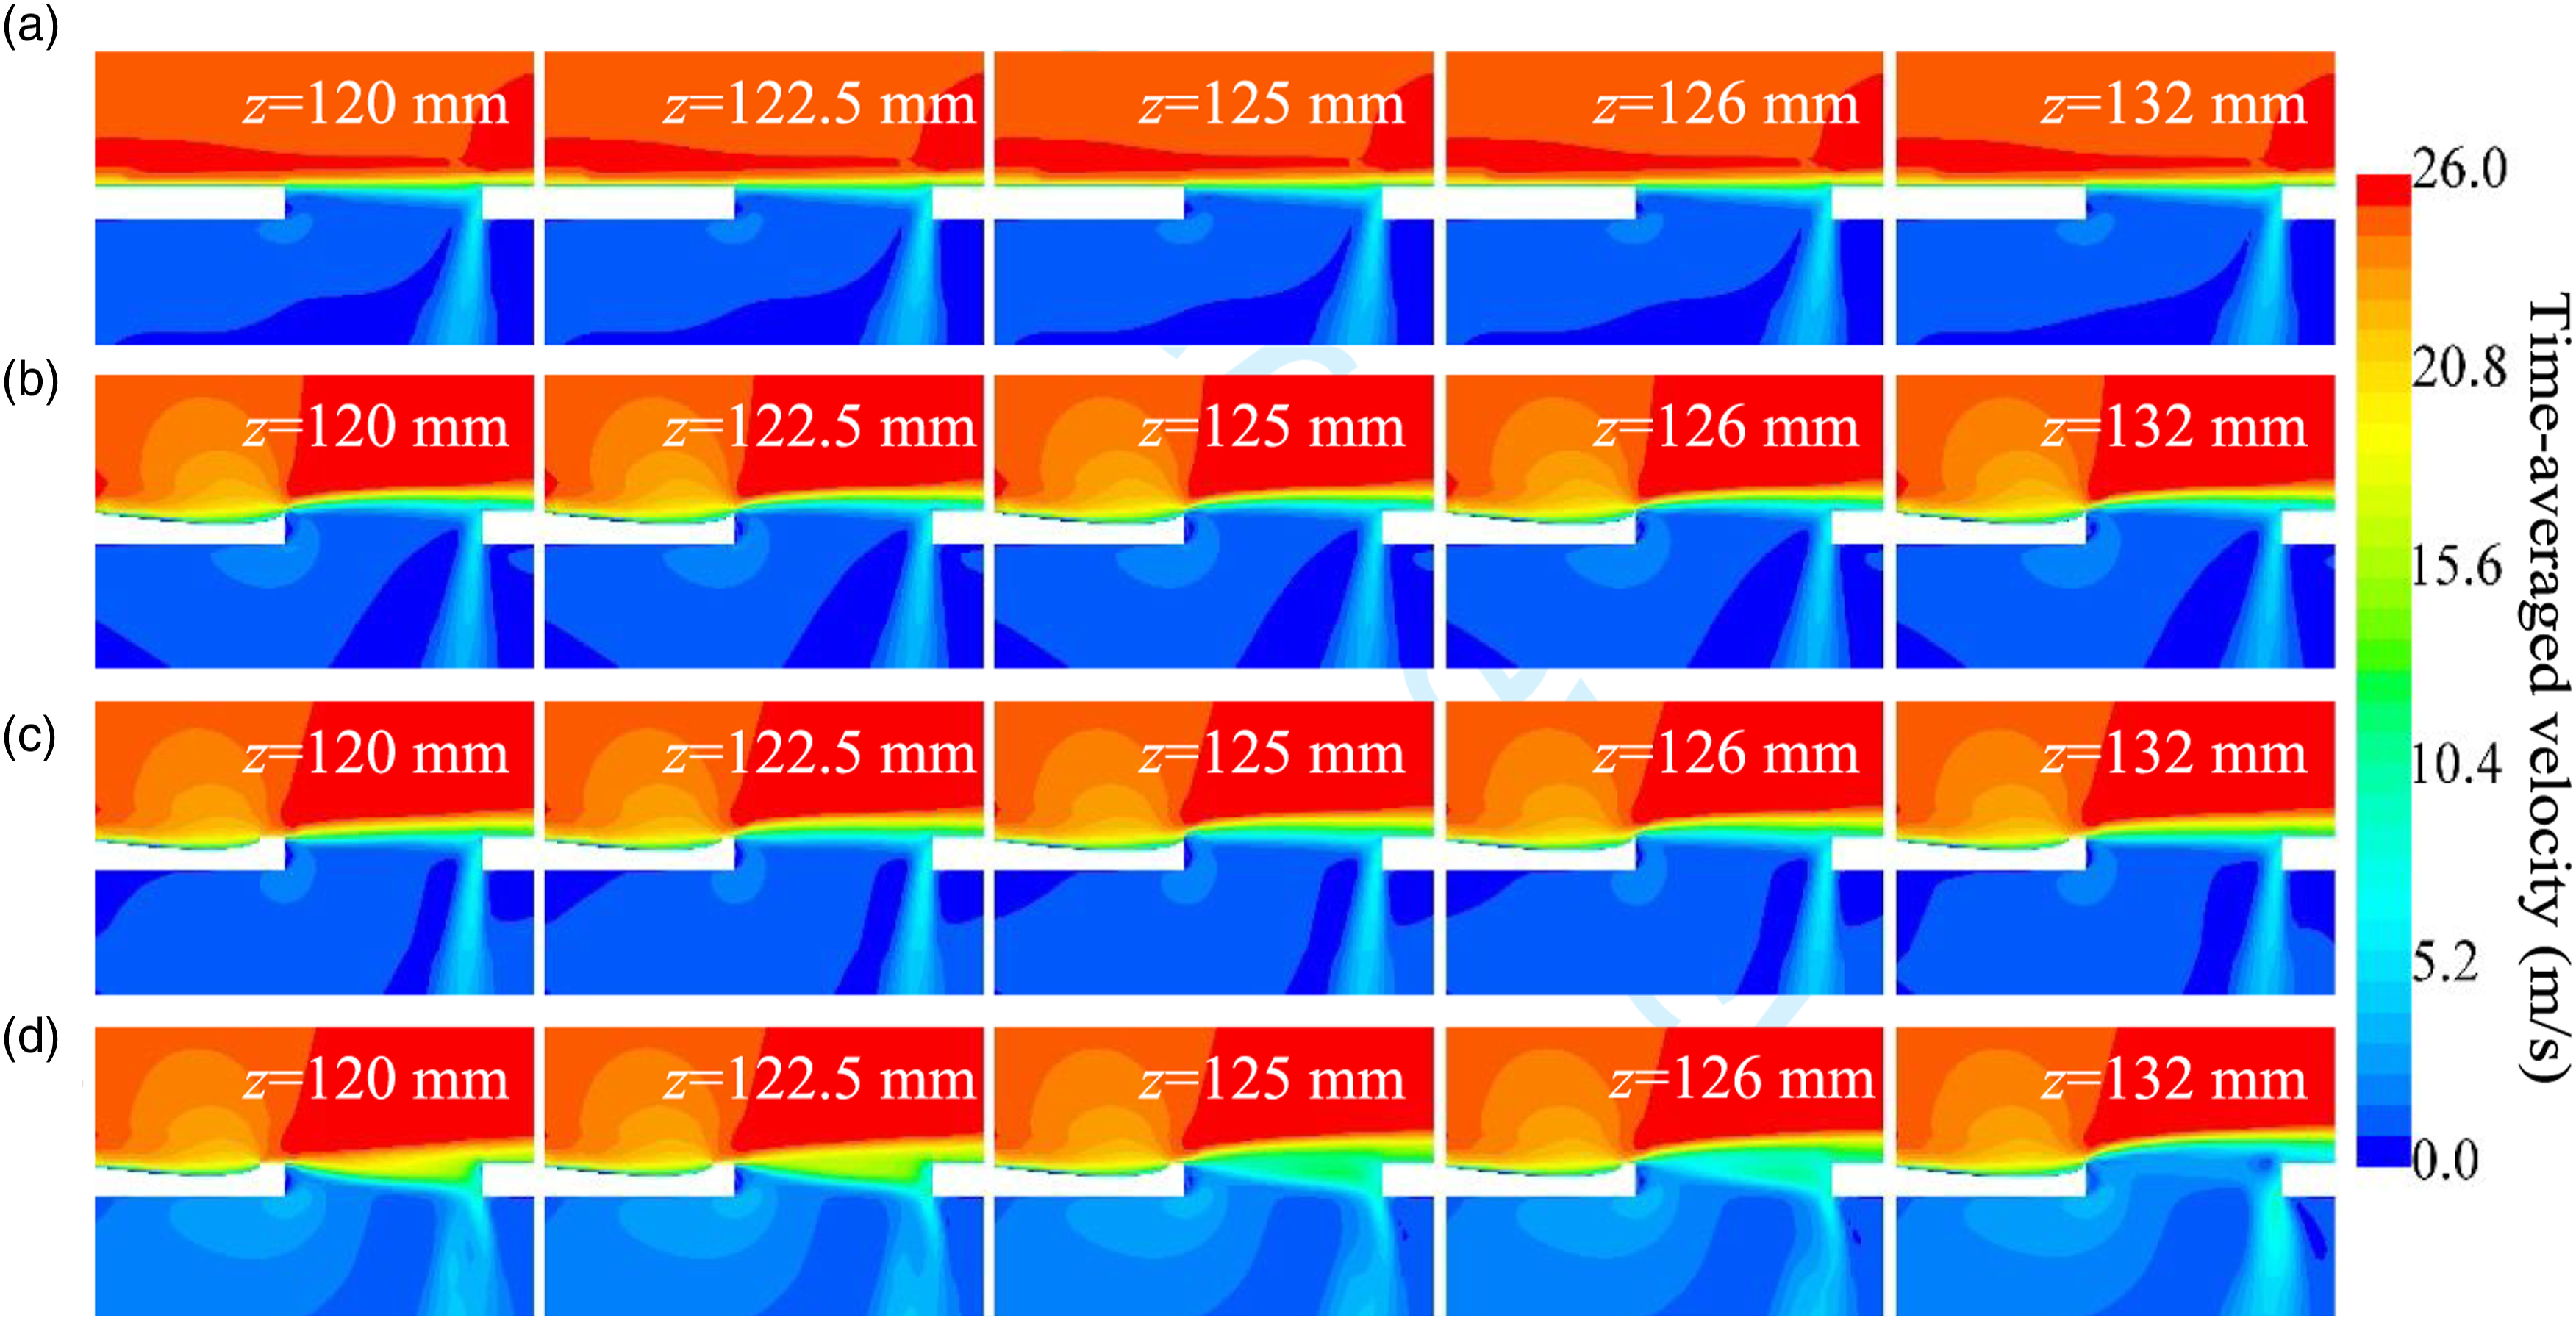
In comparison to the original scheme, the three bionic schemes exhibit a thicker shear layer thickness, with Scheme C showing the most significant increase. This finding is in line with the conclusion drawn by Wang et al. 9 that a thicker shear layer is more effective in reducing wind buffeting noise. In addition, the thickness of the shear layer in Schemes B and C varies along the span due to the influence of λ. It is worth noting that Scheme C exhibits a weaker intensity of the airflow into the cavity from the trailing edge compared to other schemes.
Boundary layer thickness
As the bionic scheme is located upstream of the cavity, it has a significant impact on the distribution of the boundary layer. To illustrate this effect, contours were drawn on different spanwise sections when the time-averaged velocity reached 0.99 times the inlet velocity (25 m/s), as shown in Figure 11. These sections were selected at z = 120 mm, z = 125 mm, and z = 132 mm, corresponding to the trough and peak positions of Schemes B and C depicted in Figure 8, respectively. Boundary layer thickness distribution: (a) z = 120 mm; (b) z = 125 mm; (c) z = 132 mm.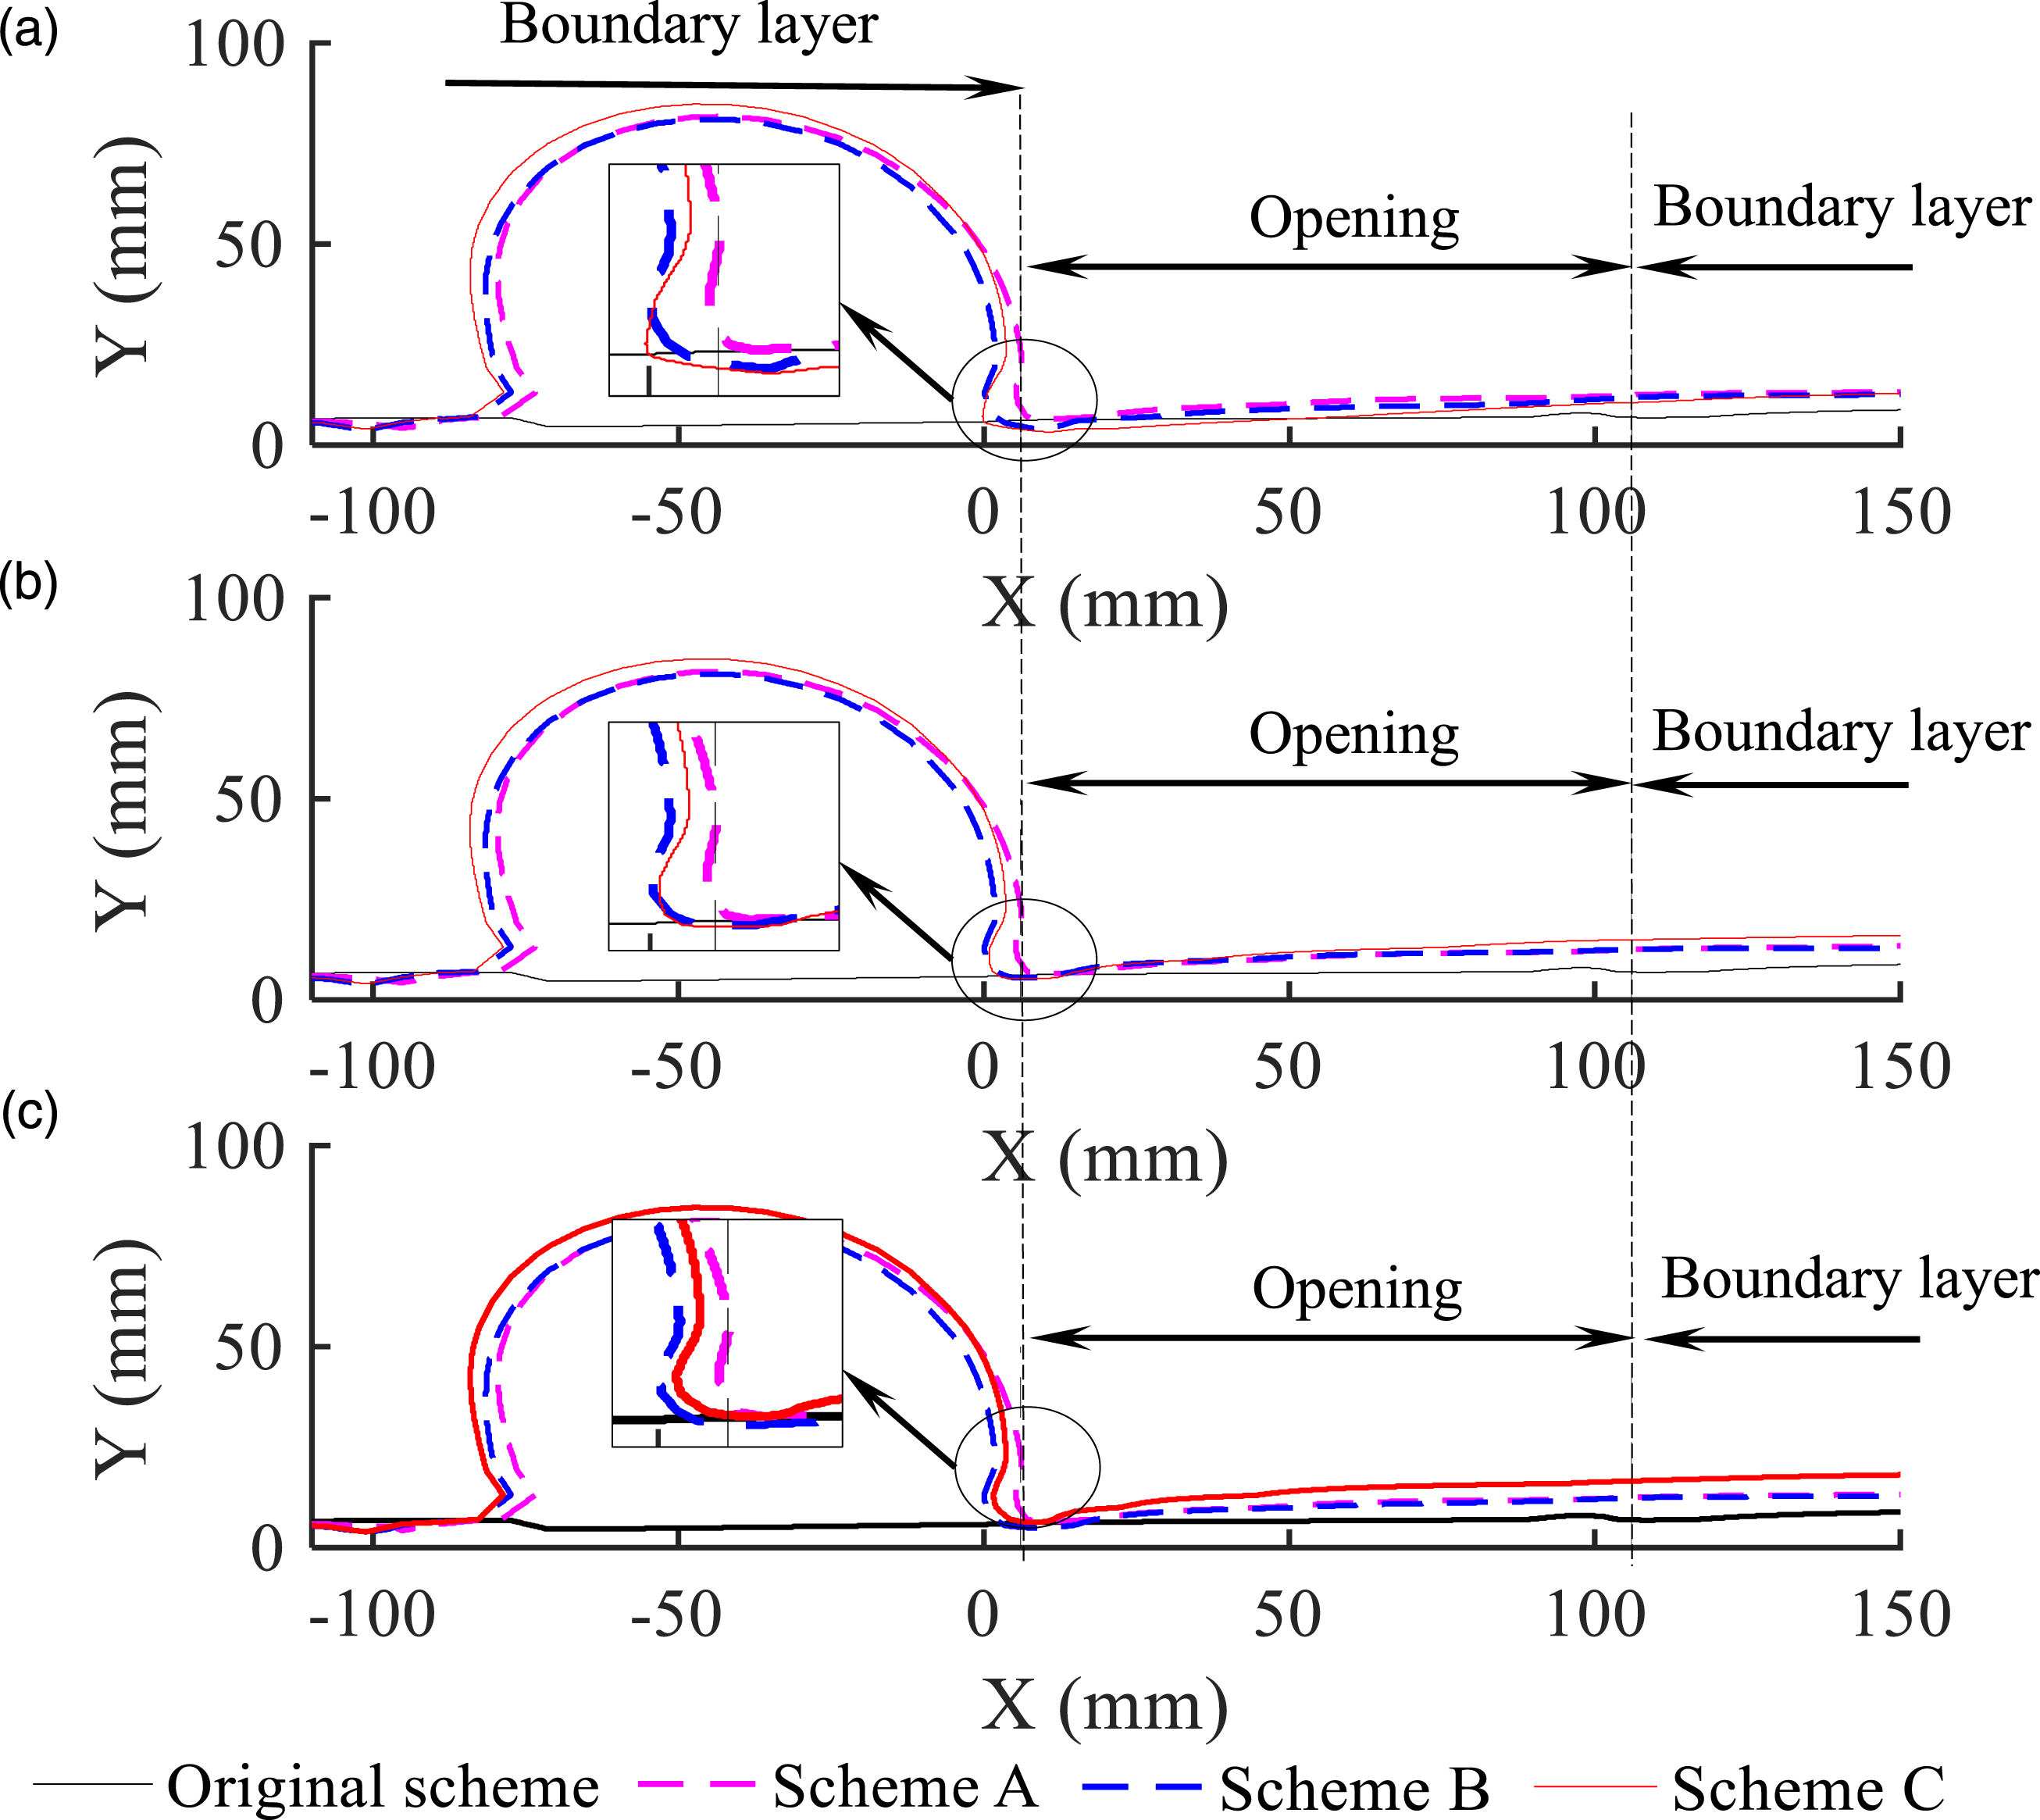
In contrast to the original scheme, the boundary layer of the three bionic schemes exhibits a noticeably thicker profile both upstream and downstream of the cavity opening. This observation is consistent with the conclusion drawn by Wang et al. 8 that a thicker boundary layer contributes to better suppression of wind buffeting noise. It is worth noting that in the three bionic schemes, the BLT of Schemes B and C varies across different X-Y planes due to the influence of the leading-edge serration and surface ridge. For example, in the case of the trough as shown in Figure 11(a), the thickness of the BLT of Scheme C is 0.6 mm and 1.5 mm lower than that of Scheme B at the leading and trailing edges of the cavity, respectively. When Schemes B and C are at the peak position, corresponding to Figure 11(b) and (c), respectively, the BLT of Scheme C is 1.1 mm and 4 mm higher than that of Scheme B at the leading and trailing edges of the cavity, respectively. Furthermore, it is 9.6 mm higher than that of the original scheme at the trailing edge. These findings suggest that λ has a significant impact on the thickness of the boundary layer, and a detailed analysis is provided in the Effect of Wavelength section.
Self-sustained oscillation
To explore the self-sustained process in the different schemes and provide a better understanding of the noise reduction mechanism of the bionic schemes, six pressure snapshots are extracted at a time interval of 0.002 s in the X-Y plane of z = 120 mm, corresponding to the troughs in Scheme B and Scheme C, with a total duration of 0.01 s, which includes only one wind buffeting period. The results of Scheme B and Scheme C are shown in Figure 12. In Figure 12(a), a positive pressure core and a negative pressure core fall off from the leading edge and move downstream until they hit the trailing edge, triggering the fall off of the subsequent pressure core. This phenomenon represents the self-sustained oscillation of the wind buffeting noise. Meanwhile, when the positive and negative pressure cores hit the trailing edge, the pressure inside the cavity fluctuates accordingly. However, the introduction of a bionic scheme, as depicted in Figure 12(b)–(d), leads to a positive pressure upstream of the cavity, while only negative pressure fluctuations occur at the cavity opening. This disappearance of the positive pressure core results in reduced pressure fluctuations in the cavity. Among the three bionic schemes, Scheme C exhibits lower energy carried by the negative pressure core when it hits the trailing edge, in comparison to Scheme A and Scheme B. Furthermore, unlike Scheme A and Scheme B, Scheme C does not gather the pressure cores falling off from the leading edge into a pressure core. Instead, some of the pressure group moves downstream, while the other part enters the cavity. As a result, this reduces the pressure fluctuations inside the cavity. Pressure cloud at z = 120 mm: (a) Original scheme; (b) Scheme A; (c) Scheme B; (d) Scheme C.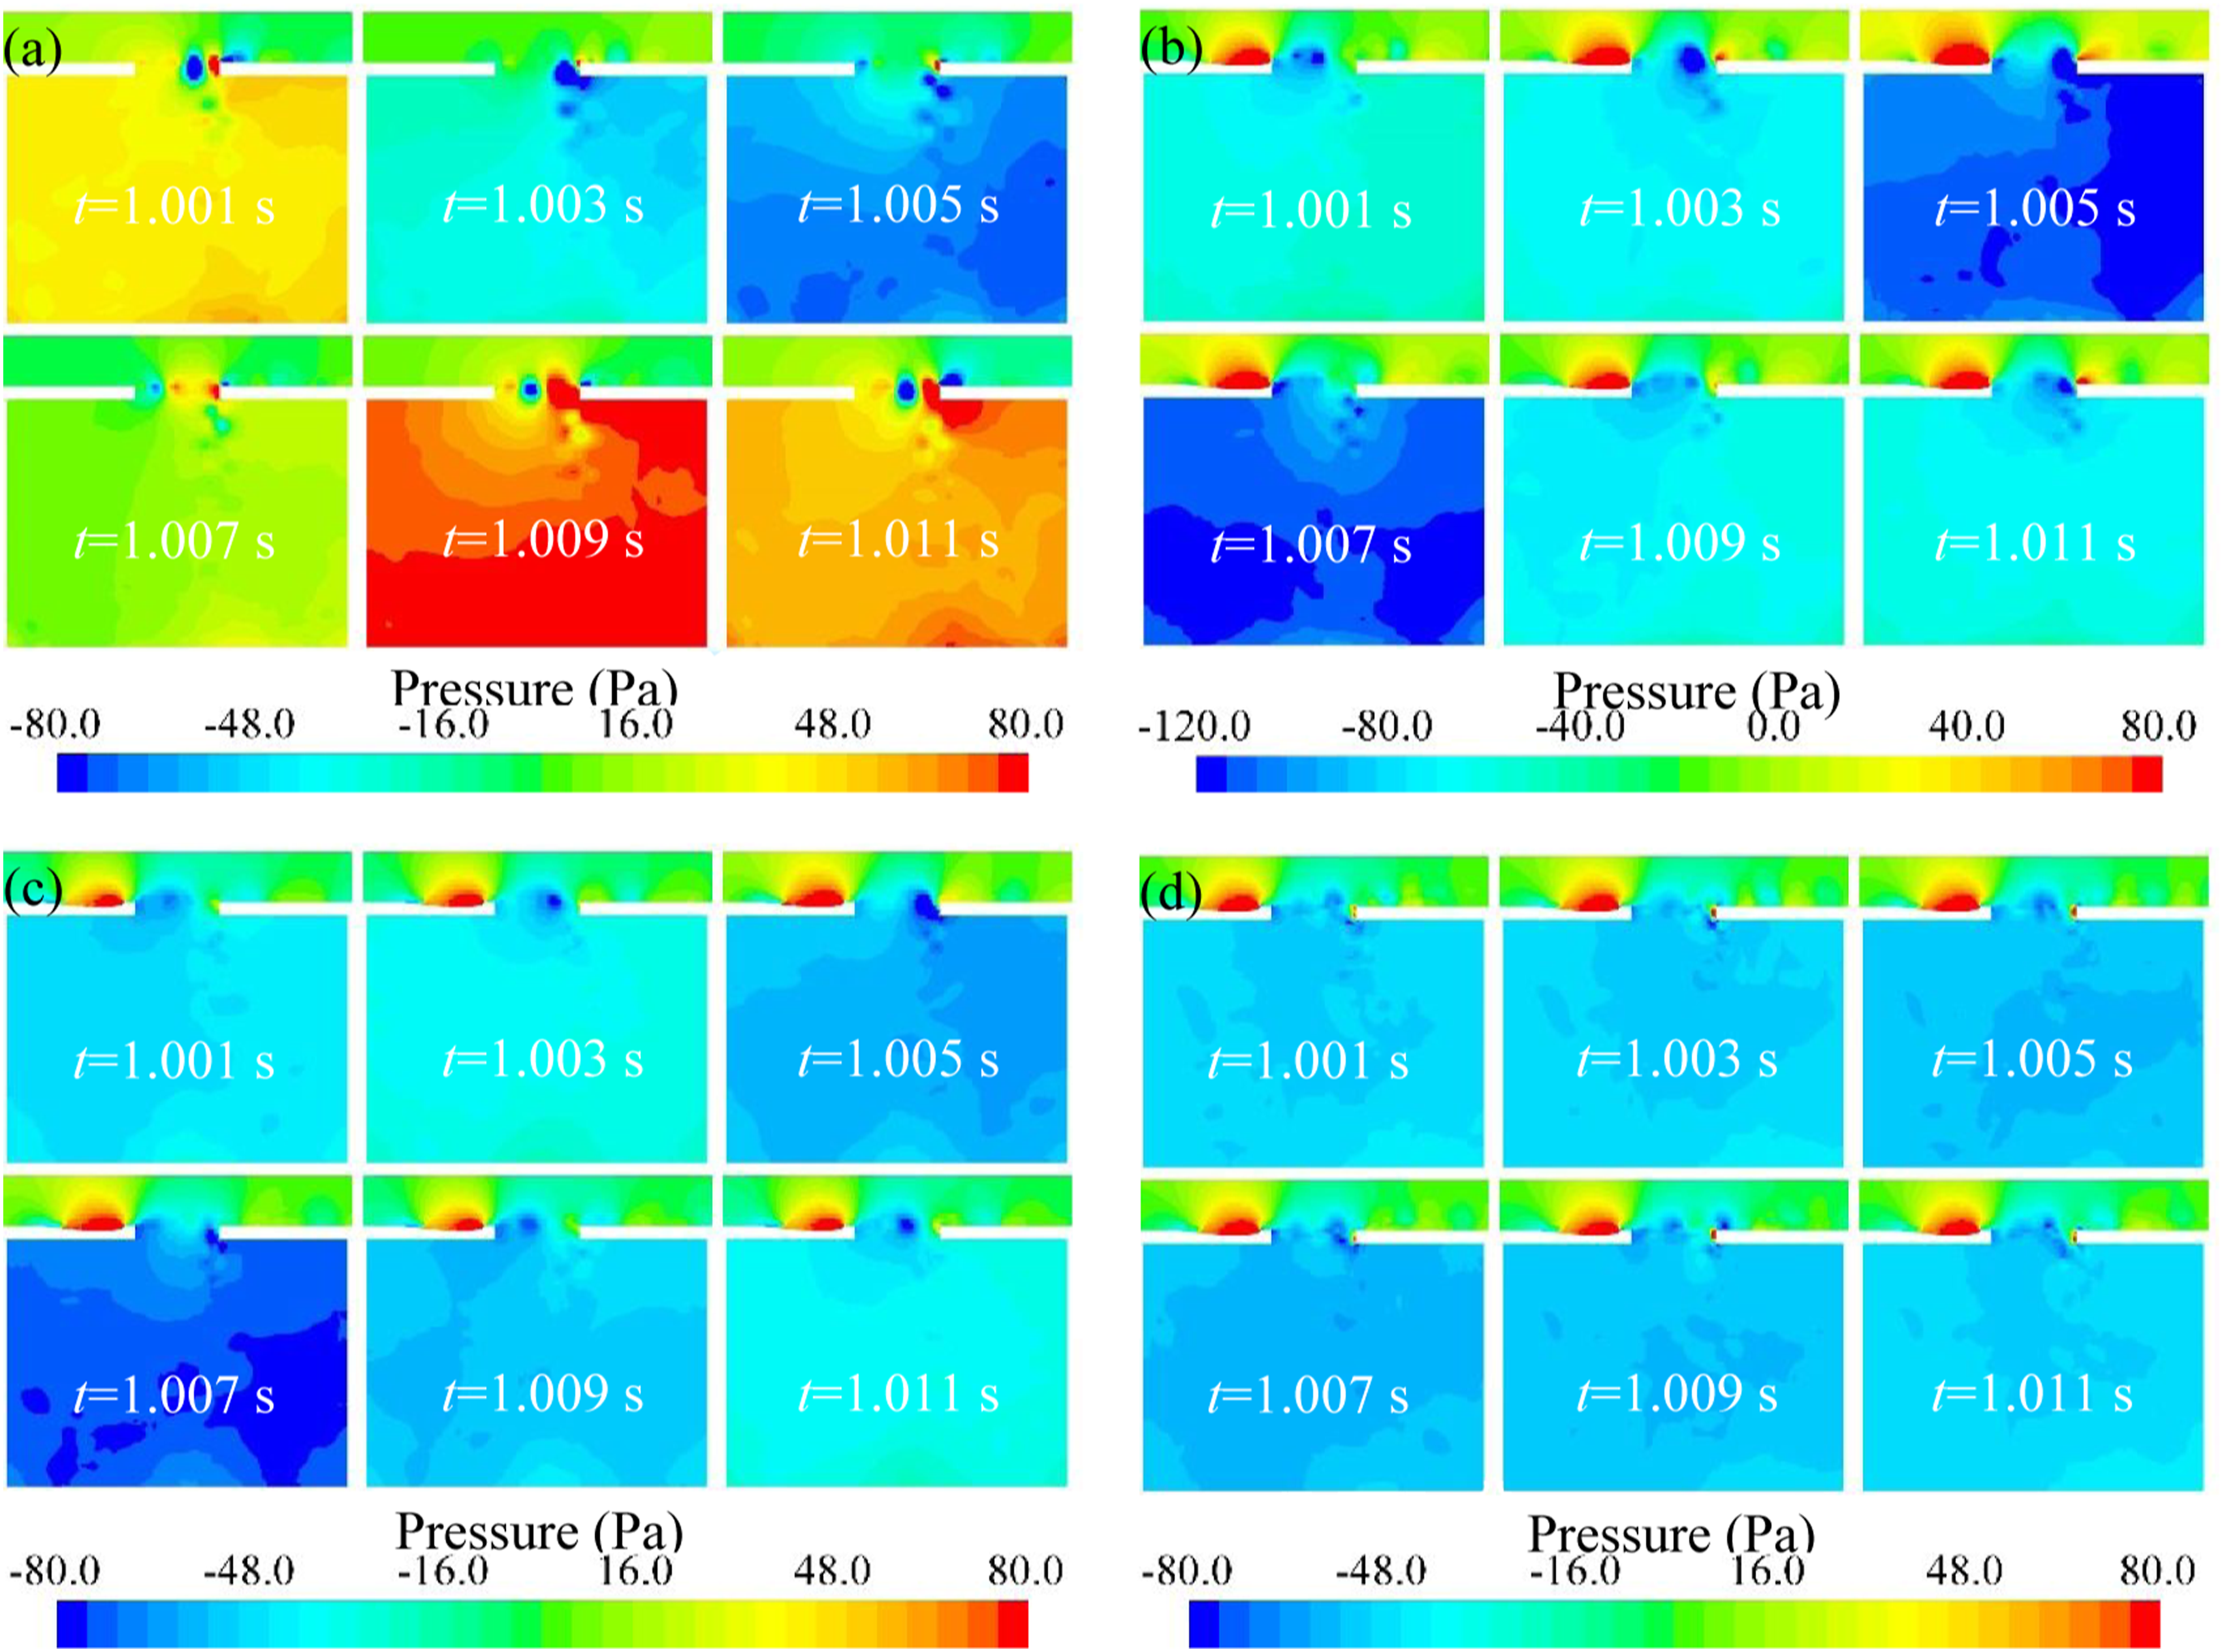
The pressure core’s fluctuation in Scheme B and Scheme C exhibits a spanwise property due to the influence of the leading-edge serration and surface ridge. Therefore, corresponding to the peak position of Scheme B and Scheme C in Figure 8, respectively, the self-sustained oscillation is shown in Figure 13. The movement of the pressure core in Scheme B and Scheme C is similar to Figure 12(c) and (d), respectively, as illustrated in Figure 13. However, the pressure core’s fluctuation in Figure 13(b) is more significant compared to the pressure fluctuation observed in Figure 12(d). Pressure cloud: (a) Scheme B at z = 125 mm; (b) Scheme C at z = 132 mm.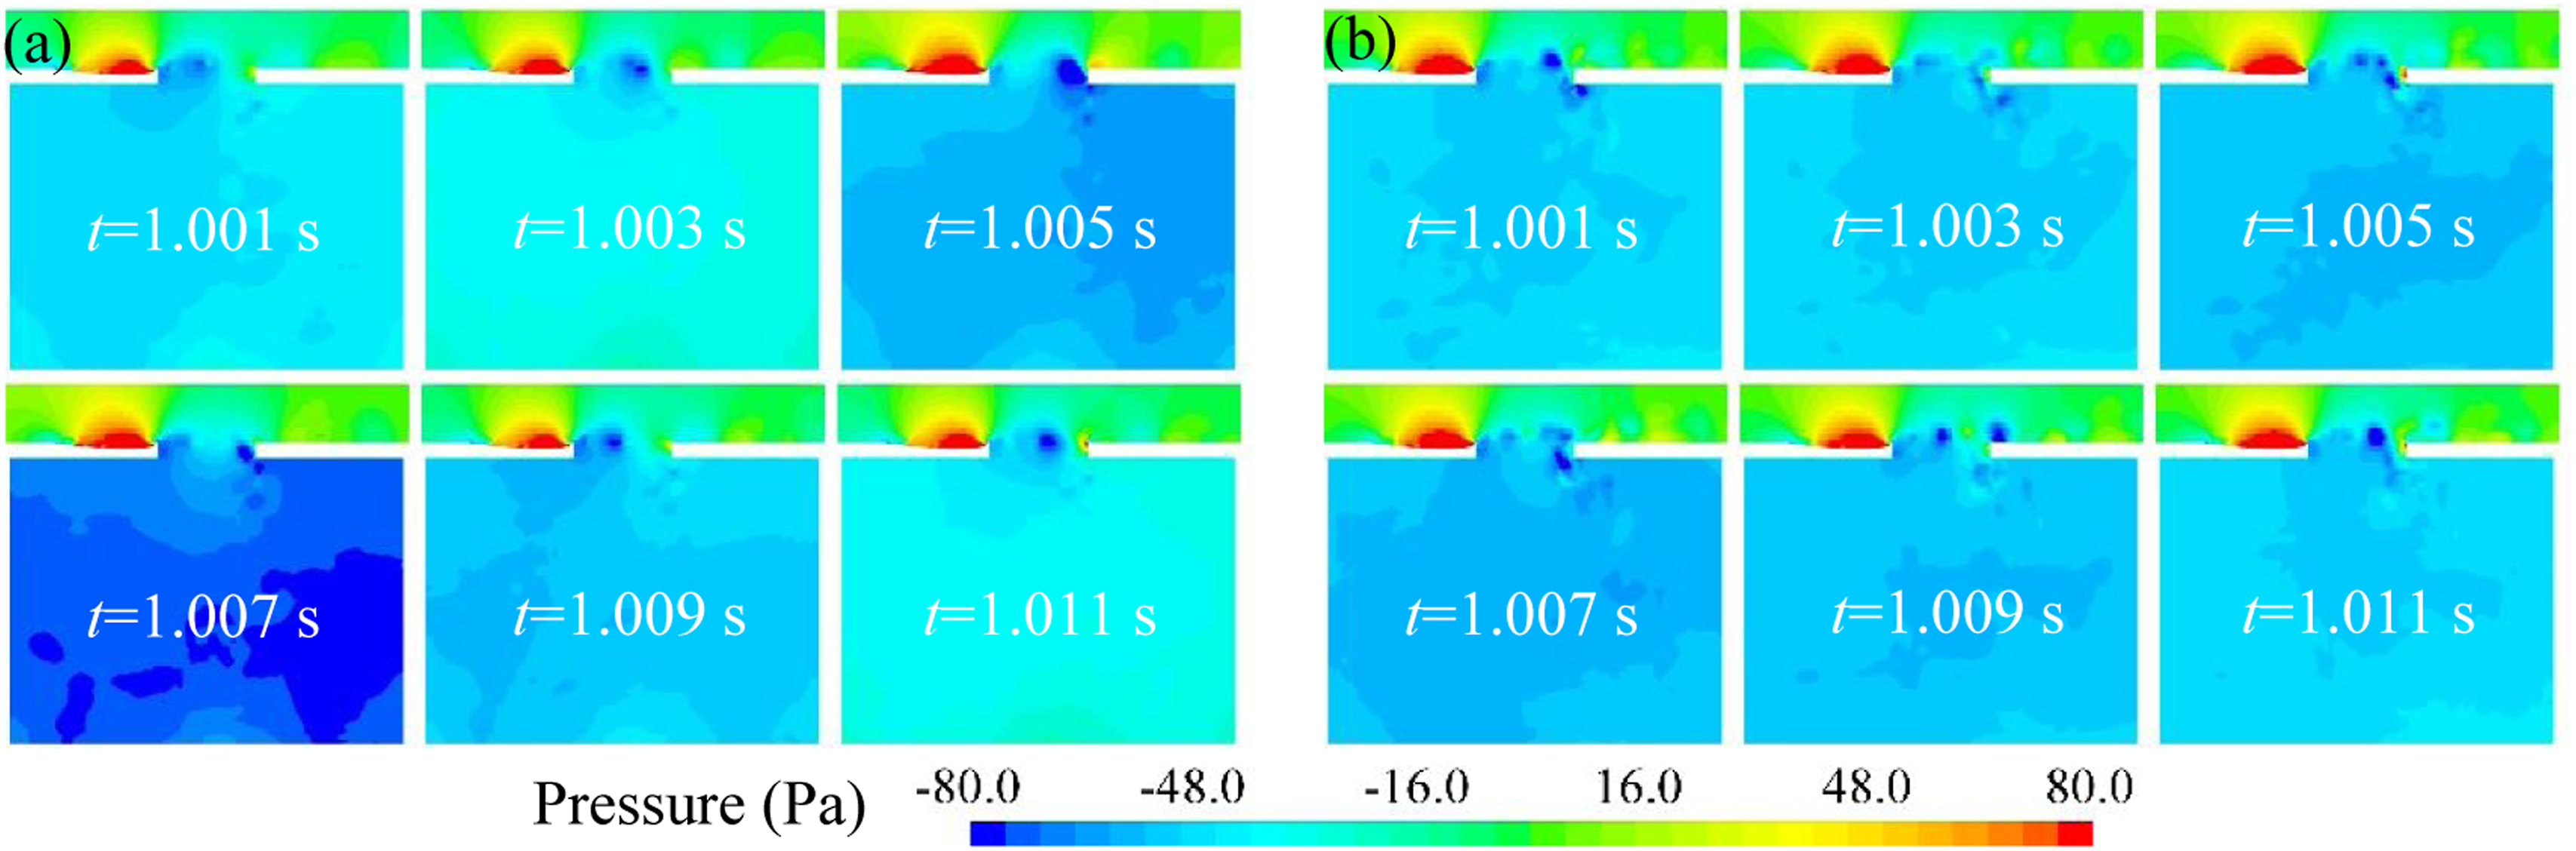
Q criteria
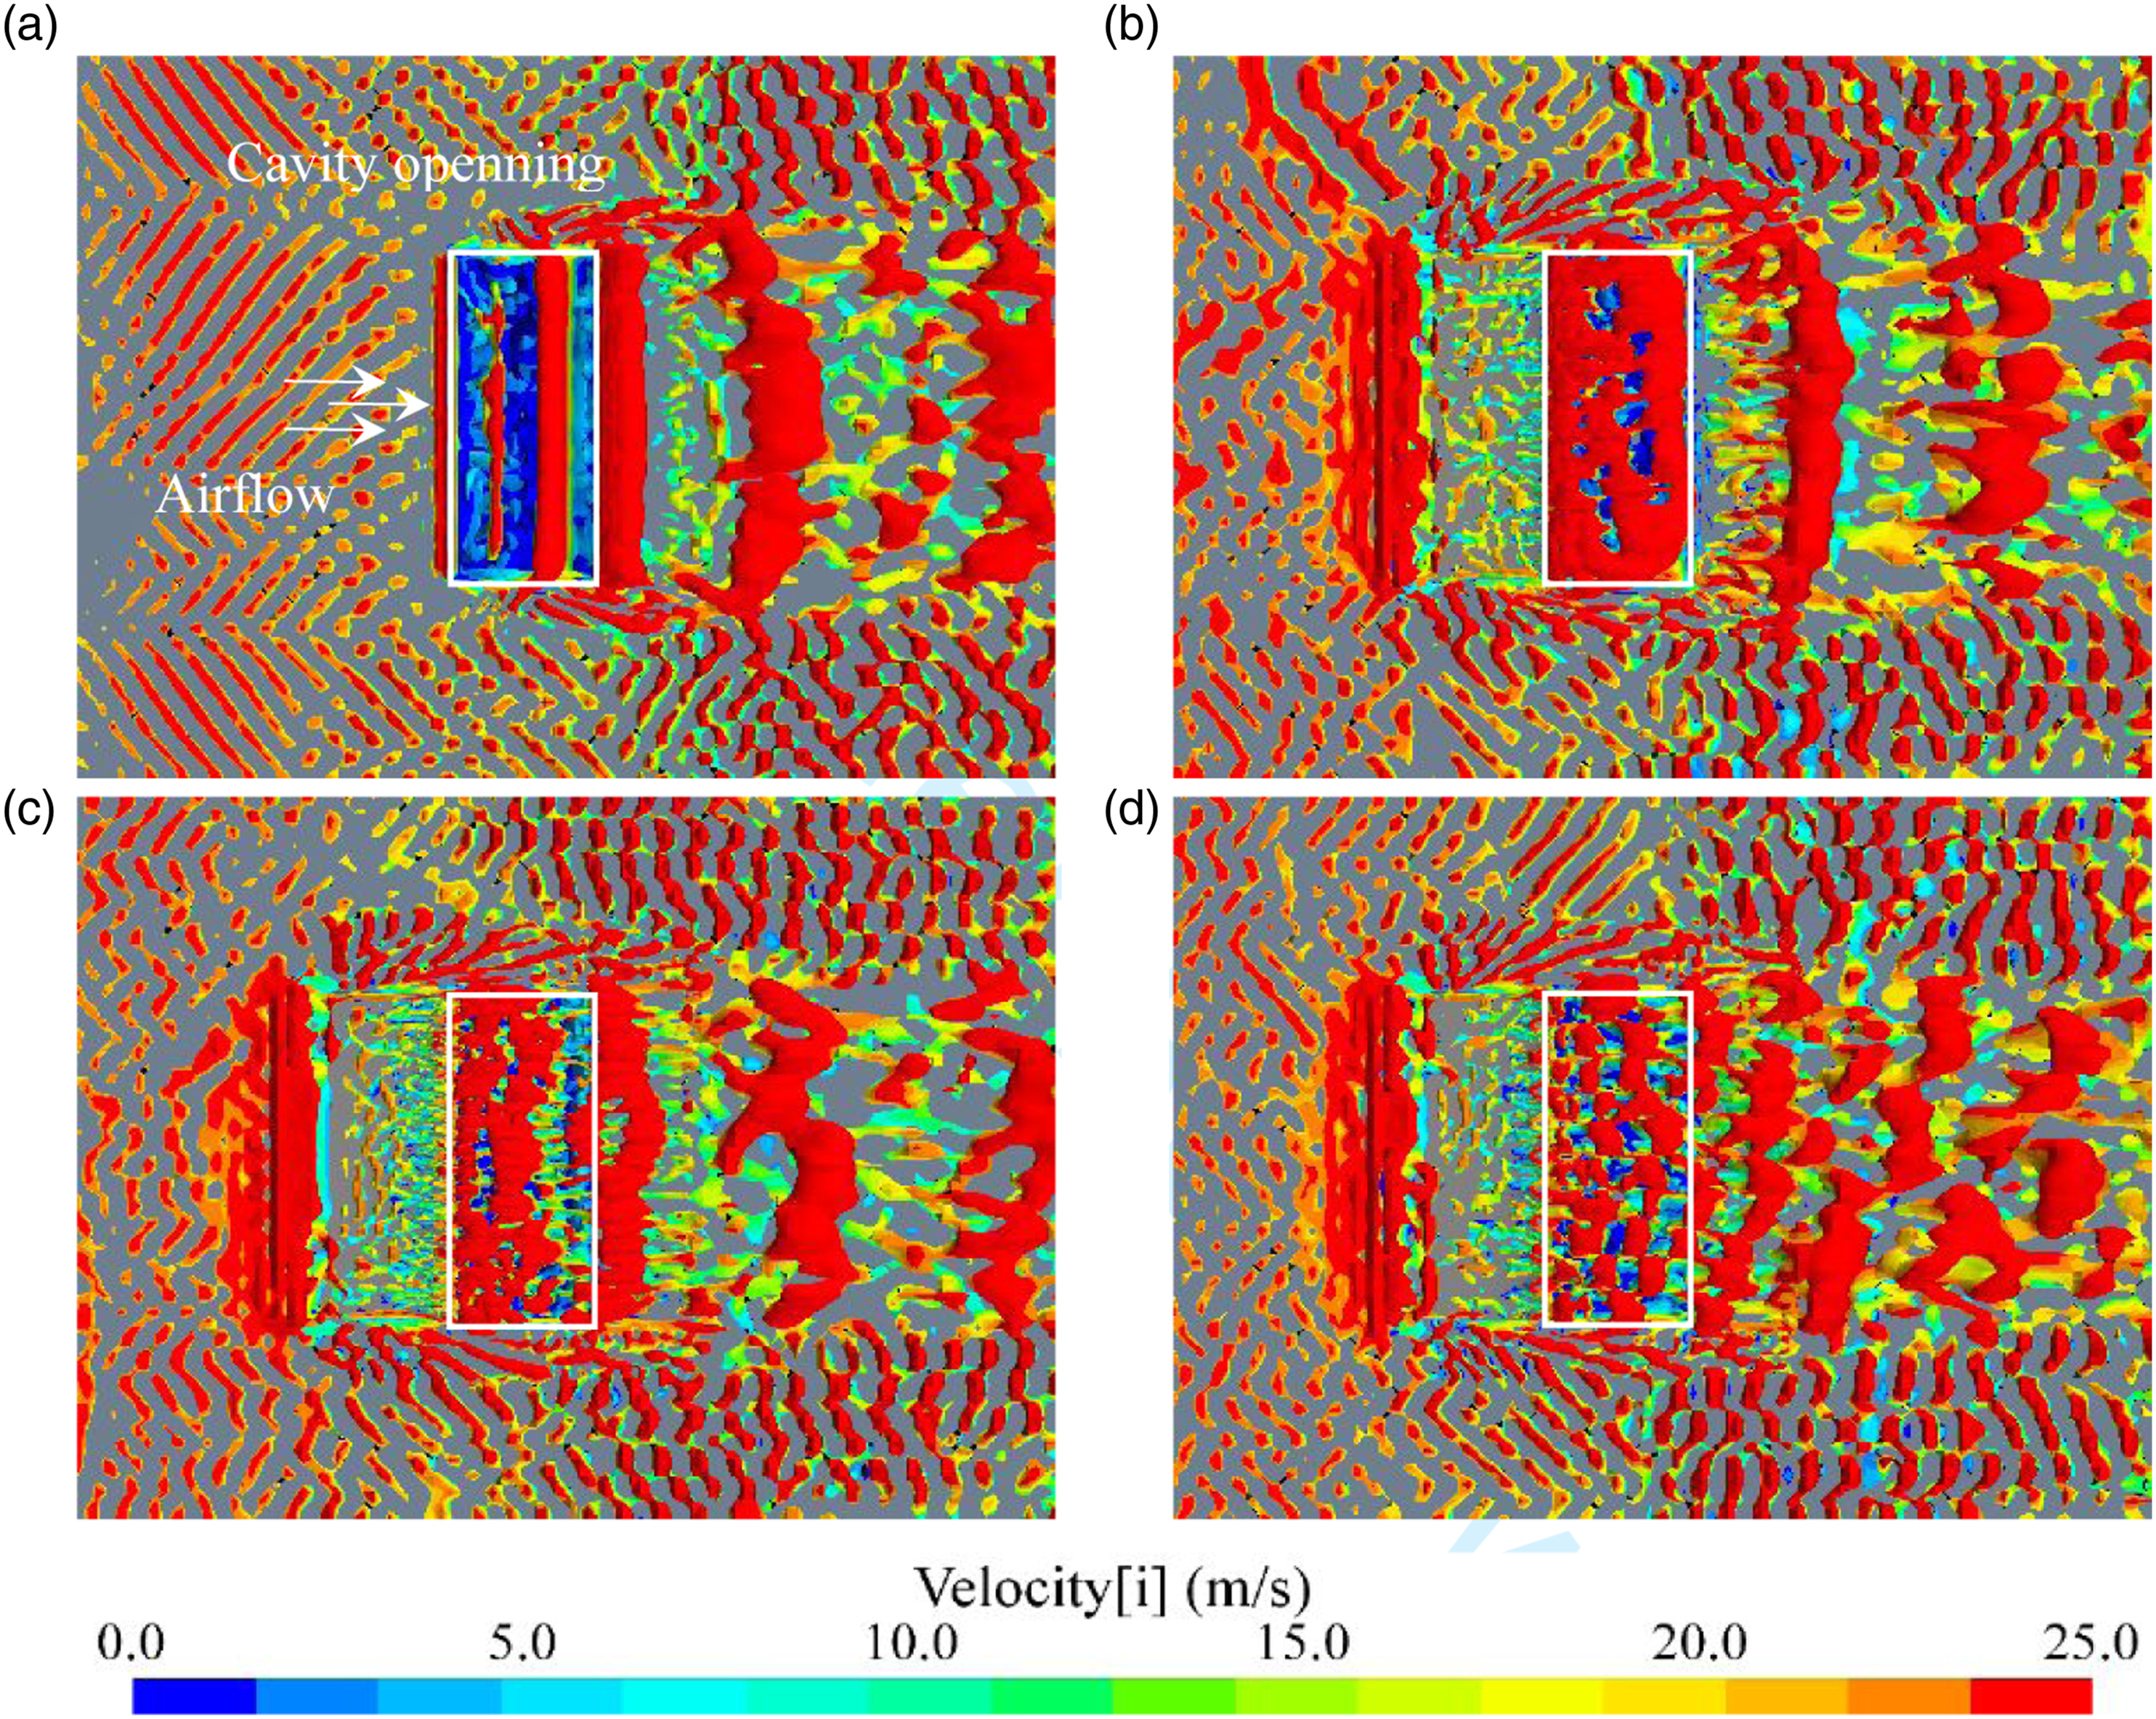
The wind buffeting noise in the cavity is related to the vortices.12,29 Thus, the Q criterion based on the LES model was used to better observe these vortices. The Q is defined as Vortex structure distribution near the cavity opening at Q = 5000 s−2: (a) Original scheme; (b) Scheme A; (c) Scheme B; (d) Scheme C.
Effect of wavelength
Peak values and corresponding frequencies in different schemes.
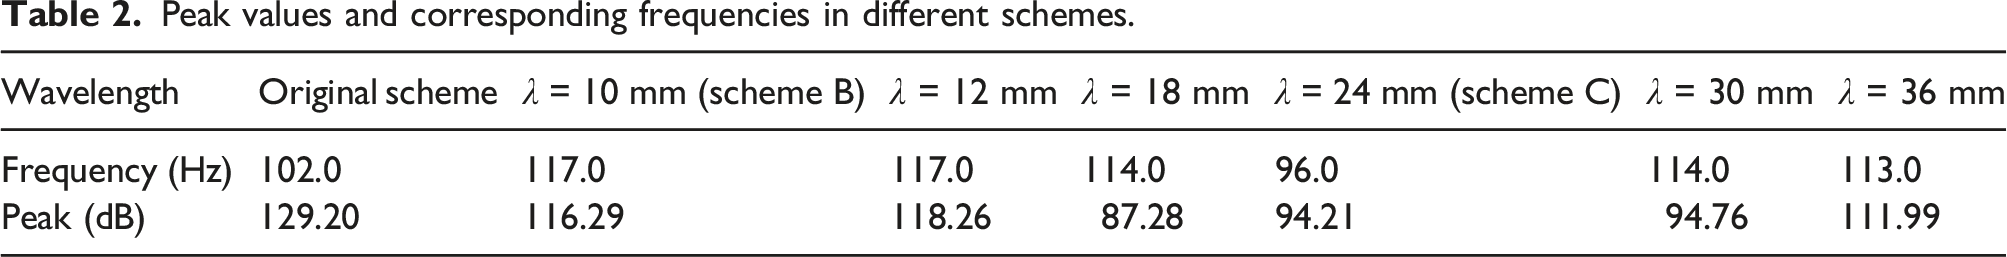
Figure 15 provides further insight into the impact of wavelength on Rpp. When the wavelength is 18 mm, 24 mm, 30 mm, or 36 mm, the spanwise pressure correlation is poor, with values close to zero. Additionally, these cases exhibit relatively weak pressure fluctuations in cavity. However, when the wavelength is either 10 mm or 12 mm, there is an improvement in the spanwise pressure correlation. This results in more pronounced pressure fluctuations compared to the other wavelengths. Spanwise pressure correlation at different wavelength schemes.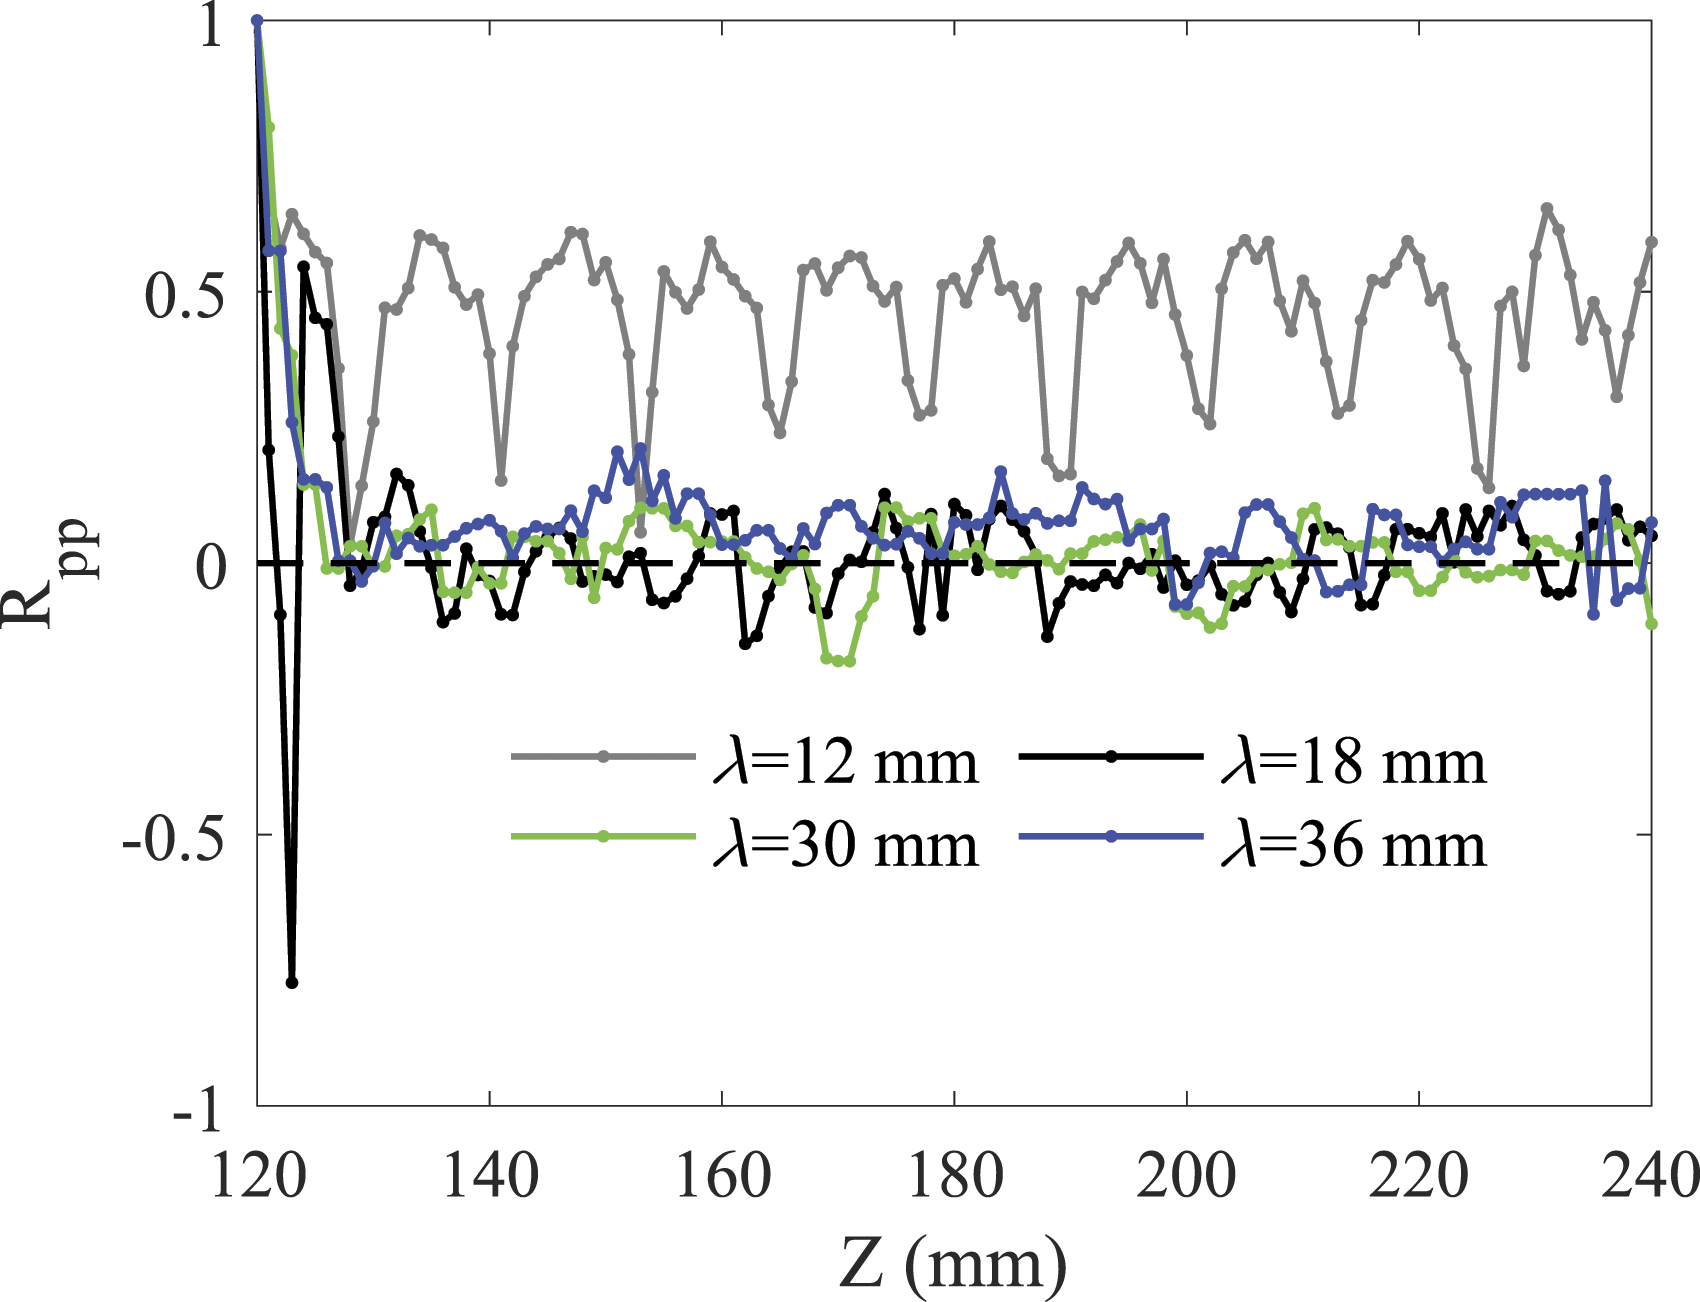
Boundary layer thickness.
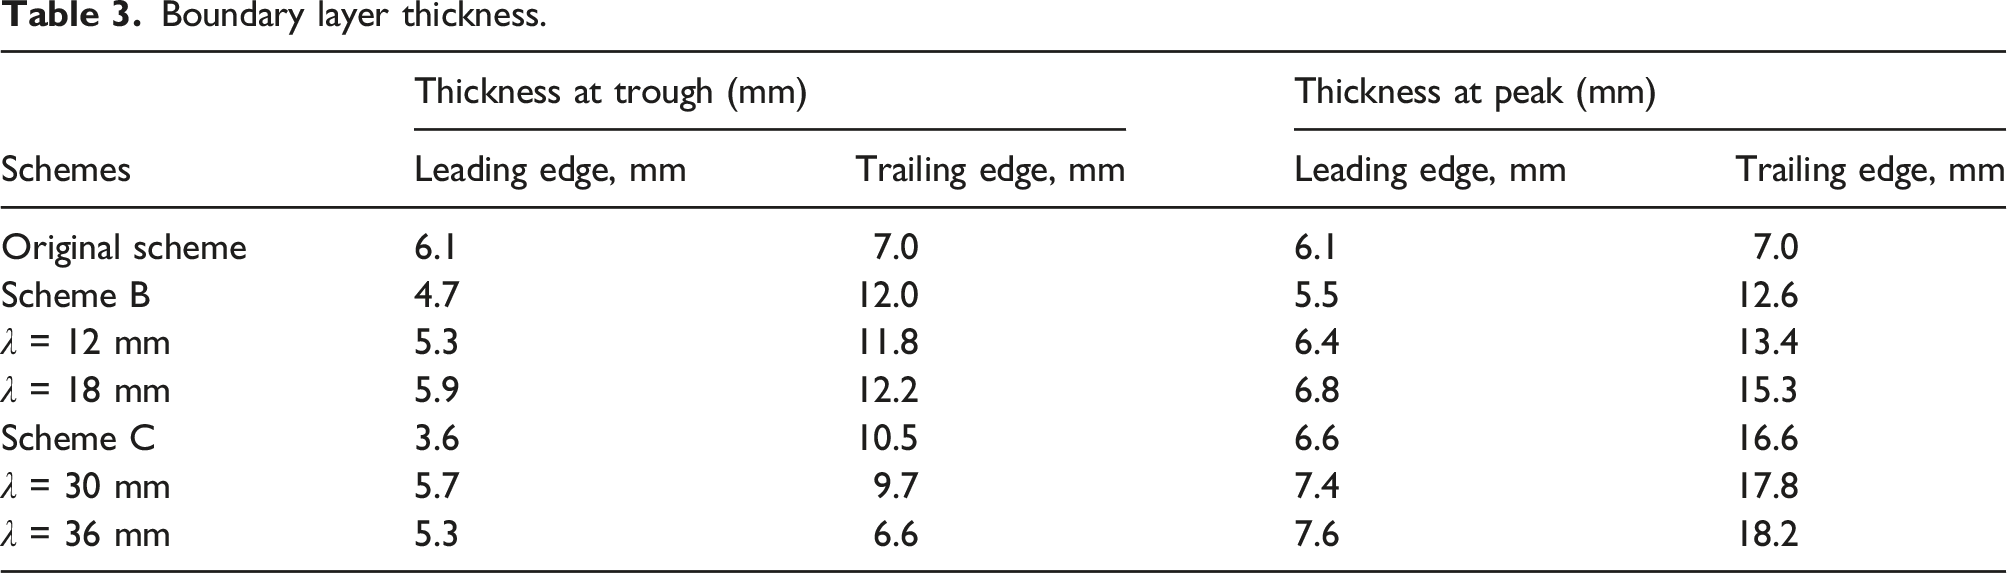
To further investigate the characteristics of the BLT at x = 106 mm, BLT of each scheme is shown in Figure 16. The results reveal that as the λ increases, there is a more noticeable fluctuation in the BLT. A comparison with Table 2 shows that at λ = 18 mm, 24 mm, 30 mm, and 36 mm, the BLT at the trailing edge fluctuates significantly in the spanwise direction, resulting in a better wind buffeting noise suppression effect than seen at λ = 10 mm and 12 mm. Nevertheless, since the BLT corresponding to the trough position decreases with λ, the suppression effect becomes worse with λ when λ = 18 mm, 24 mm, 30 mm, and 36 mm. Therefore, the significant fluctuation of BLT at the trailing edge is helpful in suppressing wind buffeting noise, but its suppression effect is also influenced by the BLT corresponding to the trough position. Although the findings shed light on the role of BLT fluctuation in suppressing wind buffeting noise, the connection between the fluctuations and the suppression effect requires further investigation. This topic is critical but beyond the scope of this paper. Boundary layer thickness distribution at x = 106 mm.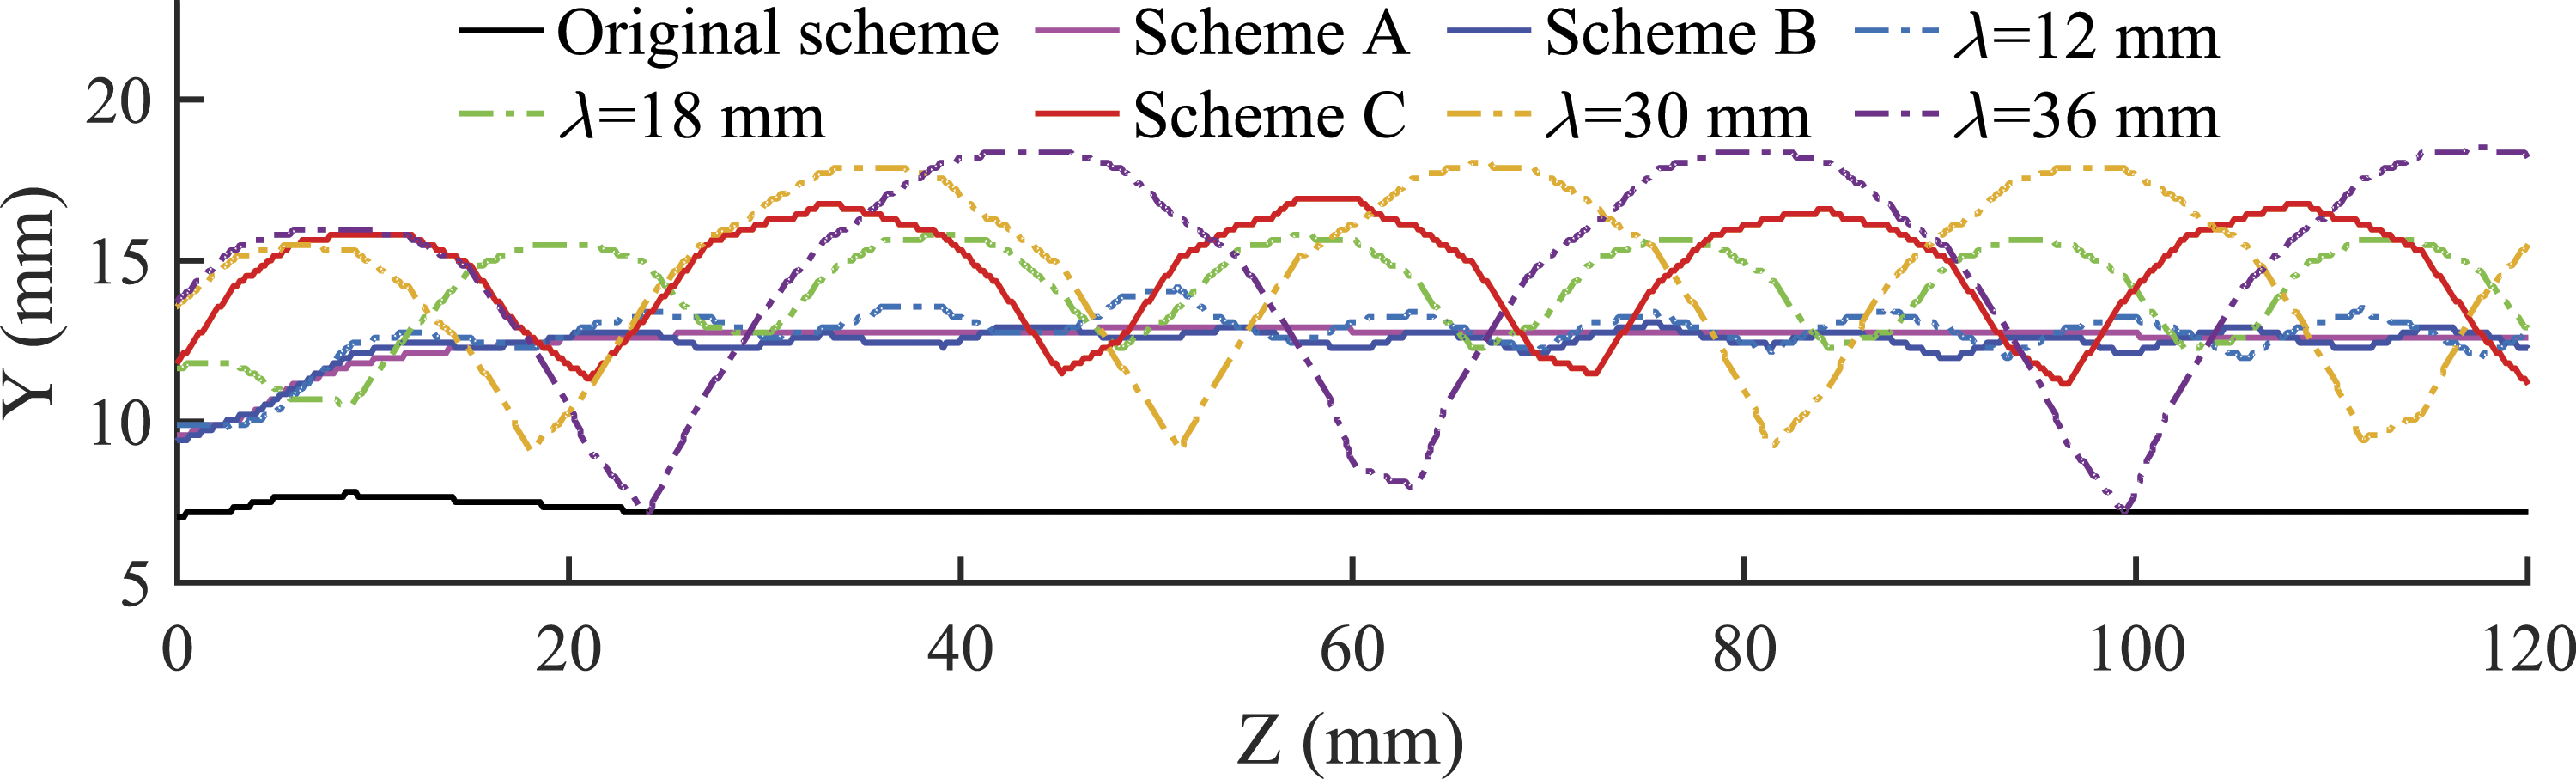
Conclusion
The bionic schemes inspired by owls can effectively reduce wind buffeting noise in cavities. Among these schemes, the sinusoidal scheme with a wavelength of λ = 0.24c (where c is the chord length) showed the highest suppression effect, followed by the sinusoidal scheme with λ = 0.1c, the smooth airfoil scheme, and the original scheme. The sinusoidal scheme with λ = 0.24c was found to suppress resonance energies of all orders by more than 21 dB across a wide range of speeds and frequencies.
In the self-sustained oscillation of the smooth airfoil scheme, the original scheme, the sinusoidal scheme with λ = 0.1c, and the sinusoidal scheme with λ = 0.24c, only the negative pressure core falls off from the leading edge into the cavity opening. In addition, the pressure cores that hit the trailing edge carry less energy due to the influence of the leading-edge serrations and surface ridges. Specifically, when λ = 0.24c, these pressure cores do not aggregate into a negative pressure core to hit the trailing edge. Instead, some of the pressure cores move downstream, and some enter the cavity. This helps to suppress pressure fluctuations in the cavity.
The BLT fluctuates in span due to the influence of the leading-edge serration and the surface ridge, which is favorable for suppressing wind buffeting noise. However, the suppression effect is not solely related to the fluctuation of BLT in the span at the trailing edge but is also influenced by the minimum BLT at this point. Therefore, if the BLT has a certain intensity fluctuation in the span (at which point its spanwise pressure correlation is close to zero), and the minimum BLT at the trailing edge is close to that of the smooth airfoil scheme, the noise suppression effect is significant.
Footnotes
Declaration of conflicting interests
The author(s) declared no potential conflicts of interest with respect to the research, authorship, and/or publication of this article.
Funding
The author(s) disclosed receipt of the following financial support for the research, authorship, and/or publication of this article: This research was supported by Guangxi Science and Technology Commission (No. 2019046-12).