
Abstract
Assuming that free school choice is one of the parameters contributing to segregation in the Belgian educational system, the government implemented decrees to alter school enrolment policies in order to regulate school choice. In this study, two statistical approaches (a ‘Lorenz’ index and a multilevel one) have been used to measure the evolution of segregation from 2006 to 2015 exploiting two databases (administrative student count and the Programme for International Student Assessment). The results do not provide any support to the claim that there has been a reduction in school segregation, and they stress that the decrees are inefficient concerning this objective.
Keywords
Introduction
In 2005, the government of the French-speaking community in Belgium published its ‘strategic contract for education’ (Ministère de la Communauté Française, 2005b). Results from research in the field of education, as well as the analyses based on the first rounds of the Programme for International Student Assessment (PISA), had highlighted that education in the Belgian French-speaking community was far from optimal and presented some weaknesses regarding the equality of opportunity for its students. Indeed, the system suffered from a structural illness: it was deeply marked by academic and socioeconomic segregation (Baye et al., 2005). The high level of segregation came, at least partly, from the organization of the educational system (Demeuse and Friant, 2010; Monseur and Demeuse, 2001). It particularly came from the organization of the school offer as a quasi-market, and from the differentiation of study paths that contributes to grouping together similar students according to their academic achievement and socioeconomic origin. In the ‘strategic contract for education’, segregation was suggested to be an intrinsic weakness of the educational system, influencing inequality in education, and its reduction was explicitly defined as an objective to be achieved. After a period of consultation, the text became the ‘contract for schools’ (Ministère de la Communauté Française, 2005a) where segregation was identified as one of the four major problems of education in the Belgian French-speaking community, and the slogan ‘No to ghetto schools’ was set as one of its ten top priorities. In fact, segregation was weakly conceptualized. Desegregation was both considered as a legitimate objective to pursue, as well as an instrument to improve education, especially with regards to the inequality of opportunity. In this context, neither academic nor socioeconomic segregation were explicitly distinguished, nor were the reasons to tackle either type of segregation.
Assuming that free school choice was one of the roots of school segregation in the Wallonia–Brussels Federation (FWB), the Government thought it was possible to reduce segregation by altering the school enrolment policy, and by adding desegregation as an objective to decrees regulating free school choice, specifically defining which students were entitled to a place in oversubscribed schools. Actually, two distinct objectives were then taken into account: provide a formal standardized enrolment procedure; and reduce socioeconomic segregation. The first objective was to really make free school choice possible, as it had become obvious that without clear enrolment rules, not everybody had the same opportunity to choose a particular school for their child. Indeed, there were observations of practices of school management selecting students on the basis of illegal criteria, or discouraging parents from disadvantaged backgrounds to enrol at the school. The second objective was to reduce socioeconomic segregation between schools.
While evaluating the attainment of the first goal does not, per se, require empirical data analysis (the existence of fair rules of enrolment is sufficient), the attainment of the second goal is far more complex and difficult to evaluate. Moreover, it was the evaluation of the second objective that dominated the public debate. In 2014, the administration evaluated (Ministère de la Communauté Française, 2014) the effect of the decree in the first year of secondary education, looking at desegregation, equity of the enrolment procedures, and the impact of changing schools during the first years of secondary school. Although it can be argued that it is too soon to evaluate long-term effects, and that a spectacular desegregation effect should not be expected immediately, the report of the administration concluded in a slight decrease of segregation of students from disadvantaged neighbourhoods 1 in the years after the promulgation of decrees regulating enrolment procedures. Apart from this report, we have to admit that there is still a lack of evaluation of the effects of the measures taken on desegregation.
Among the different dimensions of the policy that could be evaluated (Bouchard and Plante, 2002), we will focus on two dimensions that appeared as particularly relevant. The first one is coherence, that is, the extent to which the implemented means are susceptible to attain the objectives and the effectiveness of the decrees that is the degree of convergence between the objectives and the results (Bouchard and Plante, 2002). The coherence will be addressed through an analysis of the way segregation has its origin in the specific organization of the Belgian French-speaking educational system and especially in the combination of the organization of the school offer as a quasi-market, and the differentiation of study paths (mainly through tracking and grade repetition). This dimension reveals that the combination of two distinct objectives within this educational policy was particularly problematic (Cantillon 2009). It created confusion in the debates surrounding both the regulation of enrolment procedures and the reduction of segregation and it strongly defined, and still defines, the way segregation fits into the public debate. Concretely, we can regret such a partial handling of segregation which is expected to be unsuccessful although multiple roots of school segregation in the FWB were well identified, including both the quasi-market and the differentiation of the students’ chosen study paths.
The effectiveness is addressed through a quantitative measure of segregation and allows assessing whether segregation has decreased since the new rules for regulating school choices were put in place. As Gorard et al. (2003) have shown, there is no straightforward answer. According to the method used, there may be several biases that can lead to contradictory conclusions. It is therefore extremely important to confront the measurement of school segregation. Moreover, such a measure can, in practice, be quite a challenge regarding data. This is particularly true in the case of the Belgian French-speaking community, where an individual measure of social origin is unavailable. The challenge is, therefore, to proceed with the available data, and, thankfully, large-scale international surveys can offer an alternative and complementary data source to the local administrations’ data collection.
The Belgian French-speaking community
Since 1989, Belgium has three separate educational systems, reflecting the division of the country into three linguistic communities (the Dutch-speaking, French-speaking and German-speaking communities). Each linguistic community is responsible for education, but the Belgian educational systems still share similarities, not only because of a common history and geographical proximity, but also because some rules are written into the national constitution (e.g. that public education is free). Similarities also arise from the fact that the transfer of education to communities was accompanied by exceptions for which the federal authority retained control, such as fixing the ages for children in compulsory education, the minimum conditions for delivering a diploma, and the pension scheme for teachers. In this study, we focus on the French-speaking community, or FWB, which provides schooling for about 44% of the Belgian pupils in subsidized schools (Ministère de la Communauté Française, 2010).
The particular configuration of the French-speaking system, regarding segregation, can be seen in the light of two interrelated sets of rules. The first set of rules differentiate students’ study paths, as the system is characterized by important horizontal and vertical stratifications (important separations of students between different curricula in the same grade, as well as between shorter and longer paths of students having to repeat grades). The second set of rules corresponds to the assignment of students to schools depending, among other factors, on their chosen study paths.
Differentiating study paths
In the FWB, a pupil’s study path is defined as a pedagogical continuum with a three-stage common core curriculum, from the start of kindergarten to the second grade of secondary school. The first two grades of secondary education is the last stage of the common core curriculum and is then common to all pupils. At the end of the second year, all pupils have to present a compulsory curriculum-based standardized test that must be successfully passed to proceed onto the second stage of secondary education without any restrictions. Students who do not pass the test have to follow a supplementary grade before going on to the next one. Otherwise, there is the possibility of continuing directly, but only on a less demanding programme. However, some horizontal stratification is already present before. For example, special-needs education provides schooling in separated buildings for 4.7% and 5.2% of students in primary school and secondary school, respectively. Pupils who have not obtained their primary education diploma, by successfully passing the standardized test at the end of primary school, attend a two-year specialized track (5.8% to 7.3% of students).
Pupils can select their secondary programme at the beginning of the third grade of secondary school. From the third to the sixth grade of secondary school, 48% of students choose a vocational programme. Like in numerous educational systems, these tracks are organized into a hierarchy where the academic track is the reference framework for teachers (André, 2011) and students (Ferrara and Friant, 2014). Moreover, ability grouping between classes within tracks has also been practiced (Danhier et al., in press; Draelants et al., 2004).
Vertically, grade repetition is used extensively. Internationally, the Belgian French-speaking community appears to be one of the systems with the highest proportion of retained students in both primary (Martin et al., 2011) and secondary education (Organization for Economic Co-operation and Development, 2014a). Note that both programme selection and grade repetition have a cumulative effect, assigning unsuccessful students to specific places in the educational hierarchy, a few years behind those who stayed on the shorter, more demanding curriculum (about 60% of students have at least a one-year delay at the end of secondary education in the FWB) (Ministère de la Communauté Française, 2016).
Student enrolment
The second set of rules concerns student enrolment and the allocation of school places. As written in the Constitution (Belgian Constitution, article 24), education is free. This article ensures, on the one hand, that each individual or association can organize education, and on the other hand, that parents are free to choose their child’s school 2 . A specificity of the Belgian educational freedom concerns the subsidization of schools, which is based on the number of pupils at the school (El Berhoumi, 2013). In other words, free education means that it is defined as free of charge for parents until the end of compulsory education and that schools can expect public subsidization. This sort of hybrid institution, that tends to combine controls from both potential clients who can choose between schools and the public administration which subsidizes schools, has been defined as a quasi-market (Vandenberghe, 1996).
Researchers have shown how the school offer, as well as movement between schools, structures the position of schools in the local hierarchy (Delvaux and Joseph, 2006; Demeuse et al., 2007). In turn, the position in the local hierarchy determines the strategies that the school develops in order to ensure a sufficient population. Note that the low regulation of enrolments in more popular schools, and the little pressure these schools feel to respect the existing regulations, allow them to select their students, both on academic and socioeconomic bases. Following a consumerist logic (Maroy and Dupriez, 2000), parents choose the school that they think is best for their child. The understanding of the local hierarchy, as well as geographical proximity, reputation, composition, and the pedagogical offer of the school, strongly guide parents’ choices (Devleeshouwer and Rea, 2011). In this way, the quasi-market is defined as permitting the spatial expression of the aforementioned differentiation of study paths.
A visible consequence of this organization is a relative matching between students and schools. Studies have shown that, in the FWB, the organization of secondary education fosters several types of segregation between schools, resulting in the creation of both ‘ghetto’ and ‘sanctuary’ schools (Demeuse and Friant, 2010). Such segregation has to be seen as the results of educational structures, and cannot be reduced to translation of residential segregation in the field of education (Delvaux, 2003). Moreover, international comparison has highlighted that educational systems allowing parents to choose their children’s school tend to be more segregated (Dupriez and Dumay, 2011). In other words, school segregation can be seen, at least partly, as a result of rules organizing education.
Regulating school choice
In its ‘strategic contract for education (Ministère de la Communauté Française, 2005b), the government of the French-speaking community identified segregation as one of the four major problems of its education, and set the slogan ‘No to ghetto schools’ as one of its ten top priorities. Assuming that free school choice is one of the parameters contributing to segregation, the government thought it could be possible to reduce school segregation by altering the school enrolment policy with a decree regulating free school choice. In fact, the regulation of enrolment procedures began for the first year of secondary school in 2008–2009. A three-year period of turmoil followed, with the promulgation of a new decree each year. This was the consequence of unexpected conflicts between actors of civil society and political parties, as well as this not being well received by certain parents who felt their freedom of choice was compromised (see Ryelandt, 2013).
The first idea was to apply a ‘first-come, first-served’ principle. The schools had to keep a register of available places and requests for enrolment, keeping track of each request in order of arrival, starting from a date known to everyone. This ‘enrolment law’ produced spectacular effects in the media, analysed in depth by Delvaux and Maroy (2009). A ‘social mixing decree’ was applied in the following year, introducing, in the few highly popular schools in which the offer was exceeded by demand, some priority rules according to a socioeconomic index (SEI) and distance travelled. This version of the decree explicitly included desegregation as an objective. When priority rules could not decide between simultaneous demands, the place is assigned randomly. This idea of random drawing fuelled the feeling of injustice for some parents. Moreover, multiple registration strategies caused major problems and dramatically reduced the chances of satisfying parents’ preferences.
The enrolment procedure in application at the time of writing was set up in 2010. In order to correct the problems of the previous version, random drawing has been abandoned and enrolment management is centralized by a commission to avoid multiple registrations. Actually, the parents submit the registration form in their first preferred schools, including a list of all ordered preferred schools. In the oversubscribed schools, students are ordered according to a composite index, based on parents’ preferences (by asking them to rank several schools) as well as some geographical and pedagogical criteria. The first students in the ordered register are enrolled in the school. One-fifth of the available places are reserved for students from disadvantaged primary schools while the enrolment only depends on the order for the next three-fifths except for some specified priorities (for example, to students with a brother or a sister in the school). The last fifth of the available places is reserved for the administration that allocates them on the basis of a deferred acceptance algorithm aiming to maximally take account of the entire list of parents’ preferences. Currently, these procedures are still contested by some parents, but their application since the start of the school year 2010–2011 has been carried out without major problems.
Methodology
The effectiveness of the decrees is addressed through a quantitative measure of segregation. Like Delvaux (2005: 276), we define school segregation as the spatial separation of students endowed with characteristics which are valued differently by society. Let us briefly develop this definition further. Separation can take different forms. Massey and Denton (1988) proposed five dimensions to study residential segregation: evenness; exposure; concentration; centralization; and clustering. Although the other dimensions remain relevant to the study of school segregation, it is the issue of evenness which we address in this article because it is the one which has been mainly tackled in the French-speaking community.
Then, the differently valued characteristics can be of different kinds, translating into different kinds of segregation. From an equity point of view, it seems relevant to introduce characteristics which the individual cannot escape (Baye et al., 2005), such as ethnicity or socioeconomic background. Although these phenomena are closely linked, at the very least in Belgium, the French-speaking government chose to tackle the problem from the socioeconomic angle only. Such a choice is consistent with the French-speaking tradition that historically focuses its actions on the basis of socioeconomic background (Jacobs and Rea, 2005) and is not irrelevant as they can expect a (partial) reduction of ethnic segregation when socioeconomic segregation decreases. We will consequently restrict our study to socioeconomic segregation.
School evenness can be graphically represented by a Lorenz curve, that is, by plotting the cumulative school proportion of students with a specific characteristic (here the socioeconomically disadvantaged group) against the cumulative school proportion of students without this characteristic (the socioeconomically advantaged group). Such a graphical representation presents some advantages. As long as the distributions do not intersect, it allows a simple ranking without any a priori judgement, and without any loss of information. However, when the distributions cross each other, segregation curves no longer provide a unique ranking, and it is necessary to decide which situation is the most segregated (Allen and Vignoles, 2007; Hutchens, 2004). Moreover, because this approach is based on graphical comparisons, they become difficult when the number of curves increases.
In order to overcome such issues, several numerical indexes have been developed. Selecting an index requires defining what segregation is (Massey and Denton, 1988) and assumes a measurement theory (see Hutchens, 2004; James and Taeuber, 1985). Consequently, different theoretical bases will produce different rankings. On the contrary, some indexes with different theoretical backgrounds will produce very similar results and rankings (Massey and Denton, 1988; White, 1986). In other words, some choices of index will lead to different conclusions in terms of segregation evolution while others will not. Knowledge is then necessary to skilfully select an index, and the choice could be crucial. Moreover, the use of only one index could be insufficient to cover the complexity of segregation (Duncan and Duncan, 1955; Massey and Denton, 1988).
Without covering the wealth of literature on segregation indexes, we will briefly present, and take a critical look at, two indexes used in the Belgian debate about socioeconomic segregation between schools. The ‘strategic contract for education’ (Ministère de la Communauté Française, 2005b) defined concrete objectives regarding socioeconomic segregation and aims to ‘reduce the variance share of student performance attributable to the school from 56% to 40%; reduce the level of school segregation to less than 40%’. Let us, however, note some ambiguity. While the objectives of the ‘strategic contract for education’ explicitly concern both academic and socioeconomic segregation, their numerical value is only based on a measure of student performance, illustrating a lack of data that allows us to evaluate the objective of the decrees in a relevant manner. In fact, these objectives directly refer to two specific indexes: the variance partition component (VPC) and the Gorard’s segregation index (GS) that we will define in this section. Among the multitude of indexes, these indexes are not necessarily the best ones but provide a criterion to evaluate the effect of the decrees. Moreover, regarding the context of budgetary constraints, and the inexistence of a central statistical service at the administration, there is little chance that the government could deploy new tools to measure the decrees’ effects. In other words, these indexes will be used to evaluate whether the decrees have reached their objective regarding desegregation. It is for this reason that we will discuss such indexes, and present them in such a way that their analysis can be relevant in the public debate in the FWB.
Segregation indexes on dichotomous variables
The first index requires dichotomous variables and is derived from the well-known ‘dissimilarity index’ (D). We will present the latter in order to highlight the specificities of this first index. D has been largely used to measure evenness. This index can be computed as follows
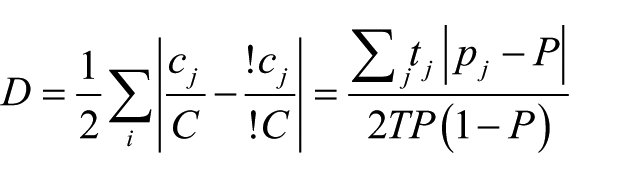
where pj and ci are respectively the proportion and population of disadvantaged students in the school j respectively, whilst tj is the total enrolment at this school. Here P and C are the aforementioned overall proportion and population, whilst T is the total number of students. The ‘!’ has to be read as ‘not’ and refers to the complementary group of advantaged students. In the classic review by Duncan and Duncan (1955: 211), we read that graphically, D is the ‘maximum vertical distance between the diagonal and the curve’ and that it can be interpreted as the proportion of disadvantaged students who should change schools to reach an even distribution of these students among schools. Strictly speaking, it is the proportion of students to be moved without replacement (Cortese et al., 1976). A look at the formula tells us that the weighted sum of the school deviations from the overall composition is divided by its maximum, and, consequently, that the index varies between 0 and 1 (for maximum segregation). Furthermore, it tells us that the deviation from the overall proportion is linear, that is, that there is no additional payoff for bigger departures from the overall proportion (Zoloth, 1976).
Two criticisms of this index are worth noting. Firstly, D does not fully comply with the principle of transfer (James and Taeuber, 1985). While an exchange of students between schools with composition on either side of the overall proportion of disadvantaged students affects the index, an exchange between schools on the same side of the overall proportion does not. Secondly, Gorard and Taylor (2002) described the dissimilarity index as having a ‘weak’ composition invariance. In fact, when the number of disadvantaged students doubles in each school, D remains constant if the number of advantaged students remains the same. On the other hand, if both the numbers of advantaged and disadvantaged students change, D varies, even though the repartition of disadvantaged students remains the same. According to the authors, such a feature is problematic when advantaged students become disadvantaged.
Gorard and Taylor (2002) suggested using another old index which has the advantage of being strongly compositionally invariant: the GS. It is equivalent to the Delta index (Duncan, 1961), with the size of geographical areas being replaced by the population size of schools. According to Massey and Denton (1988), it measures the concentration dimension of segregation. It has been regularly used to measure segregation in the French-speaking community (Baye et al., 2005; Demeuse and Friant, 2010). This index is computed by means of the following formula
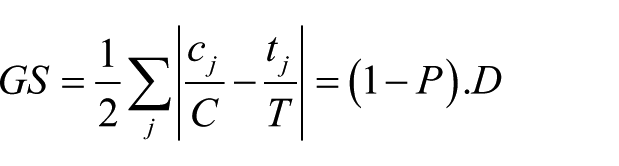
As can be seen in formula 2, this index can be derived from the dissimilarity index. Since the 1-P term is absent from the latter formula, the index does not vary if the repartition of disadvantaged students remains constant and is consequently said to be strongly compositionally invariant. Moreover, it can be interpreted as the proportion of disadvantaged students who should be switched to reach an even distribution of them throughout schools. In fact, this exchange proportion was one of the derived indicators used by Cortese et al. (1976) to help interpret the dissimilarity index. Nevertheless, the index is no longer bound but varies from 0 to 1-P (Allen and Vignoles, 2007). Finally, it is an asymmetric index: its value differs for disadvantaged students and for advantaged ones. In 2014, another index (MS) proposed by Cortese et al. (1976) to help interpret the dissimilarity index was used by the administration to evaluate the evolution of segregation (Ministère de la Communauté Française, 2014). The index, computed by multiplying D by 2P(1-P) or GS by 2P, measures the proportion of students to switch to students from the complementary socioeconomic group.
Because the GS has been used in the ‘strategic contract for education’ and because the D index (or the MS index) can be easily computed from the GS one, we provide results for the GS only as this index was used to define an objective to reach regarding segregation (Ministère de la Communauté Française, 2005b). Because dichotomized variables are needed to compute the segregation index, a choice is required. We started by exploring the consequences of threshold choices. In the Annexe 2, we show that different thresholds produce different values for the GS. In order to reflect this variability, two indicators will be used: one with disadvantaged students arbitrarily defined as being the 15% of students with the lowest socioeconomic background (GS-15); and another at the 25% threshold (GS-25).
VPC
Another approach to measure segregation is provided by variance partitioning and multilevel techniques (White, 1986; Willms and Paterson, 1995). In multilevel analysis, it is usual to begin with the intercept-only (or unconditional) model to observe the way the variance is distributed at the specified levels. Such a model can be expressed by the following equation
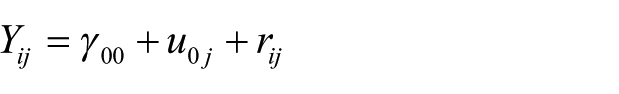
where Yij is the characteristic of interest (possibly continuous), γ00 is the grand mean of students’ SEI, υ0j the school deviation from the grand mean and rij the individual deviation from the school mean. It allows us to compute the VPC, equally called intraclass correlation
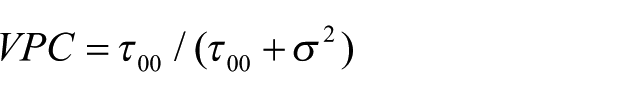
where
Data and socioeconomic indicators
We have two sources of data at our disposal to measure socioeconomic segregation in secondary schools in the French-speaking community of Belgium: administrative records; and an international survey. In order to delimit an equally identifiable sub-population in both sources, we chose to restrict our analysis to 15-year-old students enrolled in regular full-time secondary schools, 50% of which are in the fourth grade and 38% of which are in the third grade 3 . Given that the successive decrees regulating school choices are only implemented in the first grade of secondary school, such a population could be inappropriate for detecting any changes. Nevertheless, we can expect that the regulation at the beginning of secondary school could have some effect at a later step of the student’s study path, although we are only able to measure short-term effects. Firstly, we can expect that there has been a certain change since 2011–2012, when the first after-decree cohort turned 15. Indeed, there may have already been a change since 2010–2011 for students who had repeated a grade in primary education and were therefore older in the first grade (61% of students are 12 years old in the first grade, and 25% are 13 years old). However, if the mechanisms that we presented above (differentiate students’ study paths and assignment of students to schools) can have an effect between the first grade and the fourth grade of secondary school, the effect of the decrees could be limited to the grade where they regulate the school choices. Secondly, general changes of the parents’ reference framework in choosing schools have been observed as they are seeking less for a school with a singular identity matching the specificities of their child, but have developed new strategies to warrant obtaining at least one of the preferred schools and avoid the undesired ones (Deceuninck and Draelants, 2016). Such changes could have an effect at any stage of the study path when parents must choose a school.
Local administrative data
Since the 2004–2005 academic year, the administration has kept a set of exhaustive student data, collected every year on 15 January. This database, called ‘student count’, is used for distributing funding between the Belgian communities, the management of the French-speaking education, and statistics. Its access is restricted, because of privacy concerns, but researchers can be allowed to use it for specific projects and for a limited time. It is important to note that the student count database was initially created for management, not statistics or analysis, and allows users to know, roughly, where each student is in the educational system. While its uses have expanded over the years, the number of variables has remained limited. For this study, we use successive student counts from 2005–2006 to 2014–2015.
Strictly speaking, the student count does not include any individual socioeconomic variables. Of course, there is a SEI, but this index is an aggregated measurement. For determining the schools that will benefit from positive discrimination on the basis of their population, rather than the zones where they are located, a comprehensive SEI was initially developed for each Belgian statistical sector 4 . This was done on the basis of 12, and then 11, variables, taking into account both the requirements imposed by the decree of 30 June 1998 and the scientific literature that finds those variables to be reliable indicators of academic and/or social success (see Demeuse, 2002). This factor was developed to ‘cover the complexity of the socioeconomic reality of sectors’ (Demeuse, 2002: 229) and presently covers the following dimensions: income; qualifications; living conditions; occupation; and employment. Once the sector indexes are computed, each student receives the value of his/her sector of residence. This index is a metric variable, normally distributed, that varies between - 3.5 and + 3.5. It is recalculated every three years on the basis of the latest statistical data available.
An individual SEI created from pupils’ data was rejected by the legislator for at least two reasons (Demeuse, 2002). The first is related to respecting the private life of the pupils and their parents, because the law of 8 December 1992 restricts the individual collection of information about the characteristics of the family environment, and because educational actors are particularly hesitant about putting information about pupils’ socioeconomic background on record. The second reason is related to the fact that data entry for this type of data is expensive and relatively unreliable. The aggregated approach was selected on the basis of the results of earlier scientific studies (Demeuse, 2002; Ross, 1983), which show that an indirect indicator of the socioeconomic status ‘predicts pupils’ educational difficulties as well as the variables collected directly from families’ (Demeuse, 2002).
Such a procedure entails some limits. Firstly, there is a problem of data availability for the sector index computation. For the last student count, some variables were quite out of date (the oldest one dates back to 2001), some were only available at the widest administrative unit – the municipality – and some were not available for sectors with a low population density to ensure privacy protection. Secondly, due to legal requirements, some variables that could be weakly correlated with the factor had to be kept in the model. Such a choice could create a validity issue. Thirdly, the use of data at the sector level introduces a bias. Strictly speaking, in the case of perfect socioeconomic homogeneity within the sectors, no bias would be introduced. Nevertheless, because sectors include a more or less heterogeneous population, the variance of this socioeconomic variable is artificially reduced (Delvaux, 2003). Moreover, students from homogeneous sectors will be better represented by the index than students from heterogeneous ones.
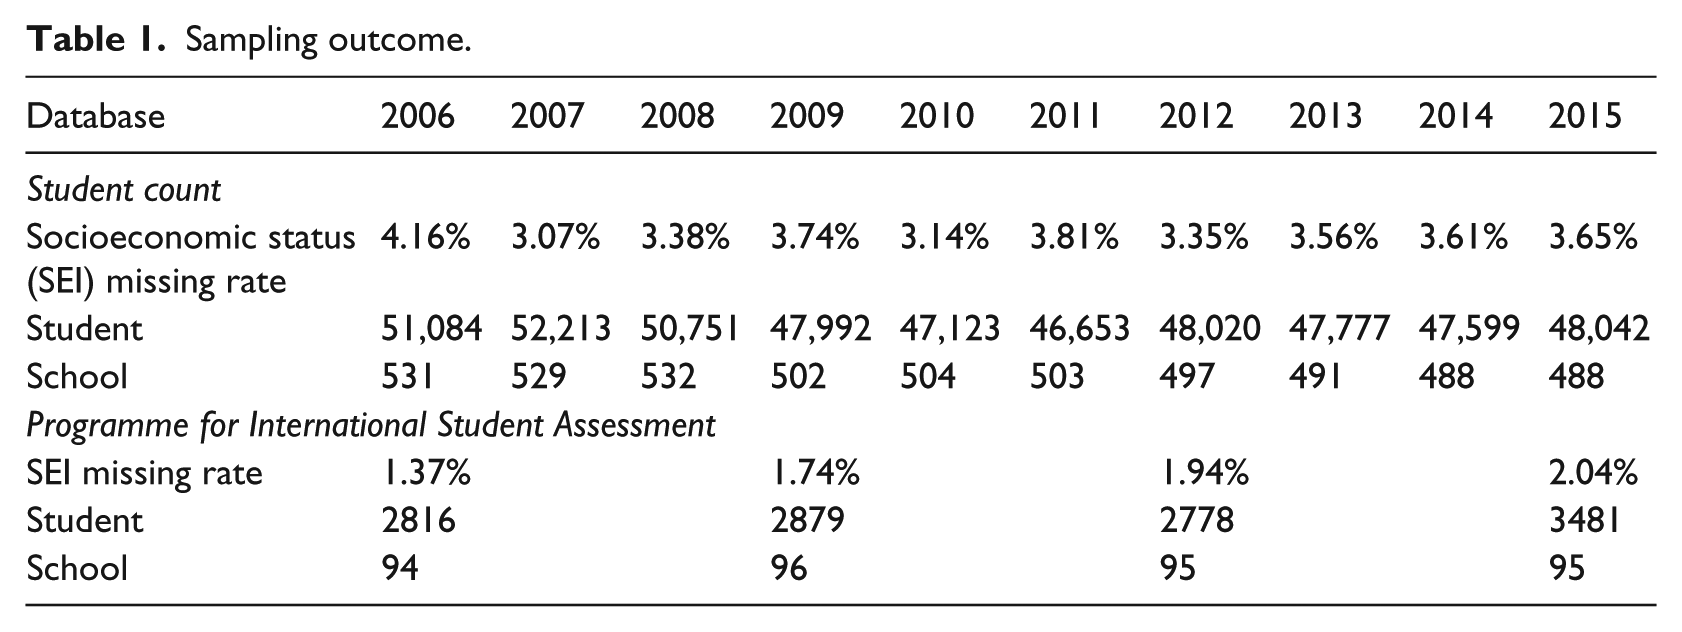
Finally, the index has a number of missing values due to missing indexes in some sectors, and errors in the process of automatic address recognition. As shown in Table 1, the proportions of missing data for the SEI variable vary from 3.14% to 4.16%. Due to the limited proportions of missing data, listwise deletion was used in order to make the analysis simpler without introducing too much bias (Graham, 2009). Moreover, preliminary analysis showed that the proportion of missing values was not linked with the socioeconomic composition of the school frequented by the student. Our final sub-populations are presented in Table 1.
Sampling outcome.
PISA
The PISA is a research project, led by the Organization for Economic Co-operation and Development (OECD), which aims to assess the students’ ability ‘to use their knowledge and skills to meet real-life challenges’ (Organization for Economic Co-operation and Development, 2012: 22). This large-scale survey has been conducted every three years since 2000. The most recent edition for which data are available, was done in 2015, and it specifically concerns scientific skills. There were seventy-two participating countries, representing approximately 540,000 assessed 15-year-old students (grade 7 or higher).
It is possible to identify the two Belgian communities in the public database. For our purpose, we only selected the subsample for the French-speaking community in the PISA 2006, 2009, 2012 and 2015 files. The sampling design is a two-stage stratified one. Schools 5 were sampled according to their size, but were first separated between explicit strata (form of education or public/private dichotomy) and ordered by implicit strata (retention rate, for example). Students were randomly sampled in selected schools to obtain 35 to 40 respondents per school, depending on the PISA round (or fewer if there were not enough valid 15-year-old students) (Organization for Economic Co-operation and Development, 2009, 2012, 2014b, 2017).
The PISA provides an individual socioeconomic variable. This statistical construct is called the index of economic, social and cultural status. It synthesizes information from three sources: the level of parental occupation; the highest level of parental education; and the number and types of properties owned. The Organization for Economic Co-operation and Development (2009, 2012, 2014b, 2017) reports 0.68, 0.67 and 0.69 reliability scores (standardized Cronbach’s alpha computed with weighted samples) for Belgium in 2006, 2009 and 2012. Some slight modifications have been introduced into the index computation in order to make them comparable across cycles.
During the PISA process, data can be excluded or missed at different steps. Firstly, the OECD provides exclusion rules to take out some schools and students. Secondly, it is possible that some schools and students do not participate because they refuse, or are absent at the time of testing. Unweighted school participation rates (before and after replacement) are consequently computed. Let us note that only schools with at least 25% of respondents are included in the PISA data, but this cannot be distinguished through lack of information about the school response rate. Finally, some students fail to respond to some items in the questionnaire. Due to the limited proportions of missing data (1.37% to 2.04%) regarding the data used in this analysis, listwise deletion was used. Our final samples are presented in Table 1.
With the PISA, confidence intervals (CIs) need to be computed to summarize the uncertainty linked to the indexes used. While replicate weights provide a straightforward method to compute the intervals for the GS, this is more complex for the VPC. Bootstrapping was used to compute them, and the technical discussion can be found in the annexe 1. All the analyses were performed in the R environment. Multilevel modelling was run with the R2MLwiN package (Zhang et al., 2012).
Results
Figure 1 presents the segregation indexes (GS-15, GS-25 and the VPC) from 2006 to 2015 from both databases. The first obvious finding is that indexes computed on one database are significantly different from those computed on the other. The values for segregation indexes based on the student count do not even fall into the CI of those based on the PISA. Computing segregation with the aggregated measurement of SEI at the sector level seems to systematically overestimate 6 the individual level of segregation computed in the PISA. Consequently, conclusions about the level of segregation observable in the schools of the French-speaking community will drastically change depending on the database being used. Let us have a look at the GS-25 in 2015; for example, according to the student count, 37.9% of the students should change schools to reach an even socioeconomic distribution of students between schools, while, according to the PISA, only 30.2% (95% CI: 26.7%, 33.7%) would have to change schools. If we observe the VPC in 2015, the overestimation is bigger, with it being 38.5% in the student count against 28.2% in the PISA (95% CI: 25.3, 32.0).
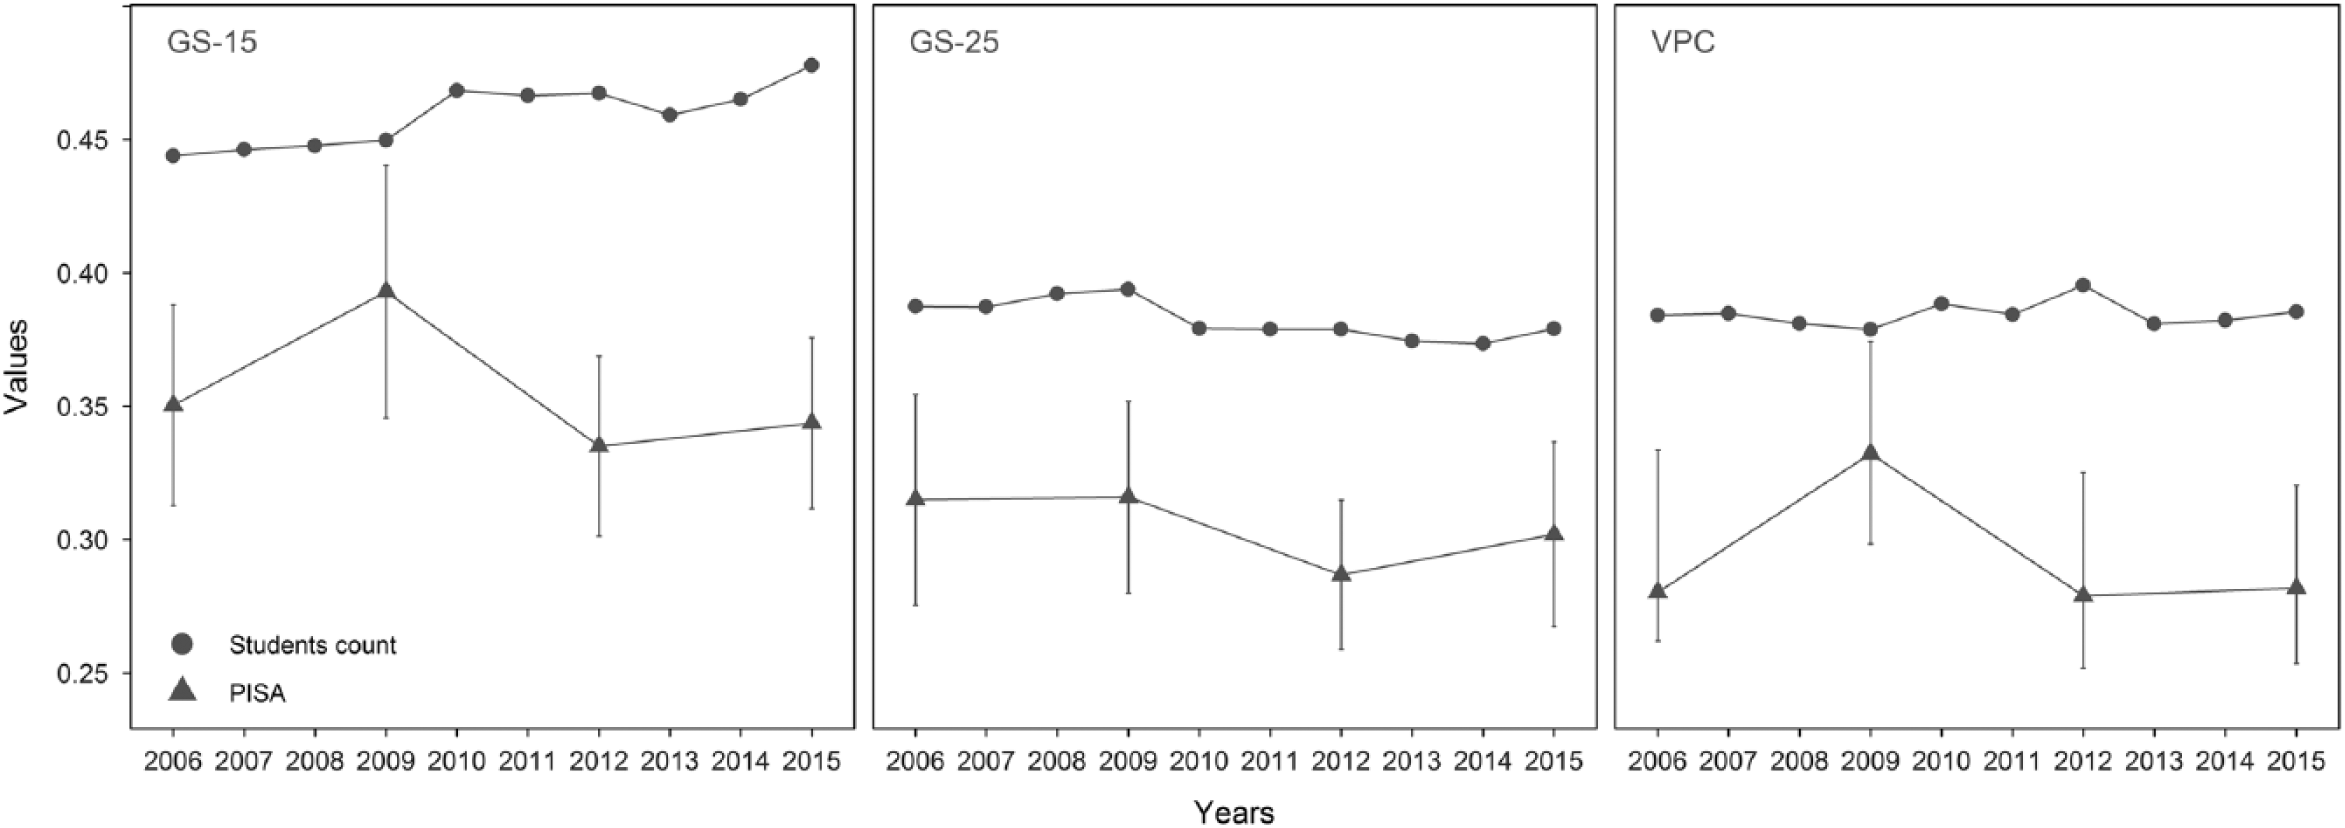
Segregation indexes.
Although the databases disagree regarding the level of segregation, its evolution can present similar patterns. Concerning the GS indexes on the student count, we have shown that they can evolve differently depending on the chosen threshold. Between 2009 and 2015, the GS-15 index showed a slight increase (+6.2%) while the GS-25 decreased slightly (-3.8%). However, the shock in 2010 is puzzling, and is difficult to attribute to the decrees. In fact, we only expected to see the first changes for 15-year-old students from 2011 or 2012, namely, when the first after-decree cohort reached 15 years of age. Nevertheless, segregation decreased as early as 2010, but not after. Different hypotheses can be proposed.
Firstly, the media coverage given to social diversity issues may have had an effect on cohorts that were not concerned by the decree. Moreover, the new bureaucratic procedure has dramatically changed the perceptions and practices of parents, who have developed new strategies to find a suitable school (Deceuninck and Draelants, 2016). Such changes in the perceptions and practices of parents could exceed the context of the first grade in secondary school. Although such an effect may have occurred, the opposite evolution of both GS indexes, and the fact that this change was limited to 2010, means that this is not a satisfactory explanation.
Secondly, changes regarding the number of units, particularly the number of schools, could have had some effect on the evolution of the index. In fact, we expect a decrease in segregation due to the decrease in the number of schools. Although, the index has the propriety of ‘organizational equivalence’ that states that the index is unaffected by fusions or scissions of schools when the composition of schools remains the same (Allen and Vignoles, 2007), the departure from a perfect split could cause some increase in the index. However, the GS did not change between 2008 and 2009, although this is the period with the highest decrease in the number of schools.
Finally, a new computation of the SEI occurred in the data in 2010. Computation of the SEI is supposed to be updated every three years (which was the case in 2010, but not in the next years). The change in the segregation index is contemporary with the inclusion of the new SEI in the database that slightly modifies the ranking of sectors according to their socioeconomic level. Density diagrams (not shown here) reveal that, from 2010, there were more schools with a very low socioeconomic level, but fewer schools with a slightly high level. Without testing the invariance of the SEI construct, the change could actually be artificial.
As the computation did not change after 2010, we can use this year as the baseline in the student count. Between 2010 and 2015, the GS-15 index showed a slight increase (+2.1%) while the GS-25 remained stable. This pattern suggests that segregation remains stable except when we focus on the most disadvantaged students for which the segregation has slightly increased.
The PISA does not contradict this conclusion. Both GS indexes on the PISA present non-significant declines between 2006 and 2015 (even the highest decrease of 12.3% of the GS-15 between 2009 and 2012 is nonsignificant). Moreover, due to the 3-year gap between successive rounds, it would be impossible to see the starting point of a decrease.
The VPC index in the student count data set shows a relative increase between 2009 and 2012 (it gained 4.2%, indicating an increase in segregation during this period). In fact, the increase of the index is mainly guided by the increase of the school variance due to the change of index in 2010. Comparing 2010 and 2015, the longest period with the same SEI in the student count, we have to admit that segregation remained at the same level.
In the PISA, after an increase before 2009, the VPC decreased in 2012 (18.8% in relative terms), but the CI largely overlaps. Again, this pattern is similar to what we can observe with GS-15. Nevertheless, this could reflect sampling process or some instability in the computation, rather than real changes. The use of weights at the second level could explain this instability. However, a replication without weights shows the same pattern, although the changes from one year to another are more limited. Next, the decomposition of the VPC between its components shows that the decrease in 2012 was mainly caused by a major decrease in the school variance. Some outliers in 2009 could explain this increase, but single ‘school’ outliers have already been modelled, and screening of residual plots does not show any critical problem. Finally, considering the measures of segregation in the four PISA rounds, we cannot exclude that the 2009 sample is an exception.
Discussion and conclusion
The evaluation issue is a logical step in the conception/implementation/evaluation-cycle, and it should give relevant, reliable and objective information about public policy (Demeuse et al., 2011). Nevertheless, evaluating a public policy is never easy. Among the different dimensions of the policy that could be evaluated (Bouchard and Plante, 2002), we chose to focus on its coherence and its effectiveness.
Concerning effectiveness, we have seen that it is necessary to have adequate tools to measure an increase or a decrease in socioeconomic segregation. Unfortunately, there is still no optimal tool in French-speaking Belgium. The quality of the database appears to be a key issue in measuring segregation. Two databases are available for its study in FWB. The student count is a rich database that allows the evolution of segregation to be observed in different grades and in different geographical areas. Nevertheless, it contains no individual SEI, only a measure at an aggregated level. The PISA, on the other hand, can provide extra information, as it uses an individual SEI. Nevertheless, it suffers from some limitations: only 15-year-old students are concerned; and the grade surveyed can be far from the phenomena of interest. Furthermore, collection only occurs every three years, and geographical decomposition is impossible. Moreover, the sample size can limit the power to detect small changes in segregation. In other words, both databases are essentially unsuitable for measuring segregation precisely.
Different segregation indexes are available. The ones based on the Lorenz curve have been largely used in the literature. Among them, the Delta index, referred to here as the GS, has previously been used in the French-speaking community to quantify objectives regarding segregation. The computation of such an index, and its CI, is straightforward and validated, but it requires choosing a threshold, dividing the population into two categories according to socioeconomic level. Thus, using a variety of indexes is recommended with this dichotomous solution. We conducted analyses with different thresholds (GS-15 and GS-25). VPC (multilevel modelling) has also been used to quantify objectives, regarding segregation and the computation of CIs, in the case of complex sampling design. Its use, however, requires caution and more development. Even with this in mind, one of the benefits of VPC is that it takes advantage of all the information of a continuous SEI.
Summarizing the different measures, we cannot confirm any decrease of segregation for 15-year-old students. In the PISA, all indexes presented non-significant changes. From the 2010 student count data set, VPC and GS-25 remained stable, while GS-15 increased slightly, suggesting a slight increase of segregation for the most disadvantaged students’ last years. In conclusion, we have to admit that the decrees are not effective regarding the objective of desegregation.
Such a conclusion is contradictory to the report of the administration (Ministère de la Communauté Française, 2014) that concluded in a slight decrease of segregation of disadvantaged students in the years after the promulgation of decrees regulating enrolment procedures. Differences regarding the two analyses can explain this discrepancy. Firstly, the report of the administration measured segregation of the students entering for the first time in the first common grade of secondary education while we chose to restrict our analysis to 15-year-old students in order to be able to use both administrative and international sources of data. Secondly, the population of disadvantaged students was defined as the 20.4% of students coming from the most disadvantaged neighbourhoods. Such a threshold was chosen to mimic the proportion of reserved places for students coming from the most disadvantaged primary schools although disadvantaged students were defined based on their neighbourhood of residence and not the socioeconomic composition of their primary school. As shown in the Annexe 2, the use of this threshold is associated with a slight decrease. However, it is mainly the interpretation of the indexes that differs. The decrease limited to 2010 was interpreted as a decrease while our analyses lead us to another conclusion.
A lack of coherence of the policy could explain such a disappointed measure of effectiveness. Actually, the description of the decrees and of the educational system reveal that only limited changes could be expected.
Firstly, the decree only resolved the issue of allocating places in oversubscribed schools. Concretely, the decrees concerned a limited number of schools, with only 23% of schools having been oversubscribed at least once between 2010 and 2013 (Ministère de la Communauté Française, 2014).
Secondly, the decrees concerned only enrolment procedures for the first grade of secondary school. By this stage, many years in kindergarten and primary education (6 to 9 grades) have produced drastic differences between students, and have reduced the range of study paths they may choose in secondary education.
Thirdly, the chosen procedure might not have been the optimal method for reducing segregation. In particular, the use of a simple quota in the algorithm of maximization for students from disadvantaged schools is less efficient for desegregating schools than the use of a double quota (Cantillon, 2013). Moreover, the priority given to disadvantaged students is not based on their own SEI, but on the average SEI of the primary school they come from. For instance, students of different socioeconomic origin in disadvantaged schools can have differentiated study paths, and the use of an aggregated indicator cannot measure the socioeconomic disadvantage of an individual pupil. In addition, the disadvantaged schools are not uniformly distributed in the FWB. In some areas there are no requests for enrolment of students from these disadvantaged schools, while there are many such applications in other areas. Indeed, the policy is only effective in areas where there is a mix of advantaged and disadvantaged schools.
Fourthly, the decrees approach segregation as a problem of the allocation of school places. However, they do nothing regarding the differentiated study paths that we present as the structures at the root of segregation. Changing rules regarding the allocation of places without modifying such structures could be inefficient if schools and parents change their practices in order to recreate the segregation of children with different study paths. In fact, the ‘contract for schools’ planned to tackle other segregating structures, but more than ten years later we have to admit that the structural changes are limited. In this context, we can doubt that any regulation regarding school enrolment procedures will have a significant effect.
In other words, the policy is relatively ineffective and incoherent regarding the objective of desegregation. As discussed in the introduction, the question of the definition of objectives is crucial. Regarding the former limits, we can ask whether the objectives were well defined, and whether this policy was really designed to reduce school segregation. The combination of two controversial objectives in an inefficient decree has had major consequences. It has led to a reinforcement of the controversial status of the debate regarding desegregation. The regulation of enrolment procedures has been interpreted as a reduction of the freedom that parents have when they choose the most suitable school. In a context where school offers are presented as highly segmented, and of different qualities, this freedom has become essential. It could be relevant to separate these objectives by limiting the present decrees to the arbitration of requests for enrolment in oversubscribed schools, and instead developing a coherent decree aimed at desegregation which deals with the differentiation of school study paths and their organization in separate places and areas.
Footnotes
Appendix 1: weighting and confidence intervals
The Programme for International Student Assessment (PISA) database is provided with a set of sampling weights wi in order to deal with the informative design. Properly speaking, informativeness is a property of a specific model in a specific design. This means that for a model including a set of variables, some variables (not included in the model) stay correlated to the outcome variable. In the PISA, weights are provided in such a way, firstly, to deal with the over-sampling and under-sampling of some strata of the population, secondly, to take the potential lack of accuracy in the sampling frame into account, and, thirdly, to adjust for school and student nonresponse (Organization for Economic Co-operation and Development, 2012). Moreover, replicate weights are present in the database. They allow computing confidence intervals (CIs) to summarize the uncertainty linked to the indexes we use.
The Gorard’s segregation index (GS) has been slightly modified to encompass weighting. In Equation 1,
To obtain CIs, it is advised to compute sampling variance with replicate weights. Fay’s method is a variant of balanced repeated replication used by the Organization for Economic Co-operation and Development. If
For the VPC, the use of replicate weights is problematic. The method requires weights at both levels but replicate weights are provided at the student level in the database. Some authors used bootstrapping to obtain CIs for the VPC (Willms and Paterson, 1995). Bootstrapping requires mimicking the sampling method that produced the data in order to draw many resamples. When it works, the distribution of the estimators computed separately on each resample is asymptotically equivalent to the real estimator distribution. In this article, we set up a basic procedure. We assumed that school weights are the inverse of sampling probabilities and, on this basis, we recreated the whole population of schools (about 500 according to the student count) with their respective sizes. In this population, we drew 9999 independent resamples (proportional to the school sizes) in which we computed segregation indexes. Considering the estimators’ distribution as the true one, we selected the 25th and the 975th permille as the bounds of our 95% CI. As the shape of the distribution of the VPC is not well documented, this approach allows us to deal with the non-normal distribution of the index.
Simulation-based techniques, such as Markov Chain Monte Carlo procedures, are also available to easily and efficiently compute a CI for the VPC (Brown, 2012), but unfortunately, at the time of writing, weighting is not available for these procedures in MLwiN (Centre for Multilevel Modelling, 2011).
Appendix 2: dichotomization of socioeconomic variable
Dichotomizations of continuous variables are largely used in social sciences but raise some problems. From a theoretical point of view, we could argue that socioeconomic disadvantage is not continuous but categorical. What matters is not the exact score but being above or below a specific threshold. Nevertheless, the choice of the threshold is arbitrary. Moreover, such a procedure is known to ‘alter the nature of individual differences’ (MacCallum et al., 2002). It has negative consequences in terms of effect size, power and reliability. Figure A.1 represents the variations of the GS relative to the threshold chosen for the ten years of student count data, and the four rounds of the PISA data.
Figure A.1 shows not only that different thresholds produce different values for the GS, but also demonstrates that different choices could lead to different conclusions in terms of segregation changes. For example, let us compare the differences between 2009 and 2015 obtained when using different thresholds. In the student count, when the socioeconomically disadvantaged group includes 17% of the students with the lowest socioeconomic index, the level of segregation is increased. However, when we define this group as having a larger proportion of students, we observe a slight decrease in the level of segregation. In the PISA, the conclusion is in the same direction, but the difference is never significant. Let us note that significant differences are only observed for 0.06, 0.10, 0.11 and 0.14 thresholds when comparing 2009 and 2012. In other words, when using a dichotomous indicator, one should explore different thresholds.
Acknowledgements
The authors wish to express their gratitude to Ariane Baye, Guillaume Chauvet, Eric Deny, Natalie Dickson, Jean Hindriks, Dirk Jacobs, Rob Kaelen, Bart Meuleman, Christian Monseur, Sybille Regout, Catherine Vermandele and Marijn Verschelde for helpful comments and assistance.
Declaration of Conflicting Interest
The author(s) declared no potential conflicts of interest with respect to the research, authorship, and/or publication of this article.
Funding
The author(s) disclosed receipt of the following financial support for the research, authorship, and/or publication of this article: The research leading to these results has received funding from the European Research Council under the European Union’s Seventh Framework Programme (FP/2007-2013)/ERC Grant Agreement 28360, for the EQUOP-project ‘Equal opportunities for migrant youth in educational systems with high levels of social and ethnic segregation – assessing the impact of school team resources’ (principal investigator: Dirk Jacobs).