
Abstract
This paper aims to discover the level of equity in the Turkish education system using maths outcomes of 15-year-old students in the Programme for International Student Assessment (PISA) exam. In order to do that, associations between various social background variables and student performance are analysed via multilevel models. Female pupils, students from lower socio-economic backgrounds and students from eastern regions are all found to be disadvantaged in terms of maths outcomes. The biggest gap between students in Turkey is due to school types. The difference between selective academic schools and other types of schools is more than 100 points, which is equal to the difference between almost four grade years. However, the positive effect of attending selective academic schools is smaller for girls. Further investigations indicate that, in the Turkish education system, school type at secondary level represents the effects of socio-economic background and educational and physical resources at school in addition to previous achievements of pupils. Results of the analyses show that it is very hard to claim that the education system in Turkey is operating in a way that mitigates existing inequalities in the society. To the contrary, there are indications that the Turkish education system itself reproduces inequalities.
Introduction
The aim of this paper is to evaluate to what extent the Turkish education system could be seen as facilitating and promoting equity through allowing male and female students to achieve high quality outcomes in education. To meet this aim, the main research questions are ‘Which social and educational characteristics are associated with Programme for International Student Assessment (PISA) maths outcomes?’ and ‘To what degree do these relationships moderate existing inequalities in society?’
Among the two major structuralist streams of theory in the sociology of education, functionalist theory claims that inequalities in society are functional and education is the best mechanism to allocate the right individuals to the right positions in the social structure in a meritocratic way (Davis and Moore, 1945; Parsons, 1959). On the other hand, conflict theorists claim that schooling functions in the opposite direction since it reproduces and legitimizes existing social inequalities (Bernstein, 1971; Bourdieu and Passeron, 1990; Bowles and Gintis, 1976). In a perfectly meritocratic and equitable design, the effect of social background should have no influence on students’ performance and achievement levels, which should solely depend on personal effort and skills. In contrast, if there is a full social reproduction and complete inequity, individual student performance should fully be determined by socio-economic characteristics. Therefore, to determine the level of equity in the Turkish education system, the combined effects of socio-economic background, geographic region and types of educational institution on the PISA 2012 mathematics performance of 15-year-old students are tested in this study. In contrast to the praises in the Organization for Economic Cooperation and Development’s (OECD) PISA 2012 report (2013b: 122–124) for reducing the effect of socio-economic background on student outcomes, this paper shows that socio-economic differences represented by school types and geographical regions are highly correlated with student performance in Turkey.
The changing context of the education system in Turkey
As a country which is trying to run accession negotiations with the European Union (EU), Turkey has been undergoing vast transformations in the areas of economic policy and international relations under the ruling Justice and Development Party since 2002, which have attracted kudos both in the media and in academic platforms (Abramowitz and Barkey, 2009; O’Neill, 2013; Schimmelfennig, 2009). Education policies, on the other hand, have also undergone several reformations, but these were less successful. Despite increases in scores in international exams such as PISA, Trends in International Mathematics and Science Study (TIMSS) and Progress in International Reading Literacy Study (PIRLS), Turkey is still lagging behind compared to most of the European countries (Mullis et al., 2011, 2013; OECD, 2013b).
In the last two decades there have been various policy changes in the Turkish education system. The first of these reforms was in 1997 when compulsory schooling was expanded from five years to eight years in line with a world-wide commitment to basic education via UNESCO’s ‘Education for All’ campaign (Aydagul, 2009). The second reform was the broad curriculum change in 2005, which intended to change considerably the focus and content of the whole national curricula between the 4th and the 8th grades, with a view to better preparing young citizens for the real world (Aksit, 2007). The new curricula were designed with the aim of meeting EU acquis (Aksit, 2007) and to respond to criticisms after the poor results in PISA, TIMSS and PIRLS exams (Gur et al., 2012). Finally, in 2012, compulsory schooling was increased from eight to 12 years. This legislation also restructured compulsory education as consisting of three levels, primary, junior secondary and secondary schools, each lasting four years.
In Turkey, over 15 million of the 76.5 million population are between the ages of six and 17, which are the ages of compulsory schooling. 1 Turkey has a highly centralized education system. The Ministry of National Education is responsible for designing the curriculum for all schools, hiring teachers and principals and providing all materials for public schools. About 3% of schools in compulsory education are private institutions, which are also subject to the same regulations. Pre-primary education is not compulsory and the net enrolment rate for five-year-olds is still below 40%.
In spite of the relative improvements in enrolment levels, the quality of education is still a problem for the Turkish education system (OECD, 2007b; UNDP, 2008; World Bank, 2010). Since 1997, there have been significant increases in enrolment levels especially at primary and junior primary levels. Net enrolment rates at the junior secondary level increased from 53% to 93% between 1997 and 2013. Despite similar increases in secondary school enrolment, about 30% of young people between the ages of 14 and 17 are still out of formal schooling.
Until the end of 8th grade, students are allocated to schools according to their home addresses (unless they attend a private school). All students in primary and junior secondary levels are taught via the same curriculum. Secondary schools, which used to be three years and were extended to four years in 2005, consist of various types. The main segregation between secondary school types is due to curriculum, i.e. academic or vocational. Among both categories some high school types admit students according to their performance in national exam(s) and/or their previous school grades. Anatolian high schools (HS), Anatolian teacher training HS, Science HS, Social science HS and Police HS are among these selective schools which provide academic curricula. On the other hand, vocational curricula are followed in the Anatolian vocational and Anatolian technical types. However, the majority of the student population are attending non-selective types, namely General HS with an academic curriculum or vocational, technical and multi-programme HS with vocational curricula (See Table 1 for school types covered in the PISA 2012 Turkey sample). In 2012, among all secondary school students, the share of students attending selective academic types was about 20% (MoNE, 2013). On the other hand, 40% of about 5 million students in secondary education attend various types of vocational/technical schools, about 20% attend General HS and other types of schools. Finally, about 20% are in distant/open education, which is not covered in international student assessment research.
School types covered in the PISA 2012 Turkey sample.
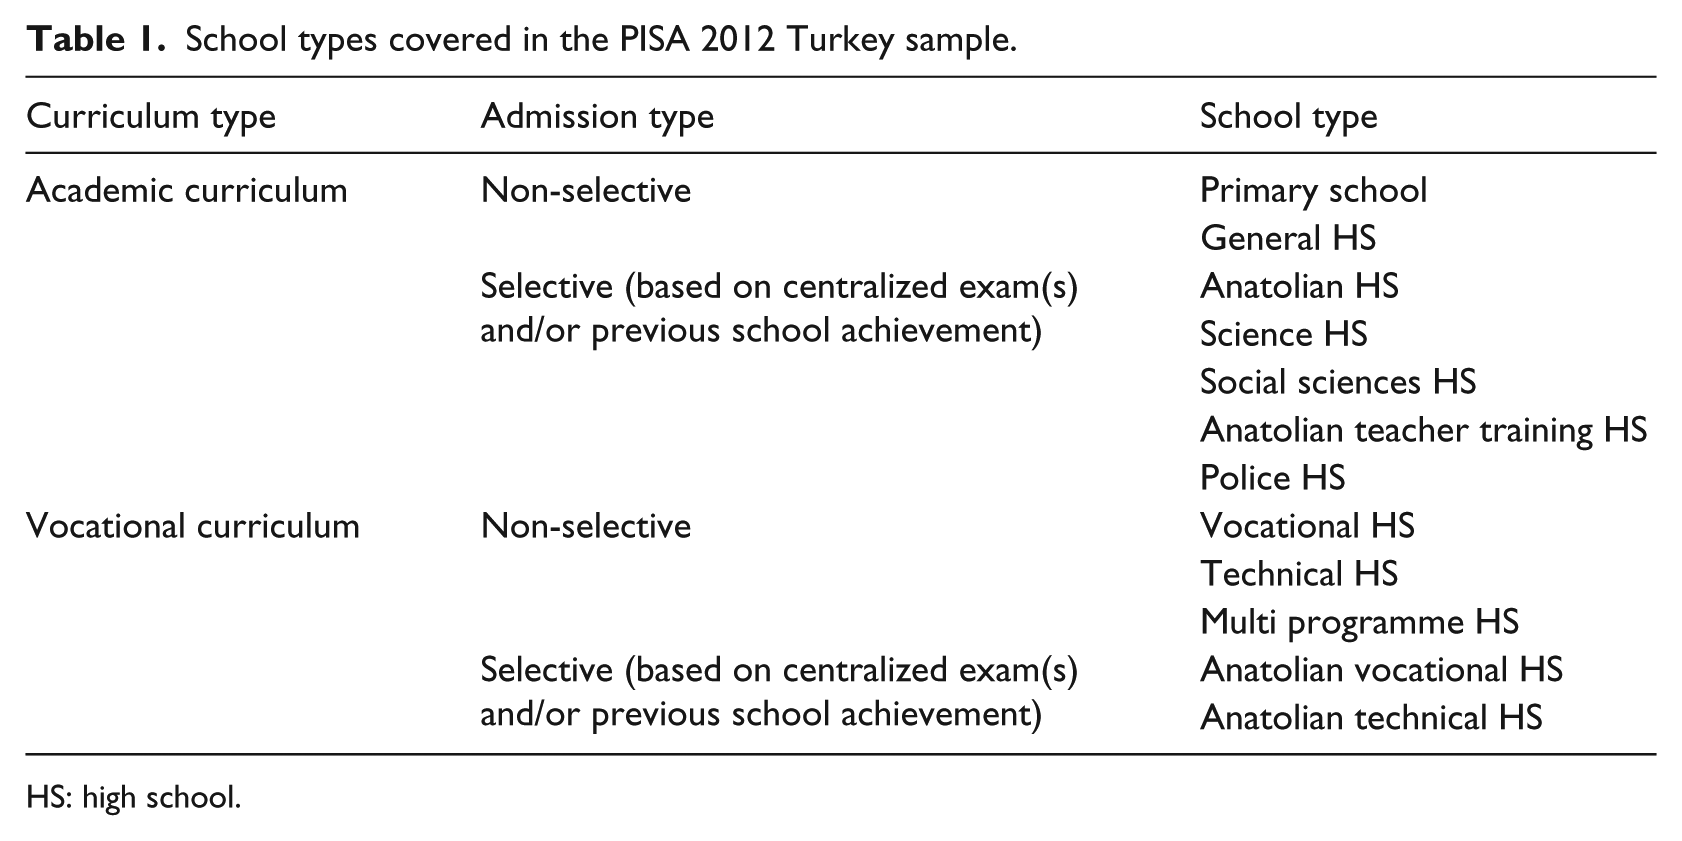
HS: high school.
Among these school types, Science HS, Anatolian HS, Anatolian teacher training HS and Social sciences HS are the most successful types of secondary schools both in terms of university entrance and international test performances (Berberoglu and Kalender, 2005; EARGED, 2010; Sahin et al., 2012).
Theoretical background
This paper’s research questions aim to address the classical debate between consensus and conflict theories of sociology of education. The consensus (or functionalist) approach values education for its role in maintaining the stability of society by preparing individuals for their place in the division of labour. Parsons (1959) addresses the function of school as giving the child a set of values related to the appreciation of achievement and the principle of meritocracy. Hence, functionalists consider inequality necessary for the survival of the society (Davis and Moore, 1945). According to the functionalist view, some positions in society are more important than others. These positions need more skill and/or talent than others. Hence, a motivational system is needed to fill these positions in a legitimate way. In this sense, education plays an important role for both teaching the knowledge required and sorting/selecting individuals for these positions.
On the other hand, conflict theorists see consensus as a temporary stage and focus on social change caused by social conflicts. They argue that education teaches individuals their positions in the society and serves to reproduce existing social positions. According to Marx (1976), schools in the capitalist system give the children the values and the skills needed for the functioning of the capitalist workplace. In this sense, Durkheim and Marx have the common claim that education reproduces existing social order. However, while Durkheim (1956) argues that everybody should benefit from the education system to secure a fair competition, Marx is critical of both the starting conditions of children from different classes and the contents of education.
Using PISA 2012 Turkish data, this paper aims to test the views of these two classical stances in the sociology of education. If there is a meritocratic system to select the best individuals to the best positions in the society, then one should expect that average performance levels of students from different social backgrounds do not differ much. On the contrary, if education is a means to reproduce existing order and to eliminate pupils from subordinate groups, then there should be widening gaps between the children of the affluent and the disadvantaged groups in terms of their academic performance.
In the case of the PISA Turkish sample, I model the effects of various social background characteristics on student performance. Gender and socio-economic status index are the direct measures of these characteristics. Moreover, social differences may be represented by variables like region, school type, language spoken at home or enrolment to pre-primary education. All of these are included in the models below to demonstrate the performance differences between students due to these variables. Moreover, to control for other potential effects and to have an accurate regression model, several educational variables are included, for example grade repetition to control for previous achievement and school level characteristics such as teacher shortage, classroom size, educational and physical resources at school. The main hypothesis is that there are not any significant performance differences between students due to their social backgrounds. Rejection of the hypothesis would support the conflict theory claim that the education system does not enhance meritocracy but does reproduce existing inequalities.
Conceptual framework
Pfeffer (2012) outlines the aims of education systems as supporting individuals to participate in society and providing opportunities for social mobility. These two aims of education, namely ‘excellence’ and ‘equity’, are analysed in this paper. The main objective of this paper is to find out to what extent the Turkish education system is equitable in terms of excellence, measured by PISA maths performance. In line with this, the following research questions are asked: ‘Which social and educational characteristics are associated with PISA maths outcomes?’ and ‘To what degree do these relationships moderate existing inequalities in the society?’
Although the terms ‘quality’ and ‘excellence’ are used interchangeably in studies of the sociology of education (Smith and Lusthaus, 1995), the term ‘quality’ has more connotations related to school effectiveness studies (Reynolds and Hopkins, 1994) or total quality management studies in education (Bonstingl, 1992). This study uses the concept of ‘excellence’ as outputs of education measured by PISA tests. Hence, it is only the attainment levels of 15-year-old students in Turkey in the PISA 2012 exam which is measured as an indicator of educational excellence in this study. PISA is designed to measure the skills to solve real life issues using existing academic knowledge instead of memorizing (OECD, n.d.). Therefore, PISA performance can be considered as a good operational measure of how well education supports individuals to participate in society in line with Pfeffer (2012)’s approach.
‘Equity’, on the other hand, is used instead of the term ‘equality’. Gillborn and Youdell (2000) outline four different uses of these concepts in the sociology of education. The first of these is formal equality of access and provision. The second is the equality of circumstance (regardless of formal barriers). A third understanding concerns the equity of participation (treatment), referring to the structures and processes that define everyday life in schools. The last usage of the concepts is equity of outcomes focusing on the aftermaths of educational practice. Gillborn and Youdell (2000) argue that equitable outcomes of education would be expected to decrease gaps in school achievement, enrolment in higher education, employment, etc. between different groups. So, an equitable education system does not refer to a system where everybody achieves the same level. However, unlike exact equality, equity may refer to unequal treatment of different students if they have unequal starting conditions (Duru-Bellat and Mingat, 2011). This paper employs this last usage of the concept as equity of outcomes. Therefore, in this paper the equity of outcomes is being examined via PISA maths performance differences between social groups, while controlling for other potential determinants of educational attainment.
Previous research
Since the Coleman Report (Coleman et al., 1966), the effects of social background on educational achievement has been researched widely. Coleman et al. found that social background variables had a much greater effect on education outcomes than school funding. A year later, the Plowden (1967) report in the UK published similar results. Heyneman and Loxley (1983) expanded the scope of the research to 29 low and high income countries and found similar results. They showed that the effect of socio-economic background on academic achievement in a country decreases as the level of development decreases. Nevertheless, in a later study Baker et al. (2002) found that the effect of socio-economic background in developing countries reached the level of developed countries as they reached the same levels of schooling. Many other scholars reached similar conclusions about the effect of social background on educational outcomes in different contexts. Kwong (1983) showed that in China both economic advantage and coaching of the family increase the educational performance of children. In their research, Shavit and Blossfeld (1993) compared 13 industrialized countries and revealed that except for Sweden and the Netherlands, socio-economic differences have a great deal of influence on educational inequalities. Hansen (1997) in Norway and Roscigno and Ainsworth-Darnell (1999) in the USA showed similar results. Gamoran (2001) predicted that educational inequalities due to socio-economic inequalities are going to persist in the 21st century, while it is expected that inequalities due to race and gender will decrease. In their research, which replicated the Coleman Study 40 years previously, Gamoran and Long (2007) concluded that the findings of the report still held.
Especially in the last decade, studies on the relationship between equity and attainment in education and their relationship to social background were facilitated by the availability of the large-scale PISA data. Questionnaire data from students, families and school heads, in addition to exam performance data, made it easier to track the effects of various social characteristics on academic performance. The first PISA report by the OECD (2001) indicated that gender, economic, social and cultural characteristics measured through parental occupation, level of education, material and cultural possessions, migration status and language spoken at home are all associated with PISA test scores. Data from the following waves of the PISA gave similar results (OECD, 2004, 2007a, 2010, 2013a).
In addition to individual characteristics, many studies showed the effects of various school characteristics on students’ achievements. Another OECD (2005) report on school related factors summarized the variables that are most related to student achievement in the PISA as follows: school structure/selectivity; student socio-economic status; school socio-economic status average; school resources and climate.
Data from international student evaluations were also used in Turkey to investigate the effects of social background on student outcomes. Using TIMSS 1999 data, Yayan and Berberoglu (2004), and with PISA 2006 data Alacaci and Erbas (2010) and Dincer and Uysal (2010), all found significant effects of home background variables. Berberoglu and Kalender (2005) also included national university entrance data in combination with PISA data, and found that school type and region have strong effects on achievement. Engin-Demir (2009) used data from her research on urban poor students in Ankara and revealed mother’s education level, household size and household possessions as the main influences on academic achievement. Recent reports from the World Bank (2010, 2013) based on PISA data also made note of the influence of family background and school types. It is underlined in these reports that secondary schools in Turkey are clustered according to socio-economic status. Similarly, Oral and McGivney (2013) pointed out the same relationship using TIMSS 2011 data.
This paper aims to contribute to the extant literature in several ways. Firstly, many studies focus on direct measures of social background (e.g. economic, cultural and social status (ESCS)). However, in the Turkish case social background effects are represented by various other student or school level variables such as having had pre-primary education, school type or geographic region. The hidden effect of social background is further investigated via multilevel design and selection models. In fact, the bivariate effect of ESCS on PISA maths score for Turkey is one of the lowest among European countries (OECD, 2013a: 174). However, analyses in this paper show that socio-economic background has a strong influence on student performance through school types and regions. Moreover, some other school level variables such as school socio-economic composition, classroom size and infrastructural and material resources disappear behind the effects of school type and geographical region. Another contribution is to the literature on Turkey. Most of the research using international student assessment data in Turkey has focused more on educational characteristics and has not deeply investigated socio-economic influences on student performance using a thorough methodological setup. Several features of Turkish data have been underlined in separate studies, but this study aims to provide one of the first comprehensive analyses of the relationship between equity and excellence in the Turkish education system.
Methodology
Data
The PISA 2012 sample for Turkey is used as the main data source in this paper. PISA has been conducted every three years since 2000 by the OECD. The tests in maths, reading and science are applied to a sample which is representative of 15-year-old students in every participant country. In addition, students and their school principals are also required to fill in questionnaires about the students’ social, economic and cultural backgrounds, schools, broader school system and school environment (OECD, 2013b). The PISA 2012 data for Turkey covers 4848 students from 170 schools. All are aged 15, normally the age for 10th grade in Turkish schools, but there are also pupils from grades 7 to 12. The sample was constructed according to a two stage stratified design according to school types and socio-economic regions 2 in Turkey.
Methods and procedures
The main method used in this study is multilevel regression modelling (Raudenbush and Bryk, 2002). This is appropriate since PISA is designed with students nested within schools and schools nested within countries. Unlike standard linear regression models, in multilevel modelling the relationship between cases within clusters is incorporated in the analysis. Since it is only Turkish data which is analysed for the purposes of this paper, the data used is structured as a two level design, namely students nested within schools.
An advantage of multilevel modelling is that it allows for the calculation of parameters that express the patterns of variation related to the higher level units (here schools). This feature is usually described as allowing for ‘random intercepts’ (when the average outcome is modelled as being systematically higher or lower from school to school), and/or as ‘random slopes’ (when the average effect of another coefficient is modelled as being systematically larger or smaller from school to school). In this paper, intercepts are random in all models. However, slopes are held fixed since it is found after numerous trials that there are not substantial differences between fixed and random slope models for several variables. Multilevel modelling was carried out with MLwiN 2.30 software (Rashbash et al., 2009). For descriptive statistics STATA 12.1 is used (StataCorp, 2011).
In the sample, some students from the same schools are registered to different types of schools. This is because some general HS were transformed into Anatolian HS in previous years and they have students attending either the old type or the new one. Similarly, some vocational/technical schools have more than one type, such as vocational HS, technical HS, Anatolian vocational HS or Anatolian technical HS. In such cases, different types are considered as different school level units in order to evaluate school type as a school level variable and distinguish between students attending different types in the same school building. Nonetheless, individual school and student weights, which adjust for actual selection probabilities provided in the dataset, are included in the analysis procedure. 3
Variables
Dependent variable
PISA includes three test subjects, namely mathematics, reading and science. One of the three subjects is selected as the focus in every wave of PISA to have a deeper evaluation. For PISA 2012, the focus was the maths test. Accordingly, student outcomes in the maths test (‘PV1MATH’) 4 are used as the dependent variable in the models.
Independent variables
Independent variables from both student and school levels are used. 5 Their distributions are summarised in Table 2. At the student level, gender, socio-economic status index score, language at home, having attended pre-primary education (‘preprim’), grade year and grade repetition (REPEAT) are used as independent variables. Socio-economic status is measured in PISA through the PISA index of economic, cultural and social status (ESCS), which is calculated via aggregation of three sub-indices (OECD, 2013b). These indices are the highest occupational status of parents (HISEI), highest education level of parents in years (PARED) and home possessions index (HOMEPOS). HISEI is the occupational score of the parent with the highest international socio-economic index of occupational status score (Ganzeboom et al., 1992). PARED is the educational level of the parent with the highest number of years of schooling based on ISCED (International Standard Classification of Education) classification (OECD, 1999). The HOMEPOS index is calculated according to three other sub-indices which are family wealth possessions (WEALTH), cultural possessions (CULTPOS) and home educational resources (HEDRES), all of which are based on a series of questions about certain material, cultural and educational items in the household. 6 Language at home is mostly Turkish in our case and responses coded for this variable are ‘Turkish’ and ‘other’. Students who said that they had a pre-primary education are also compared to the ones who had not. Finally, grade year and grade repetition (‘REPEAT’) are also included in the analysis in order to control for performance variability due to differences in grade year and previous achievement.
Weighted frequencies and descriptive statistics for dependent and independent variables.

Reference category.
PV1MATH: PISA maths test performance; ESCS: economic, cultural and social status; CLSIZE: average classroom size; TCSHORT: teacher shortage index; SCHSIZE: school size; SCMATEDU: school educational resources index; SCMATBUI: school physical infrastructure index; HS: high school.
Totals of weighted frequencies may not add up due to rounding.
School level variables are derived from the school questionnaire completed by school principals. The teacher shortage index (‘TCSHORT’), which is calculated according to teacher shortage level of the schools in various subjects, school size (‘SCHSIZE’), average classroom size (‘CLSIZE’), school location both in terms of size (‘location’) and socio-economic region (‘region’), and school type (‘progn’) are all used as the school level independent variables. Two school level indexes are also included in the models. The first of these is the quality of school educational resources index (‘SCMATEDU’), which is calculated based on the availability of science laboratory equipment, instructional materials, computers for instruction, internet connectivity, computer software for instruction and library materials at school (OECD, 2013a). The second is the school physical infrastructure index (‘SCMATBUI’). This index is calculated based on the adequacy of the school buildings and grounds, heating/cooling, lighting systems and instructional space at school (OECD, 2013a). Moreover, an average ESCS score is calculated for each school from individual student ESCS scores, and it is also included in the analyses as a school level independent variable (‘school_ESCS’).
Results
Main effects
A series of nested models are presented in Tables 3 and 4. In Table 3, following the null model (Model 1), Model 2, which includes all variables except for the school type variable, is constructed. Then school type is added in the full model (Model 3). This model serves to illustrate individual and school level influences net of school type measures. Finally, a parsimonious model is constructed by dropping insignificant terms from the model in two steps (Model 4). Model 4 shows that grade year, grade repetition, gender, ESCS, region and school type have statistically significant associations with PISA maths scores.
Multilevel models with main effects only.

p<.05, **p<.01. Numbers show regression coefficients and their standard errors (in brackets). –2*log likelihood indicates relative fit of model to data. Reference categories are ‘Not repeated a year’ for grade repetition, ‘Male’ for gender, ‘Other’ for language spoken at home, ‘Not attended pre-primary school’ for pre-primary education, ‘Town’ for location, ‘Istanbul’ for region, ‘General HS’ for school type.
REPEAT: grade repetition; ESCS: economic, cultural and social status; preprim: attended pre-primary education; TCSHORT: teacher shortage index; SCHSIZE: school size; CLSIZE: average classroom size; SCMATEDU: school educational resources index; SCMATBUI: school physical infrastructure index; HS: high school.
Multilevel models with interaction terms.

(*p<.05, **p<.01) Numbers show regression coefficients and their standard errors (in brackets). –2*log likelihood indicates relative fit of model to data. Reference categories are ‘Not repeated a year’ for grade repetition, ‘Male’ for gender, ‘Northwest’ for region, ‘Academic’ for school type.
REPEAT: grade repetition; ESCS: economic, cultural and social status; ln_ESCS: natural logarithmic transformation of ESCS.
A grade year difference corresponds to 26.9 points difference in maths scores. On the other hand, students who have repeated at least one grade are performing worse. Females compared to males, students from Aegean, Mediterranean, Central Anatolia, East Black Sea, Northeast Anatolia, Middle East Anatolia and Southeast Anatolia regions compared to students from Istanbul and students attending Vocational HS compared to the ones attending General HS perform worse in maths. Having a higher socio-economic status, attending Anatolian HS, Science HS, Social science HS, Anatolian teacher training HS, Anatolian vocational HS, Anatolian technical HS or Police HS are positively correlated with maths performance. When other variables are controlled for, on average girls score about 26 points lower than boys; students from Mediterranean and Eastern regions score 30 to 50 points lower than students from Istanbul and students from Anatolian HS, Science HS, Social science HS, Anatolian teacher training HS and Police HS score around 100 or more points higher than students from General HS.
It is seen in Table 3 that there is a dramatic change between Model 2 and Model 3. Some school level variables, namely average classroom size and school location, disappeared after school type is added in Model 3. Moreover, average school ESCS score and quality of school educational resources index also become insignificant when other insignificant terms are dropped from Model 3. Thus, they are not included in Model 4. This change in these school level variables means that their effects are represented by school type. School average socio-economic composition is found to be effective on student performance in many other studies using PISA data (e.g. Dunne, 2010; Montt, 2010; OECD, 2007a, 2013a). However, in this case it is dropped from the model after controlling for school type (p-value: 0.082). This result indicates a segregation of school types due to average socio-economic status, which is discussed below in detail.
Another major change can be observed in the intra-class correlation (ICC). The decrease in ICC, from 15% to 6% when switched from Model 2 to Model 3, means that most of the unexplained pattern related to school level effects in Model 2 is explained when school type is included in Model 3 (See Figure 1).
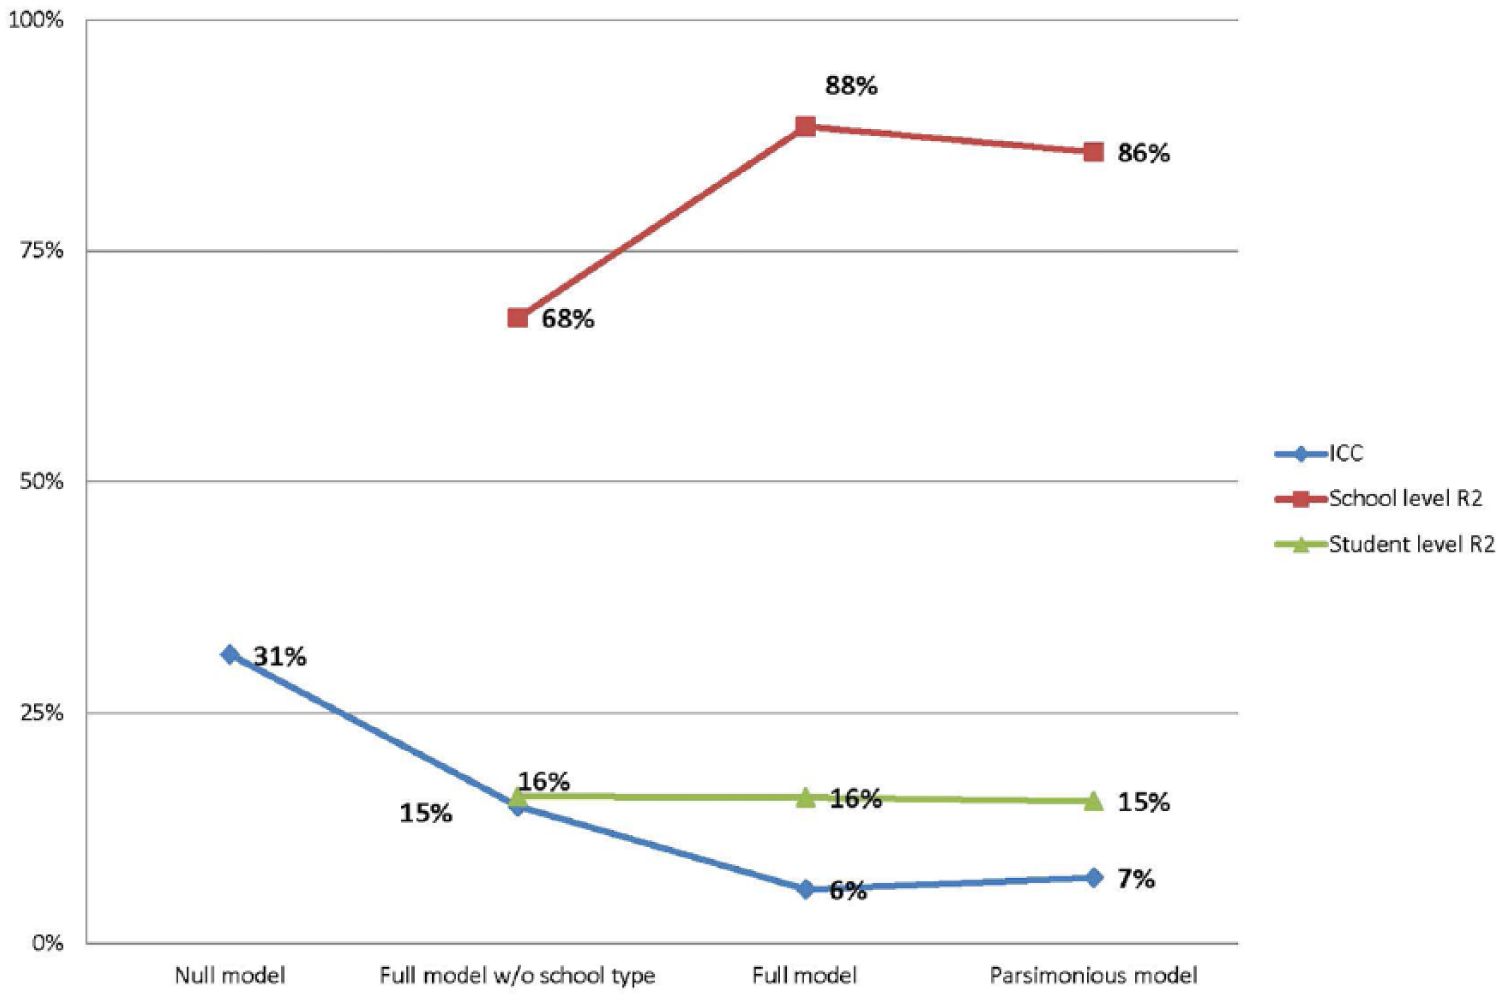
ICC and percentage of explained variance (R2) at the school and student levels.
In Model 2, 68% of the variance in school level is explained compared to the null model, whereas when school type is added it increases to a maximum of 88% in Model 3. These substantial changes in both ICC and the percentage of explained variability show that school type is the main empirical influence on maths outcomes.
Interaction effects
As a further step, interaction terms are investigated in Table 4. Before adding interaction terms, a recoding was made on the variables that have multiple categories to reduce the number of dummy variables. Depending on the effects in the parsimonious model and geographical proximity, some regions are merged. Since the effects of West and East Marmara do not differ significantly from Istanbul, they are all merged into the new reference category ‘Northwest’. Mediterranean and Aegean, two coastal regions having negative effects, are merged into the ‘Southwest’ category. West Black Sea, West Anatolia and Central Anatolia, which have neutral or slightly negative effects compared to Istanbul, are merged into the ‘Central’ category. The regions which are in Eastern Turkey and have negative effects on maths attainment, namely East Black Sea, Northeast Anatolia, Middle East Anatolia and Southeast Anatolia, are merged into the ‘East’ category.
Similarly, school types are merged into four categories according to their curriculum type and their student admission procedures. General HS and Primary schools, which provide an academic curriculum, are merged into the same group. Other academic schools which admit students according to their performance in central national exams and differ from General HS in Model 4 are merged into the ‘selective academic’ group. Among the vocational and technical types, Vocational HS, Technical HS and Multi-programme HS are merged in the ‘vocational’ category. The remaining vocational and technical schools which also admit students based on national exam scores are merged into the ‘selective vocational’ group. As a further step, natural logarithmic transformation of ESCS is also added to the model after trying for various functional forms (See Models 5–6). 7
After creating new groups and choosing the most suitable functional form for ESCS, several interaction terms are added to Model 7. The interactions of gender and ESCS both among themselves and with region and school type categories are tested. Finally, insignificant terms are dropped in the parsimonious model (see Model 8).
Firstly, logarithm of ESCS is found to be a better predictor than the linear effect. This type of relationship indicates that the same amounts of increase in the socio-economic status lead to bigger increases in maths scores for children from lower socio-economic status families than for children from higher socio-economic status families.
Furthermore, no significant interactions are found between gender and ESCS, gender and region, ESCS and region and ESCS and school type. However, there is a significant interaction between gender and school type. Here, it is important to note that the negative effect of being female and the positive effect of selective academic schools persists. Nevertheless, the presence of the negative interaction terms for females attending selective academic schools indicates an inequity against women in selective academic schools. In other words, in addition to being disadvantaged in general, female pupils are not benefiting from the advantages of attending a selective academic school as much as their male peers.
The effect of school type
Analysis of PISA data in this study shows that selective school types, especially selective academic schools (which correspond to only a fifth of all secondary school pupils), are far more advantaged compared to the rest. In the above models, the coefficient for selective academic schools is about 100 points, which corresponds to four grade year differences compared to (non-selective) academic schools. The difference is higher for (non-selective) vocational schools. When examining the PISA 2012 Turkey sample, 93% consisted of students from the 9th and 10th grades. This is just after the allocation of students to different school types based on central exam scores. It is not surprising that this segregation according to previous academic achievement is reflected in PISA scores. However, the disappearance of various other school level variables after the inclusion of the school type variable in the above models indicates further segregation of students according to various social and educational characteristics.
In Table 5, averages of school level variables are compared across different school types. Selective academic schools have higher average ESCS scores, fewer teachers, and smaller classroom and school sizes. Hence, schools which admit the most successful students have a more affluent student population in terms of their socio-economic background. Furthermore, the index of quality of school educational resources and the index of school physical infrastructure are the highest for selective academic schools. It means that these selective academic school types are also the most advantaged with regard to their educational and material resources.
Averages and percentages of school level variables according to school types.

ESCS: economic, cultural and social status.
The relationship between previous achievement, socio-economic background, and PISA performance is very complex and deserves further investigation. An ideal research design to reveal the interplay between previous achievement, socio-economic background and PISA performance would be to track student performance in a longitudinal survey. Currently, such data are not available for the Turkish education system.
Nevertheless, there is still room for further investigation using PISA data. In order to further investigate the effect of school type, selection models, the statistical method developed by Heckman (1979), is applied to control for selection bias in regression models. In this case, selection bias may be caused by varying probabilities of students’ selection into different types of schools. As the first step, to have similar size sub-samples, selective academic and selective vocational school type categories are merged into one category, namely selective schools. Thus, the sub-samples are selective schools, (non-selective) academic schools and (non-selective) vocational schools. Afterwards, probability of entrance into different school types are calculated via separate logistic regression models. Within the limits of PISA data, five different variables which might be related to transition to secondary level education are included in the models. These are having repeated a grade at ISCO (International Standard Classification of Occupations) 1 and ISCO 2 levels (‘repeat_1_2’), gender, language at home, having had pre-primary education and socio-economic status. The square of ESCS is also included in case there is a non-linear effect. 8 After removing insignificant variables from each model, parsimonious models of selection are calculated for each category.
It is seen in Table 6 that students who have repeated a grade, females and students who have low ESCS scores are less likely to attend selective school types. Moreover, in these schools the effect of ESCS is quadratic, which means that the positive effect of the socio-economic background index is higher for top socio-economic groups. The effect of ESCS is also significant for other types of schools but in a negative way. It is linearly negative for academic schools and has an exponentially increasing negative effect for vocational types. Gender is also associated with school type selection. While girls are more likely to enter selective school types, boys are more likely to attend vocational schools.
Logistic regression models for selection into different school types.

(a) Full model, (b) Parsimonious model, *p<.05, **p<.01. Numbers show regression coefficients and their standard errors (in brackets). Reference categories are ‘Not repeated a year’ for grade repetition, ‘Male’ for gender, ‘Other’ for language spoken at home, ‘Not attended pre-primary school’ for pre-primary education.
preprim: attended pre-primary education; ESCS: economic, cultural and social status; ESCSp2: adjusted ESCS score to provide a positive value, squared.
As the next step, the probabilities of selection into different types of schools are predicted for every student by using parsimonious logistic models. Then, full multilevel models are constructed for PISA maths performance in three different school type categories separately. These models are identical with Model 2 in Table 3 above. Finally, selection variables (‘pred_selective’ for selection probability into selective school types, ‘pred_academic’ for academic school types and ‘pred_vocational’ for vocational types) are added to the models in order to control for the probability of selection into the particular school type.
Models for PISA maths performance are compared in Table 7. For all three school type categories, full models with and without selection probabilities are presented separately. The most striking result of the selection models is the vanishing effect of ESCS for selective school types. Table 7 shows that the effect of ESCS is not significant any more for selective schools when selection probability is controlled for. Although it remains significant at the 95% confidence level, the effect of ESCS is shrinking for academic schools after controlling for selection probabilities. In summary, socio-economic status background has a statistically significant positive effect on transition from junior secondary to secondary level in Turkey. Once students are allocated to different school types, the effect of socio-economic background becomes less visible since it is represented by the school type variable.
Selection models summary.

For all variables and coefficients, see appendix Table 8. (c) Full model, (d) Full model plus selection probability into particular school type, *p<.05, **p<.01. Numbers show regression coefficients and their standard errors (in brackets). –2*log likelihood indicates relative fit of model to data.
ESCS: economic, cultural and social status; pred: selection probability.
Discussion and conclusion
In order to grasp the relationship between the PISA 2012 maths performance of 15-year-old students in Turkey and various characteristics of students and schools, a series of multilevel models are constructed. Gender, socio-economic status, school type and region are all found to be associated with PISA maths performance.
Gender inequalities in Turkish education
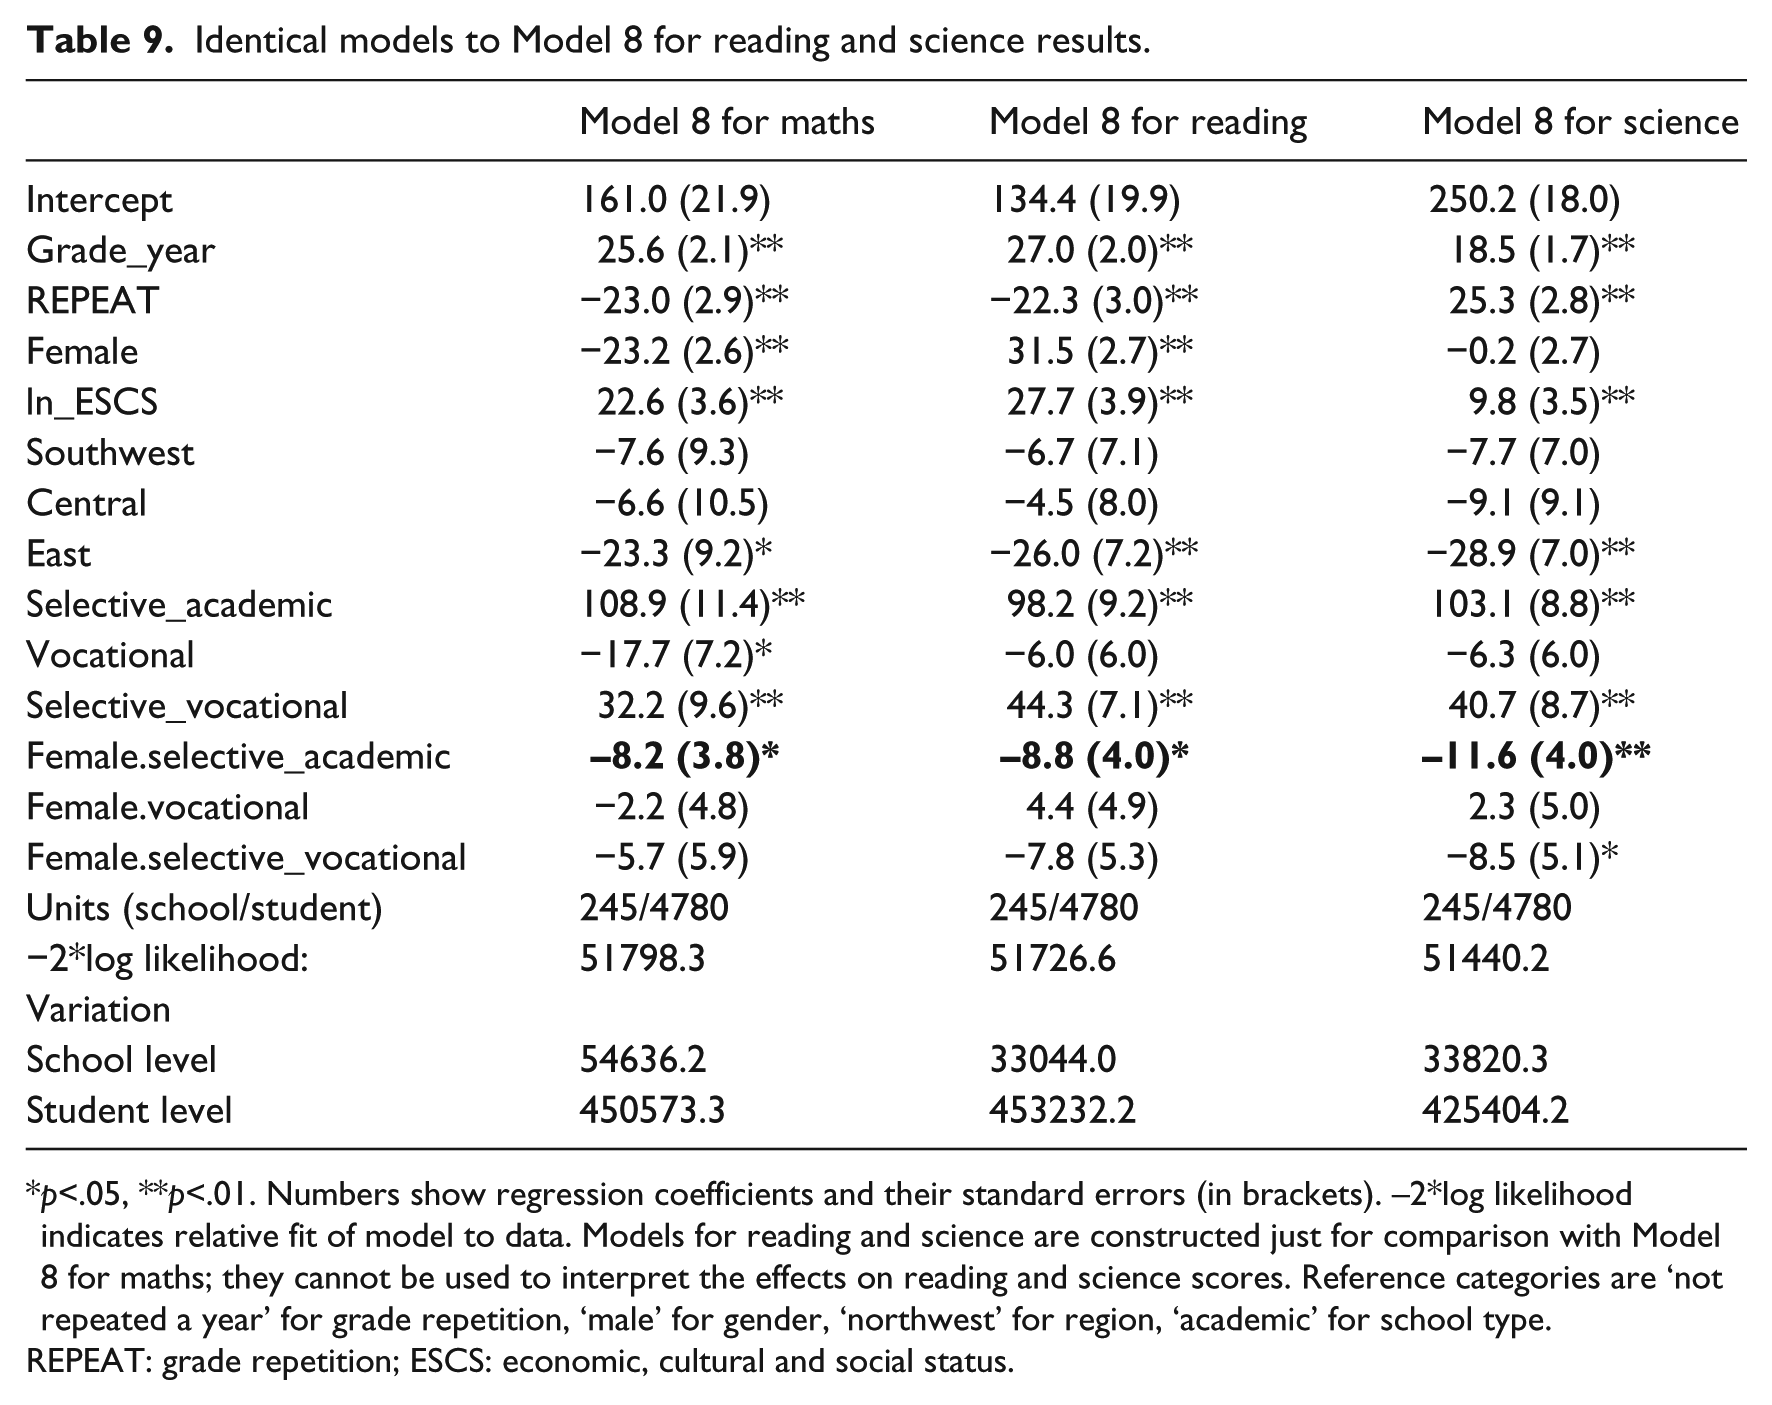
The multilevel models employed in the study show that girls score about 25 points lower than boys in the PISA maths test in Turkey when other factors are controlled for. Regarding the effect of one grade year difference, which has a similar size, it can be said that female students are about a grade year behind male students. Studies, especially those using the PISA data, show that males outperform females in maths in many other countries. However, this result does not rule out the possibility that these differences are socially constructed. An explanation for the performance gaps between boys and girls in maths is that boys are allocated to higher tracks or school types in many education systems (Marks, 2008; Sorensen and Hallinan, 1986). However, this study shows the opposite. First of all, selection models show that girls are more likely to enter better performing school types in Turkey. Second, even when the effect of school type is controlled for in the models above, girls are still less successful in maths. Moreover, the present study also finds that there is an interaction effect between gender and school types. This effect is negative for girls attending selective academic schools. It shows that girls are extra disadvantaged in these selective schools. This negative interaction is not unique to maths results. It is robust across different subjects, such as reading, in which girls perform better than boys, or in science, in which there is not a significant difference between girls and boys (see Appendix Table 9 for multilevel models for reading and science tests which are identical to Model 8, above).
An interesting comparison for the gender gaps in PISA Turkey data might be with TIMSS 2011 maths exam results (Mullis et al., 2013) for 4th and 8th grade students. TIMSS results show that in Turkey, 4th and 8th grade girls are slightly better than boys at maths. Bearing in mind that TIMSS and PISA measure different things, it is still surprising that there is such a big gap between boys and girls in PISA tests for students mostly in the 9th and 10th grades. Findings from the present study indicate that the selection system in Turkey before secondary education might be an institutional mechanism that is creating inequities between male and female students in terms of educational excellence. In the last 10–15 years, differences between men and women in terms of access to both primary and secondary education were diminished considerably in Turkey. 9 However, the gender gap in terms of educational outcomes still needs close attention from policy makers.
Socio-economic inequalities in Turkish education
Another important variable associated with the maths performance of 15-year-old pupils in Turkey is the socio-economic status of pupils’ families. The maths outcomes of students increase as the socio-economic statuses of their families improve. Moreover, this effect of socio-economic status on maths outcomes is found to have a non-linear characteristic in which the effects are higher at lower socio-economic levels. This result is consistent with previous research arguing diminishing marginal returns of social background on educational outcomes (Chiu, 2010; Chiu and Khoo, 2005) and with PISA reports from the OECD (2010: 55; 2013b: 262). The law of diminishing returns is borrowed from economics. The law claims that the expected gain from an input, when all other variables are held constant, does not linearly increase. For higher levels of input the outcome is expected to increase less and stop increasing eventually. In the area of education it is used in search of the effects of national growth or income on educational outputs. Scholars like Meyer and Schiller (2013) and Glyfason and Zoega (2003) found, respectively, that the effects of GDP and economic growth on national education outputs are logarithmic, instead of linear. Few other researchers sought for diminishing marginal returns in education at student level. Chiu and Khoo (2005) and Chiu (2010) argued that the effect of economic resources on the educational performance of a student fits to the law of diminishing marginal returns. In a recent study, Evans et al. (2014) found a similar relationship between number of books at home and PISA outcomes. They argue there is a level of scholarly culture that is reached at home that has a positive effect on school performance. The findings of this paper also confirm a similar relationship. The natural logarithm of ESCS is a better estimator of PISA maths performance than its linear effect. This relationship may indicate the presence of a baseline social status which is required to excel in school. Despite a lack of studies on the functional form of ESCS on student outcomes in PISA, the extension of such research on the effects of socio-economic background may give insights, especially for policy purposes. Moreover, since ESCS consists of many subcomponents, analysis using these components separately is another potential research target to better understand socio-economic background effects on educational outcomes.
Nevertheless, for the Turkish case, one should keep in mind that a potential larger effect may be represented by the school types. It is shown above that secondary school students are placed unevenly in schools considering their socio-economic status. A huge effect of school average ESCS score becomes insignificant after controlling for school types. Previous studies in Turkey showed that the socio-economic background of the family is one of the major factors contributing to the educational participation of children (Smits and Gunduz Hosgor, 2006; Tansel, 2002). Furthermore, using TIMSS 2011 data, it is stated in a recent report by ERG (2014) that socio-economic background differences is the main contributing factor on maths scores of 8th grade students in Turkey. The findings of this paper also confirm the effect of socio-economic background on student outcomes, although some portion of the effect is represented by the school types.
Another variable that is considered in the literature is migrant status and ethnicity when dealing with the effects of socio-economic background on student outcomes (Agirdag et al., 2011; Dronkers and Van Der Velden, 2013; Dronkers et al., 2012; Shapira, 2012). However, the total number of students with first or second generation migrant status is less than 1% in the PISA 2012 Turkey sample. Moreover, in PISA data, the only indicator that can be helpful about ethnicity is the language spoken at home. This variable is included in the models above and not found to affect maths performance. The frequency of languages other than Turkish is only 6% in the Turkey sample. Although there are not any official statistics about different ethnicities in Turkey, the proportion of Kurdish ethnicity is predicted to be around 20% (Konda, 2011; McDowall, 2004). There are two possibilities. First, ethnicities other than Turkish might be underrepresented in the PISA sample. Second, language at home is not the best indicator to represent ethnicity. Thus, it is hard to tell anything about the influence of ethnicity on student outcomes in Turkey with PISA data.
Regional inequalities in Turkish education
Region also has a strong effect on student achievement in Turkey. Regional inequalities in terms of access to education has been one of the most studied topics for years. Despite several policy attempts, it is hard to say that they are eradicated (Ferreira and Gignoux, 2010; UNDP, 2008). The present analysis shows that there are still wide regional inequalities in terms of educational outcomes. As students in Istanbul and a few other regions around it do pretty well, pupils especially in the eastern regions are seriously disadvantaged with regard to their maths performance in PISA. Students from eastern regions are significantly behind students from Istanbul and some other western parts even when socio-economic status, school type and other effective variables are controlled for. Considering the existing regional inequalities in other areas of social and economic life (Akkoyunlu-Wigley and Wigley, 2009; World Bank, 2010), from an equity perspective, eastern regions in Turkey need investment in excellence in education more than anywhere else.
School types and educational inequalities
In Turkey, the strongest association of PISA 2012 maths performance is with school type. Coefficients for selective academic schools are greater than 100 PISA test score points and consistent across models, which indicates an extraordinary difference between the limited number of students in a few successful school types and the majority of the students in other schools. This result suggests that the transition from junior secondary to secondary schools leads to the segregation of students in terms of their academic achievement.
Since PISA is a cross-sectional research, it is not possible to perfectly control for the earlier attainment of students. Within the limits of the data, the variable for grade repetition is included in the models to partly control for earlier achievement. Moreover, selection models are constructed to find out the variables that are associated with the selection of students into different types of schools. Socio-economic background is found to be an important predictor of allocation into different types of secondary level schools. Thus, at the secondary level the effect of socio-economic background becomes less visible since it is represented by school type. Moreover, this study also found that various school level variables, which used to be effective on maths outcomes, vanish after school type is added to the model. This means that school type represents most of the variability associated with these school level variables. Selective schools have higher average socio-economic index scores, better school resources or higher proportions of students in western regions. Thus, it is not only the segregation of students according to their achievement which is significant, but also the segregation of schools and students according to various physical and educational resources and social characteristics. In an equitable system, socio-economically disadvantaged students should receive more and better resources in order to close the achievement gap between themselves and the students from upper socio-economic backgrounds. However, in the Turkish case the opposite is true. Socio-economically advantaged students are segregated into particular types of schools which have better resources and superior conditions.
Therefore, in Turkey the school system itself reproduces existing social inequalities between students, instead of closing the gap. In this sense, this paper is consistent with a wider literature on curricular tracking and central examinations. It has long been known that ability tracking has negative influences on overall achievement levels and social inequalities (Dupriez et al., 2012; Duru-Bellat and Kieffer, 2000; Gamoran, 1996; Gamoran and Weinstein, 1998; Marks, 2005; Meghir and Palme, 2005; Pekkarinen et al., 2009). However, in their recent study Bol et al. (2014) claimed that central examinations may reduce the negative effect of tracking since they make schools and teachers more likely to invest in low performing students. Nevertheless, it is seen in the Turkish case that despite central examinations, better resources are allocated to children who are from advantageous social backgrounds and that they usually achieve better than their peers.
These deficiencies in its education system remain obstacles for Turkey in its Europeanization efforts. Europeanization has been a hot topic for Turkish education since late Ottoman times (Muftuler-Bac, 1997; Ulusoy, 2009). The importance attached to education in relation to Europeanization significantly increased after the founding of the Republic in 1923 (Mango, 2006). In 1999, Turkey was given official candidate status for EU membership and the Europeanization process of Turkey moved into a new stage. In addition to the chapter about education and culture in acquis communautaire (European Commission, n.d.), a recent World Bank (2005) report underlines the need for raising educational qualifications in Turkey to fully accomplish economic and social integration with Europe and to reach European standards of living. Thus, it is fair to say that many of the recent reforms in the Turkish education system target the aim of Europeanization (Akinoglu, 2008; Aksit, 2007; Gur et al., 2012). Nevertheless, analysis of PISA 2012 data in this paper indicates that despite various policy implementations in education, Turkey is still far from achieving equity and excellence, which are identified as two of the several policy domains by the EU bodies (European Commission, 2006, 2007).
Limitations
The biggest limitation for the analyses in this paper is the complex relationships between previous achievement and socio-economic background, which might not be perfectly covered with the available data. The only variable to control for previous achievement is grade repetition and it is included in the models above. Moreover, selection models also provide options to control these complexities. Although no multicollinearity is detected in any of the above models, the complexity of associations between variables may still prevent us from fully capturing the actual relationship patterns. Longitudinal data on student achievement may reveal further relationships. Thus, future research with a longitudinal design tracking students from earlier stages of education to secondary level have the potential to yield a more vivid picture of the effects of social background and school type combined.
Footnotes
Appendix 1. Further tables
Identical models to Model 8 for reading and science results.
| Model 8 for maths | Model 8 for reading | Model 8 for science | |
|---|---|---|---|
| Intercept | 161.0 (21.9) | 134.4 (19.9) | 250.2 (18.0) |
| Grade_year | 25.6 (2.1)** | 27.0 (2.0)** | 18.5 (1.7)** |
| REPEAT | −23.0 (2.9)** | −22.3 (3.0)** | 25.3 (2.8)** |
| Female | −23.2 (2.6)** | 31.5 (2.7)** | −0.2 (2.7) |
| ln_ESCS | 22.6 (3.6)** | 27.7 (3.9)** | 9.8 (3.5)** |
| Southwest | −7.6 (9.3) | −6.7 (7.1) | −7.7 (7.0) |
| Central | −6.6 (10.5) | −4.5 (8.0) | −9.1 (9.1) |
| East | −23.3 (9.2)* | −26.0 (7.2)** | −28.9 (7.0)** |
| Selective_academic | 108.9 (11.4)** | 98.2 (9.2)** | 103.1 (8.8)** |
| Vocational | −17.7 (7.2)* | −6.0 (6.0) | −6.3 (6.0) |
| Selective_vocational | 32.2 (9.6)** | 44.3 (7.1)** | 40.7 (8.7)** |
| Female.selective_academic |
|
|
|
| Female.vocational | −2.2 (4.8) | 4.4 (4.9) | 2.3 (5.0) |
| Female.selective_vocational | −5.7 (5.9) | −7.8 (5.3) | −8.5 (5.1)* |
| Units (school/student) | 245/4780 | 245/4780 | 245/4780 |
| −2*log likelihood: | 51798.3 | 51726.6 | 51440.2 |
| Variation | |||
| School level | 54636.2 | 33044.0 | 33820.3 |
| Student level | 450573.3 | 453232.2 | 425404.2 |
p<.05, **p<.01. Numbers show regression coefficients and their standard errors (in brackets). –2*log likelihood indicates relative fit of model to data. Models for reading and science are constructed just for comparison with Model 8 for maths; they cannot be used to interpret the effects on reading and science scores. Reference categories are ‘not repeated a year’ for grade repetition, ‘male’ for gender, ‘northwest’ for region, ‘academic’ for school type.
REPEAT: grade repetition; ESCS: economic, cultural and social status.
Acknowledgements
This paper is part of a Doctoral Dissertation titled ‘Relationship between equity and excellence in education: Multilevel analysis of international student assessment data with a focus on Turkey’, submitted to the Middle East Technical University Graduate School of Sciences. The thesis was supervised by Prof. Dr. Ayşe Gündüz-Hoşgör. The paper is written under the supervision of Dr. Marina Shapira and Prof. Dr. Paul Lambert at University of Stirling, where the author spent a year as a visiting doctoral student.
Declaration of conflicting interest
The author(s) declared no potential conflicts of interest with respect to the research, authorship, and/or publication of this article.
Funding
The author(s) disclosed receipt of the following financial support for the research, authorship, and/or publication of this article: This work is supported by the Jean Monnet Scholarship Programme [grant number: TR2011/0136.17/040].