
Abstract
This article focuses on analysing the effect of educational differentiation policies of OECD educational systems on socioeconomically disadvantaged students, based on data from PISA 2009. The analysis is conducted on the basis of a definition of two subgroups of disadvantaged students: those that achieve high scores, and those obtaining scores that are significantly below the average for their country. Educational systems are classified in four models following the classification proposed by N. Mons. Results show that the more integrated the educational system, the greater the number of disadvantaged high achievers, and the lower the number of disadvantaged low achievers.
Introduction
As confirmed by numerous studies, students’ socioeconomic status is a variable that noticeably affects students’ educational outcomes (Gregg and Machin, 2001; White, 1982). At the same time, differences in outcomes among students according to their socioeconomic status are considered as an indicator of equality of opportunities in educational systems (Field et al., 2007). Therefore, the study of academic inequalities, based on the socioeconomic status of students, can facilitate an understanding of the mechanisms that generate inequality.
The factors affecting the academic performance of socially disadvantaged students can be personal, family-related, institutional or systemic. A personal motivation towards the study, the emotional relationships developed by the individual with people in his/her environment, or classroom management by teachers are elements associated with the academic performance of all students, but especially that of those from disadvantaged backgrounds (Gutman and Midgley, 2000). Yet there are aspects of educational policy that can also affect the academic performance of these students, including different strategies for managing the diversity or heterogeneity in different educational systems. Differentiation policies, such as ability grouping, vocational tracking or repetition, have a direct impact on the educational opportunities of students and particularly on those who are the most socioeconomically disadvantaged. On one hand, these policies or educational practices influence directly the educational expectations of the students and families. On the other, repetition or tracking sometimes increases the negative peer-effect caused by the concentration of socioeconomically disadvantaged students.
Based on data from PISA 2009, this article explores the relationship between academic performance of students from socioeconomic disadvantaged backgrounds and heterogeneity management models (Mons, 2004) of the educational systems of OECD countries. This evaluation provides a set of data that allows for an accurate analysis of the academic performance of students with lower socioeconomic status. The article is structured as follows. First, we develop a theoretical framework on the academic performance of socially disadvantaged students and the definition of different heterogeneity management models and their effects on the entire educational system. Second, we detail the methodology used in the analysis. Subsequently, we present the results, and the main conclusions of the study.
Socioeconomic status and educational outcomes
It is largely acknowledged that students from socioeconomically disadvantaged backgrounds often obtain worse educational results than their more advantaged peers (OECD, 2010a). Socioeconomic status (SES) can be defined as the ‘relative position of a family or individual on a hierarchical social structure, based on their access to, or control over, wealth, prestige, and power. It is usually operationalised as a composite measure of income, level of education, and occupational prestige’ (Willms, 2003: 3). Family SES, as we said before, has been identified as a factor that is strongly related with educational outcomes.
This relationship is a cause of concern for governments in many countries, as well as being the focus of numerous international studies. Thus, concern for equal opportunities and differences in students’ educational outcomes based on their socioeconomic status have led to the development of a large body of research. For example, it is shown that children from low SES families are less likely to obtain good academic results, and that the gap in educational results can be accounted for by background differences as variations in community characteristics and family socioeconomic status (Blanden and Gregg, 2004; Caro et al., 2009; Datcher, 1982; Finn and Rock, 1997; Johnson et al., 2001; Murphy, 2009). Blanden and Gregg (2004) stress that there is an important relationship between students’ educational outcomes and the level of family income, noting a causal impact from the second variable to the former. In this sense, these authors note that family income can influence children’s social activities and social networks, and the schools chosen for them, generating a significant impact on their academic achievement. Moreover, some studies have also shown that SES is an important influence in young people’s academic trajectories (Dupriez et al., 2012). Similarly, Goldthorpe points out that ‘children of less advantaged class origins do not translate their demonstrated academic ability into courses that lead on to higher-level qualifications to the same extent as do children of more advantaged origins’ (2003: 239), showing that SES can determine educational trajectories, beyond academic results.
One can also find two research traditions regarding the determinants of school outcomes and the causes of educational inequalities: those centred on individual and family dispositions and resources for learning and schooling (e.g. Levin and Belfield, 2002), and those focused on structural inequalities that explain educational inequalities (Gillies, 2005; Lupton, 2005; Thrupp and Lupton, 2006). As early as 1966, the Coleman report concluded that one of the main factors influencing academic performance was students’ SES and pointed out the small influence from school and instruction characteristics (Coleman et al., 1966). Later studies have supported this finding (e.g. Blanden and Gregg, 2004; Caro et al., 2009; Gorard and Smith, 2004; Sirin, 2005; Tieben and Wolbers, 2010), but there is also a large amount of research that has focused on school effects on student outcomes. They have sought the existence of a set of characteristics from a significant school or instructional process which can explain the differences in academic achievement between students (e.g. Borman and Rachuba, 2001; Field et al., 2007; Harris et al., 2006; Sammons, 2007; Slavin et al., 1989), and also factors related with wider educational policies and structural inequalities (e.g. Bower, 2011; Dupriez and Dumay, 2006; Van Zanten, 2005).
In this article, we want to explore deeply the relationship between low SES students’ academic performance and educational policies across OECD countries. Specifically, we focus on educational differentiation policies.
Educational differentiation policies and disadvantaged students
As many studies have evidenced, the educational expansion implemented in developed countries after the Second World War has not reduced significantly the inequality of educational opportunities. According to this research, the educational expansion has had no significant effects on inequality of educational opportunities because most advantaged social groups were able to take greater advantage of the expansion of opportunities. For example, although the level of education of the most disadvantaged groups has increased, at the same time a greater proportion of the most advantaged social groups have achieved higher education (Raftery and Hout, 1993; Shavit and Blossfeld, 1993).
Even so, universal access to education is today a reality in many countries, and it has increased the range of students’ abilities and skills in secondary classrooms. To ensure compulsory education for all, educational systems have sought particular solutions to deal with such academic diversity in classrooms. Specifically, there are great differences according to the structure of educational paths; for example, while some countries separate children in distinctive educational tracks at early ages, others keep the students together until the end of compulsory education.
Thus, educational policies implemented in different countries can be a basis of distinction among models of educational systems. Regarding differentiation policies, vertical differentiation refers to the three main models of organization of compulsory education (Eurydice, 2014): single structure education – ‘education is provided from the beginning to the end of compulsory schooling, with no transition between primary and lower secondary education’; common core curriculum – ‘after successful completion of primary education (ISCED 1), all students progress to the lower secondary level (ISCED 2) where they follow the same general common core curriculum’; and differentiated lower secondary education – ‘after successful completion of primary education, students are required to follow distinct educational pathways or specific types of schooling, either at the beginning or during lower secondary education’ (Eurydice, 2014: 5). Moreover, vertical differentiation also refers to the use of grade retention.
Horizontal differentiation can be understood in two ways. First, at the system level, it refers to the presence or absence of different educational programmes (vocational or academic) for students of the same age. Second, at the school level, it means the creation of different groups, within the schools, based on students’ ability (OECD, 2010b).
Based on differentiation policies, Mons (2004, 2007) proposes a classification of systems into four categories, which the author terms as heterogeneity management models. It is important to note that the models proposed by the author synthesise elements of vertical and horizontal differentiation.
The first category refers to the separation model. This model is mainly characterised by the existence of a short common core curriculum, in addition to presenting a generalised use of grade retention in managing students’ progress. A short common core curriculum means the curricular differentiation in early ages, and grade retention refers to repeating a school year when the student does not achieve the educational objectives. Grouping students according to ability (in different schools and in different classes) is another of the characteristics of this model. The second model is the uniform integration model. This refers to educational systems with a longer common core curriculum but with a high incidence of repetition and the possibility of forming ability groups according to students’ abilities, although often not in an official way.
The à-la-carte integration model is the third to be defined by Mons. Its main feature is a long common core curriculum, as well as a reduced use of repetition, a flexible use of ability grouping in secondary schools, and an extensive use of individualised teaching. Finally, the author delineates the individualised integration model. This model has a long common core curriculum, automatic grade promotion of students, heterogeneous classrooms, and a generalised use of individualised teaching.
There are several studies that examine the impact of the types of differentiation policies on educational equality. Duru-Bellat et al. (2004), based on data from PISA 2000, conclude that a higher level of differentiation in educational systems reduces social equality. Furthermore, they support the finding that countries with high levels of educational differentiation obtain lower score averages in PISA 2000 than countries with more comprehensive educational systems. Gorard and Smith (2004), using data from the same evaluation, also concluded that the most segregating educational systems tend to generate higher performance differences among different social groups.
Some studies suggest that educational inequalities are largely determined by the structure of educational systems in terms of their level of differentiation, more than by the inequalities in society (Dupriez and Dumay, 2006). This effect is explained by the different academic tracks followed by students from different social levels in the most differentiated educational systems. According to Erikson and Jonsson (1996), as cited in Dupriez (2010), this is because families with more resources tend to choose more academic tracks for their children. The later the moment at which a track is selected, the lower the level of what the author defines as self-selection by families with more resources.
In this sense, in the case of Romania, Malamud and Pop-eleches (2011) show how educational reform that postponed the moment of choice between academic and vocational tracks significantly increased the number of students from rural areas – or from families with lower educational levels – that were candidates for progressing to higher education levels.
Research questions and data
The main objective of this article is to understand the impact of the various educational differentiation policies on students’ academic performance. More specifically, we focus on students from disadvantaged backgrounds, paying special attention to students who achieve high levels of academic performance and students from such backgrounds who obtain poor results. Therefore, the research questions are the following:
To what extent are the models of educational differentiation related to the presence of disadvantaged high achievers and disadvantaged low achievers?
Do the educational differentiation models affect disadvantaged students’ performance to a greater extent than other students?
The data used here come from the 2009 PISA project conducted by the OECD. Since our research is mainly based on a comparative view of disadvantaged students, we have selected OECD countries to ensure a similar level of development of their educational systems.
Classification of disadvantaged students according to their academic performance
One of the key methodological issues is the identification and classification of socially disadvantaged students. We use here a methodology based on the so-called national definition used in the report ‘Against the Odds’ (OECD, 2011).
First, it is necessary to define the set of socially disadvantaged students. In this sense, disadvantaged students are taken to be those positioned in the lowest quartile of the distribution index of economic, social, and cultural status (ESCS) 1 within each country, which is constructed from data collected by the PISA questionnaire for students. Similarly, since the main focus in PISA 2009 is on reading, we divided the distribution of scores on the reading comprehension test into quartiles for each of the analysed countries. From these divisions, two groups of students can be identified:
Disadvantaged low achievers (DLA). These students are located in the lowest quartile of the distribution of the ESCS index and obtained a score that is in the lowest quartile of the distribution for their country.
Disadvantaged high achievers (DHA). These students are also positioned in the lowest quartile of the distribution of the ESCS index, but they achieve scores that are located in the upper quartile of the distribution for their country.
Figure 1 shows the application of this methodology in the case of Germany. This figure demonstrates the relationship between socioeconomic status and the score obtained in the reading test for each student. Dotted lines delimit the quartiles of the distribution of the ESCS index and the score obtained in the reading test.
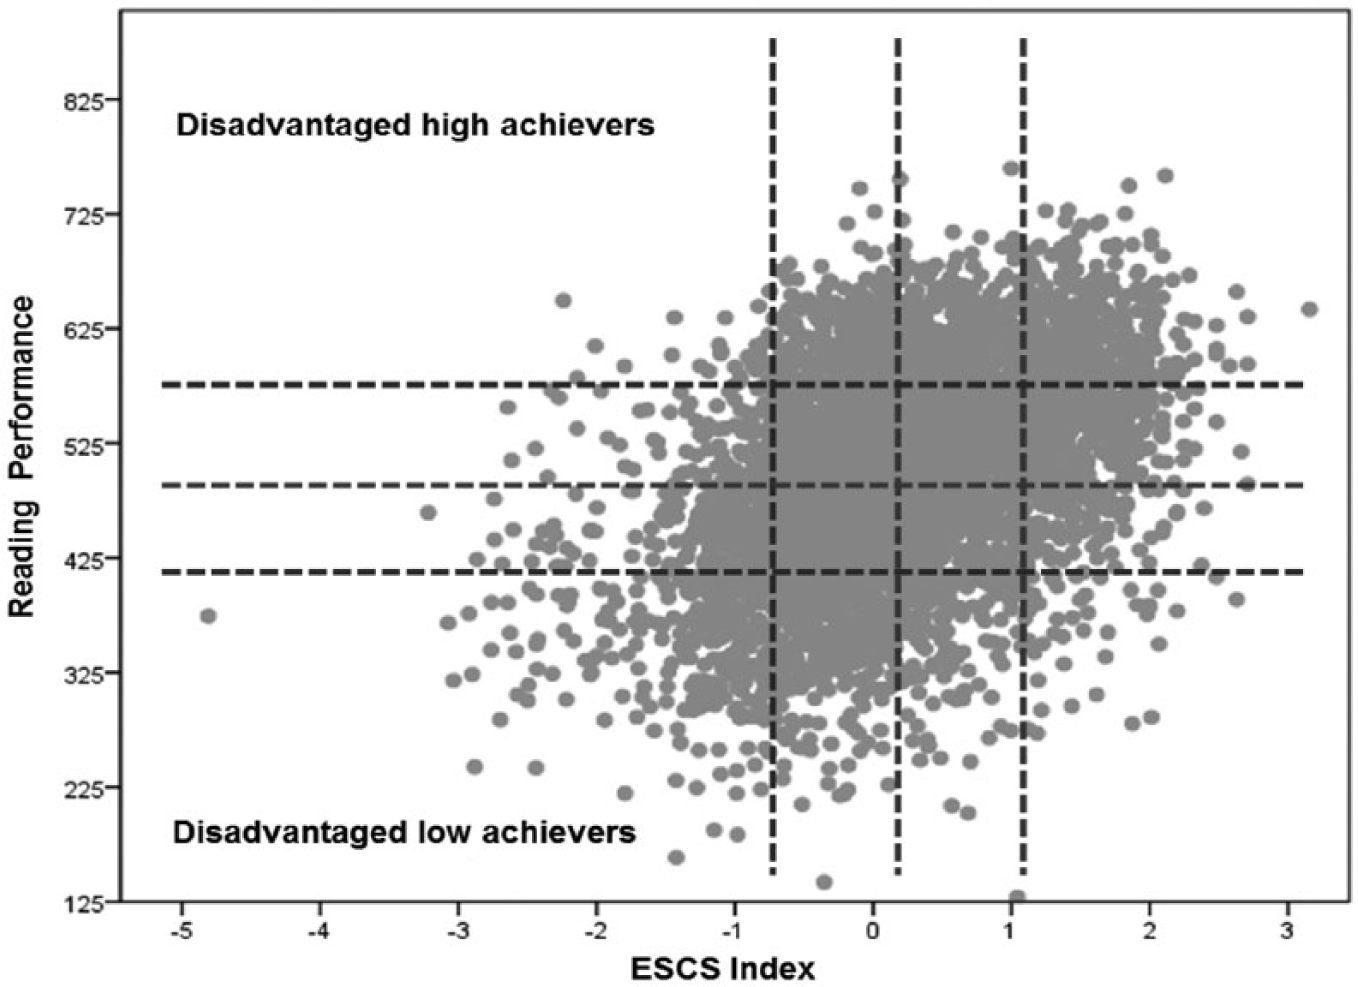
Score obtained in reading test and socioeconomic level. Germany.
The figure allows us to visually identify the two typologies of disadvantaged students: low achievers and high achievers. It should be noted that throughout the article the percentages of these two typologies of students are based on the total number of disadvantaged students and not on the total number of students from each country. Consequently, the results obtained should be easier to interpret.
Classification of educational systems
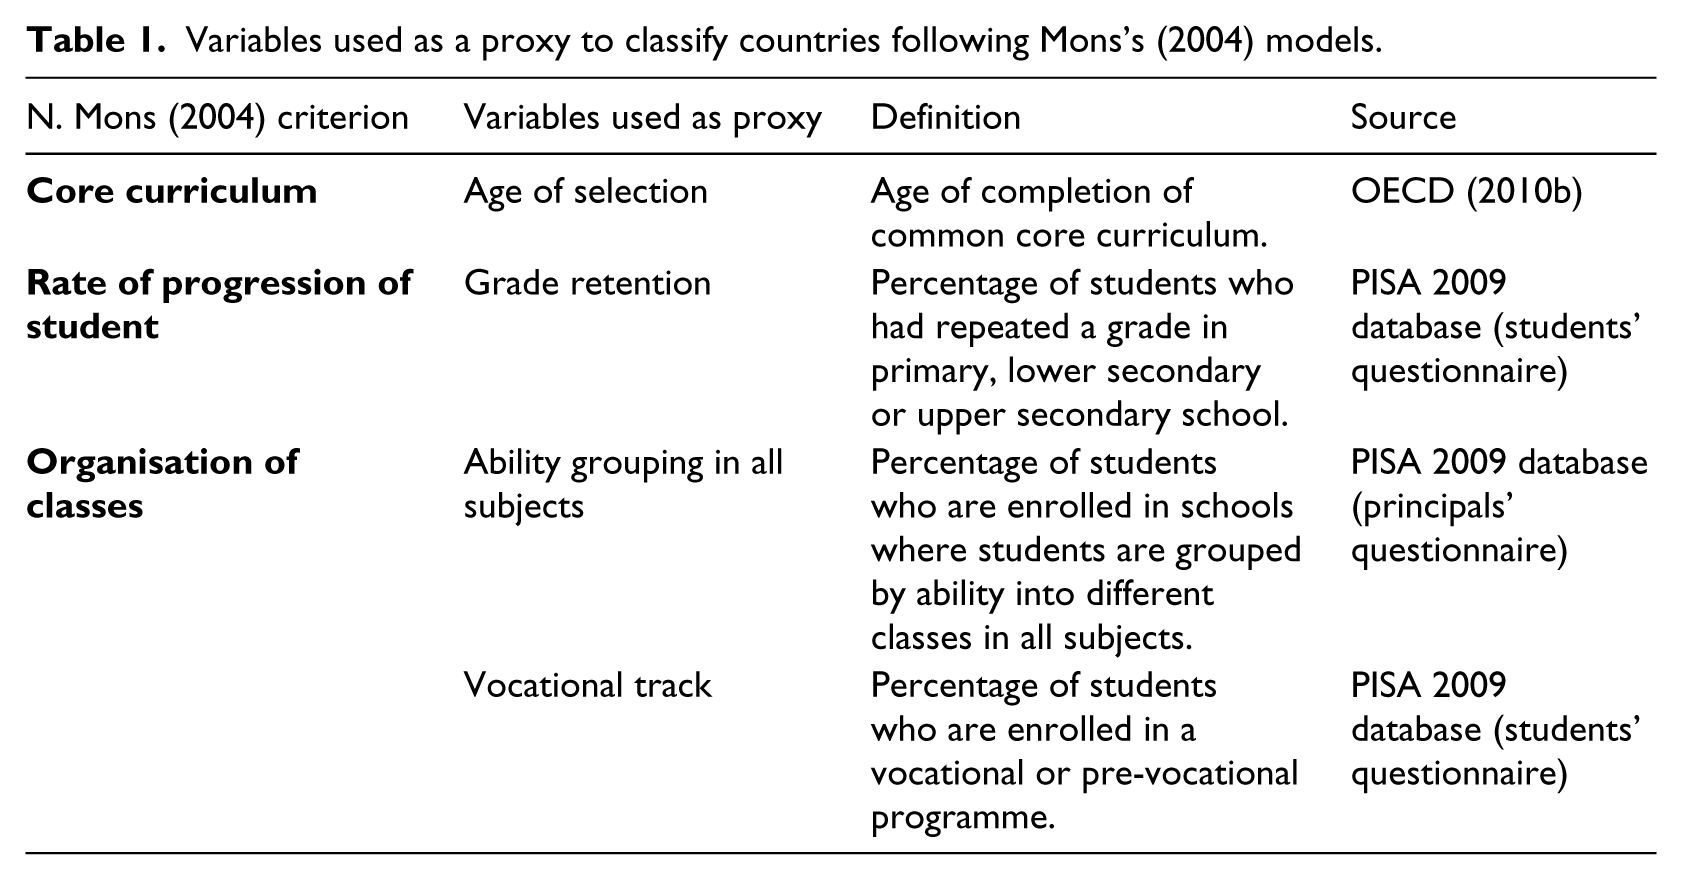
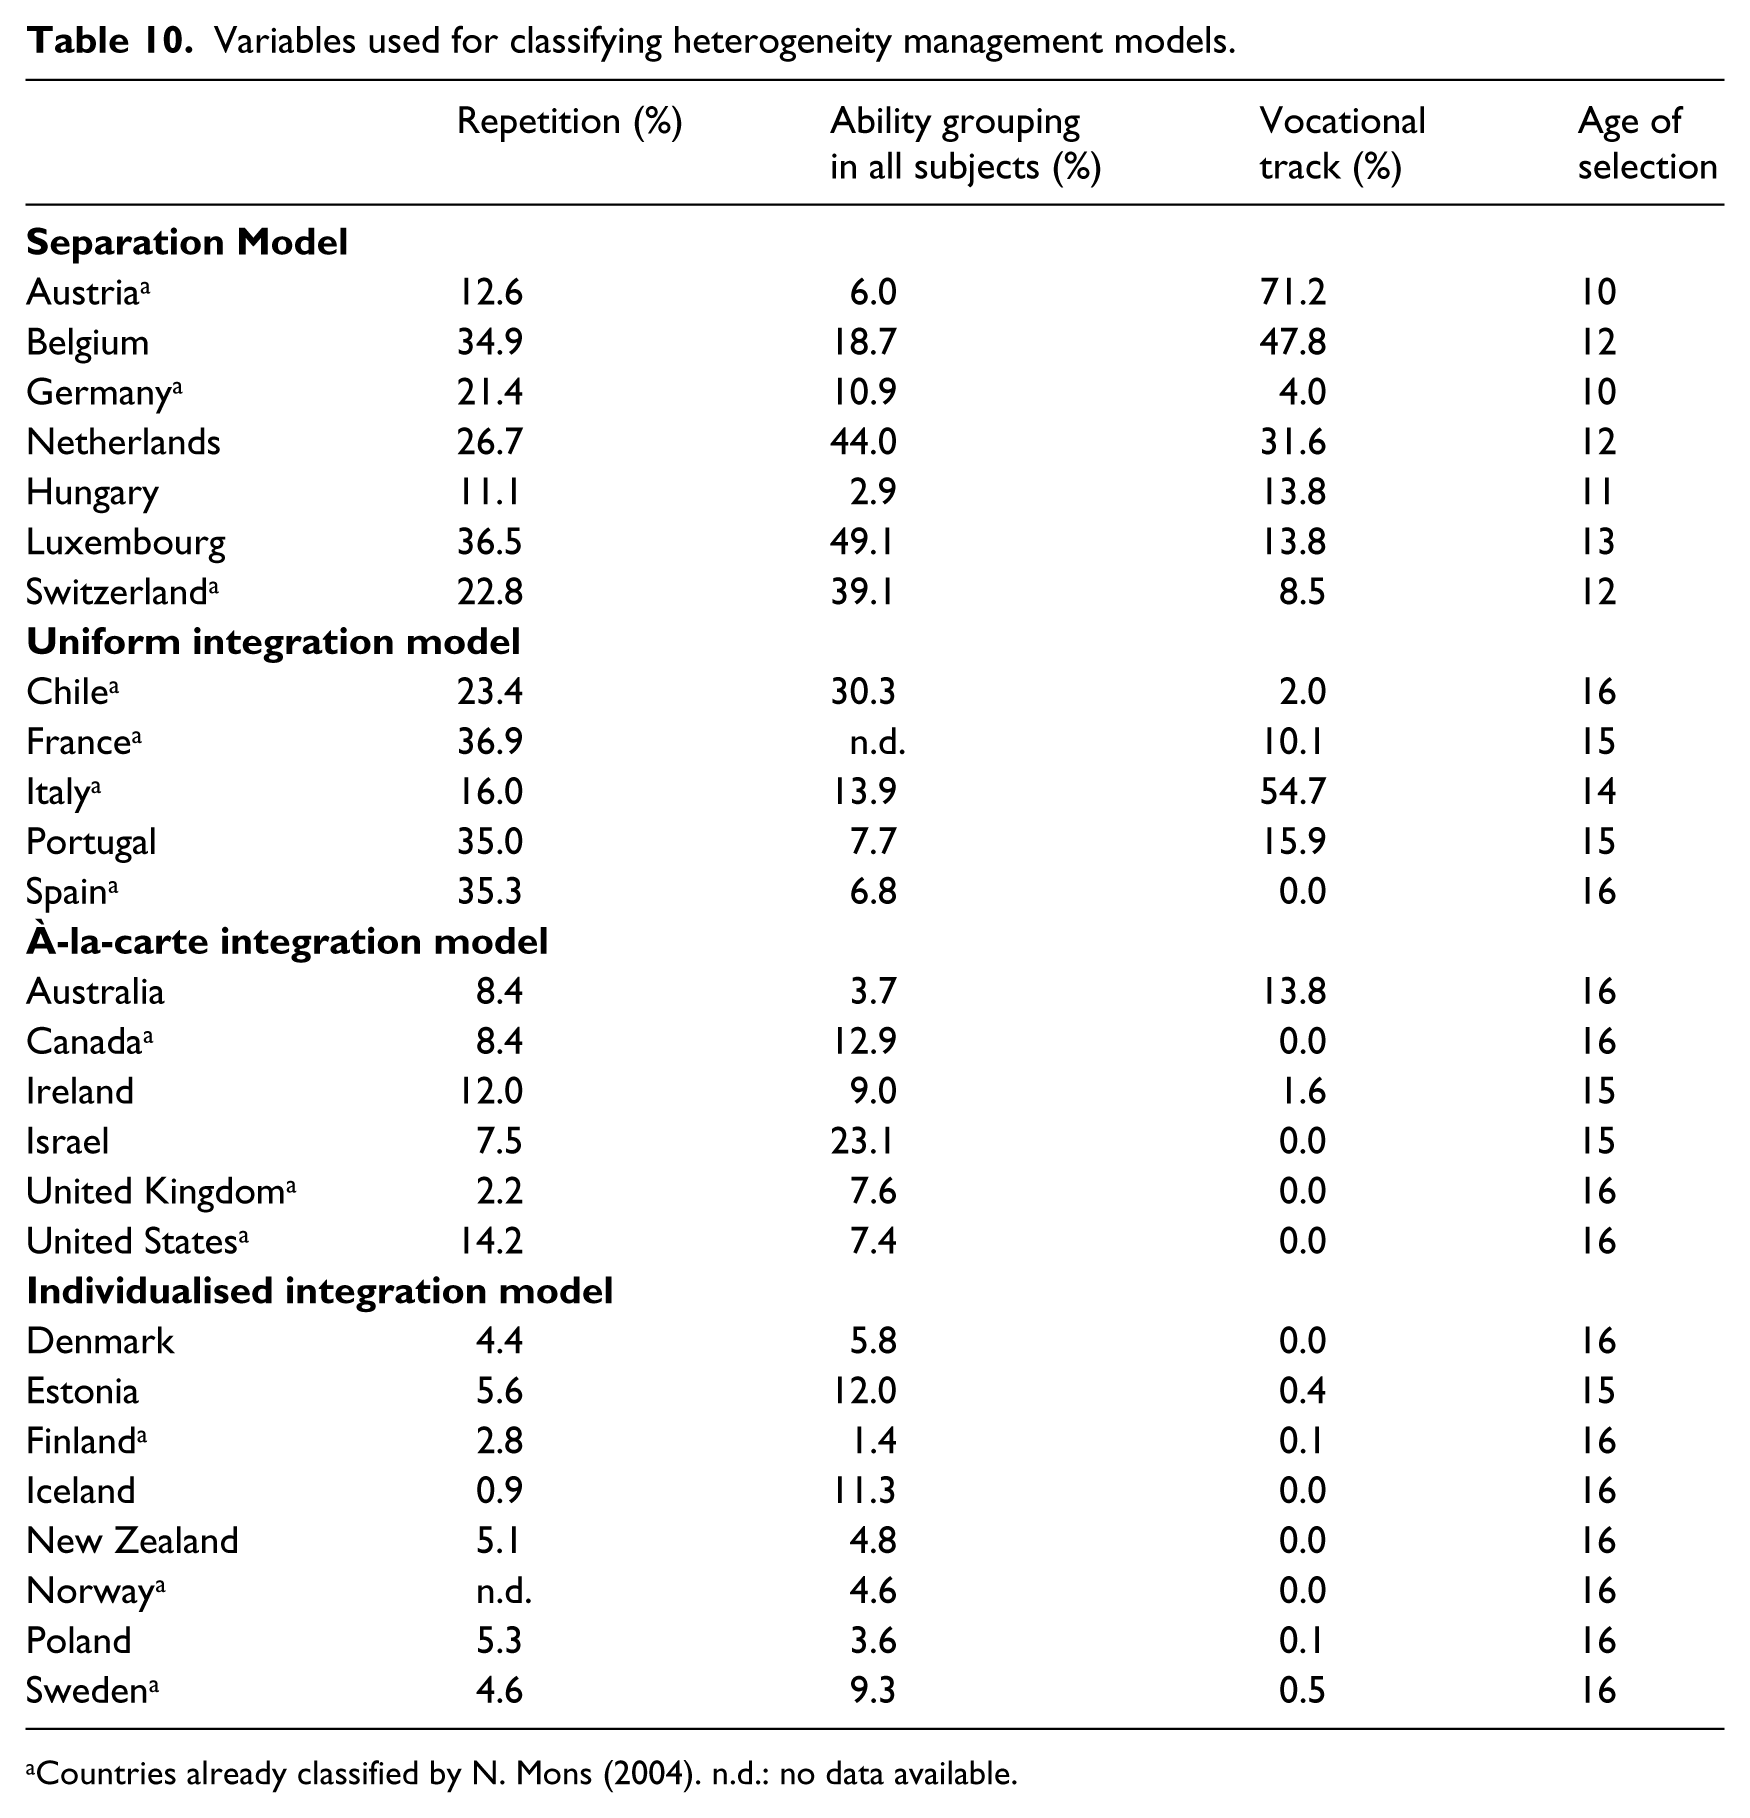
A second notable methodological issue is the process of classifying the analysed countries in terms of their different educational differentiation models. As noted in the literature review, the classification proposed by Mons (2004, 2007) is one of the most interesting and functional. Mons classifies the different heterogeneity management models into four categories: separation, uniform integration, à-la-carte integration, and individual integration. In order to group the set of OECD countries into the four categories, we utilise the methodology employed by Dupriez et al. (2008). This method consists of classifying the different educational systems according to a set of variables, presented in Table 1, which serves as a proxy for some of the key features of each category. In this case we used data from PISA 2009 (see Appendix 1). It is important to note that countries that had already been classified in Mons’s work have been assigned to the same category allocated in that study (indicated in Appendix 1). However, for most of those countries, the values of the variables correspond to the characteristics of the categories to which they have been assigned.
Variables used as a proxy to classify countries following Mons’s (2004) models.
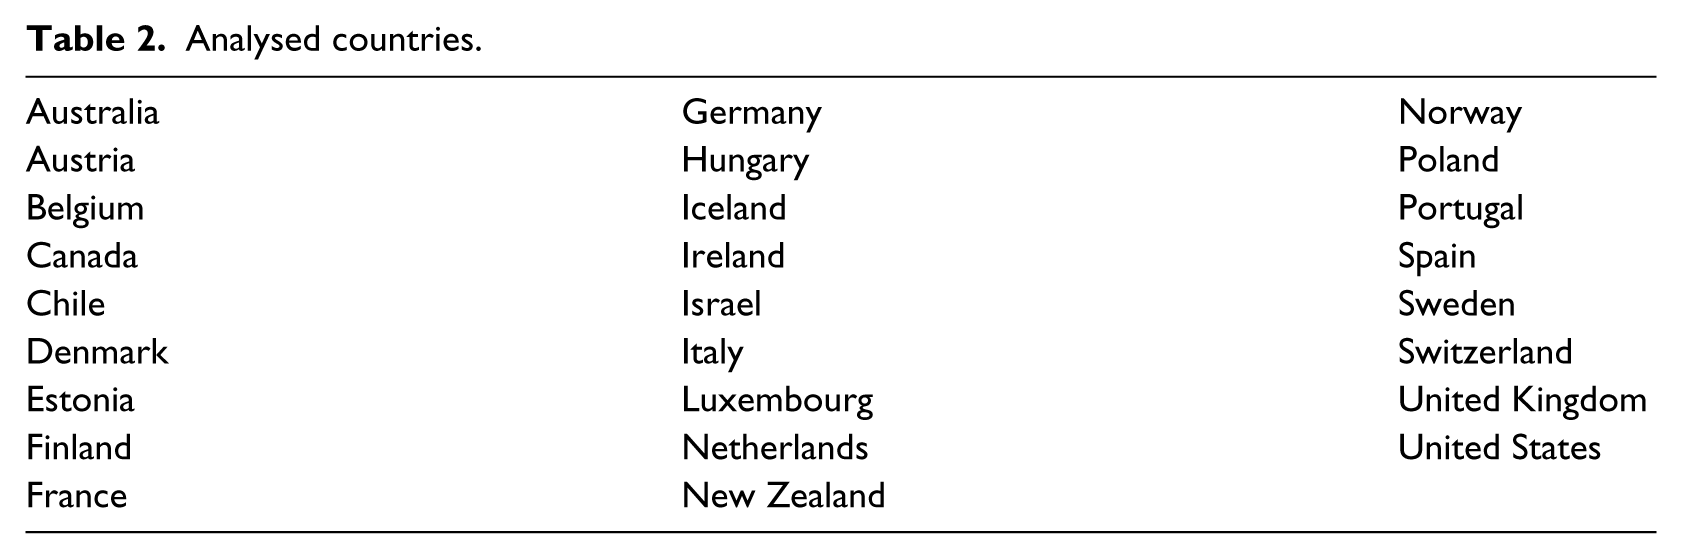
It should be noted that although Mexico and Turkey are part of the OECD, these two countries have been excluded from the analysis because the rate of schooling of the population aged 15 years, which is the target population in PISA, is lower than 90%. 2 Since the analysis focuses on socioeconomically disadvantaged students, it seems reasonable to assume that in these two countries the majority of students excluded from the school system belong to this population, and therefore to include them in the analysis could bias the results.
Other OECD countries have been excluded from the analysis since their classification in Mons’s models was difficult. First, the case of the Czech Republic and the Slovak Republic, whose school system separates students at early ages (as in the separation model) but that have low grade retention rates. Second, Greece, which was classified by Mons in the uniform integration model, but whose grade retention rates are very low. Third, Slovenia, whose school system makes little use of grade retention (as in the individualised integration model) but where there is a high proportion of students enrolled in a vocational track. And finally, Japan and Korea, which were classified by Mons in the individualised integration model, but also where there is a high proportion of students enrolled in a vocational track. We thus decided to exclude these countries from the analysis. Table 2 shows the set of analysed countries.
Analysed countries.
The first variable used to classify a country was the age of completion of the common core curriculum. Following Mons (2004), we consider that countries that separate students at age 13 or younger have a shorter common core curriculum, while countries that separate students from the age of 14 have a longer common core curriculum. This first variable generates a set of countries that can be grouped into the separation model. In these countries students are separated at an early age into different educational tracks. This model includes the following countries: Germany, Austria, Belgium, Luxembourg, Switzerland, Netherlands and Hungary.
The second variable used was the repetition rate, which provided information on the rate of progression of students. According to the repetition rate, two categories of countries were established: those with a low repetition rate or automatic promotion, and those with a high repetition rate. Based on this variable, together with the previous one, the group of countries belonging to the second model – the uniform integration model – can be identified: France, Italy, Spain, Portugal and Chile.
The third and fourth variables (percentage of ability grouping in all subjects and percentage of students on the vocational track) provide information on the degree of differentiation in the classroom according to the different educational tracks. On the one hand, we identify countries with higher percentages of students grouped by ability or students in vocational tracks. These countries are classified within the à-la-carte integration model, and they are: United Kingdom, USA, Canada, Australia, Ireland and Israel. Finally, countries with broad core curricula, automatic promotion, and low levels of differentiation in the classroom and between educational tracks, are grouped under the individualised integration model. They are: Finland, Norway, Sweden, Denmark, Iceland, Estonia, New Zealand and Poland.
Table 3 is a summary of the above, adapted from the work of Mons. It shows the criteria used in the classification of educational systems, as well as which systems correspond to each model.
Classification of educational systems according to educational differentiation models.
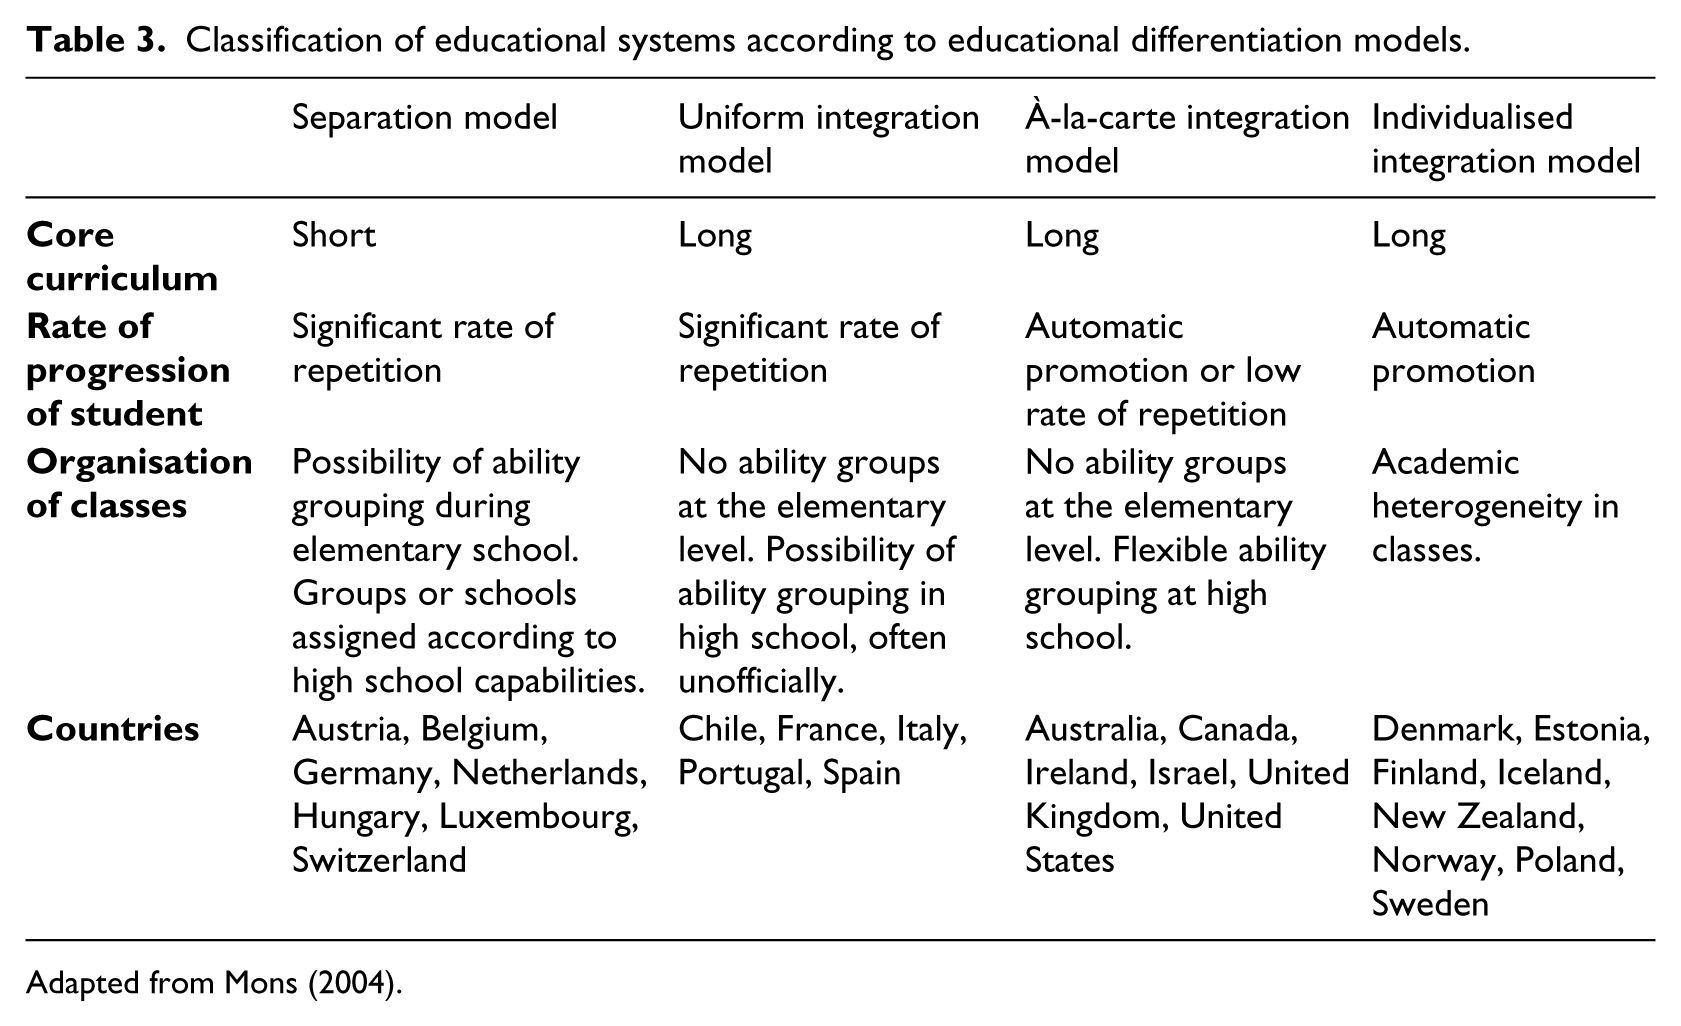
Adapted from Mons (2004).
Results
Disadvantaged students from a comparative perspective
As defined above, in terms of students of a low socioeconomic status (disadvantaged students), two subgroups can be distinguished according to reading scores obtained in PISA 2009: disadvantaged high achievers (DHA) and disadvantaged low achievers (DLA). In OECD countries, the percentage of students in each subgroup as compared to the total number of disadvantaged students provides information about the capacity of each educational system to promote, to a greater or lesser extent, the academic success of students from lower level social backgrounds.
Table 4 shows these percentages as a proportion of the total number of students with low socioeconomic status. In all analysed countries, among students of low socioeconomic status, the proportion of DLA exceeds the proportion of DHA. Therefore, it seems clear that students of a low socioeconomic status tend to obtain lower results. For example, DLA represent 35% of all low socioeconomic status students in Estonia, and 50.2% in Hungary.
Percentages of disadvantaged high achievers and disadvantaged low achievers across OECD countries.
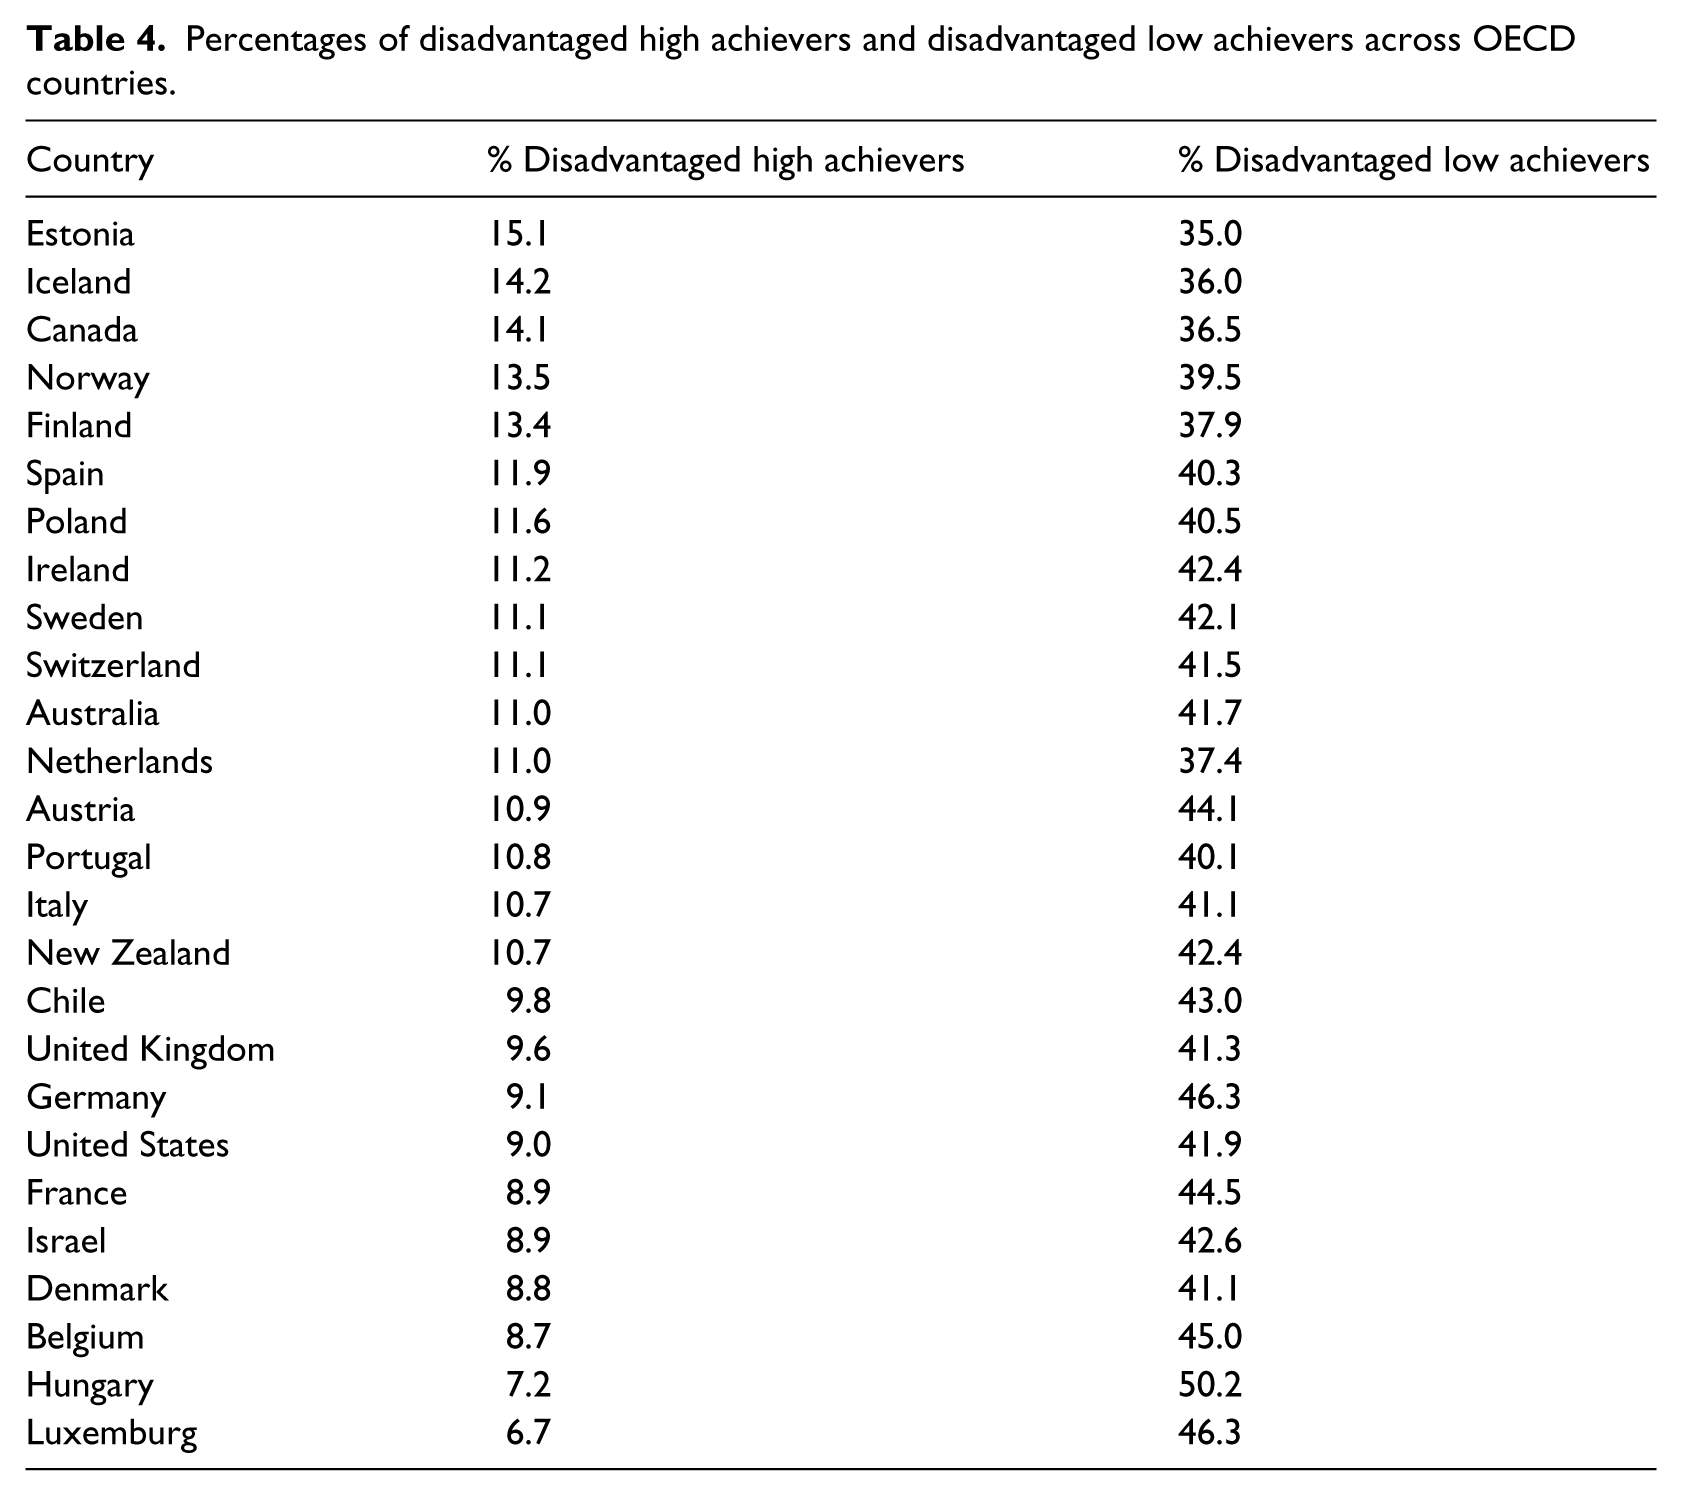
Yet the presence of some DHA also confirms the possibility that certain students, despite facing adverse conditions for their academic development, overcome these difficulties and achieve higher scores than expected. In analysed countries, the percentage of DHA ranges from 6.7% in Luxembourg to 15.1% in Estonia.
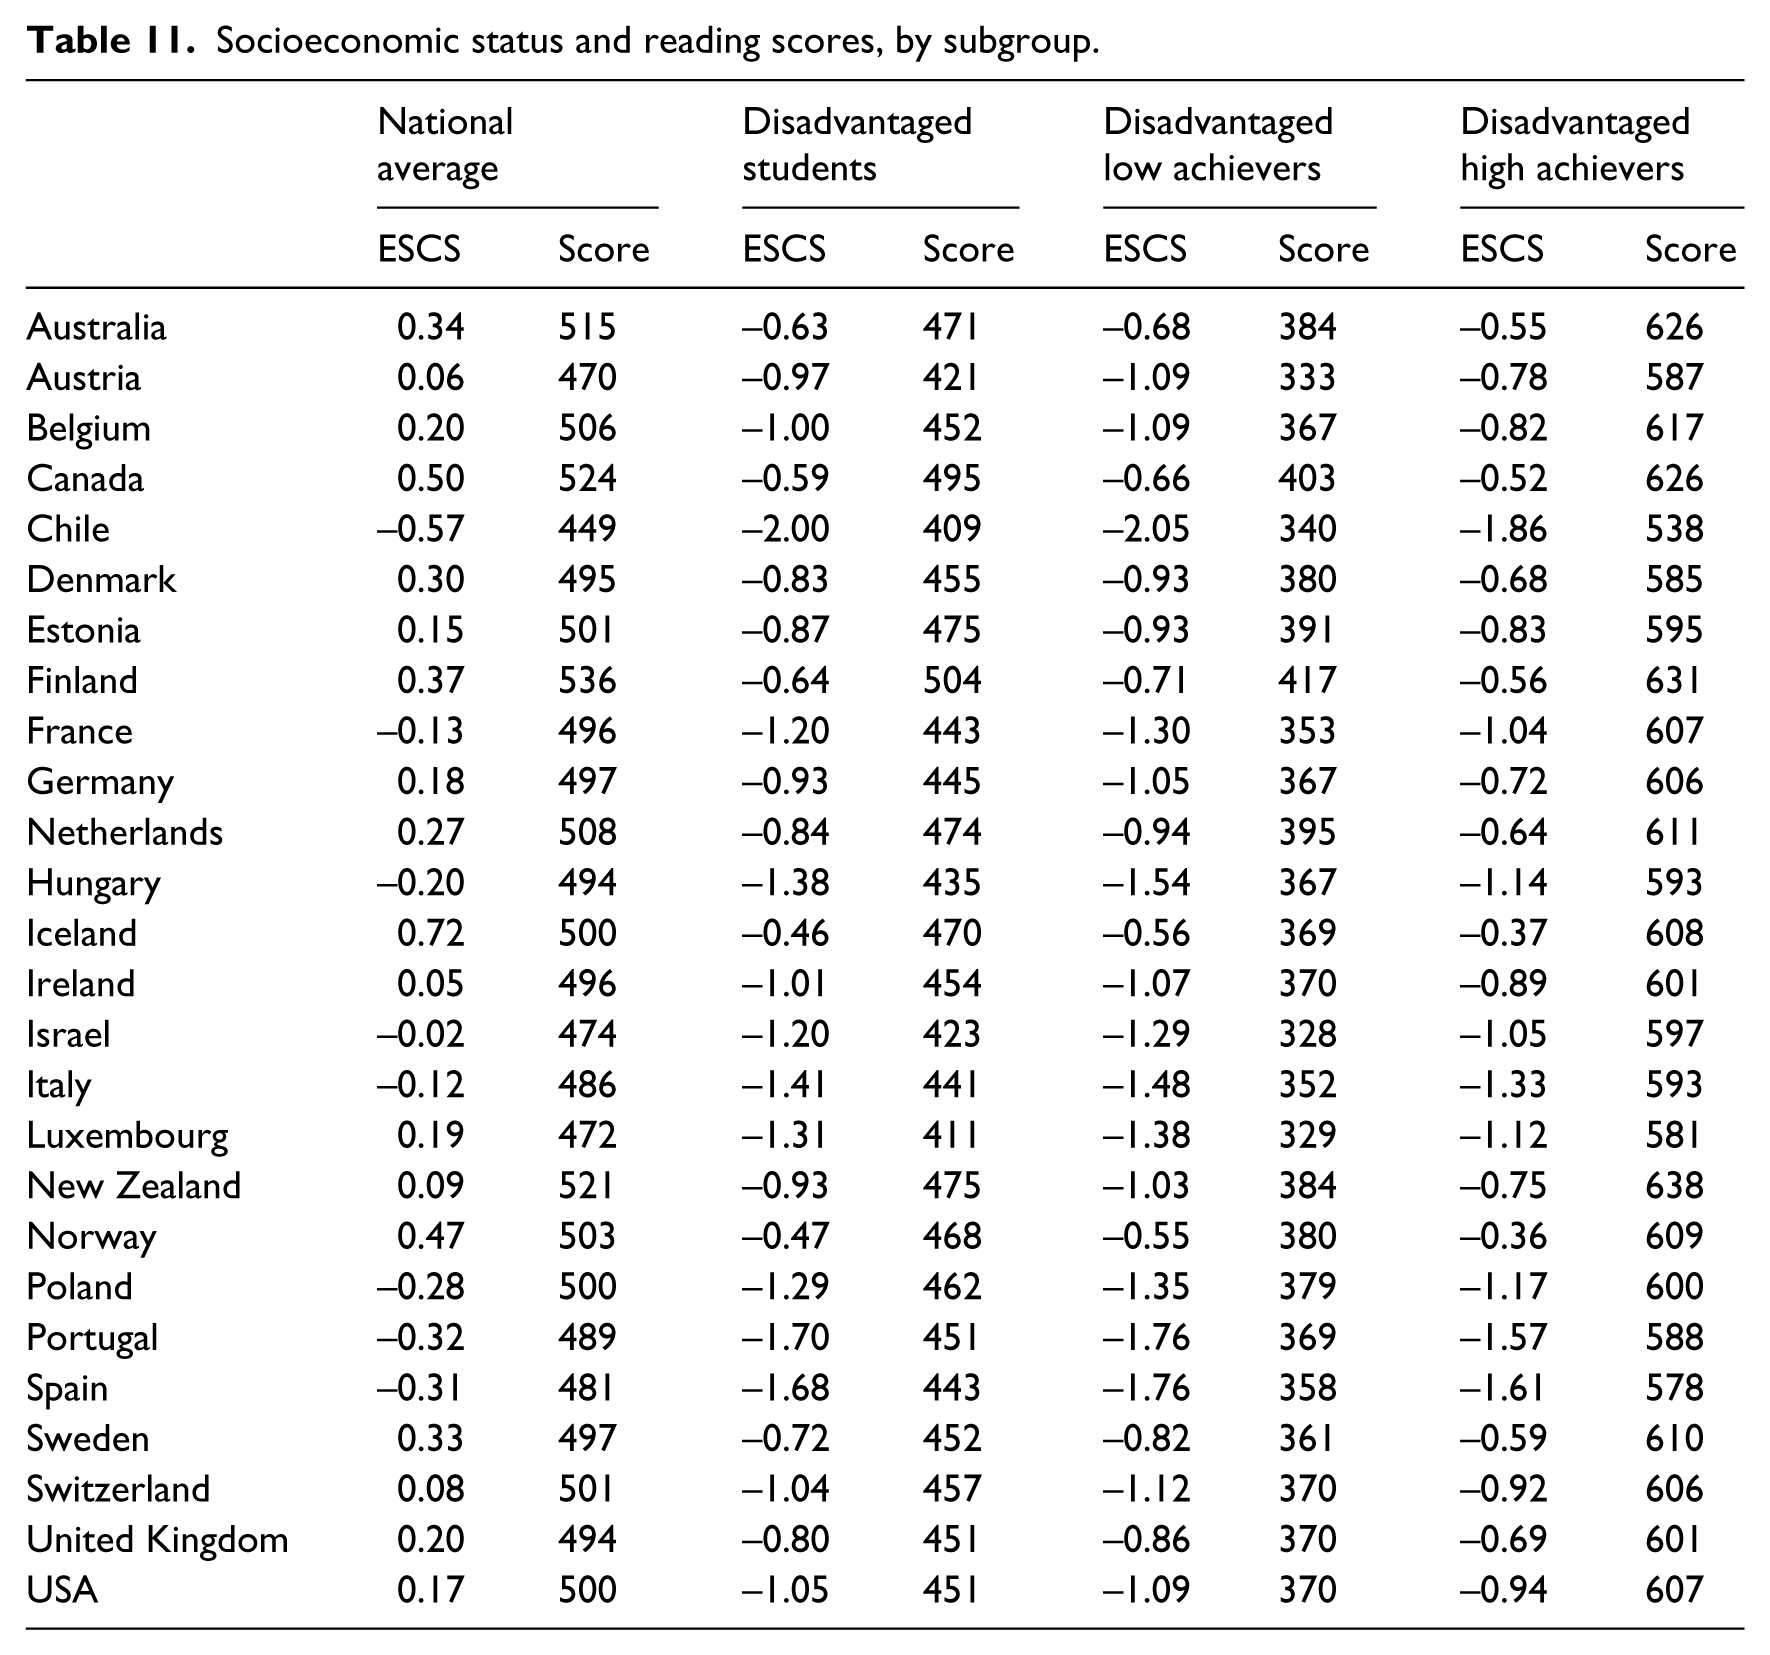
It is also interesting to analyse some of the characteristics of disadvantaged students, such as their average reading scores and the average value of their ESCS, as compared to all students. The analysed data (available in Appendix 2) tell us that DHA obtain, on average, around 230 points more in reading than DLA, and around 100 points more than the average for students in their country. It should also be noted that DHA always have a higher socioeconomic status than DLA, and the former have a socioeconomic status that is, on average, 25% higher than the latter.
Educational differentiation models and socially disadvantaged students
As noted above, based on data from PISA 2009, the OECD educational systems have been classified according to the four categories proposed by Mons (2004, 2007), and a set of analyses has been performed in relation to this classification and socially disadvantaged students.
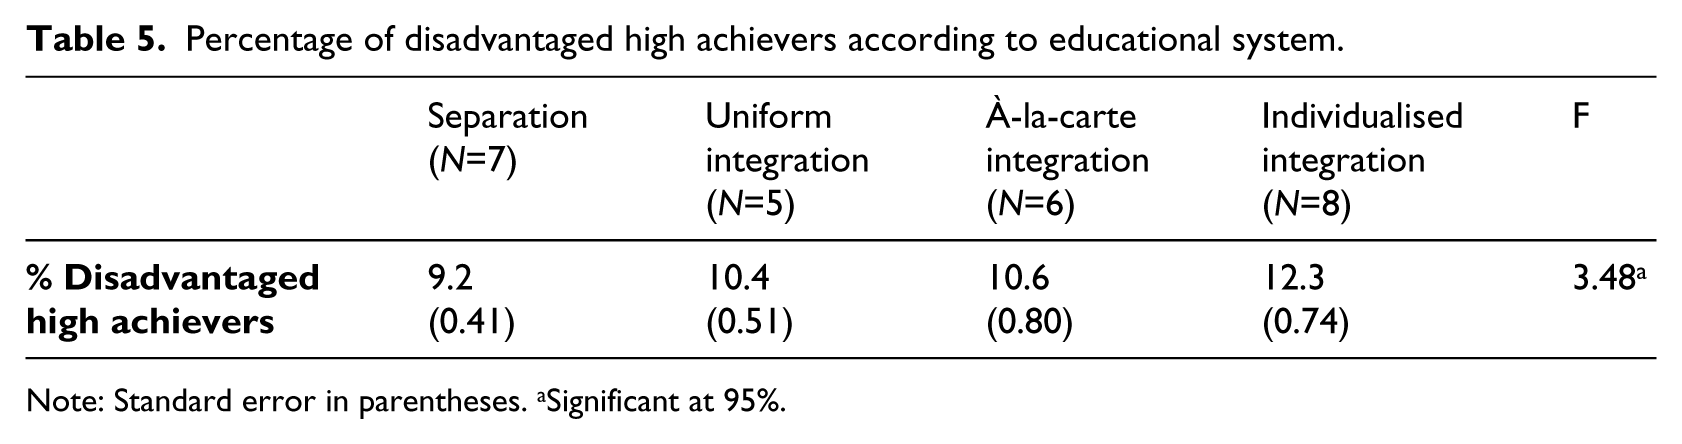
First, we present the average percentages of DHA and of DLA in each of these categories of countries. These results are shown in Table 5.
Percentage of disadvantaged high achievers according to educational system.
Note: Standard error in parentheses. aSignificant at 95%.
From the table we can observe that the average percentage of DHA students is greater for the integration models than for the separation model. The greatest difference is observed between the separation model (9.2%) and the individualised integration model (12.3%). Also in the case of DHA, the ANOVA test shows that there are some significant differences between groups.
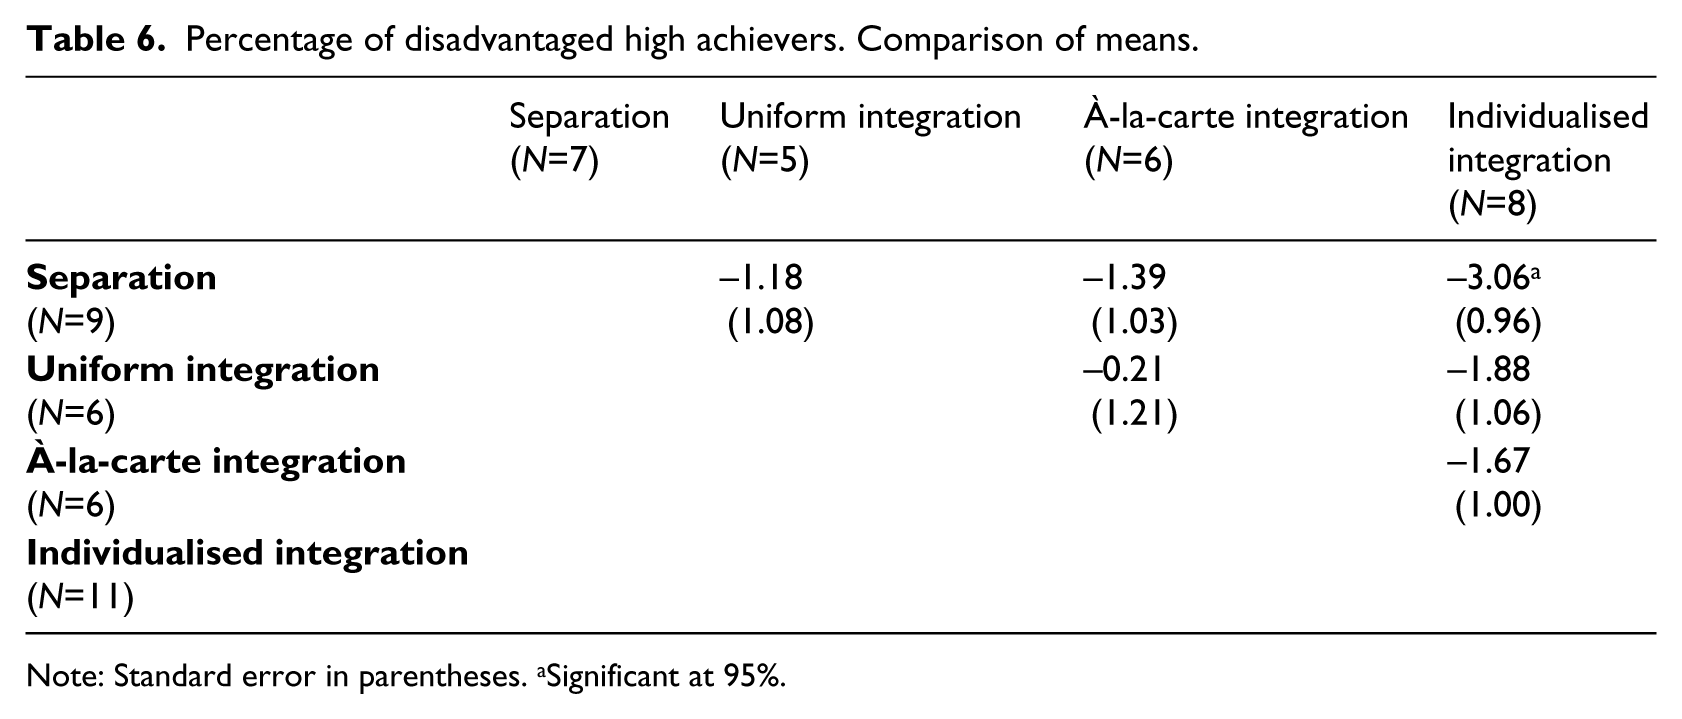
If we analyse in detail these differences in percentages of DHA across the four models by using Tukey’s post-hoc test for comparison of means (Table 6), we see that a significant difference only exists between the separation model and the individualised integration model. Even though they are not significant in the other cases, the greatest differences are observed between the individualised integration model and all of the other models.
Percentage of disadvantaged high achievers. Comparison of means.
Note: Standard error in parentheses. aSignificant at 95%.
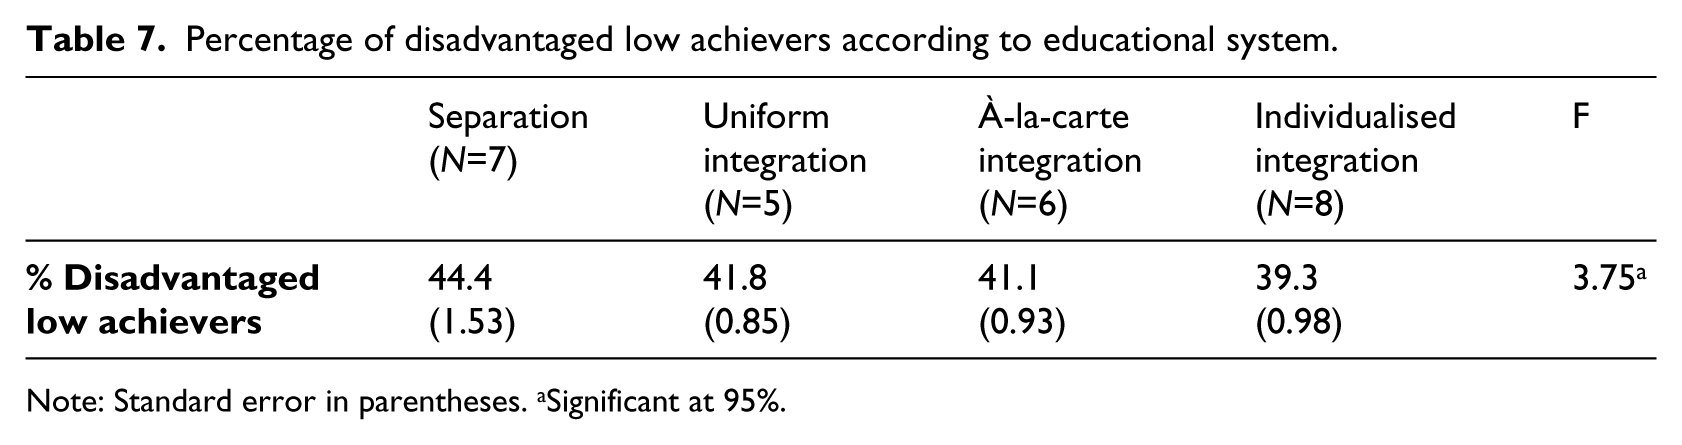
In the same vein, we have carried out an analysis of disadvantaged low achievers, and the results are displayed in Table 7. The table shows the average percentage of DLA for each of the educational system models. Here we observe that the separation model presents a higher average percentage of DLA (44.4%) and the individualised integration model is positioned with a lower percentage of this group of students (39.3%). In addition, the ANOVA test shows that, as a minimum, there are significant differences between some of the groups.
Percentage of disadvantaged low achievers according to educational system.
Note: Standard error in parentheses. aSignificant at 95%.
Table 8 shows the comparison of means for the percentage of DLA. As in the case of DHA students, the only significant statistical difference is between the separation model and the individualised integration model. Thus, the average percentage of DLA is five points higher in the countries included in the separation model than those in the individualised integration model.
Percentage of disadvantaged low achievers. Comparison of means.
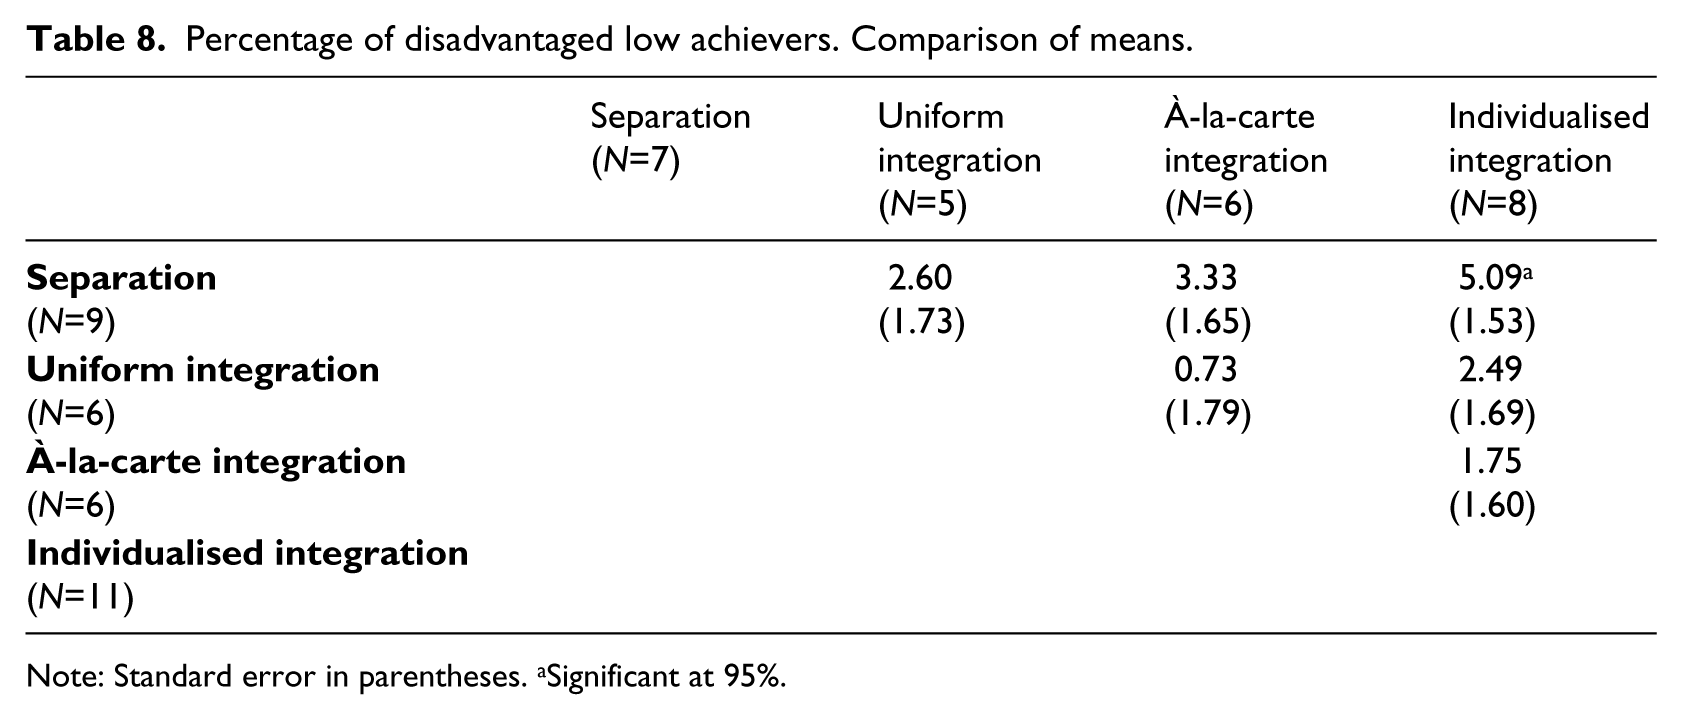
Note: Standard error in parentheses. aSignificant at 95%.
After having independently analysed the two groups of disadvantaged students (DHA and DLA), we consider whether there is a relationship between the percentages of these subgroups in each of the analysed countries, and the extent to which this corresponds to the different heterogeneity management models. Figure 2 attempts to answer these two questions. It presents the percentage of DLA (horizontal axis) and the percentage of DHA (vertical axis). In addition, the dotted lines indicate the average percentage of DLA and DHA students for all analysed countries, by identifying four quadrants.
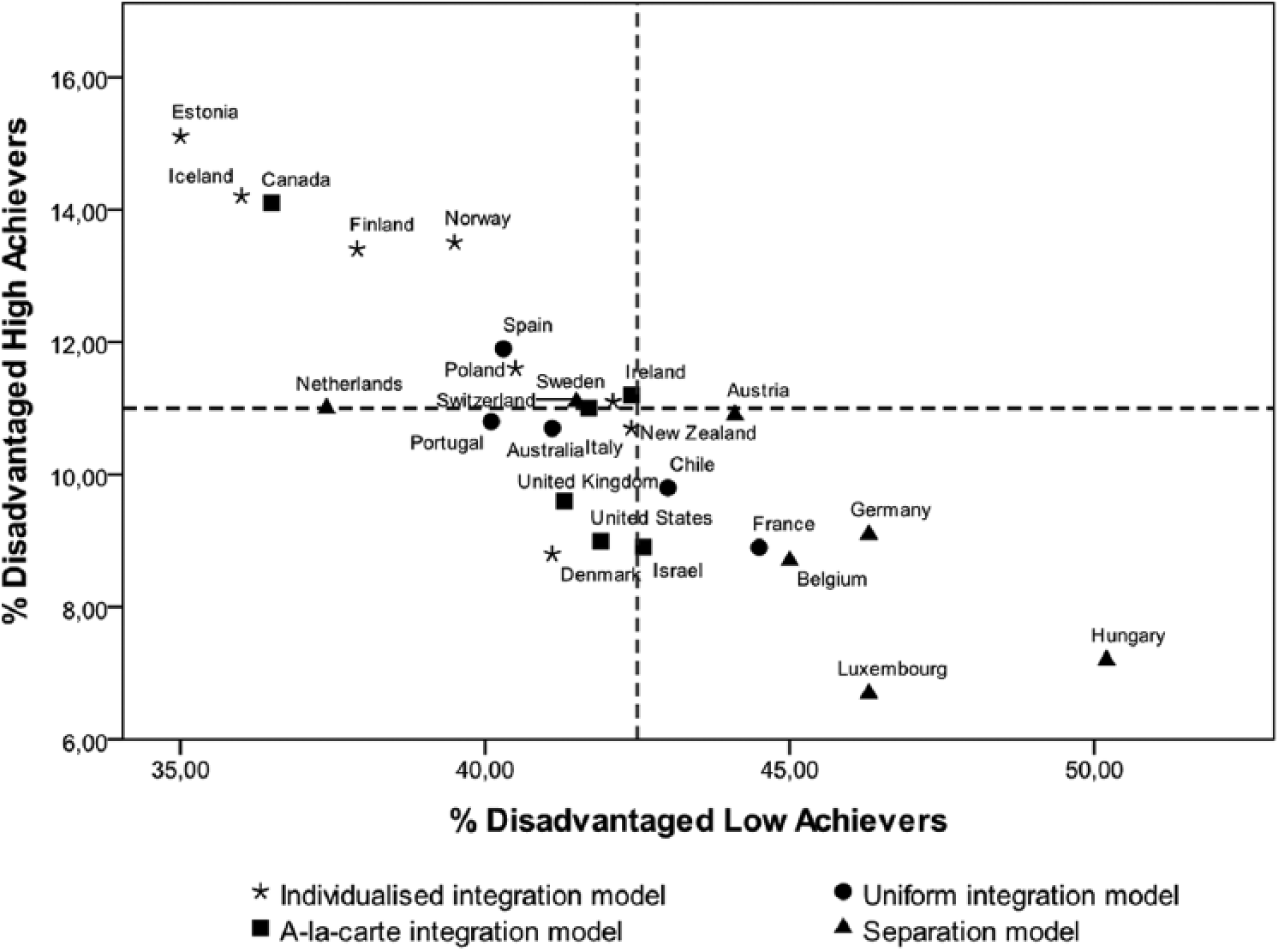
Percentage of disadvantaged high achievers and disadvantaged low achievers.
First, it is worth highlighting the negative relationship demonstrated between the percentage of DLA and the percentage of DHA in all analysed countries. The negative relationship between the percentages of these two types of students is significant but not necessarily determinant (R2 = 0.75). For example, Netherlands and Ireland, despite similar percentages of DHA, have very different percentages of DLA.
Second, the analysis of the relationship between the percentage of DHA and DLA from the perspective of the heterogeneity management models also generates some interesting results. First, we look at the upper left quadrant (the set of countries with higher percentages of DHA and lower percentages of DLA), in which educational systems based on the individualised integration model are predominant. In the lower right quadrant (countries with higher percentages of DLA and lower percentages of DHA), it is worth noting the predominance of the separation model. For the uniform integration model and the à-la-carte integration model, there is no clear relationship between the percentage of DLA and the percentage of DHA.
To respond to the second research question, we present a multilevel regression across analysed countries to estimate the effect of the different heterogeneity management models, especially on disadvantaged students’ scores. The regression is based on two different levels, students and countries, and the dependent variable is the reading performance in PISA 2009. For this purpose we analyse the effect of management models on the whole of students, and we introduce a variable to identify disadvantaged students, not only high or low achievers, and other variables to estimate the interaction between these students and the heterogeneity management models. Table 9 shows the results of the multilevel analysis. The variables used in the analysis are:
Reading performance in PISA 2009, as the dependent variable.
Disadvantaged student: identifies the students located in the lowest quartile of the distribution of the ESCS index.
Heterogeneity management models: a variable for each model has been created. The uniform integration model has not been introduced in the analysis to avoid the effect of collinearity. We select this management model as a reference group because it is the model that includes fewer countries.
Interaction effects: an interaction between each management model and the condition of being a disadvantaged student has been introduced in the analysis. A negative coefficient of this interaction means that the disadvantaged student’s performance is worse than their more advantaged peers and a positive coefficient means the opposite.
Effects of disadvantaged background and heterogeneity management models on reading performance in PISA 2009.
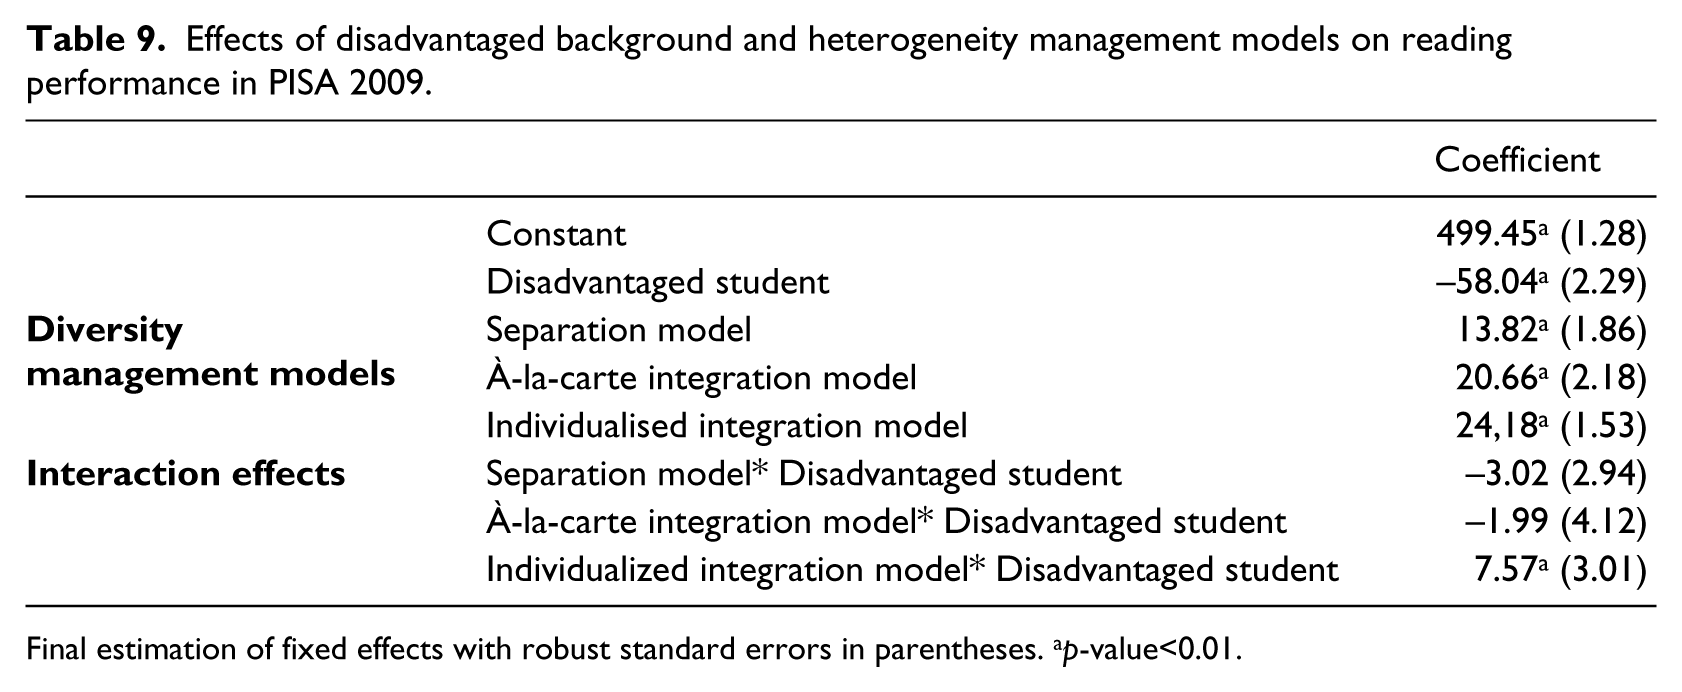
Final estimation of fixed effects with robust standard errors in parentheses. ap-value<0.01.
All independent variables are dichotomous, where value 1 represents the presence of the feature, and value 0 represents the absence of this feature.
The analysis shows three relevant results. As was expected, the disadvantaged students perform on average 58 points below the non-disadvantaged students. Second, the most comprehensive models generate a positive effect on the average of reading scores. Finally, controlling for the other variables, the individualised integration model has a positive effect on the reading performance of disadvantaged students, while in the other cases the effect of its interaction is not significant.
Conclusions
The situation of disadvantaged students in different educational systems has, in recent years, begun to appear as an object of study as well as a relevant element of educational policies (OECD, 2011, 2012). In this sense, the main objective of this article was to determine the role of the heterogeneity management models in the academic performance of socially disadvantaged students.
First, it is worth noting that the percentage of disadvantaged low achievers is much higher than the percentage of disadvantaged high achievers in the OECD countries. In addition, the differences in the percentages of these two groups of students in all analysed countries are minimal. This phenomenon can be explained by our decision to study countries with similar socioeconomic characteristics (Sandoval-Hernandez and Cortés, 2012). The fact that the ESCS values for DHA are higher (in all analysed countries) than those for DLA is another of the remarkable findings of this analysis. This result suggests that even among the group of socially disadvantaged students, socioeconomic status generates an impact on academic performance, or at least that it is necessary to have a certain SES in order to obtain better academic results.
The categorisation of differentiation policies in educational systems proposed by Mons (2004, 2007) provides an appropriate framework for studying the impact of these policies on disadvantaged students. Generally, results show how educational systems with higher levels of integration are better able to promote educational success among socially disadvantaged students and to reduce the number of disadvantaged students obtaining low scores. Clearly, these results should be interpreted with caution because, as we have seen, the relationship between the performance of disadvantaged students and the heterogeneity management policies is not completely deterministic. As proof of this, no significant differences in the models considered to be intermediate, that is, the uniform integration model and the à-la-carte integration model, have been identified. However, when analysing the results of socially disadvantaged students, the individualised integration model seems to be the most successful. It is necessary to consider a possible limitation of Mons’s classification because we do not observe differences between the uniform integration model and the à-la-carte integration model. It is possible that the definition of these two models is not specific enough to capture the differentiation policies’ effects.
The multilevel analysis allows controlling for the effect of differentiation policies in the whole group of students, isolating the direct effect of these policies on disadvantaged students’ performance. The results show that the individualised integration model particularly affects positively students from low socioeconomic backgrounds.
In this sense, our results are consistent with recent evidence about the effects of these types of policies (Dupriez, 2010; Hallinan et al., 2003; Ireson and Hallam, 1999; OECD, 2011; Schofield, 2010). A large amount of research has examined the effects of the system level policies on inequities and particularly on disadvantaged students. They conclude that policies like grade retention or early tracking affect negatively the level of equality of opportunities and the success of socioeconomically disadvantaged students (OECD, 2011).
In view of these results, in future studies it would be appropriate to expand the analysis of the effects of other factors related to educational policies on the achievements of disadvantaged students. For example, structural inequalities such as school segregation could explain part of the educational success or performance of socially disadvantaged students. It would be equally interesting to explore holistic models to assess the impact, not only of educational policies, but also of individual, family and institutional characteristics on disadvantaged students’ outcomes. A thorough analysis of these factors would allow us to determine effective strategies to improve the educational situation of these students.
Footnotes
Appendix 1. Variables used for classifying heterogeneity management models
Variables used for classifying heterogeneity management models.
| Repetition (%) | Ability grouping in all subjects (%) | Vocational track (%) | Age of selection | |
|---|---|---|---|---|
|
|
||||
| Austria a | 12.6 | 6.0 | 71.2 | 10 |
| Belgium | 34.9 | 18.7 | 47.8 | 12 |
| Germany a | 21.4 | 10.9 | 4.0 | 10 |
| Netherlands | 26.7 | 44.0 | 31.6 | 12 |
| Hungary | 11.1 | 2.9 | 13.8 | 11 |
| Luxembourg | 36.5 | 49.1 | 13.8 | 13 |
| Switzerland a | 22.8 | 39.1 | 8.5 | 12 |
|
|
||||
| Chile a | 23.4 | 30.3 | 2.0 | 16 |
| France a | 36.9 | n.d. | 10.1 | 15 |
| Italy a | 16.0 | 13.9 | 54.7 | 14 |
| Portugal | 35.0 | 7.7 | 15.9 | 15 |
| Spain a | 35.3 | 6.8 | 0.0 | 16 |
|
|
||||
| Australia | 8.4 | 3.7 | 13.8 | 16 |
| Canada a | 8.4 | 12.9 | 0.0 | 16 |
| Ireland | 12.0 | 9.0 | 1.6 | 15 |
| Israel | 7.5 | 23.1 | 0.0 | 15 |
| United Kingdom a | 2.2 | 7.6 | 0.0 | 16 |
| United States a | 14.2 | 7.4 | 0.0 | 16 |
|
|
||||
| Denmark | 4.4 | 5.8 | 0.0 | 16 |
| Estonia | 5.6 | 12.0 | 0.4 | 15 |
| Finland a | 2.8 | 1.4 | 0.1 | 16 |
| Iceland | 0.9 | 11.3 | 0.0 | 16 |
| New Zealand | 5.1 | 4.8 | 0.0 | 16 |
| Norway a | n.d. | 4.6 | 0.0 | 16 |
| Poland | 5.3 | 3.6 | 0.1 | 16 |
| Sweden a | 4.6 | 9.3 | 0.5 | 16 |
Countries already classified by N. Mons (2004). n.d.: no data available.
Appendix 2. Socioeconomic status and reading scores,by subgroup
Socioeconomic status and reading scores, by subgroup.
| National average |
Disadvantaged students |
Disadvantaged low achievers |
Disadvantaged high achievers |
|||||
|---|---|---|---|---|---|---|---|---|
| ESCS | Score | ESCS | Score | ESCS | Score | ESCS | Score | |
| Australia | 0.34 | 515 | −0.63 | 471 | −0.68 | 384 | −0.55 | 626 |
| Austria | 0.06 | 470 | −0.97 | 421 | −1.09 | 333 | −0.78 | 587 |
| Belgium | 0.20 | 506 | −1.00 | 452 | −1.09 | 367 | −0.82 | 617 |
| Canada | 0.50 | 524 | −0.59 | 495 | −0.66 | 403 | −0.52 | 626 |
| Chile | −0.57 | 449 | −2.00 | 409 | −2.05 | 340 | −1.86 | 538 |
| Denmark | 0.30 | 495 | −0.83 | 455 | −0.93 | 380 | −0.68 | 585 |
| Estonia | 0.15 | 501 | −0.87 | 475 | −0.93 | 391 | −0.83 | 595 |
| Finland | 0.37 | 536 | −0.64 | 504 | −0.71 | 417 | −0.56 | 631 |
| France | −0.13 | 496 | −1.20 | 443 | −1.30 | 353 | −1.04 | 607 |
| Germany | 0.18 | 497 | −0.93 | 445 | −1.05 | 367 | −0.72 | 606 |
| Netherlands | 0.27 | 508 | −0.84 | 474 | −0.94 | 395 | −0.64 | 611 |
| Hungary | −0.20 | 494 | −1.38 | 435 | −1.54 | 367 | −1.14 | 593 |
| Iceland | 0.72 | 500 | −0.46 | 470 | −0.56 | 369 | −0.37 | 608 |
| Ireland | 0.05 | 496 | −1.01 | 454 | −1.07 | 370 | −0.89 | 601 |
| Israel | −0.02 | 474 | −1.20 | 423 | −1.29 | 328 | −1.05 | 597 |
| Italy | −0.12 | 486 | −1.41 | 441 | −1.48 | 352 | −1.33 | 593 |
| Luxembourg | 0.19 | 472 | −1.31 | 411 | −1.38 | 329 | −1.12 | 581 |
| New Zealand | 0.09 | 521 | −0.93 | 475 | −1.03 | 384 | −0.75 | 638 |
| Norway | 0.47 | 503 | −0.47 | 468 | −0.55 | 380 | −0.36 | 609 |
| Poland | −0.28 | 500 | −1.29 | 462 | −1.35 | 379 | −1.17 | 600 |
| Portugal | −0.32 | 489 | −1.70 | 451 | −1.76 | 369 | −1.57 | 588 |
| Spain | −0.31 | 481 | −1.68 | 443 | −1.76 | 358 | −1.61 | 578 |
| Sweden | 0.33 | 497 | −0.72 | 452 | −0.82 | 361 | −0.59 | 610 |
| Switzerland | 0.08 | 501 | −1.04 | 457 | −1.12 | 370 | −0.92 | 606 |
| United Kingdom | 0.20 | 494 | −0.80 | 451 | −0.86 | 370 | −0.69 | 601 |
| USA | 0.17 | 500 | −1.05 | 451 | −1.09 | 370 | −0.94 | 607 |
Acknowledgements
The authors acknowledge the technical assistance of Pablo Zoido (OECD) and Vincent Dupriez (UCL). The authors also wish to acknowledge the anonymous reviewers for their detailed and helpful comments on the manuscript. This article is dedicated to the memory of Professor Ferran Ferrer, from Autonomous University of Barcelona, who passed away in July 2013.
Declaration of conflicting interest
The authors declare that there is no conflict of interest.
Funding
This article was produced within the project EXEDE ‘Success and Educational Inequalities in Disadvantaged Schools’ (Spanish Ministry of Economy 2012-2014, EDU2011-23473).