
Abstract
The mate retention inventory (MRI) has been a valuable tool in the field of evolutionary psychology for the past 30 years. The goal of the current research is to subject the MRI to rigorous psychometric analysis using item response theory to answer three broad questions. Do the individual items of the MRI fit the scale well? Does the overall function of the MRI match what is predicted? Finally, do men and women respond similarly to the MRI? Using a graded response model, it was found that all but two of the items fit acceptable model patterns. Test information function analysis found that the scale acceptably captures individual differences for participants with a high degree of mate retention but the scale is lacking in capturing information from participants with a low degree of mate retention. Finally, discriminate item function analysis reveals that the MRI is better at assessing male than female participants, indicating that the scale may not be the best indicator of female behavior in a relationship. Overall, we conclude that the MRI is a good scale, especially for assessing male behavior, but it could be improved for assessing female behavior and individuals lower on overall mate retention behavior. It is suggested that this paper be used as a framework for how the newest psychometrics techniques can be applied in order to create more robust and valid measures in the field of evolutionary psychology.
The Mate Retention Inventory
The mate retention inventory (MRI) was initially developed to explore one-half of the behaviors associated with what researchers referred to as mating effort: behaviors associated with attracting and then retaining a mate (Buss, 1988). Buss (1988) developed the MRI using a process referred to as act nomination and act frequency.
As part of the initial development of the MRI, the 104-item scale was logically organized into 19 distinct sets of acts which would be referred to as the 19 mate retention tactics (Buss, 1988). Examples of tactics are Enhancing Physical Appearance (e.g., “He made sure he looked nice for her”) and Violence (e.g., “He slapped a guy who made a pass at her”). These tactics were further categorized as either being intrasexual or intersexual manipulations. Intrasexual manipulations involving items that deal with conspecifics of the same sex (e.g., “He stared coldly at other guys who were looking at her”) and intersexual manipulations involving items that deal with an opposite-sex mate (e.g., “He gave in to her every wish”).
Buss et al. (2008) shortened the MRI to 38 items. Of note is that the short form of the MRI was designed specifically to maintain the 19 tactics that were laid out in the original development of the scale. Two items were selected from each tactic with the highest item-total correlation to be retained in the short form of the scale (Buss et al., 2008). The total scores of the short form of the MRI were found to be correlated with the long form (r = 0.96) providing evidence that the short form was adequate for capturing the construct (Buss et al., 2008).
In his original paper, Buss (1988) found sex differences associated with the frequency that men and women utilize different tactics. Further studies have found that the MRI is often consistent with hypotheses grounded in evolutionary theory. For example, men's mate retention tactics are related to partner youth and physical attractiveness while women's mate retention tactics are related to partner wealth and ambition (Buss & Shackelford, 1997). Similarly, Goetz et al. (2005) found men mated to more attractive and flirtatious partners who engage in more mate retention tactics.
In studies of marital satisfaction, it was found that frequency of mate retention tactics is negatively correlated with marital satisfaction but not with marital length, which the authors argue implies that men and women may be differentially willing to inflict costs on their partners for the goal of lengthening the relationship (Shackelford & Buss, 2000). In more recent studies, couples with biological children were found to be more likely to employ mate retention tactics (Barbaro et al., 2016). The MRI has been assessed for the reliability of the tactics being measured. Shackelford et al. (2005) asked men and women in a romantic relationship to estimate their own usage of mate retention tactics and the usage of tactics by their partners. Indeed, it was found that spouses are reliably able to estimate the extent of mate retention tactics used by their partner (with a couple of notable but predictable exceptions according to the authors).
The MRI, and more recently the short form, has been used in a myriad of studies to predict other aspects of behavior. Mate retention has been found to predict performing oral sex (Pham & Shackelford, 2013), predict partner-directed violence from men (Shackelford et al., 2005), predict the frequency with which women pretend orgasm (Kaighobadi et al., 2012), has been illustrated as an example of a behavior that is affected by women's usage of hormonal-based birth control (Welling et al., 2012), has been expanded to include coalitional versions of mate retention (Pham et al., 2015), and has been adapted into use in Brazil (Lopes et al., 2016).
These studies illustrate the widespread use of the mate retention inventory-short form (MRI-SF) and the rich theoretical framework with which it has been built upon. The goal of the current study is to explore a deeper psychometric analysis of this inventory using the item response theory (IRT). The current study will serve two primary functions. First, due to the widespread use of the scale, it is necessary to critically assess the functionality of the overall scale and individual items. Second, this study is designed to serve as a framework for how IRT-based analyses can broaden and enrich the research done within the field of evolutionary psychology by applying a more rigorous psychometric approach to scale development and validation.
To that end, the MRI-SF will be assessed with three goals in mind. First, individual items will be analyzed to assess their psychometric properties. Second, the overall function of the scale will be assessed to determine among which levels of mate retention the MRI-SF operates best. Finally, the MRI-SF will be assessed in terms of sex differences to determine if the scale functions similarly and provides relatively equal amounts of information for both sexes.
Item Response Theory
Although a full overview of the IRT is beyond the scope of this paper, given the relative scarcity of this technique in the evolutionary psychology literature, a brief description of the technique is warranted. IRT is a model-based psychometric tool that analyzes the relationship between a respondent's standing on the latent trait being measured (in this case, the degree to which they engage in mate retention) and the probability of endorsing an item at a particular level (i.e., responding Agree or Strongly Agree to the item “Snooped through my partner's personal belongings”). Each model yields a particular set of item parameters that describe the shape of the function relating a person to an item. As detailed below, these parameters describe how well an item differentiates between similar individuals and what range of trait scores the item best represents. Different models offer different parameterizations depending on the nature of the item and construct being measured, and model–data fit analyses enable an objective understanding of the appropriateness of any given model to a particular dataset. IRT also enables the use of a wide variety of powerful tools for understanding the psychometric properties of a scale, including appropriateness measurement (Zickar & Drasgow, 1996), computerized adaptive testing (Thompson & Weiss, 2011), and, illustrated in this paper, differential item functioning (DIF) (Tay et al., 2015). IRT has been adopted by several other areas of psychology, including clinical (Reise & Waller, 2009) and industrial-organizational (Foster et al., 2017), and has been greatly utilized in educational testing environments for many decades (Hambleton et al., 1991; Weiss & Kingsbury, 1984). To further facilitate the understanding of the methodology, greater detail is provided throughout the manuscript as each aspect of the technique is illustrated. Interested readers are directed to Embretson and Reise (2000) and de Ayala (2009) for in-depth overviews of IRT as well as Zickar (2012) and Zickar and Broadfoot (2009) for comparisons of IRT and classical test theory methodologies.
Methods
Participants
259 participants (55% female) were recruited through Facebook and Reddit (r/samplesize subreddit). The recruitment message invited heterosexual individuals currently in a long-term relationship to take a survey on differences in human sexuality. The participants were offered no compensation for participation. The age of the participants ranged from 18 to 40 with a mean of 25.7 years (s = 5.7). All of the remaining participants reported that they were heterosexual. In terms of relationship status, 24% of the sample was married, 28% were in a serious relationship and cohabitating, 45% were in a serious relationship but not cohabitating, and 3% were in an uncommitted relationship. The average length of their relationships was 5.7 years (s = 3.7). Participants reported overwhelmingly having at least some caucasian descent (91%), with some identifying as Black/African-American (4%) and Native American descent (3%). Some participants identified having some Southeast Asian descent (4%). 5.8% of participants reported some Hispanic ethnicity.
The MRI-SF was administered through SurveyMonkey and asks participants to respond to a series of prompts regarding their past behavior toward their romantic partner. Participants respond to the MRI-SF on a 4-point Likert-type scale (0 - Never performed this act; 1 = Rarely performed this act; 2 = Sometimes performed this act; 3 = Often performed this act) considering how often they perform each of the acts prompted in the MRI-SF.
Model
As noted above, IRT contains many different models to choose from, and which model is used should be based on the nature of the data and construct being measured. Because items on the MRI-SF have four response options, the Graded Response Model (GRM; Samejima, 1969) was chosen. The GRM models two types of item parameters. First is the discrimination parameter, a, which determines the slope of the item response curve relating participant trait levels to a given response; a higher level of a yields a steeper curve, meaning that the item does a good job differentiating between people who have similar levels of the trait being measured. Second, the GRM estimates a set of threshold parameters, b. Each threshold indicates how high or low on the trait being measured (i.e., the tendency to engage in mate retention behaviors) a person would have to be to move up one level of endorsement to the item (i.e., moving from Agree to Strongly Agree). For an item with k response options, there are k – 1 threshold parameters estimated.
Because there are many available models to choose from in IRT, the choice of a particular model must be demonstrated as appropriate empirically as well as theoretically. This is achieved by assessing model–data fit for each individual item. Fit assessment is an active area of research (Nye et al., 2020) and an item is generally considered to be well-fit by a model if it has a χ²-to-degree of freedom ratio of less than 3.0 (Drasgow et al., 1995). All analyses were performed using the “mirt” package (Chalmers, 2012) in the R software environment (R Core Team, 2017).
Results
Preliminary Analyses
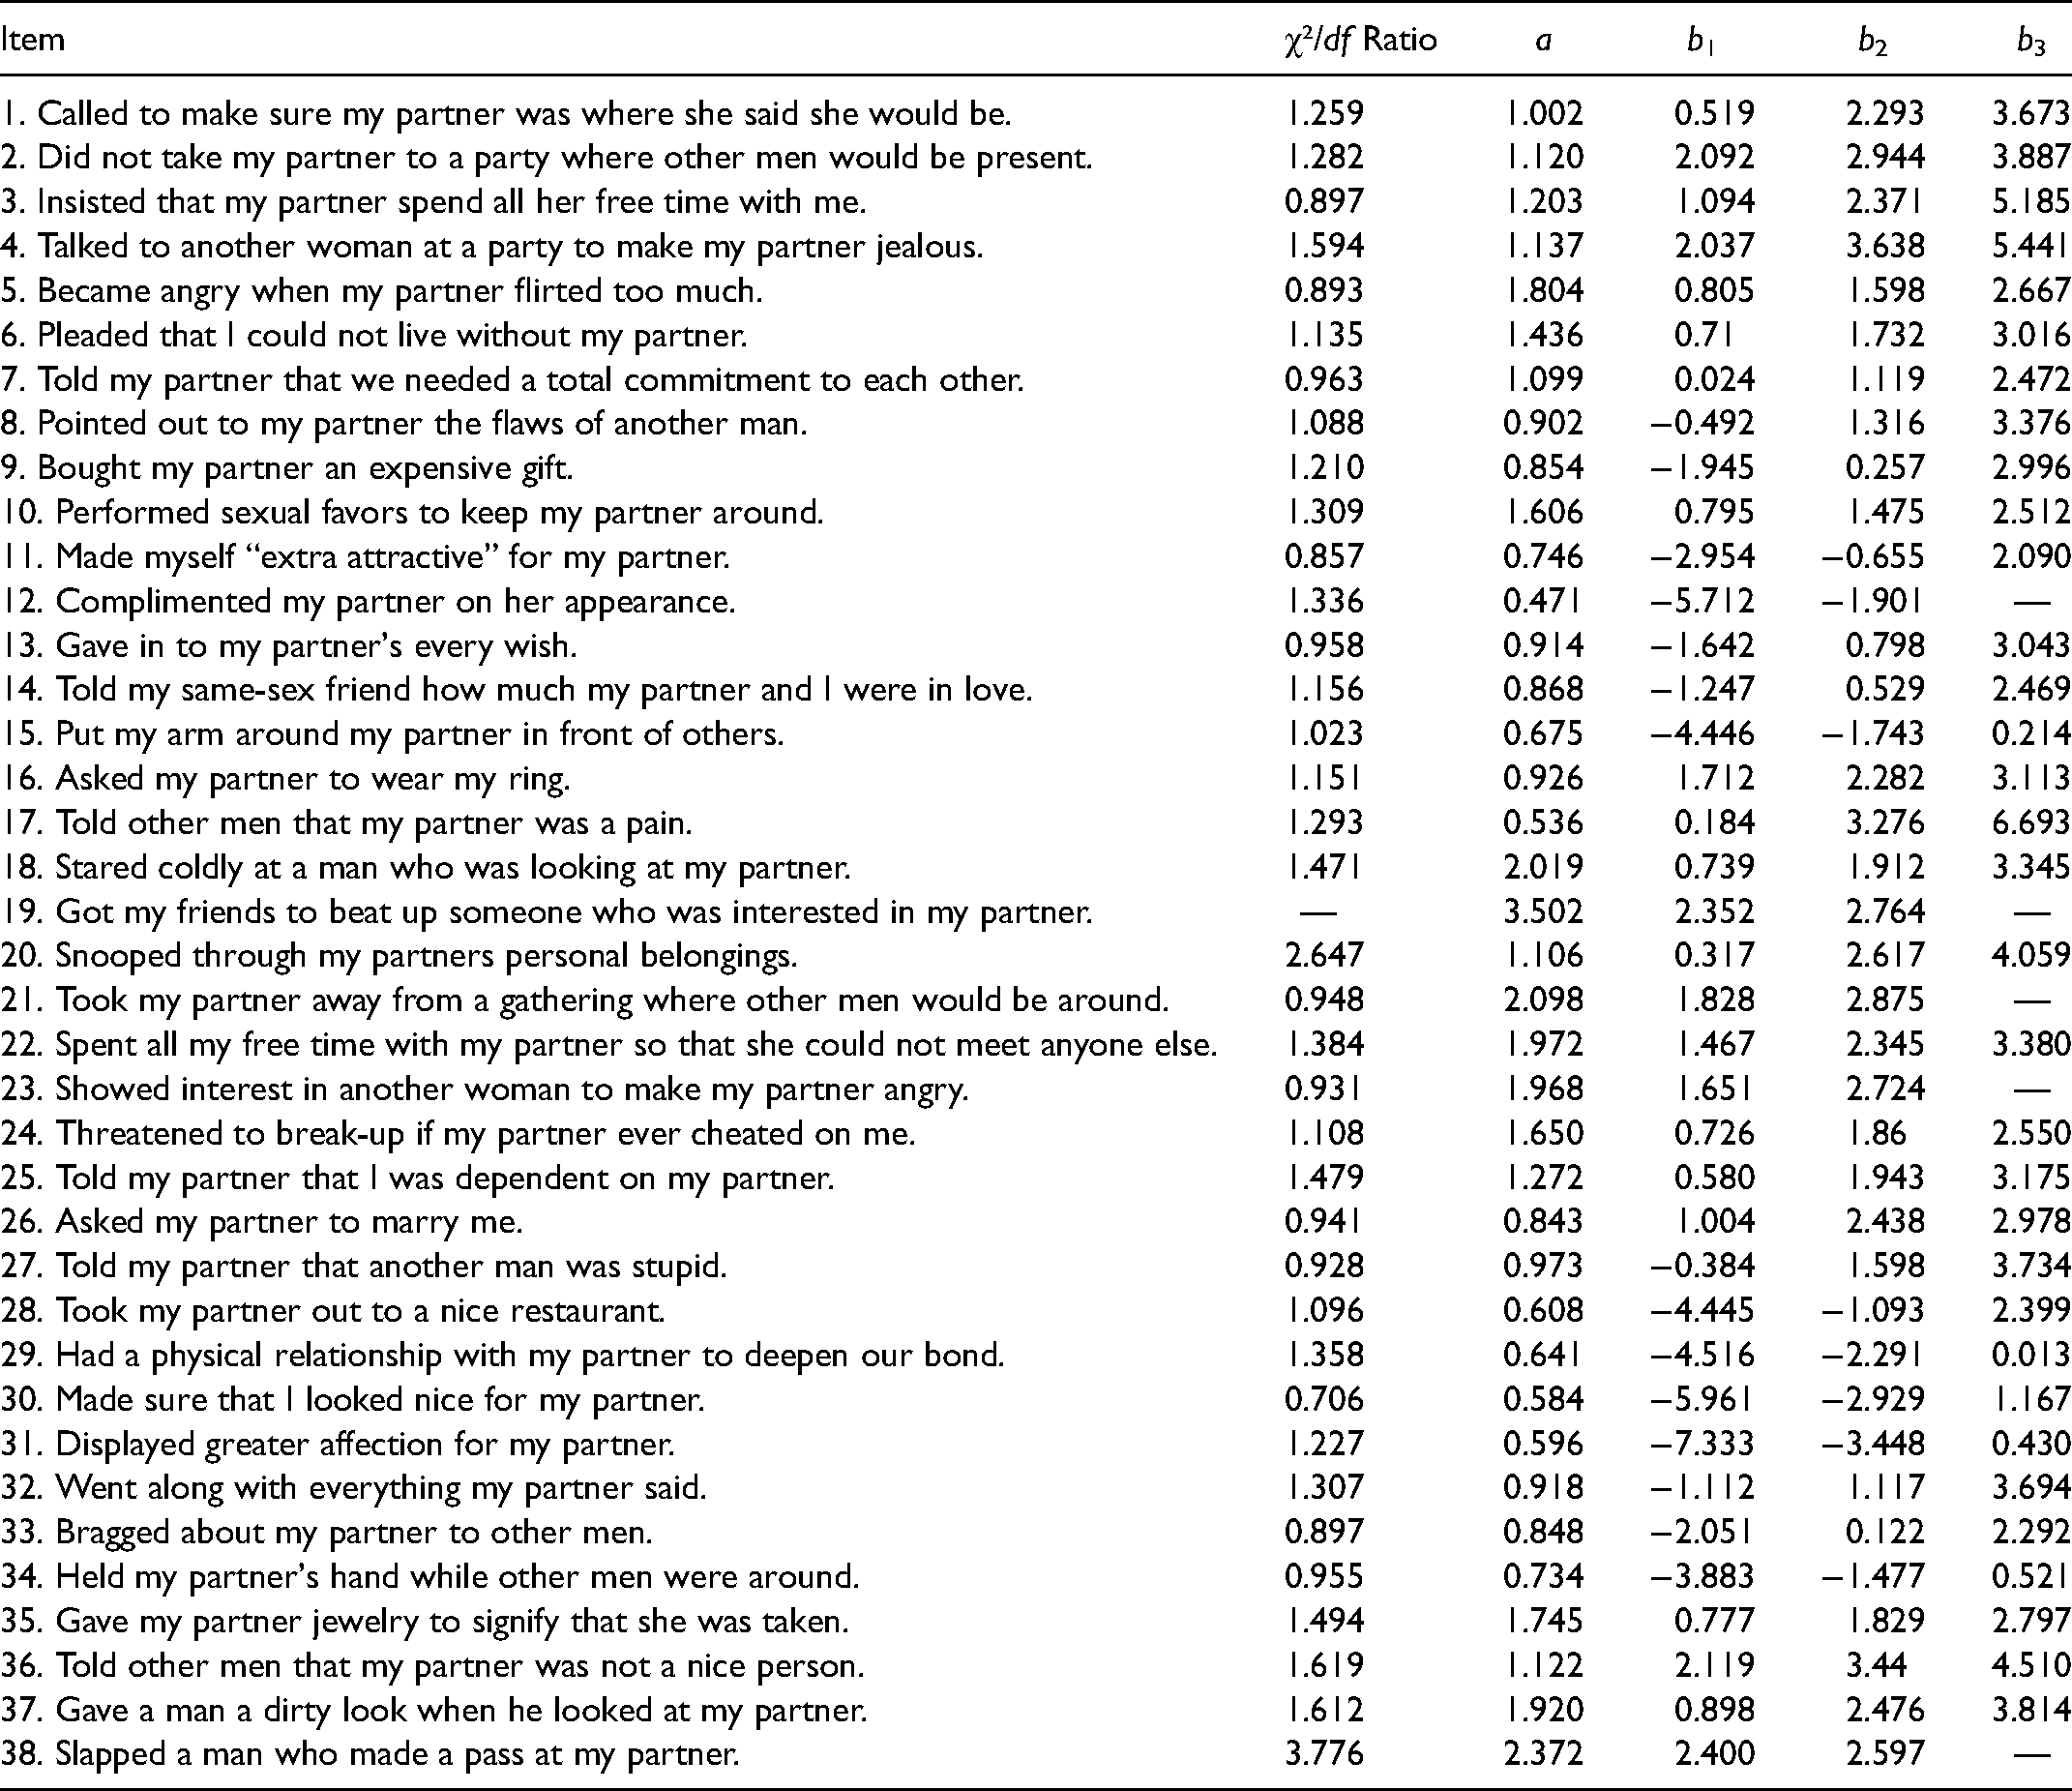
The appropriateness of an IRT analysis is predicated on acceptable levels of model data fit. Table 1 indicates that almost all items were well-fit by the model via acceptable χ²/df ratios. However, item 19 could not be assessed for model–data fit; investigating the responses to this item revealed that virtually all respondents (254 of 259) chose the lowest level of endorsement for this item, which has been known to cause issues in assessing model–data fit due to yielding sparse or empty cells when calculating the χ² statistics. As such, item 19 should be interpreted with caution. Similarly, item 38 also had sparse endorsement of extreme items and poor model data fit. All other items showed a good fit for the GRM.
Items Fit and Parameter Estimates.
To test the unidimensionality of the MRI-SF (a necessary assumption of unidimensional IRT models), a principal component analysis with direct Oblimin rotation was conducted. The primary factor of the MRI explained 20.97% of the variance, which is sufficiently unidimensional for IRT analysis (Drasgow & Parsons, 1983; Reckase, 1979).
Item Analyses
Table 1 provides the item parameter estimates for the MRI-SF modeled by the GRM, and there are several things to note. First, five of the items (12, 19, 21, 23, and 38) only have two threshold parameters whereas the other items have three; this is because no respondents selected the highest level of endorsement for these items, thus reducing the number of response options and lowering the number of thresholds required. Second, overall the items show good coverage of the latent trait. The latent trait continuum is normally distributed with a mean of 0.0 and standard deviation of 1.0, and it is desirable to have items whose thresholds span the full range. Although some thresholds are in the extreme range (beyond −3.0 or 3.0), suggesting that few respondents would select those responses, the majority of items fall into the ideal range, suggesting good overall functioning of the MRI-SF.
In order for an item to provide information, it must adequately differentiate between respondents of different trait levels, requiring discrimination parameters above 0.70 (Drasgow & Hulin, 1990). Unfortunately, a problematic trend emerged when assessing individual items on this criterion. Six of the items have poor discrimination, and the items that tend to be the most discriminating also tend to be the disproportionately most difficult items, with thresholds high in the positive range of the latent continuum. This yields a great deal of information provided for individuals with high thetas but not much for lower-end individuals. Items 5, 10, 18, 24, 35, and 37 were all identified as items with high discrimination (a parameter over 1.5) and reasonable levels of difficulty. Even among this group of items selected for reasonable difficulty, all of them provided the most information for individuals at a high theta. A common trend with all of these items is that they all tap into behaviors that would be considered relatively commonplace within a relationship: became angry when my partner flirted too much, threatened to break up if my partner ever cheated on me, etc.
Figures 1 and 2 present the option response functions (ORFs) for items 18 (stared coldly at a man/woman who was looking at my partner) and 33 (bragged about my partner to other men/women), respectively. An ORF is a visual representation of the relation between a person's theta score (propensity to engage in mate retention behaviors) and the probability of that person endorsing a given item at a specific level (e.g., 1 = Rarely performed this act). Stated differently, these figures show how likely a respondent is to choose a specific response when presented with an item based on that person's level of the latent trait. ORFs are a useful way to examine the psychometric properties of an item. Within each figure, there is one trace line for each possible response option; the steepness of the slope of these lines is determined by the discrimination parameter, a, and the location of the lines is a function of the threshold parameters, bk. Item 18 was among the most discriminating items (a = 2.02), and so the trace lines are relatively steep. However, because all of the thresholds for item 18 were high, only people very high on mate retention behavior would be likely to endorse any option other than (0 = Never performed this act) and the likelihood of any participant endorsing the item at the highest level is functionally zero for the commanding majority of people (remember that the latent trait continuum is normally distributed, so roughly 99% of people are below the level at which the trace line begins to depart from 0). Item 33, on the other hand, had a lower—though still acceptable—discrimination parameter (a = 0.85) but much more widely spaced thresholds; so, the trace lines in that ORF are evenly spaced across the continuum and slightly less steep.

Option response function (ORF) for item 18.
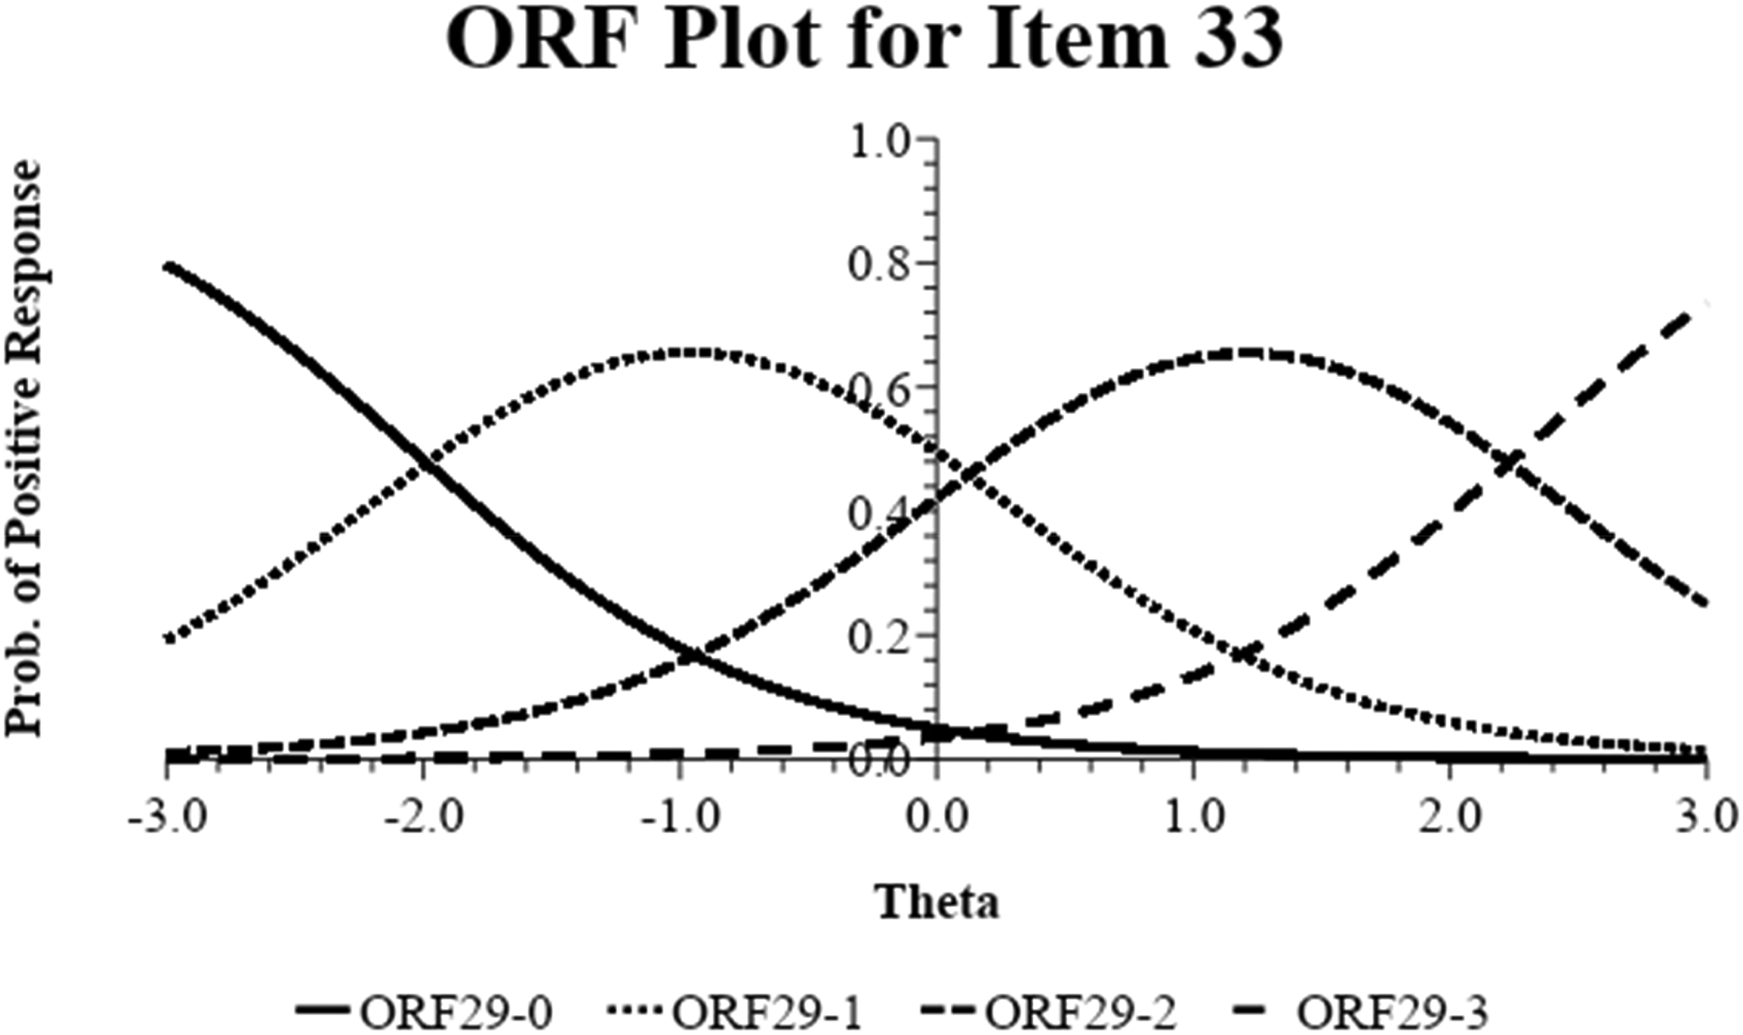
Option response function (ORF) for item 33.
Items 21, 22, 23, and 38 were also items that were very discriminating. However, these items were deemed less useful as they were exceptionally difficult items that were endorsed infrequently (the lowest threshold, b1 = 1.47 for item 22). In fact, these items are so extreme that items 21, 23, and 38 had no participants that endorse the items at the highest level, leading to these items only having three response options and, therefore, two threshold parameters. A common trend that emerged among these items was these items tapped into behaviors that are far more extreme and often malicious: snooped through my partner's personal belongings, spent all my free time with my partner so that he/she could not meet anyone else. In addition, item 19 (Got my friends to beat someone up who was interested in my partner) had the highest discrimination but excessively high thresholds, caused by a lack of respondents endorsing the item strongly. As seen in item 19, a participant's theta score needs to be extremely high in order to endorse a response option above the bare minimum; this property, combined with the lack of computable model–data fit noted above, suggests that further consideration should be given on whether this item should be retained if future scale revisions are conducted on the MRI-SF. Similar results were found for item 38 (Figure 3).

Option response function (ORF) for item 19.
The majority of the items (27 items) had a lower discrimination parameter (a below 1.5) and provided less item information. Unfortunately, many of the items providing little information were also the items with the lowest difficulty, meaning that the items measuring individuals low on mate retention were providing little information. Although these items encompassed a wide range of behaviors, the trend that emerged among these items is that they encompassed behaviors that are essentially relationship norms: displayed greater affection for my partner, took my partner out to a nice restaurant, etc. Although these behaviors do encompass the least extreme level of mate retention, they are also behaviors that are typical in a relationship and most individuals are likely to endorse. The response curve for item 17 (Told other men/women that my partner was a pain), which had a problematically low discrimination parameter (a = .54), is provided in Figure 4; notice how the likelihood of endorsing the various response options changes very little as a function of participant theta. This suggests that this item does little to differentiate between people, even those who are highly dissimilar on mate retention behaviors, and could also be a candidate for exclusion in future versions of the MRI-SF.

Option response function (ORF) for item 17.
In sum, at the item level, the MRI-SF functioned relatively well. In spite of a few poorly performing items (e.g., item 17 with low discrimination and item 38 with excessively difficult thresholds), the items had good psychometric properties. The greatest concern was the relative lack of information at the lower end of the latent continuum, suggesting that MRI-SF tells us relatively little about people low in mate retention behavior. This may be a function of the trait itself, wherein most people engage in behaviors considered normal and reflective of a trusting, well-adjusted companion, leading to an individual having to be excessively obsessive or possessive in order to endorse items reflecting more extreme behavior.
Scale Analysis
Although item-level analysis provides rich, important information about the psychometric properties of individual items, this is not how scales are generally interpreted. As such, it is important to also assess the MRI-SF at an aggregate scale level. In classical test theory, the most common way to do this is to use Cronbach's Alpha to assess internal consistency (Dunn et al., 2014; Schmitt, 1996). The internal consistency (α) of the MRI-SF was .88. However, despite its popularity, Cronbach's Alpha tells us relatively little about the quality of a scale (Cortina, 1993; Sijtsma, 2009). Here, too, IRT can provide unique and helpful information about a scale.
The test information function (TIF) for the scale is presented in Figure 5. Test information, and the TIF, is simply a sum of the information yielded from each individual item to create an overall image of where the scale best measures individuals. It is inversely related to the standard error of an individual's theta parameter estimate (i.e., when information is low, the error is high). It is important to note that the standard error of theta does not have the same significance testing interpretation or use that traditional standard errors do, though it is akin to a confidence interval representing a range of plausible estimates centered on the point estimate yielded from the data. Theta represents the individuals’ latent trait on mate retention and is conceptually equivalent to their overall score on the inventory. On the MRI-SF, the test information is low when evaluating participants with low theta, and the standard errors of theta correspondingly are much higher at these levels. This means that the MRI-SF provides relatively little information on participants who are low on mate retention. Conversely, the standard error is much lower at higher levels of theta due to higher information in this range, meaning that the MRI-SF provides a lot of information about participants who are high on mate retention. In congruence with the finding that the most discriminating items on the MRI-SF are also the most difficult items, the MRI-SF seems to provide a lot of information on individuals who engage in frequent mate retention tactics but relatively little for those who rarely engage in various mate retention tactics.

Test information function.
DIF by Sex
The MRI-SF is used to assess both male and female behavior within a relationship. In this dataset, females (M = 1.85, S.D. = .33) did not differ significantly from males (M = 1.92, S.D. = .33) in overall mate retention (t (257) = 1.59, p = .113), corroborating the past findings of the original MRI as well as those of the short form (Buss, 1988; Buss et al., 2008). However, in order for group comparisons to be meaningful, the scale must function equivalently for both groups (Vandenberg & Lance, 2000). IRT provides a way to test this via DIF, which estimates the parameters in each group separately and compares them to see if they are equivalent. In order to perform this analysis, five items had to be removed from the scale. Items 3, 4, 19, 37, and 38 were excluded because there were some response options that were not endorsed by one sex but were endorsed by the other. Most strikingly, items 19 and 38 have been discussed before as particularly difficult items both encompassing the behavior of violence against rivals. Of the entire sample of females (142 participants), only one endorsed a response option other than the lowest option. Before even beginning the analysis, it is noteworthy that some of the items provided so little variance for females that analyses could not even be performed.
DIF tests were performed using the “lordif” package in R (Choi, 2016), which implements Raju, van der Linder, and Fleer's (1995) differential functioning of items and tests (DFIT) framework. DFIT tests for varying measurement properties across groups by estimating the parameters within each group separately and then comparing their ORFs (Oshima & Morris, 2008). It then tests for differential test functioning (i.e., the properties of the full scale rather than the individual items) by summing the differences across items. Of the 33 items included in the analysis, items 11, 14, 16, 26, 28, 32, and 35 demonstrated differential functioning between males and females. The item parameters for each group are presented in Table 2. Interestingly, the majority of these items showed differences in the threshold parameters, but only a few differed greatly in the discrimination parameter. This suggests that the items’ ability to discriminate did not differ consistently between the two groups but the difficulty of the items did. Many, but not all, of these items are measuring behaviors that are often thought of as stereotypical male behaviors: asked my partner to wear my ring, asked my partner to marry me, gave my partner jewelry to signify that he/she was taken.
Differential Item Functioning Results.

Although many individual items function differently between males and females, what is more significant is that the overall scale seems to function dramatically differently for males and females. In Figure 6, the test information functions are provided for female and male participants side by side using separate item parameter estimates for those items flagged for DIF. Both shapes are similar and closely resemble the function when applied to the sample as a whole; there is little information provided except at high levels of theta. However, when plotted side by side, it becomes clear that more information is garnered about males than there is about females, particularly in the theta range from 0.0 to 2.0 where most of the information is yielded. This shows that, in addition to individual items causing problems, the MRI-SF as a whole is a less-effective tool for females than for males, though the magnitude of this difference may not be large.

Test information functions for males and females using separate parameter estimates of differential item functioning (DIF) items.
Discussion
The current research had two main goals. First, it submitted a widely utilized scale in evolutionary psychology to a rigorous psychometric analysis and examined the differential item function to evaluate the differences in responses on the MRI from both men and women. Second, this paper was designed to serve as a framework for how the newest psychometrics techniques can be utilized in the field of evolutionary psychology in order to both create more robust and valid measures as well as for general theory-testing.
This type of analysis is invaluable to build upon other more theory-based approaches because it reveals the value of a scale of this type. The real value of IRT is that it allows for a better understanding of what a scale and the individual items in a scale are actually capturing from participant's responses. For example, one of the overall conclusions drawn here is that the MRI-SF does not discriminate womens’ responses as well as mens’. In other words, based on the analysis here, men's use of mate retention tactics is able to assess at “normal” ranges of behavior (normal as in reflective of a distribution centered around 0), whereas women's use of mate retention tactics is only captured on the more extreme end. The total item information curve for men indicates that a great deal of information is able to be discerned about men between the theta range of −1 and +1. The total item information curve for women tells us that much less information is discerned and only above +1. This indicates that the items in the MRI-SF are capturing behaviors that men more routinely perform than women. As implied by previous research, men and women are expected to have distinct differences in their use of mate retention tactics (Buss, 1988). However, this analysis indicates at least two interpretations for the observed sex differences. First, it could be that the items in the MRI-SF do not accurately reflect the type of behaviors that women are likely to use to help keep their partner invested in the relationship. Another explanation could be that women are less likely to adopt many of the behaviors in the MRI-SF. Either explanation indicates that the MRI-SF may not be accomplishing what researchers are expecting it to, at least in regards to women respondents.
The current research is not completely negative with regard to the MRI-SF. It reveals that the male respondents are represented in a theoretically ideal way according to IRT approaches (see Zickar et al., 2002). Based on this analysis, data from men indicates that the items in the MRI-SF reflect behaviors that men are more likely to perform. The current research does indicate that there may be steps that need to be taken to include items in the MRI-SF that more accurately reflect how women behave. In addition to highlighting potential shortcomings of the scale, however, there are several trends that were found that allow for suggestions to improve the scale and address the shortcomings.
The most discriminating items were also the ones that were the most extreme (Got my friends to beat someone up who was interested in my partner). These items are not problematic and do not need to be removed but there need to be items that are very discriminating at less-extreme levels of theta as well. Items that were discriminated relatively well and provided information at moderate levels of theta involved less extreme, but common mate retention behaviors (Stared coldly at a man/woman who was looking at my partner). There were many items that provided almost no information because they involved behaviors that were incredibly common within relationships and not always a mate-retention tactic as much as a typical mating behavior (Complimented my partner on her appearance). In order to improve the total information, more items need to be generated that represent true mate retention tactics at various frequencies as they will represent discriminating items at different levels of theta. Finally, there are evolutionarily predicted differences in mate retention behaviors between males and females. However, the majority of the items that differed between males and females represented behaviors that are much more male-typical and, thus, were more difficult for female participants. If the MRI-SF is to continue to be used to assess both males and females, more female-typical behaviors should be generated in order to provide as much information regarding female participants as males. Of course, more analyses need to be done to support the current research before any drastic measures are implemented.
The following analyses are designed not to be a critique of the MRI-SF or the manner in which it was developed. The intent is to demonstrate how a theory-based approach to scale development can be combined with a rigorous, psychometric analysis in order to make a robust scale to measure a construct that is highly important to evolutionary psychologists. The integration of the latest psychometrics techniques into the field of evolutionary psychology can only function to strengthen the field and allow researchers to better test new and exciting hypotheses derived from evolutionary theory.
Footnotes
Declaration of Conflicting Interests
The authors declared no potential conflicts of interest with respect to the research, authorship, and/or publication of this article.
Funding
The authors received no financial support for the research, authorship, and/or publication of this article.