
Abstract
Difficulties in finding mates may have broad consequences for well-being. Previous studies often assume that only personal characteristics or competition limits mating success without considering the impact of the social context. We developed and evaluated a questionnaire for measuring context-dependent mate access by surveying 528 Finnish adults. We found support for our hypothesized two-factor structure divided into preferred encounters (i.e., the amount of interactions the individual has with potential mates) and perceived possibilities (i.e., the individual’s perception of their mating opportunities). We also investigated the relationship between these factors and respondents’ social context, negative affect regarding poor mate access, mate value, and sociosexual desire. Individuals in more sociable contexts reported higher mate access, and individuals with less perceived possibilities reported more negative affect. Theoretical associations with mate value and sociosexual desire were supported. The current scale can be used along existing measures to study human mating and its psycho-behavioral correlates.
Human mate selection has been investigated for decades (Buss & Barnes, 1986; Symons, 1979; Westermarck, 1891) and has, for instance, focused on mating strategies (e.g., Buss & Schmitt, 1993) and mating preferences (e.g., Antfolk, 2017; Kenrick & Keefe, 1992). Still, most of these studies assume that individuals generally enjoy access to a pool of potential mates and that only personal characteristics or sexual competition limits mating success. There are, however, individual differences in our social contexts—for example, the sex ratio (e.g., the number of men pursuing the number of available women) and how many potential mates we meet in our everyday lives—and these differences affect our mate access (Stone et al., 2007): Even individuals who are highly desirable mates will have limited mate access if they are, for instance, living in a context with very few available partners.
Difficulties in finding a mate increase the risk of several negative consequences, such as loneliness (De Jong-Gierveld & Aalberts, 1980), decreased life satisfaction (Bailey & Snyder, 2002), reduced well-being (Gutiérrez et al., 2005), and increased outgroup hostility (Antfolk et al., 2018). Because of this, a full understanding of the factors affecting mating success is needed.
The Role of Social Context
We argue that two components need to be addressed concerning contextual mate access. First, preferred encounters refer to the times we interact with someone we consider a potential mate based on our preferences for age, gender, and so on. Preferred encounters are affected by, for example, the sex ratio (Buss, 1988) and the proportion of single individuals in the surrounding environment (Buunk & Fisher, 2009). As an example, the sex ratio in parts of Asia, such as India, Korea, and China, has changed over recent decades and resulted in a surplus of men (e.g., Park & Cho, 1995), due to selective abortion of female fetuses (Jha et al., 2006), son preference, and China’s one-child policy (Loh & Remick, 2015). Rural areas in Western countries also tend to have relatively few young women due to sex-biased out-migration (e.g., Pelto, 1973), and men in such areas are relatively likely to remain single and be unable to find a mate or have children (Hudson & Den Boer, 2004).
Second, mate access also consists of the perceived possibilities to convert encounters into actual mating opportunities, which depends on factors that influence sexual and romantic invitations from others. As an example, a perceived possibility could be any flirt, including observing, smiling, and touching (e.g., McCormick & Jones, 1989). Men are less choosy than women (Buss & Schmitt, 1993) and, as a consequence, women are approached more frequently (Laner & Ventrone, 2000), and might perceive their mating possibilities as higher (Finkel & Eastwick, 2009).
In sum, we argue that the individual social context, that is, the number of engagements we have with other people in general, affects individual mate access in interaction with the individual’s own characteristics and that this is the result of both the frequency of preferred encounters and the perceived possibilities. The more interactions we have in our social context, the more often we will experience preferred encounters and, accordingly, perceived possibilities. Our perceived possibilities are, therefore, related to the number of people we meet in our social context in general but even more so to our preferred encounters.
Individual Differences
Irrespective of gender, age, and sexual orientation, mate value (i.e., individual characteristics affecting the capacity to find and keep mates; Waynforth, 2001) and sociosexual desire (i.e., an individual’s desire for and interest toward uncommitted sexual relationships; Simpson & Gangestad, 1991) are two aspects related to mate access. Although mate access is not necessarily directly affected by mate value, an individual with high (vs. low) mate value will—all other things equal—be perceived as more attractive (e.g., Little et al., 2006) and is, therefore, expected to perceive more possibilities and to be able to more successfully convert preferred encounters into actual mating opportunities (Landolt et al., 1995). Sociosexual desire is, on the other hand, expected to moderate the association between mate access and negative affect: Individuals with high sociosexual desire will more actively seek mates and, consequently, experience stronger negative affect regarding poor mate access compared to individuals with low sociosexual desire (Vrangalova & Ong, 2014). Because of this, we also investigated the relationships between mate value, sociosexual desire, context-dependent mate access, and negative affect.
The Current Study
We created and evaluated a self-report questionnaire for measuring context-dependent mate access. To measure mate access, we designed 6 items to measure preferred encounters and 7 items to measure perceived possibilities. We also investigated associations between mate access and related concepts, making the following predictions: Individuals in social contexts including more (vs. less) frequent interactions with others will experience more (a) preferred encounters and (b) perceived possibilities, but (c) more frequent interactions with others will be more strongly associated with preferred encounters (vs. perceived possibilities). Individuals reporting more (vs. less) (a) preferred encounters and (b) perceived possibilities will report less negative affect, but (c) perceived possibilities (vs. preferred encounters) will be more strongly associated with negative affect. Individuals with high (vs. low) mate value will be better able to convert their preferred encounters into perceived possibilities. Individuals with high (vs. low) sociosexual desire will report more negative affect as a consequence of few perceived possibilities.
Moreover, we explored differences due to gender, relationship status, and sexual orientation.
Method
Ethical Permission
The current study received permission by the Ethical Review Board of Åbo Akademi University prior to the data collection.
Respondents and Procedure
We created an online survey and collected data in spring 2019 by targeting Finnish adults on Facebook. Our aim was to gather responses from 250 men and 250 women. The final sample consisted of 528 respondents (268 women, 252 men, and 8 other), ranging from 18 to 77 years old (M = 33.7, SD = 9.4). Respondents agreed to an informed consent form before starting. We assured respondents’ anonymity and informed them that participation was voluntary and could be discontinued at any time. We also informed respondents about the possibility of participating in a lottery with four gift cards worth 50€.
Of the 794 individuals who started the survey, we included only those who had answered all pertinent items. The completion rate was 66.5%, with most dropouts occurring before or directly after providing demographic information. The dropout rate was similar in all genders. Respondents completed the survey in, on average, 12 min and 40 s.
Measures
We designed measures for the social context, mate access, and negative affect regarding poor mate access. We included validated scales to measure self-perceived mate value and sociosexual desire. See Supplementary Material for original items and response options regarding social context and negative affect.
Mate access
We first devised 13 questions that in various ways probed an individual’s mate access. To avoid overlap, we inspected scales connected to mate value and sociosexual orientation (Edlund & Sagarin, 2014; Fisher et al., 2014; Kirsner et al., 2003; Landolt et al., 1995; Penke & Asendorpf, 2008). After this, we gathered feedback from psychology students in two steps and edited the items accordingly.
We partitioned the items into two thematic blocks. In the first block, we probed respondents about how many potential partners the respondents meet and talk to on an average day or during a normal weekend. In the second block, we probed respondents about how often they receive invitations and how they evaluate their chances of finding a partner within a specific time frame. Each item was rated on a 4-, 5-, or 7-point Likert-type scale.
In the questionnaire, we defined a “potential partner” as any individual one might be sexually or romantically interested in, considering their gender and age. We instructed respondents to answer as if they were single even if they currently were in a relationship. As we were not interested in measuring online-only relationships, we asked respondents not to count people they only meet online. However, online relationships that had later evolved into offline relationships were counted. We included both items about mate access to sexual and to romantic relationships, as preferences for short-term (e.g., Schmitt, 2005) and long-term mates (e.g., Buss et al., 2001) tend to differ.
Social context
To measure the social context of respondents, we inquired about how many adults the respondents meet during a common workday, in their spare time during a full week, and when seeing friends and acquaintances during a full week. Each item was rated on a 7-point Likert-type scale.
Negative affect
To measure the respondents’ negative affect regarding poor mate access, we asked the respondents about how much sadness, frustration, anger, and shame they felt as a result of their mate access regarding both sexual and romantic relationships. Each item was rated on a 5-point Likert-type scale.
Mate value
We used the Mate Value Scale (Edlund & Sagarin, 2014) to measure the respondents’ self-perceived mate value. The scale consists of items designed to measure one’s desirability as a mate, and responses are given using a Likert-type scale. The scale has demonstrated adequate psychometric properties (Edlund & Sagarin, 2014).
Sociosexual desire
We used 3 items from the revised Sociosexual Orientation Inventory (SOI-R; Penke & Asendorpf, 2008) to measure respondents’ sociosexual desire (i.e., an individual’s desire for and interest toward uncommitted sexual relationships; Simpson & Gangestad, 1991). The SOI-R is a measure of 9 items, of which three assess sociosexual desire. Responses are given using a Likert-type scale. The SOI-R has demonstrated adequate psychometric properties (Penke & Asendorpf, 2008).
Statistical Analyses
Statistical analyses were conducted using the R platform (R Development Core Team, 2008). Scripts and outputs can be found on OSF (https://osf.io/he46m/?view_only=ab12fe1d13e242b4849c3efe05948929). We investigated zero-order correlations between all items designed to measure mate access. We used corrplot to visualize the correlations (Wei, 2016). We used lavaan (Rosseel, 2012) for confirmatory factor analysis (CFA) to test the fit between the data and our conceptual two-factor model and compare it to a one-factor model as well as to model structural regressions. As data were ordinal, we used robust weighted least squares (weighted least squares means and variance adjusted) estimation with delta parametrization. To investigate measurement invariance, we used the measEq.syntax argument in semTools (Jorgensen et al., 2019). We used semPlot (Epskamp, 2014) to visualize the structural regressions. We used lme4 to investigate differences due to gender, relationship status, and sexual orientation (Bates et al., 2015).
Results
Descriptive Results
Respondent demographics are provided in Table 1.
Respondents’ Age, Gender, Sexual Orientation, Relationship Status, Education, Income, and County of Residence.
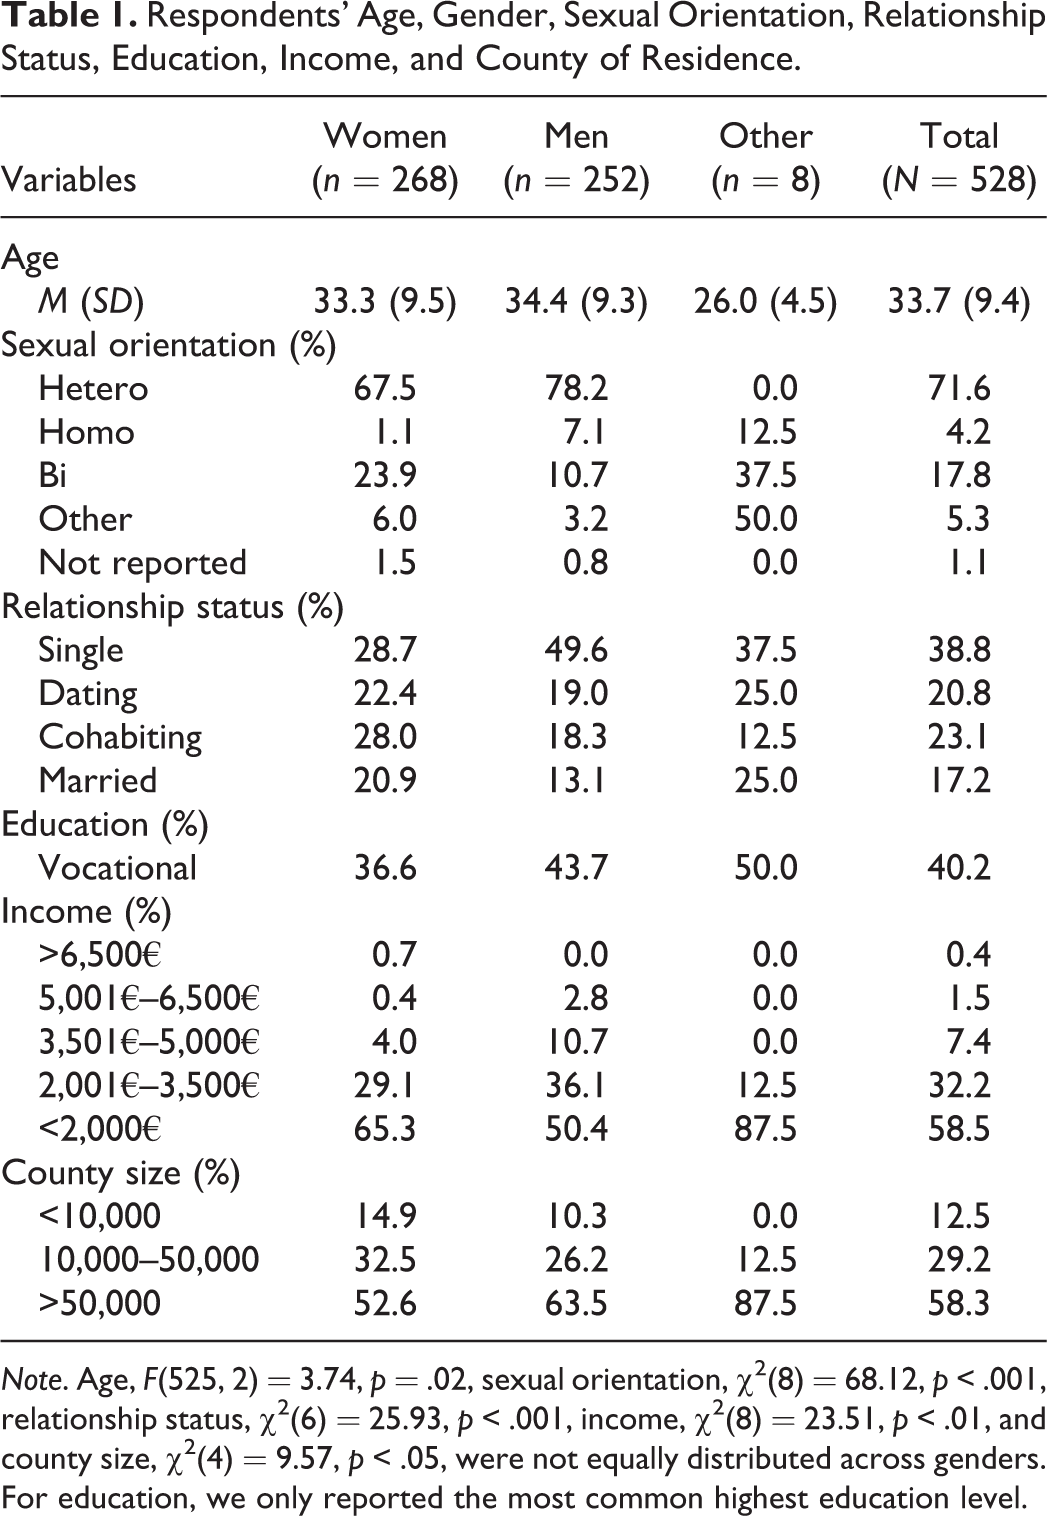
Note. Age, F(525, 2) = 3.74, p = .02, sexual orientation, χ2(8) = 68.12, p < .001, relationship status, χ2(6) = 25.93, p < .001, income, χ2(8) = 23.51, p < .01, and county size, χ2(4) = 9.57, p < .05, were not equally distributed across genders. For education, we only reported the most common highest education level.
There were no differences in mate value as a function of gender, F(525, 2) = 1.13, p = .325. Mate value differed as a function of sexual orientation, F(523, 4) = 3.57, p = .006, and relationship status, F(524, 3) = 10.42, p < .001. Post hoc tests showed that heterosexual participants reported higher mate value than “others” and that singles reported lower mate value than all other groups. Men reported higher sociosexual desire compared to women and “others,” F(525, 2) = 40.96, p < .001. There were no differences in sociosexual desire as a function of sexual orientation, F(523, 4) = 1.57, p = .180. Singles reported higher sociosexual desire than all other groups, F(524, 3) = 5.02, p = .002.
Psychometrics of the Mate Access Scale
Correlations
We first investigated correlations between all items (items are presented in Appendix and correlations in Figure 1). The correlations indicated the existence of two clusters: Correlations between the 7 items designed to measure preferred encounters (E) were high and positive, as were correlations between the 6 items designed to measure perceived possibilities (P).

Plot of the zero-order correlations between all included items designed to measure mate. High positive correlations are shown in red, high negative correlations in green, and correlations approximating null in yellow. Hypothesized clusters are marked with bolded lines.
CFA
We first compared the conceptual two-factor model with a one-factor model, in which the between-factor correlation was constrained to 1. Compared to the one-factor model, the two-factor model showed significantly better fit, Δχ2(1) = 211.00, p < .001. The two-factor model with 66 free parameters did not, however, show acceptable fit, χ2(64) = 1,523.56, p < .001, comparative fit index (CFI) = .929, Tucker–Lewis index (TLI) = .913, root-mean-square error of approximation (RMSEA) = .209 [.200, .218], standardized root-mean-square residual (SRMR) = .136. We adjusted the model by first inspecting the modification indices for high residual correlations between items and allowed three residual correlations: between “meetwant” and “rominvwant” (mi = 600.20), “num” and “talk” (mi = 570.60), as well as “we_romtalk” and “we_sextalk” (mi = 306.74). In the following step, we removed “sexother” that cross-loaded on the P factor (mi = 94.68). The resulting model with 64 free parameters showed acceptable fit, χ2(50) = 203.12, p < .001, CFI = .992, TLI = .989, RMSEA = .076 [.065, .087], SRMR = .071. The factor loadings were moderate to high (Table 2). The between-factor correlation was positive (r = .522, p < .001).
Factor Loadings and Variances of the Adjusted Two-Factor Model.

Measurement invariance
We then investigated measurement invariance across women and men, as well as single respondents and respondents in relationships. For a few items, a response option was not used by a group (i.e., the highest value for 1 item for the sex analysis was not used by men, and the highest value for 5 items for relationship status analysis was not used by singles). In these cases, we coded the highest value in the other group as the second highest value to unify the range across groups. The analyses showed that the two-factor model met criteria for scalar invariance across men and women and criteria for strict invariance across single respondents and respondents in a relationship (see Supplementary Table 4 for statistical details).
Social Context and Negative Affect
We used latent analyses to test the associations between mate access, social context, and negative affect (Figure 2), as this allowed us to also inspect the measurement model of the self-constructed items also for social context (C) and negative affect (A). The first model, in which we regressed preferred encounters and perceived possibilities on social context (C), showed appropriate fit, χ2(85) = 305.34, p < .001, CFI = .987, TLI = .984, RMSEA = .078 [.070, .087], SRMR = .074. As expected, social context was positively associated with both preferred encounters (b = .911, SE = .112, p < .001) and perceived possibilities (b = .452, SE = .077, p < .001). Comparing the 95% confidence intervals (CIs) of the two associations revealed no overlap, suggesting the latter association was significantly stronger than the former. The second model, in which we regressed negative affect (A) on preferred encounters and perceived possibilities, showed slightly poorer fit, χ2(164) = 1,318.52, p < .001, CFI = .982, TLI = .979, RMSEA = .116 [.110, .121], SRMR = .098, but as this was likely due to correlated residuals in the measurement of negative affect, we retained the model. Preferred encounters were not associated with negative affect (b = −.088, SE = .071, p = .217), but perceived possibilities were negatively associated with negative affect (b = −.687, SE = .056, p < .001). There was no overlap between the 95% CI of the standardized regression components, suggesting that the latter association was significantly stronger than the former.

Standardized path diagrams for the latent structural regression models. The left model shows preferred encounters (E) and perceived possibilities (P) regressed on social context (C). The right model shows negative affect (A) regressed on E and P. For C, E, and P, higher values indicate better access to mates. For A, higher values indicate more negative affect. ***p < .001. **p < .01. *p < .05.
Scale Construction
Factor scores and composite scores were highly correlated, and composite scores demonstrated sufficient reliability (Table 3). This suggests that mean composites could be used without much information loss.
Internal Reliability of and Correlations Between Factor and Composite Scores.
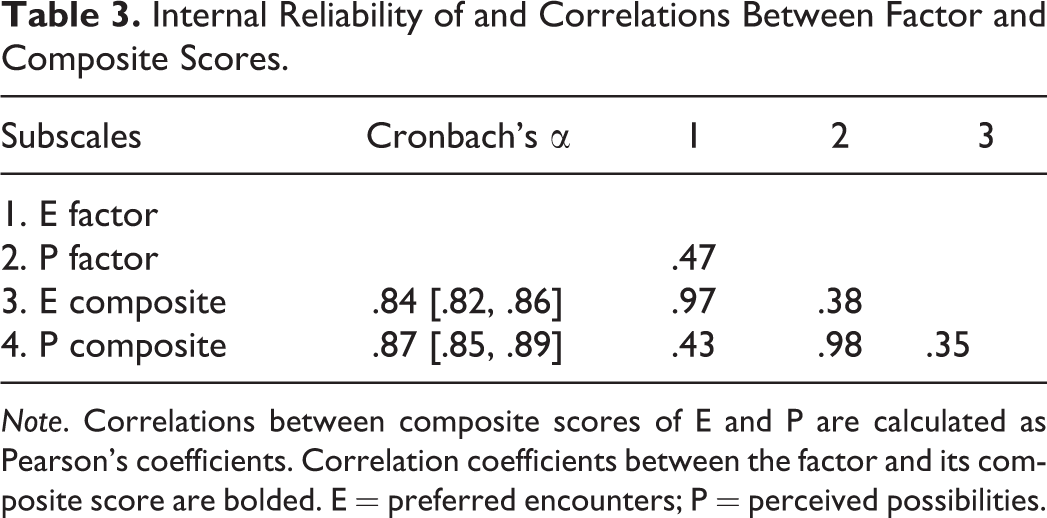
Note. Correlations between composite scores of E and P are calculated as Pearson’s coefficients. Correlation coefficients between the factor and its composite score are bolded. E = preferred encounters; P = perceived possibilities.
Validation Against Mate Value and Sociosexual Desire
After this, we investigated the theorized associations between mate access, mate value, and sociosexual desire using composite scores (Table 4). We first tested the relationship between preferred encounters and perceived possibilities, when also considering mate value. When including mate value, preferred encounters were no longer associated with perceived possibilities (b = .23, SE = .16, p = .154), as in the latent model. Mate value was a significant predictor of perceived possibilities (b = .23, SE = .06, p < .001), suggesting that individuals who perceived themselves to be more appealing to others also perceived more possibilities, when controlling for differences in preferred encounters. The interaction between mate value and preferred encounters was not statistically significant (b = .04, SE = .03, p = .165).
Correlations Between Composite Scores of Preferred Encounters, Perceived Possibilities, Negative Affect Regarding Poor Mate Access, Social Context, Mate Value, and Sociosexual Desire.

After this, we investigated the relationship between mate access and sociosexual desire. Both less perceived possibilities (b = −.37, SE = .09, p < .001) and higher sociosexual desire (b = .25, SE = .05, p < .001) predicted more negative affect. The interaction between perceived possibilities and sociosexual desire was statistically significant (b = −.06, SE = .02, p = .001). To explore the interaction, we dichotomized sociosexual desire based on the median. The association between low perceived possibilities and negative affect was stronger in the group with high sociosexual desire (b = −.72, SE = .05, p < .001) than in the group with low sociosexual desire (b = −.54, SE = .06, p < .001), suggesting that low mate access paired with a high sociosexual desire produced particularly strong negative affect.
Exploratory Analyses
Exploratory analyses showed that men reported less preferred encounters than women and “others,” F(525, 2) = 4.58, p = .011, but there were no gender differences for perceived possibilities, F(525, 2) = 0.27, p = .763. There were no differences in preferred encounters due to sexual orientation, F(523, 4) = 2.03, p = .089, but a difference in perceived possibilities, F(523, 4) = 2.51, p = .041, with bisexual individuals reporting more perceived possibilities than “others.” Singles reported less preferred encounters, F(524, 3) = 11.18, p < .001, and less perceived possibilities, F(524, 3) = 12.91, p < .001, than all other groups.
Discussion
We developed and evaluated a self-report questionnaire for measuring mate access in 528 adult women and men. The final scale consisted of 12 items, divided into two conceptual blocks, measuring preferred encounters and perceived possibilities.
Main Findings and Interpretations
We found support for the functionality of the mate access items, and the results showed that mean composite scores can be used without much information loss. As expected, respondents with lower mate access reported stronger negative affect due to poor mate access. Preferred encounters were positively associated with perceived possibilities and few perceived possibilities with negative affect. When controlling for the association between perceived possibilities and negative affect, preferred encounters did not predict negative affect, suggesting that the association between context-dependent mate access and negative affect was fully due to the perceived possibilities of finding a mate.
Individual Differences
Mate value predicted perceived possibilities even after controlling for the number of other individuals the respondents reported meeting. This suggests that individuals who see themselves as more appealing also perceived more possibilities irrespective of context. The interaction between mate value and preferred encounters was not statistically significant. However, a possible explanation for this could be that preferred encounters are dependent on mate value, so that individuals with high mate value are better able to convert their preferred encounters into perceived possibilities. Moreover, the association between few perceived possibilities and negative affect was stronger in respondents with high sociosexual desire, suggesting that low mate access paired with a high sociosexual desire yielded particularly strong negative affect.
Limitations and Recommendations
There are some notable limitations. First, we asked respondents not to report online encounters. It is unclear whether respondents complied with this request. Second, the definition of a “potential partner” might have been ambiguous, and respondents might have experienced difficulties in remembering the definition throughout the questionnaire. To mitigate this, we repeated the definition 4 times. Third, we asked respondents to answer as if they were single, even if they were in a relationship. Despite our analyses showing that the scale was used similarly for single respondents and respondents in a relationship, singles reported lower mate access. One explanation might be that respondents in relationships have higher mate value.
Future studies should validate the scale against other constructs and in other populations. For instance, mate access, negative affect, and mate value might covary in environments that differ from the studied population. Future studies should also investigate mate access online, since online dating services enable us to assess tens of thousands of potential mates (e.g., Lenton et al., 2008), but little is known about how equivalent online mate access and real-life mate access is in terms of their effects on well-being.
Conclusions
The findings from this study support the utility of the two-factor Mate Access Scale. In line with theory, mate access was predicted by social context, and low mate access was associated with negative affect. Moreover, mate access measures a different aspect of mating than mate value and sociosexual desire. This suggests that the Mate Access Scale could be used in addition to existing measures to better understand all aspects of human mating and its psychological and behavioral correlates.
Supplemental Material
Rev_1_MAS_Supplementary_Tables_1-4 - Finding the Mating Gear: The Development and Validation of a Mate Access Scale
Rev_1_MAS_Supplementary_Tables_1-4 for Finding the Mating Gear: The Development and Validation of a Mate Access Scale by C. Walldén, M. Westerlund, A. Gunst, P. Santtila and J. Antfolk in Evolutionary Psychology
Footnotes
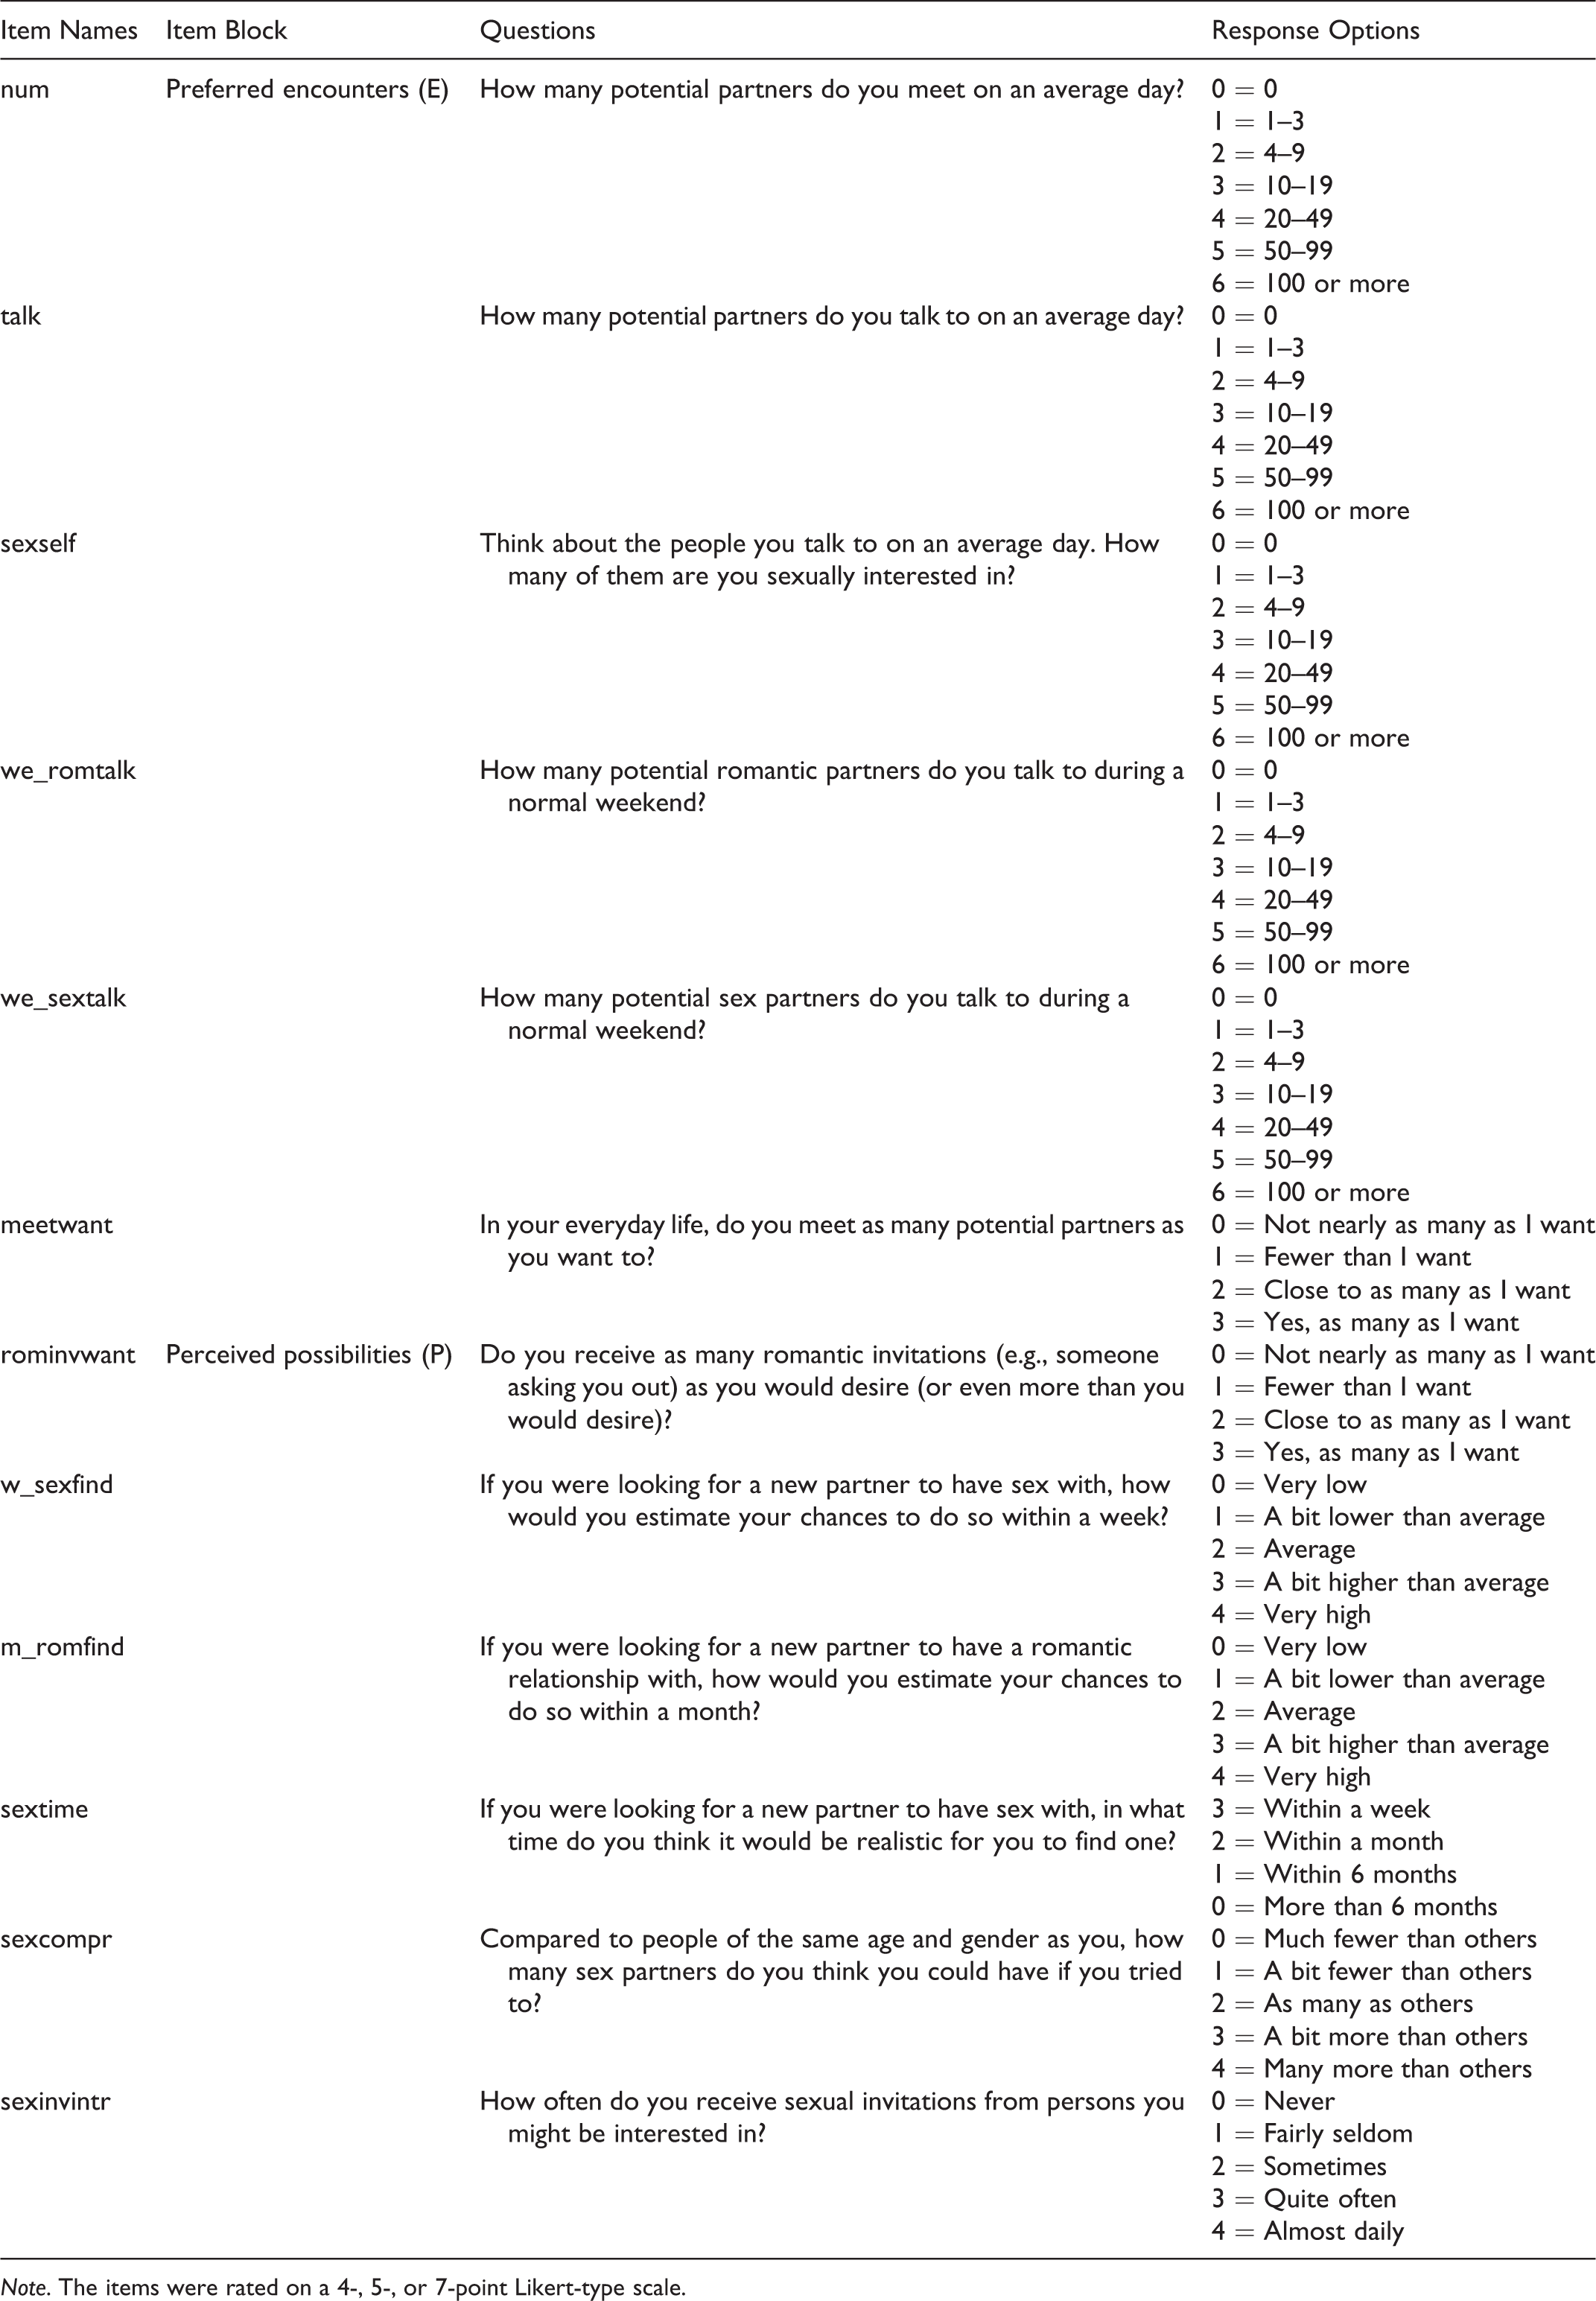
Appendix
| Item Names | Item Block | Questions | Response Options |
|---|---|---|---|
| num | Preferred encounters (E) | How many potential partners do you meet on an average day? | 0 = 0 |
| 1 = 1–3 | |||
| 2 = 4–9 | |||
| 3 = 10–19 | |||
| 4 = 20–49 | |||
| 5 = 50–99 | |||
| 6 = 100 or more | |||
| talk | How many potential partners do you talk to on an average day? | 0 = 0 | |
| 1 = 1–3 | |||
| 2 = 4–9 | |||
| 3 = 10–19 | |||
| 4 = 20–49 | |||
| 5 = 50–99 | |||
| 6 = 100 or more | |||
| sexself | Think about the people you talk to on an average day. How many of them are you sexually interested in? | 0 = 0 | |
| 1 = 1–3 | |||
| 2 = 4–9 | |||
| 3 = 10–19 | |||
| 4 = 20–49 | |||
| 5 = 50–99 | |||
| 6 = 100 or more | |||
| we_romtalk | How many potential romantic partners do you talk to during a normal weekend? | 0 = 0 | |
| 1 = 1–3 | |||
| 2 = 4–9 | |||
| 3 = 10–19 | |||
| 4 = 20–49 | |||
| 5 = 50–99 | |||
| 6 = 100 or more | |||
| we_sextalk | How many potential sex partners do you talk to during a normal weekend? | 0 = 0 | |
| 1 = 1–3 | |||
| 2 = 4–9 | |||
| 3 = 10–19 | |||
| 4 = 20–49 | |||
| 5 = 50–99 | |||
| 6 = 100 or more | |||
| meetwant | In your everyday life, do you meet as many potential partners as you want to? | 0 = Not nearly as many as I want | |
| 1 = Fewer than I want | |||
| 2 = Close to as many as I want | |||
| 3 = Yes, as many as I want | |||
| rominvwant | Perceived possibilities (P) | Do you receive as many romantic invitations (e.g., someone asking you out) as you would desire (or even more than you would desire)? | 0 = Not nearly as many as I want |
| 1 = Fewer than I want | |||
| 2 = Close to as many as I want | |||
| 3 = Yes, as many as I want | |||
| w_sexfind | If you were looking for a new partner to have sex with, how would you estimate your chances to do so within a week? | 0 = Very low | |
| 1 = A bit lower than average | |||
| 2 = Average | |||
| 3 = A bit higher than average | |||
| 4 = Very high | |||
| m_romfind | If you were looking for a new partner to have a romantic relationship with, how would you estimate your chances to do so within a month? | 0 = Very low | |
| 1 = A bit lower than average | |||
| 2 = Average | |||
| 3 = A bit higher than average | |||
| 4 = Very high | |||
| sextime | If you were looking for a new partner to have sex with, in what time do you think it would be realistic for you to find one? | 3 = Within a week | |
| 2 = Within a month | |||
| 1 = Within 6 months | |||
| 0 = More than 6 months | |||
| sexcompr | Compared to people of the same age and gender as you, how many sex partners do you think you could have if you tried to? | 0 = Much fewer than others | |
| 1 = A bit fewer than others | |||
| 2 = As many as others | |||
| 3 = A bit more than others | |||
| 4 = Many more than others | |||
| sexinvintr | How often do you receive sexual invitations from persons you might be interested in? | 0 = Never | |
| 1 = Fairly seldom | |||
| 2 = Sometimes | |||
| 3 = Quite often | |||
| 4 = Almost daily |
Note. The items were rated on a 4-, 5-, or 7-point Likert-type scale.
Declaration of Conflicting Interests
The author(s) declared no potential conflicts of interest with respect to the research, authorship, and/or publication of this article.
Funding
The author(s) received no financial support for the research, authorship, and/or publication of this article.
Supplemental Material
The supplemental material for this article is available online.
References
Supplementary Material
Please find the following supplemental material available below.
For Open Access articles published under a Creative Commons License, all supplemental material carries the same license as the article it is associated with.
For non-Open Access articles published, all supplemental material carries a non-exclusive license, and permission requests for re-use of supplemental material or any part of supplemental material shall be sent directly to the copyright owner as specified in the copyright notice associated with the article.