
Abstract
Venn diagrams are a staple visualisation tool for presentation of data, concepts and sets. We present a novel three-way Venn diagram based on three closed polygonal curves resembling boat shapes, called “boat diagrams,” with two variants. We show that boat diagrams and the traditional three-way circular Venn diagram may be fully described using a size parameter that scales the diagrams, and a separation parameter that modifies their shape and the relative areas of the internal regions (triple-, double-, or non-intersecting). We investigated boat diagrams quantitatively by assessing relative areas of each region as a function of their separation parameter. Relative to each other, and to their analogous circular Venn diagram, boat diagrams behave differently with respect to their regions’ areas. For one variant, evenness across all seven internal regions (or three types of region) can be improved relative to the circular variant. We also compare them to other three-way Venn drawing tools across several criteria. We present two use cases (qualitative and quantitative) of science communication and one use case illustrating how they could be implemented as an educational tool, distinct from circular Venn diagrams. We have implemented an open-access online tool to explore the relative properties of these novel diagrams and export them for use in visualisation.
Introduction
Venn diagrams and their uses
Venn diagrams are described as a form of diagram to “to help visualise relationships between classes or concepts in logic.” 1 They are used across a range of research fields as diverse as data science, 2 regression, 3 qualitative research, 4 bioinformatics, 5 and within mathematics for visualisation of logic and sets.1,6 They have been a feature in the teaching of mathematics from a young age for decades. 6 Venn diagrams can be considered a familiar term, with most people understanding the basic concept of their representing what is unique and what is shared across groups or concepts. Although superficially similar diagrams of overlapping or enclosed circles had been used before, notably by Leibnitz and Euler, 1 they got their name from John Venn who proposed them as a new kind of diagram and method for analysing logical statements.1,7 Venn 7 described his diagrams as “a general framework for indicating every possible combination producible by the given class terms.” They dealt with some ambiguities and problems he had found with previous approaches and, as Venn put it concisely, “put a finger on any compartment and the letter indication is unambiguous” and “no one of the elements trespasses upon the ground of any other.” By “letter indication” he was referring to each possible region that contained a unique set, for example, A ∩ B ∩ C, A ∩ B−C, A−B−C etc.
Venn’s diagrams for two or three closed curves consisted of circles, while those for four or more closed curves must depart from circles (Venn used ellipses, but many other forms have now been discovered 8 ). For the two- or three-way versions, Venn said “Of course any closed figure will do as well as a circle since all that we demand of it, in order that it shall adequately represent the contents of a class, is that it shall have an inside and an outside so as to indicate what does and what does not belong to the class.” 7 Venn diagrams are made with any closed curves (i.e. curves that exactly divide the plane into one external and one internal region) such that the “collection must have the property that the curves intersect in only finitely many points and the property that the intersection of the interiors of any of the 2 n sub-collections of the curves is a nonempty connected region,” where n is the number of curves. 9
A review of state-of the-art set methods showed that set visualisation has advanced far since the early Venn diagrams. 10 One of the challenges of set visualisation is the large number of possible relations between sets, particularly if the number of sets is high. Six categories of the main visualisation approaches for set relations have been described, each of which have strengths and weaknesses: (i) Euler and Venn diagrams, (ii) overlays, (iii) node-link diagrams, (iv) matrix-based techniques, (v) aggregation techniques, and (vi) scatter plots or other techniques. 10 New approaches are developed regularly, for example hoop diagrams 11 and UpSet diagrams. 12 Many of these approaches have been developed to suit more complex, larger numbers of sets, possible intersections and elements, while Euler and Venn diagrams are still widely used as a visualisation tool for smaller numbers of sets. 13 The benefits of Venn diagrams for intersections of two or three sets include their clear indication of set membership and perception that closed curves are easier for organising space into regions than proximity or similarity. 10 Euler diagrams only show regions that exist (i.e. contain elements) whereas Venn diagrams show all possible intersections even if they contain no elements. 14
Boat diagrams
We present two variants of a novel design of rotationally symmetrical Venn diagram consisting of three closed curves, each of which is shaped like a boat. Instead of circles, boat diagrams instead start with three non-intersecting equilateral triangles of equal size (Figure 1(a)), which we call the “fundamental triangles.” These can be pushed inwards, creating an overlap to form a triple-intersecting region and three non-intersecting regions (Figure 1(b)). By joining the closest exposed corners of the fundamental triangles we create additional triangular areas forming a third type of region representing double-intersecting regions (Figure 1(c)). The shape then has the same seven internal regions that can be represented by a three-way circular Venn diagram. This first variant is called a “paper boat” diagram because the polygon comprising a triple intersection (a “sail”) and a non-intersecting region (the central “hull”) flanked by two double intersections (the “bow and stern”) forms a closed curve shaped like a paper boat (Figure 1(c)). This is the equivalent of a circle in a traditional three-way Venn diagram. Additionally, instead of joining the exposed corners of the fundamental triangles by a straight line (Figure 1(c)), a larger (fourth) equilateral triangle could be placed over the whole diagram, making the double-intersecting corner regions diamond-shaped rather than triangular and twice as big as in the original variant. We call this second variant the “Zumwalt” boat diagram, because the polygon comprising a triple intersection and a nonintersecting region flanked by two double intersections now somewhat resembles a Zumwalt-class destroyer which has characteristic downward-sloping bow and stern (Figure 1(d)). The two designs together we call “boat diagrams” and the two variants the paper boat (P) variant and the Zumwalt (Z) variant.
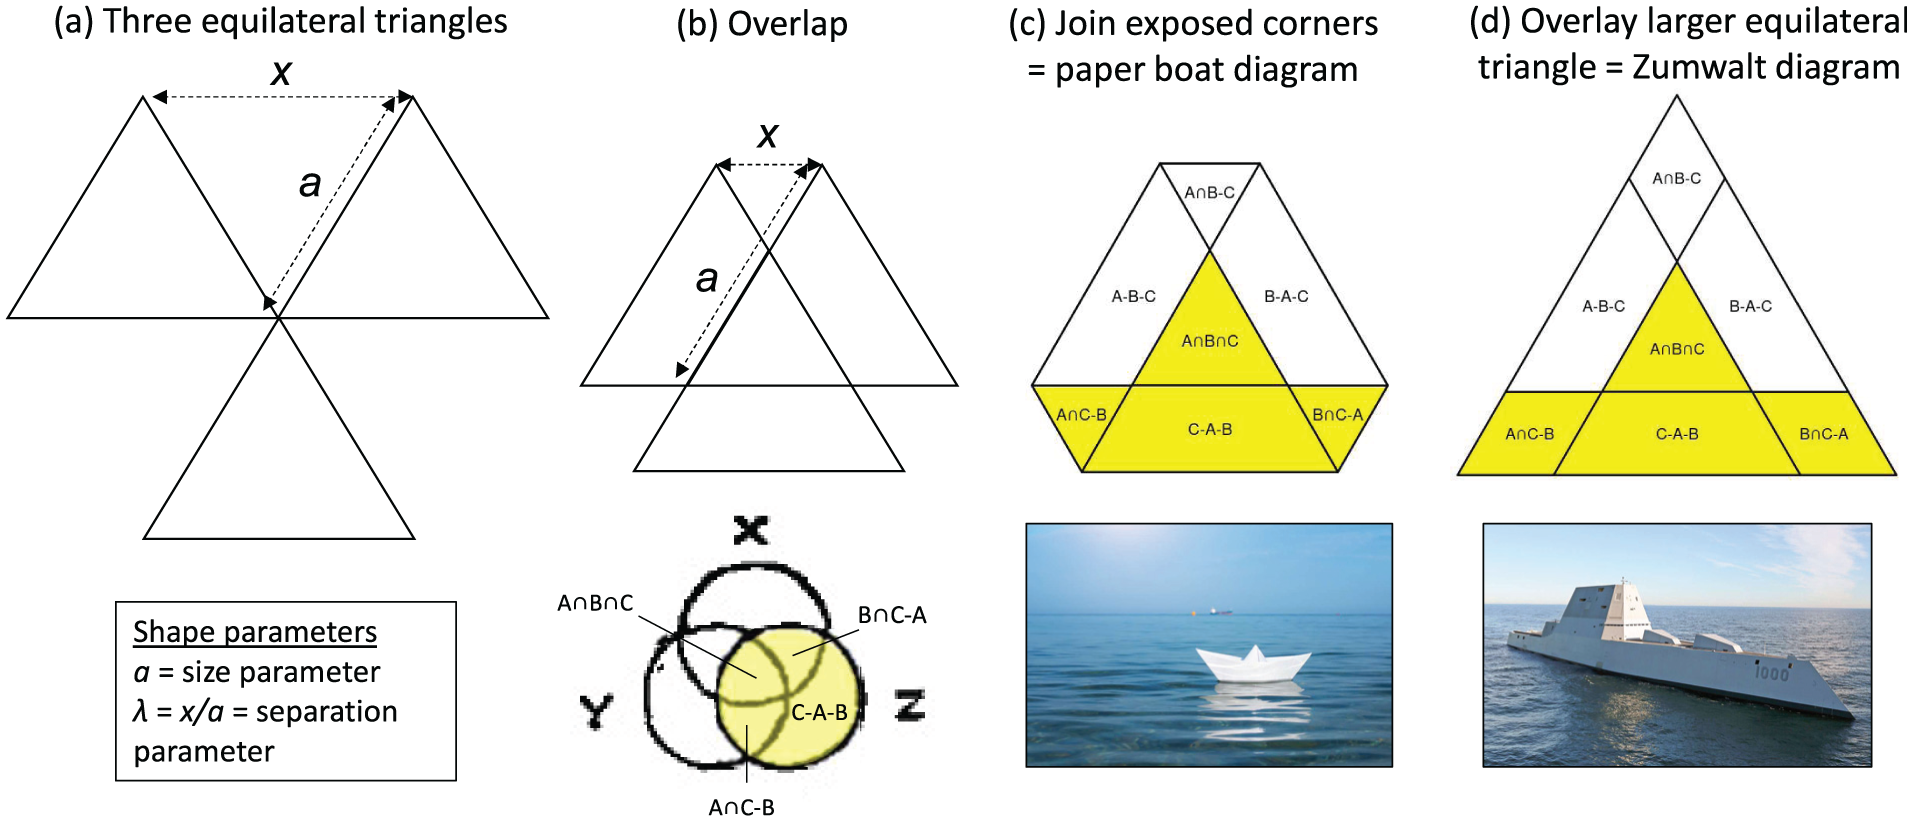
Creation of boat diagrams from (a) three fundamental equilateral triangles of equal size that join at a single point, which are then (b) overlapped to create an intersection, and then modified to create the variants (c) “paper boat diagram” by joining the exposed corners of the fundamental triangles, or (d) “Zumwalt diagram” by using a larger equilateral triangle as minimum-sized envelope. Closed curves comprising a triple intersection and a non-intersecting region flanked by two double intersections (equivalent to a circle in a traditional three-way Venn diagram), are shown in yellow, with Venn’s 7 original drawing shown (his curve Z is equivalent to our curve C). Each diagram consists of three such overlapping boat-shaped closed curves. They can both be described by two shape parameters representing their size a, and degree of separation λ. Paper boat image by Toltek, licenced from istockphoto.com. Zumwalt destroyer is a public domain image by US Navy/General Dynamics Bath Iron Works, from en.wikipedia.org.
Aims
The aim of this paper is to describe in detail the features of boat diagrams and provide both quantitative and qualitative use cases. First, we explore how the relative areas of each region (or type of region) vary with degree of separation λ (Figure 1), and how this compares to the properties of the three-way circular Venn diagram. We then determine the optimal separation for boat diagrams (P and Z variants) and their circular equivalent in terms of evenness of area of the regions or types of region. Second, we compare features of boat diagrams to existing three-way Venn/Euler diagram drawing tools and present three use cases in data visualisation and as educational tools. We also provide an online tool so that a researcher can easily generate boat diagrams and code to reproduce them in R for information or set visualisation.
Methods
Shape parameters of boat diagrams and three-way symmetrical circular Venn diagrams
We consider only diagrams with rotational symmetry here. Both types of boat diagram begin with three separate, equally-sized equilateral triangles set with rotational symmetry pointing inwards (0°, 120°, and 240°), meeting at a central point (Figure 1(a)). These triangles have a size parameter a describing the length of each side. For a given value a, every boat diagram’s shape can be described by a separation parameter λ, defined as the distance x between the centres of two triangles divided by a. When the three triangles are separate but meet at one corner then x = a and λ = 1 (which creates a diagram where A ∩ B ∩ C is reduced to a single point). When they fully overlap, x = 0 so λ = 0 (creating a diagram that only consists of A ∩ B ∩ C). Between these, for any 0 < λ < 1, boat diagrams will always contain all seven regions although the relative areas of the three types of region (and, in the case of A−B−C, B−A−C and C−A−B, their shapes) will vary widely. While A ∩ B ∩ C will always be a triangle and A ∩ B−C, A ∩ B−C and B ∩ C−A will always be triangles (P variant) or diamonds (Z variant), A−B−C, B−A−C and C−A−B start as very elongated trapezia, becoming less elongated as λ increases and finally becoming equilateral triangles at λ = 1. The dimensions of each of the seven regions as a function of a and λ are shown in the Supplemental Material (Section S1; with the equivalent calculations for three-way circular Venn diagrams for comparison in Section S3).
Boat diagrams are not classed as simple, as more than two closed curves pass through some points of intersection (the perimeter of the central triangle A∩B∩C). 9 In addition, boat diagrams are non-monotone since, for example, region A−B−C, which is overlapped by one curve only (curve A), is adjacent to regions that are overlapped by two curves (A and B, or A and C), three curves (A, B and C) or no curves (the external region). 15 This contrasts with three-way circular Venn diagrams that are simple and monotone (the latter since each region is adjacent only to those that contain one fewer or one more curve). Like three-way circular Venn diagrams, boat diagrams can be described as exposed, since each closed curve (A, B or C) touches the outer face. 15
For comparison to boat diagrams, we also specified size and separation parameters for the much more familiar rotationally symmetrical three-way circular Venn diagram (details in Supplemental Material Section S3). For this, the size parameter is the radius r, and λ is defined initially as the distance x between any of the two circle centres relative to the diameter, hence
Relative areas of different internal regions
For visualisation purposes, one of the key aspects of Venn diagrams is the relative areas of the seven internal regions. In some applications users may wish to emphasise what A, B, and C all have in common, what they have in common in pairs, or what is unique to each. In other applications a balanced design may be desired whereby the areas of sectors or categories of sectors should be as equal as possible. A three-way Venn diagram can have up to eight regions (calculated as 2 n where n is the number of closed curves), but because the outer region (which is neither A, B nor C) extends to infinity it is ignored. Of the seven remaining internal regions, their relative areas will depend on the separation parameter λ, described above. The overall shape of the Z variant remains an equilateral triangle through every value of λ while the P variant is an equilateral triangle only at λ = 0, becoming a hexagon as soon as λ > 0 (with alternate long and short sides), and at λ = 1 is a regular hexagon with six equally shaped and sized regions.
There is no single objectively optimal value of the separation parameter λ because it depends on what aspects of the intersection the user wants to emphasise. However, to find the design that is most balanced in terms of sector areas we need a measure of variation among region sizes that is comparable across diagram types (P variant, Z variant, and three-way circular Venn diagram) and is not dependent on the size parameter of the diagram (a or r). We note that the seven regions are constrained to fit within the overall shape of the diagram, so none is free to change independently of the others. In mathematical terms, this means that they constitute a compositional basis sensu Aitchison, 16 with associated composition made up of the relative areas of each component region (area of each region divided by the area of the diagram); these relative areas sum to one. Following Aitchison, 16 an appropriate measure of variation among compositional components is the sum of the squares of the centred logratios (SSCLR) of the components, whereby for any one component x i among k components, the centred logratio is obtained as log(x i /g(x)), with g(x) being the geometric mean (x1…x k )1/k(x i > 0,0 < i < k). We considered that the optimal value of λ was the one that minimised the SSCLR, obtained by solving the equation dSSCLR/dλ = 0.
It seems intuitively logical to minimise SSCLR across all seven components that make up the diagram, except that although there are seven of them, they correspond to only three types, two of which are replicated three times. So it is also logical just to minimise across the three types, if the aim is to make the area of those types as equal as possible. We therefore minimised SSCLR both across the three types of internal region (triple, double or non-intersecting regions; SSCLR3), and across all seven possible internal regions (SSCLR7). To allow comparability between approaches we converted minimum SSCLR values to a mean squared centred logratio (MSCLR) as SSCLR7/7 or SSCLR3/3; the value of λ that minimises SSCLR also minimises MSCLR. Thus, six values for MSCLR were calculated, representing three types of diagram (P variant vs Z variant vs three-way circular Venn diagram) and for both approaches (SSCLR7 vs SSCLR3). Calculations are presented in the Supplemental Material (Sections S2 and S4).
To visualise the impact of λ on the relative areas of all seven internal regions or all three types of internal region, we calculated the relative area of each (proportional to the total area of the diagram) for all values of λ between 0 and 1, plotted these and overlaid them with vertical lines at the values of λ that minimised the corresponding SSCLR. We also present the six diagrams generated by those values of λ.
Online tool to generate boat diagrams and code to reproduce them in R
We implemented an online tool using the R package “shiny,” 17 hosted at https://methodecology.shinyapps.io/boatdiagrams. The tool allows visualisation of both P and Z variant boat diagrams, as well as three-way rotationally-symmetrical circular Venn diagrams for comparison. Colours can be varied for each region (or using some preset schemes) and lines can be drawn at different widths or excluded. For each type of diagram, λ can be varied between 0 and 1 (with size parameters a or r fixed at 1) to explore the behaviour of each diagram, and a graph of relative areas of each region are provided which react to the value of λ selected. This also allows reproducibility of diagrams with optimal relative areas of different internal regions (below). For the selected set of diagram parameters chosen, the tool generates open R code that can be used to reproduce that same diagram in R 18 for further adaptation and use in data or concept visualisation (see Supplemental Material Section S5 for notation). Boat diagrams are plotted in base R so no packages are required, while circular Venn diagrams require the R packages “plotrix” 19 and “sp.” 20
Comparison of features of boat diagrams
With the online tool, we extended a comparison of key features of Venn/Euler drawing techniques completed by Alsallakh et al. 10 We took their comparison of five drawing tools for precisely three sets and added boat diagrams plus five other tools not included in their comparison. We then assessed how boat diagrams compare to these other approaches according to seven criteria identified as important for set visualisation. 10
Use cases
Using three use cases of information visualisation, two within our own discipline of wildlife ecology, one qualitative and one quantitative, and one in early-years education, we constructed boat diagrams to illustrate and communicate set membership patterns. We then also constructed alternative three-circle Venn diagrams (using our own tool and the DeepVenn tool 21 ) and in one use case an UpSet diagram, 12 and we critically compare the outputs. In a similar approach to Lex et al. 12 we constructed these diagrams with input from research collaborators and sought their feedback on the extent to which boat diagrams met certain visualisation criteria, as well as on their overall effectiveness and visual appeal.
Results
Relative areas of different internal regions
Relative areas of each internal region or type of region with respect to λ are shown in Figure 2(a)–(c) for each type of diagram. The relative sizes of the three region types or seven regions themselves vary widely with λ. The area of A∩B∩C falls from 100% to 0% of the diagram area as λ increases from 0 to 1, and the size of the two-way overlaps increases from 0% to 50% or 60% (depending on the variant). The side areas A−B−C, B−A−C and C−A−B are more nuanced in that their relative area first increases and then decreases as they change from an elongated trapezium, narrow, and eventually become a triangle. In contrast, for the three-way circular Venn diagram (Figure 2(c)), it is the areas of the double-intersecting regions (A∩B−C etc.) that are highest at intermediate values and remain relatively very small across most values of λ, while the non-intersecting regions consistently get larger with increasing separation towards λ = 1. The diagrams represented by each minimum mean squared centred logratio (MSCLR; minimum MSCLR represents the design that is most balanced in terms of region areas) are shown in Figure 2(d)–(i).

Relative areas of internal regions for (a) and (b) the two boat diagram variants and (c) the three-way circular Venn diagram. The value of λ that minimises the mean squared centred logratio, that is, where the regions are most similar in relative area, is shown for each with a vertical solid line for minimisation across one of each type of region (e.g. A∩B∩C, A∩B−C and A−B−C), or a vertical dashed line for minimisation across all seven internal regions. The six resulting “optimal” shapes are shown in panels (d–i).
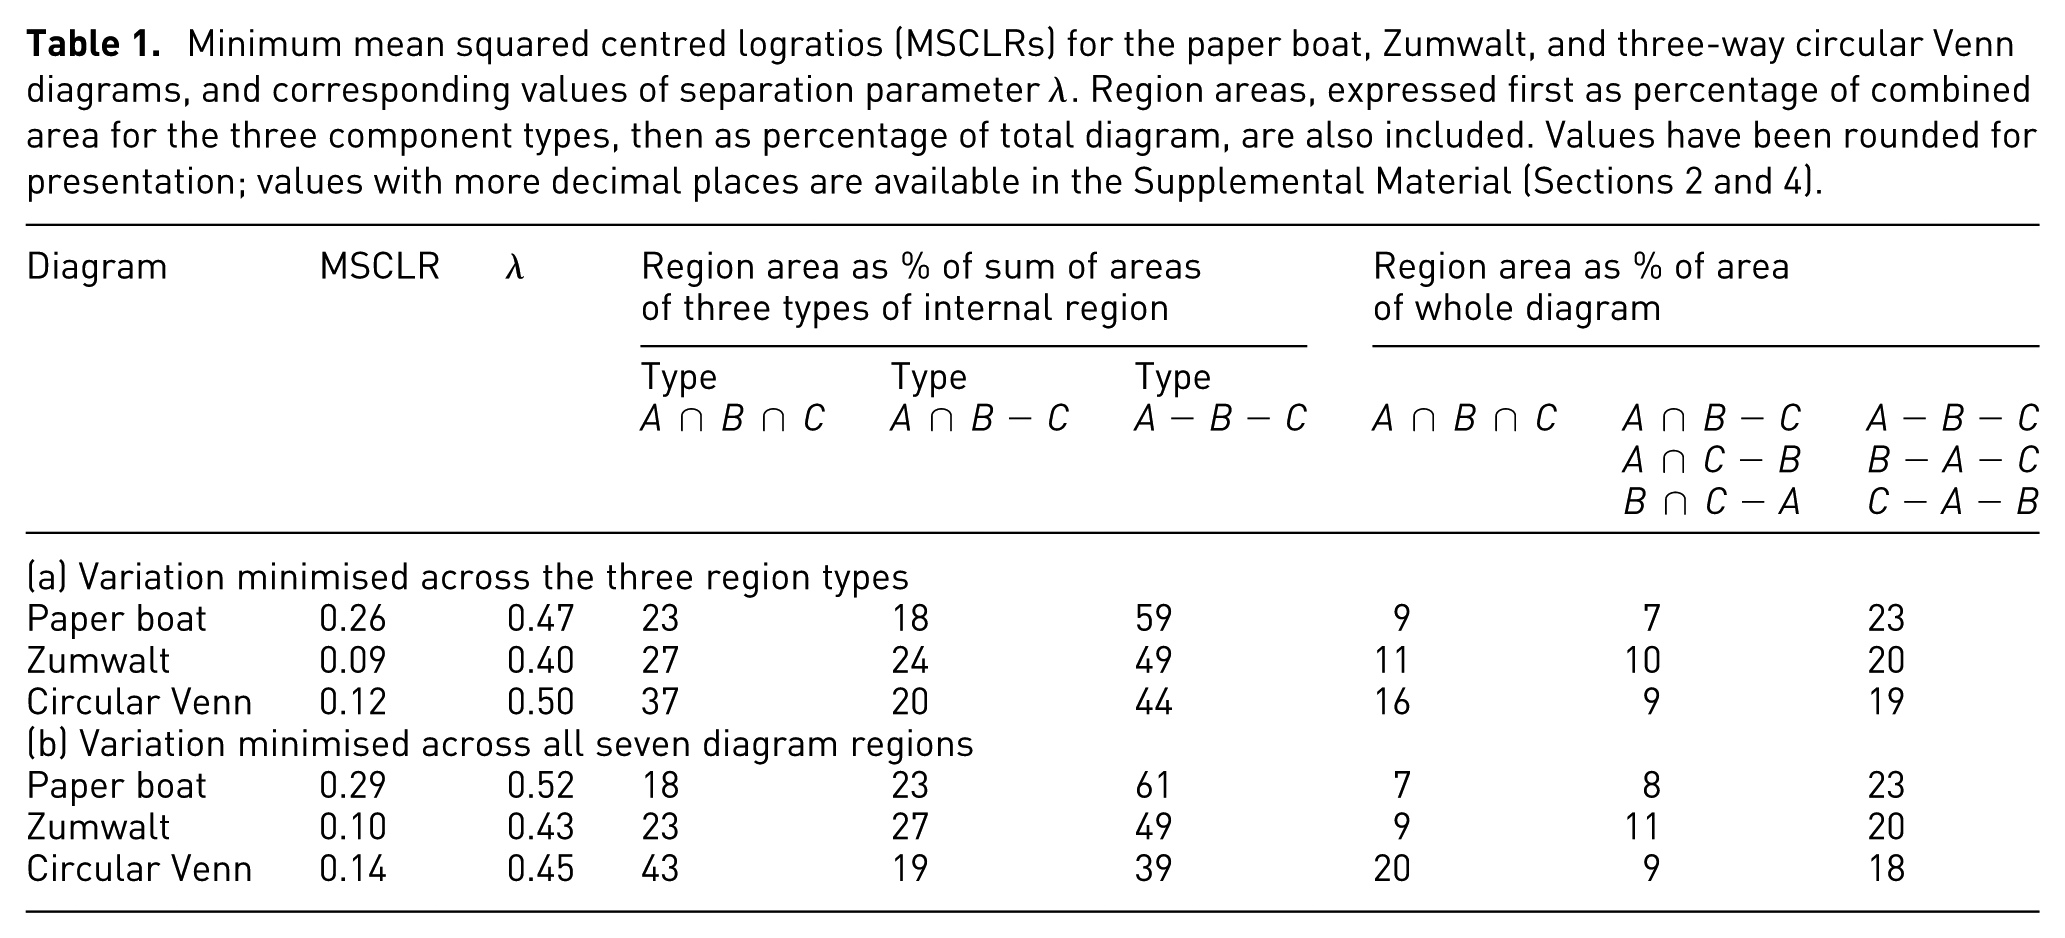
The minimised MSCLR values and the corresponding values of λ are in Table 1 and also indicated by the vertical line labelled ’Optimal separation’ within the online tool (https://methodecology.shinyapps.io/boatdiagrams). In addition, the relative area contributed by each region at these is given, either as a percentage of a set of three types of region or as a percentage of the whole diagram. Comparing the three types of diagram, the Zumwalt design consistently achieved the lowest MSCLR, closely followed by the circular Venn diagram. The two behaved very differently, however. For the Zumwalt design, there was one large region type, A−B−C, and two small region types, with the size of A−B−C being more than twice that of the smallest type A∩B∩C. In contrast, for the circular Venn diagram, there were two large region types, A∩B∩C and A−B−C, and one small one; the size of the largest region type was again more than double that of the smallest. The paper boat diagram was a more extreme version of the Zumwalt, with a threefold difference between largest and smallest regions. In all cases, the variation among regions (MSCLR) was at least 10% smaller when minimised across region types than when minimised across all components.
Minimum mean squared centred logratios (MSCLRs) for the paper boat, Zumwalt, and three-way circular Venn diagrams, and corresponding values of separation parameter λ. Region areas, expressed first as percentage of combined area for the three component types, then as percentage of total diagram, are also included. Values have been rounded for presentation; values with more decimal places are available in the Supplemental Material (Sections 2 and 4).
Comparison of boat diagrams versus other online Venn/Euler diagrams
Alsallakh et al. 10 provide a detailed discussion of the features of Venn/Euler diagrams and provide a comparison of features of various “automatic drawing techniques” (in their Table 1). Five of the 13, like boat diagrams, are designed for precisely three curves. We added our boat diagram drawing tool to this table for a direct comparison (Table 2), two other approaches we located that were designed for three sets (the “Missing pieces” tool 22 and “Fan diagrams” 23 ) and also the tools “nVenn,” 24 “eulerr,” 25 and “DeepVenn”. 21
An extended version of “features of implemented automatic drawing techniques for Euler and Venn diagrams” adapted from Alsallakh et al. 10 to include only methods designed for precisely three curves. Previously identified tools are in (a) and some additional identified tools and boat diagrams (this study) are added in (b). Features are defined in the text.
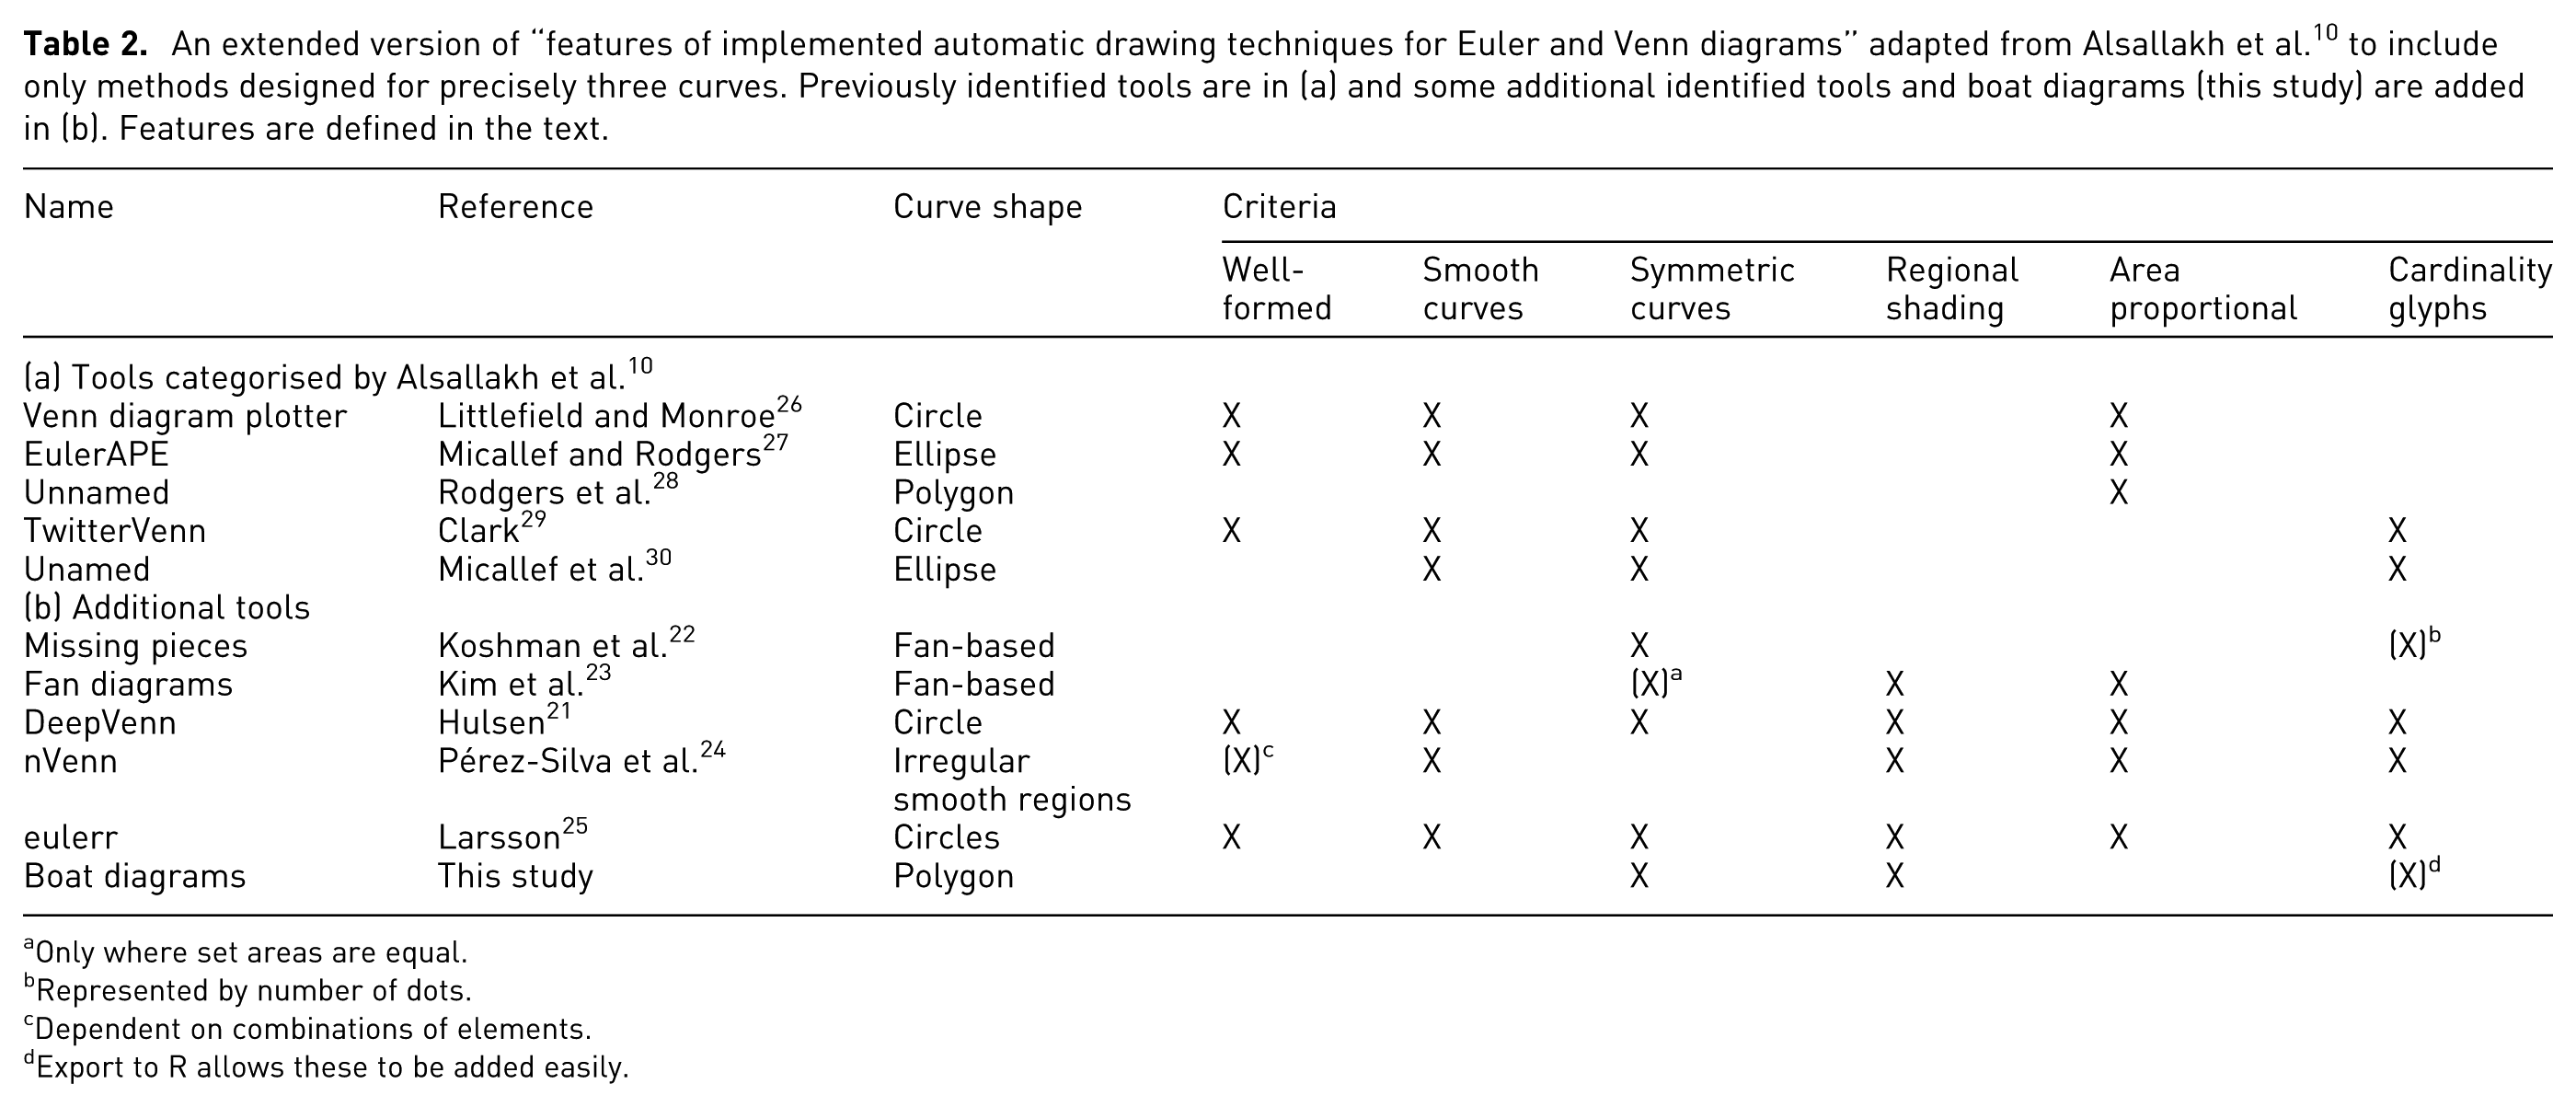
Only where set areas are equal.
Represented by number of dots.
Dependent on combinations of elements.
Export to R allows these to be added easily.
The only approaches in Table 2 that satisfy all of the criteria were DeepVenn and eulerr. Boat diagrams are not “well formed,” since while every set is represented by one curve, and every set relation is represented by at most one region, they do not meet the criteria that curves meet at most at one point where they cross. 10 Boat diagrams, unlike many tools in Table 2, do not employ “smooth curves,” a feature that has been identified as potentially important in Venn diagrams. According to Blake et al. 31 circles are the best shape for curves in terms of understanding, but this is followed by curves that are highly symmetric and regions whose shapes are highly distinguishable from the curves. When the closed curves of a Venn diagram are smooth then they may pop out pre-attentively (i.e. subconsciously) even if irregular. 10 This is a potential limitation of boat diagrams, where the boat shape representing each curve must, to some extent, be known prior to visualisation. Boat diagrams are highly symmetrical, and potentially once the shape is known (boat diagrams have the advantage that the curves have a familiar shape, i.e. that of boats) then the region shapes (triangles, trapezia or diamonds or rhombi) are easily distinguishable.
One criterion met by the boat diagram tool is that of “regional shading.” It should be noted that our boat diagram tool is highly flexible colour-wise, with hex RGB colouring allowing any of 256 3 colours to be used (demonstrated later). This is also true of eulerr 25 and also the R and Python Package version of a tool called BioVenn 32 (of which DeepVenn is an extension).
“Cardinality glyphs” refer to labelling regions with the number of elements in that region. In its current form, the boat diagrams tool does not have this feature, but the tool is designed specifically to produce R code that allows easy output of diagrams with given shape parameters and colour schemes. Such glyphs can easily be added later in figure production (see below), and indeed we found that a more flexible system, since we were able to change their colour, size and position easily.
Boat diagrams are not “area proportional” although, as we described above, the relative areas of types of region can be varied within a given range by adjusting λ. Area proportionality is challenging when combined with some of the other criteria. For example, where the shapes are constrained, such as circles, there are limited degrees of freedom and an accurate area-proportional circular Venn diagram is possible only for two sets; with more sets misleading diagrams can be drawn. 10
Use cases in science communication
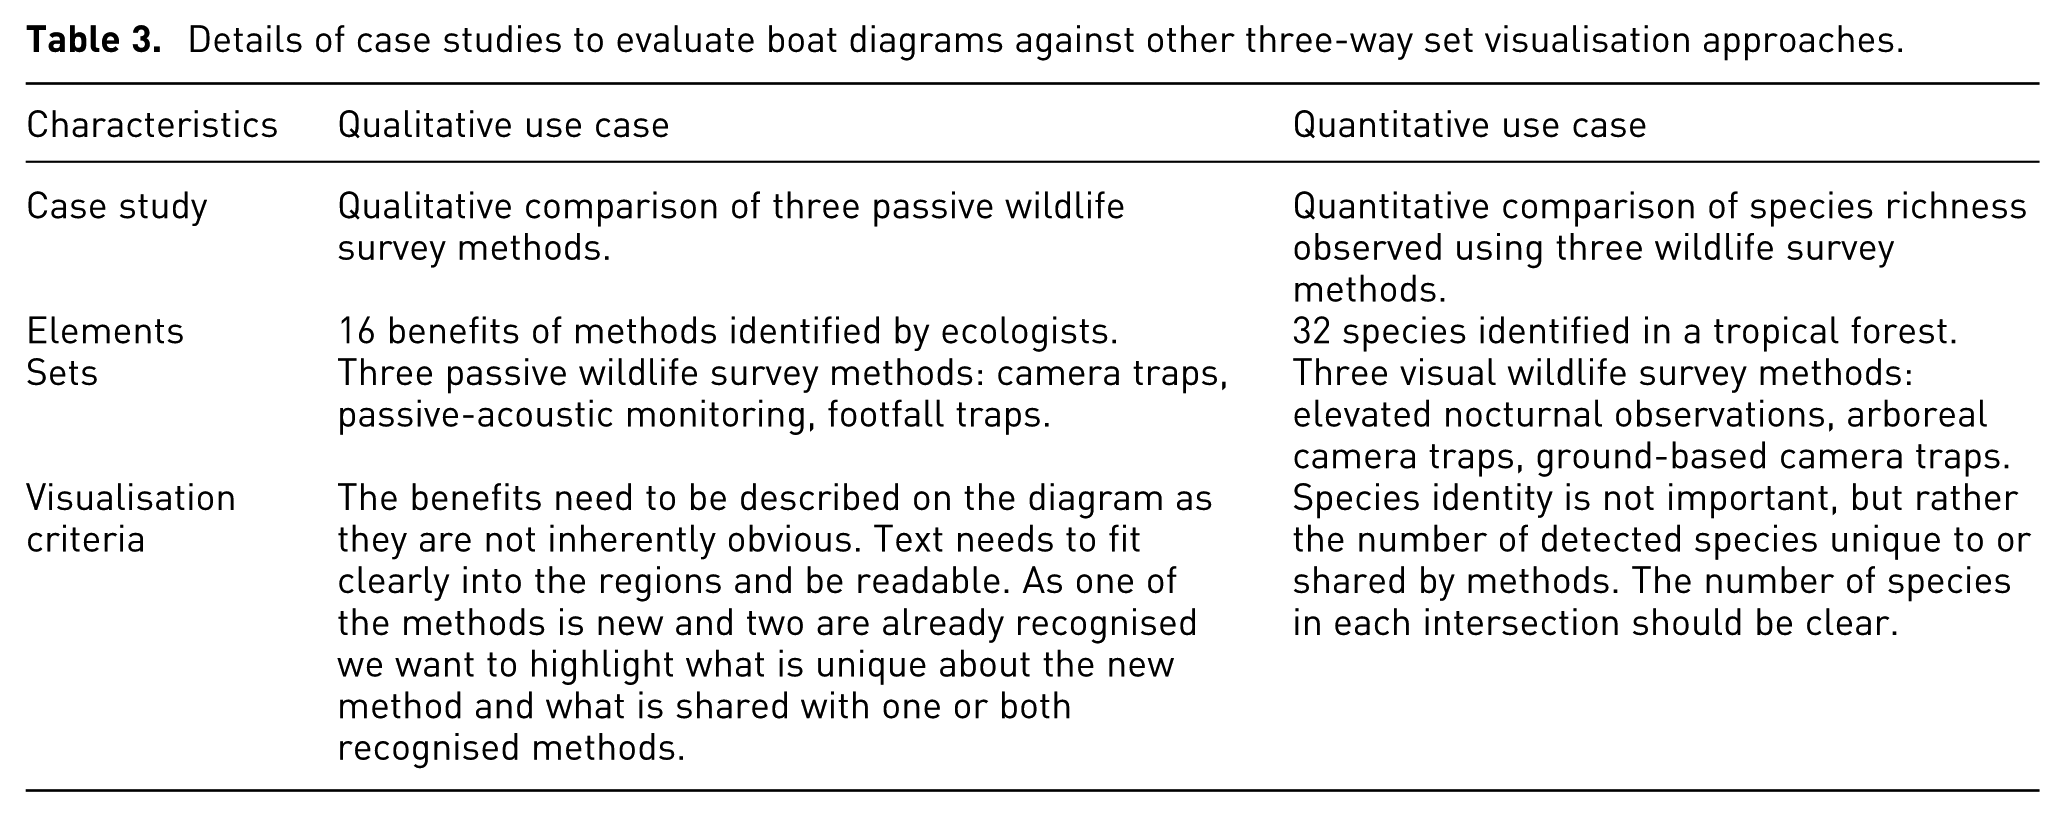
To evaluate boat diagrams in real science communication scenarios we made a comparison using two examples from our own field of wildlife ecology, one qualitative and one quantitative. These are summarised in Table 3, including what the sets, elements and visualisation requirements were. These are based on real studies currently underway, which gave added incentive to find good ways to present information. In both cases the researchers working on these data fed into the diagrams during design and then provided comments on the boat diagram designs in terms of the extent to which they met the visualisation criteria and views on how easy they were to interpret and their visual appeal.
Details of case studies to evaluate boat diagrams against other three-way set visualisation approaches.
For the qualitative use case, we made a simple comparison between boat diagrams and three-way circular Venn diagrams using our own online tool. Because we wanted to highlight one of the methods in particular (as it was new), our tool was appropriate as it produces symmetrical versions of each and allows individual shading per region. The outputs are in Figure 3.
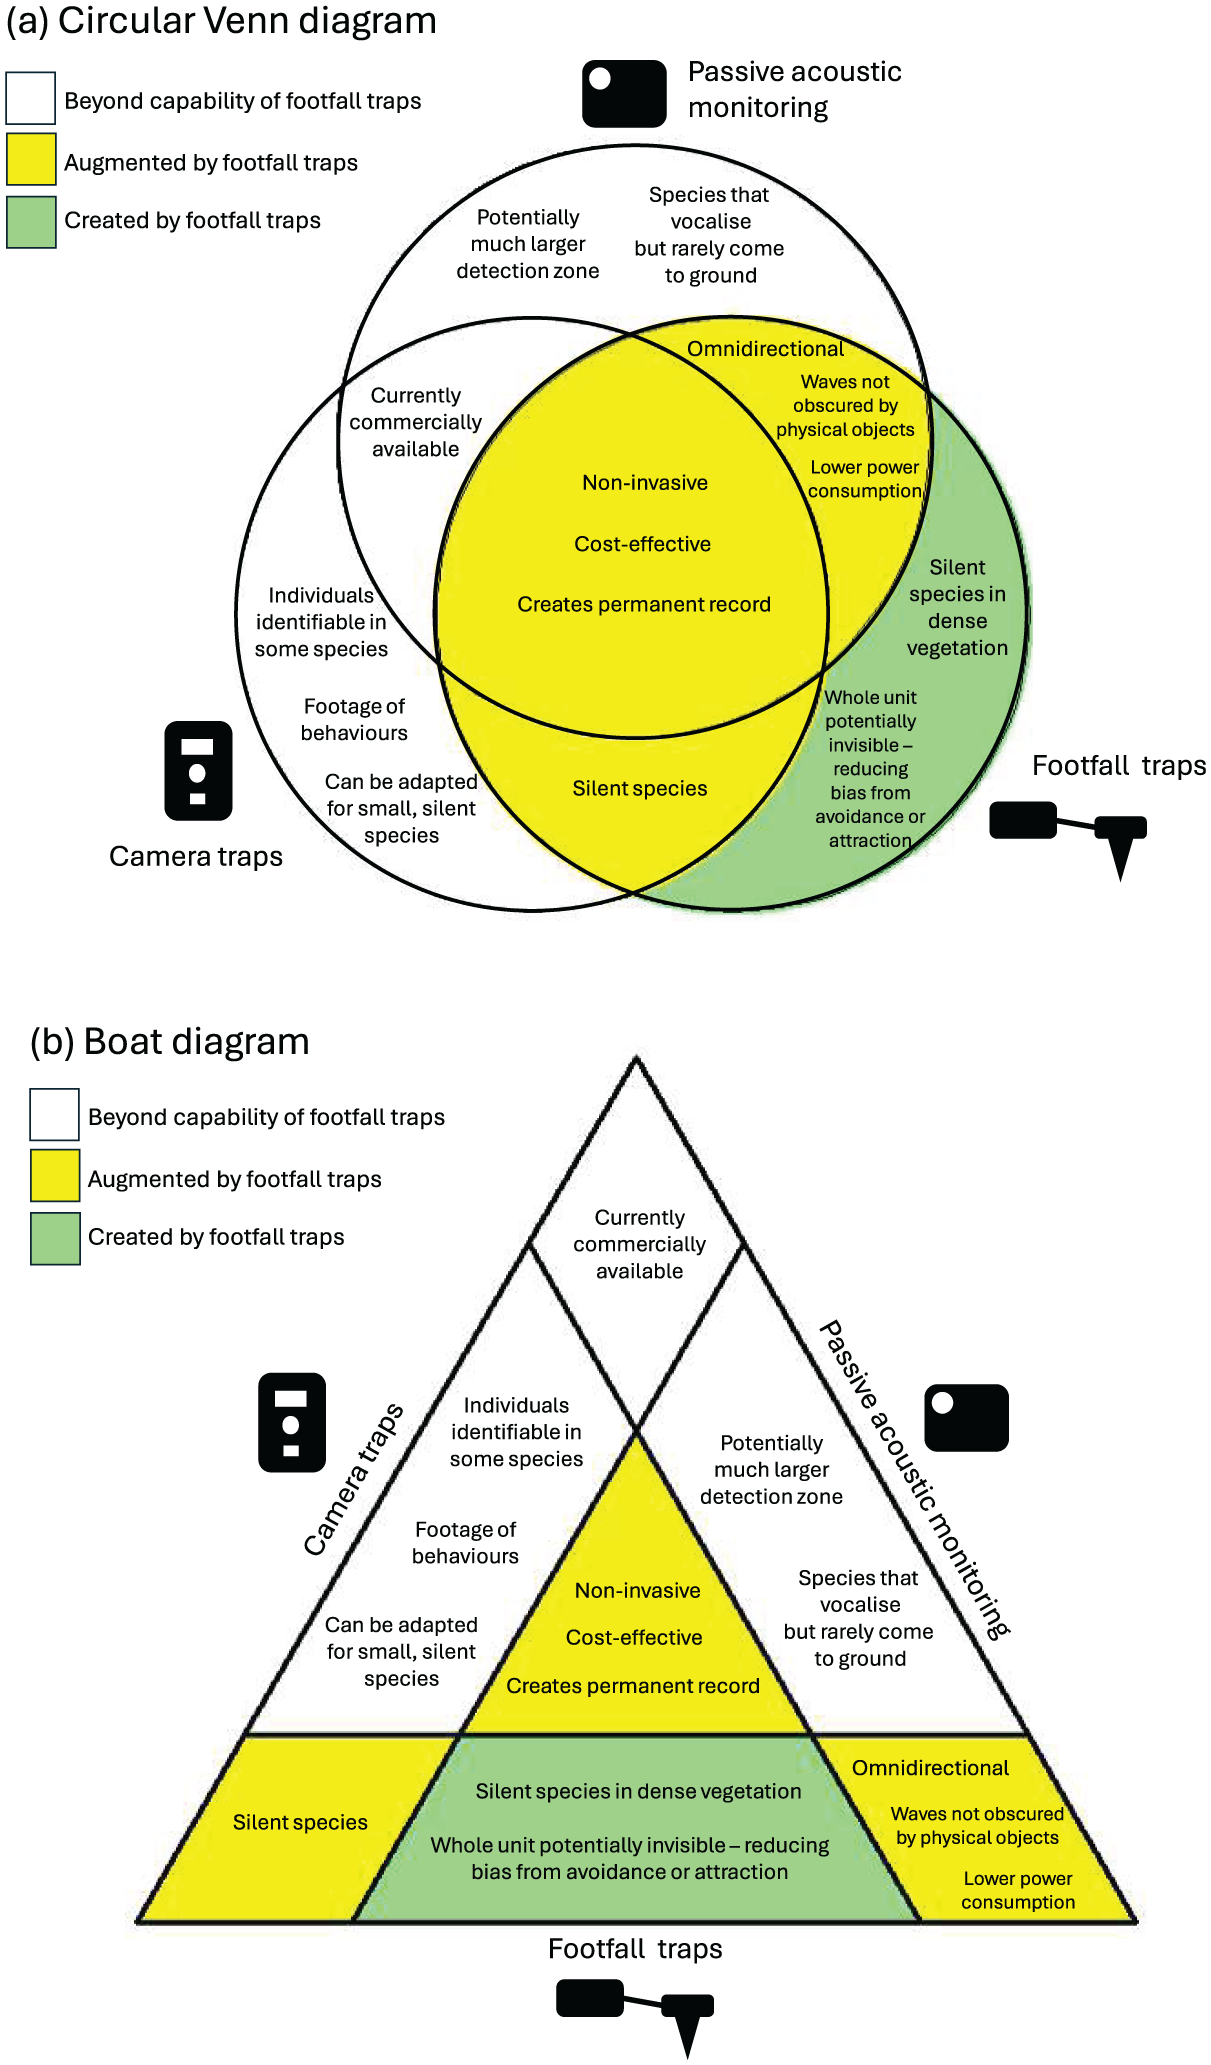
Comparison of (a) circular Venn diagram and (b) Z-variant boat diagram using our online tool to demonstrate the unique and shared capabilities for three passive wildlife monitoring approaches. The footfall traps method is new, and so diagrams have been shaded to show what passive survey capabilities that method creates (green) or augments (yellow), with unshaded areas outside the capability of footfall traps.
Both circular Venn and boat diagrams were able to illustrate the unique and shared features of the three methods in Figure 3. Despite the curved nature of the Venn diagram, we were able to fit three capabilities into the intersection of B∩C. Nevertheless, it appears to look more cramped than the corresponding region in the boat diagram and, generally, there is better symmetry possible in the placement of text in the boat diagram than in the Venn diagram because of the shape of the regions. Hence the boat diagram opens up a different approach to illustrate this kind of information for three sets.
The collaborator in this use case, a PhD student working in the relatively novel field of wildlife seismic surveying commented that the boat diagram (Figure 3(b)) was “effective at communicating overlap in the context of equally represented (unweighted) domains - in our case, comparing methodologies that have advantages and disadvantages” and that “the text describing the elements fits cleanly into the boat diagram owing to the more uniform shape, and this seems to accommodate lengthier statements better.” However, unfamiliarity with the boat shapes was commented on: “I… find the continuity of the straight lines in the boat diagram slightly distracting, which makes distinguishing domains more challenging.” In this unique case where the addition of one set to two existing ones was being highlighted and so the boat shape was shown (Figure 3(b)), however, he commented that this “clearly highlights the ‘boat’ structure and enhances understanding.” It should be noted that the boat diagram (Figure 3(b)) was selected to take forward for a publication on this topic.
For the quantitative use case, there were more options. We chose two approaches that are freely available: DeepVenn 21 and UpSet diagrams (drawn in the UpSetR package 33 ). We then constructed two boat diagrams, one designed using the same colour scheme as DeepVenn for direct comparison, and the other using the benefit of hex RGB shading in our online tool to shade regions with a colour gradient related to the number of species represented. These are shown in Figure 4. We added our own large cardinality glyphs to three of the diagrams to improve readability.
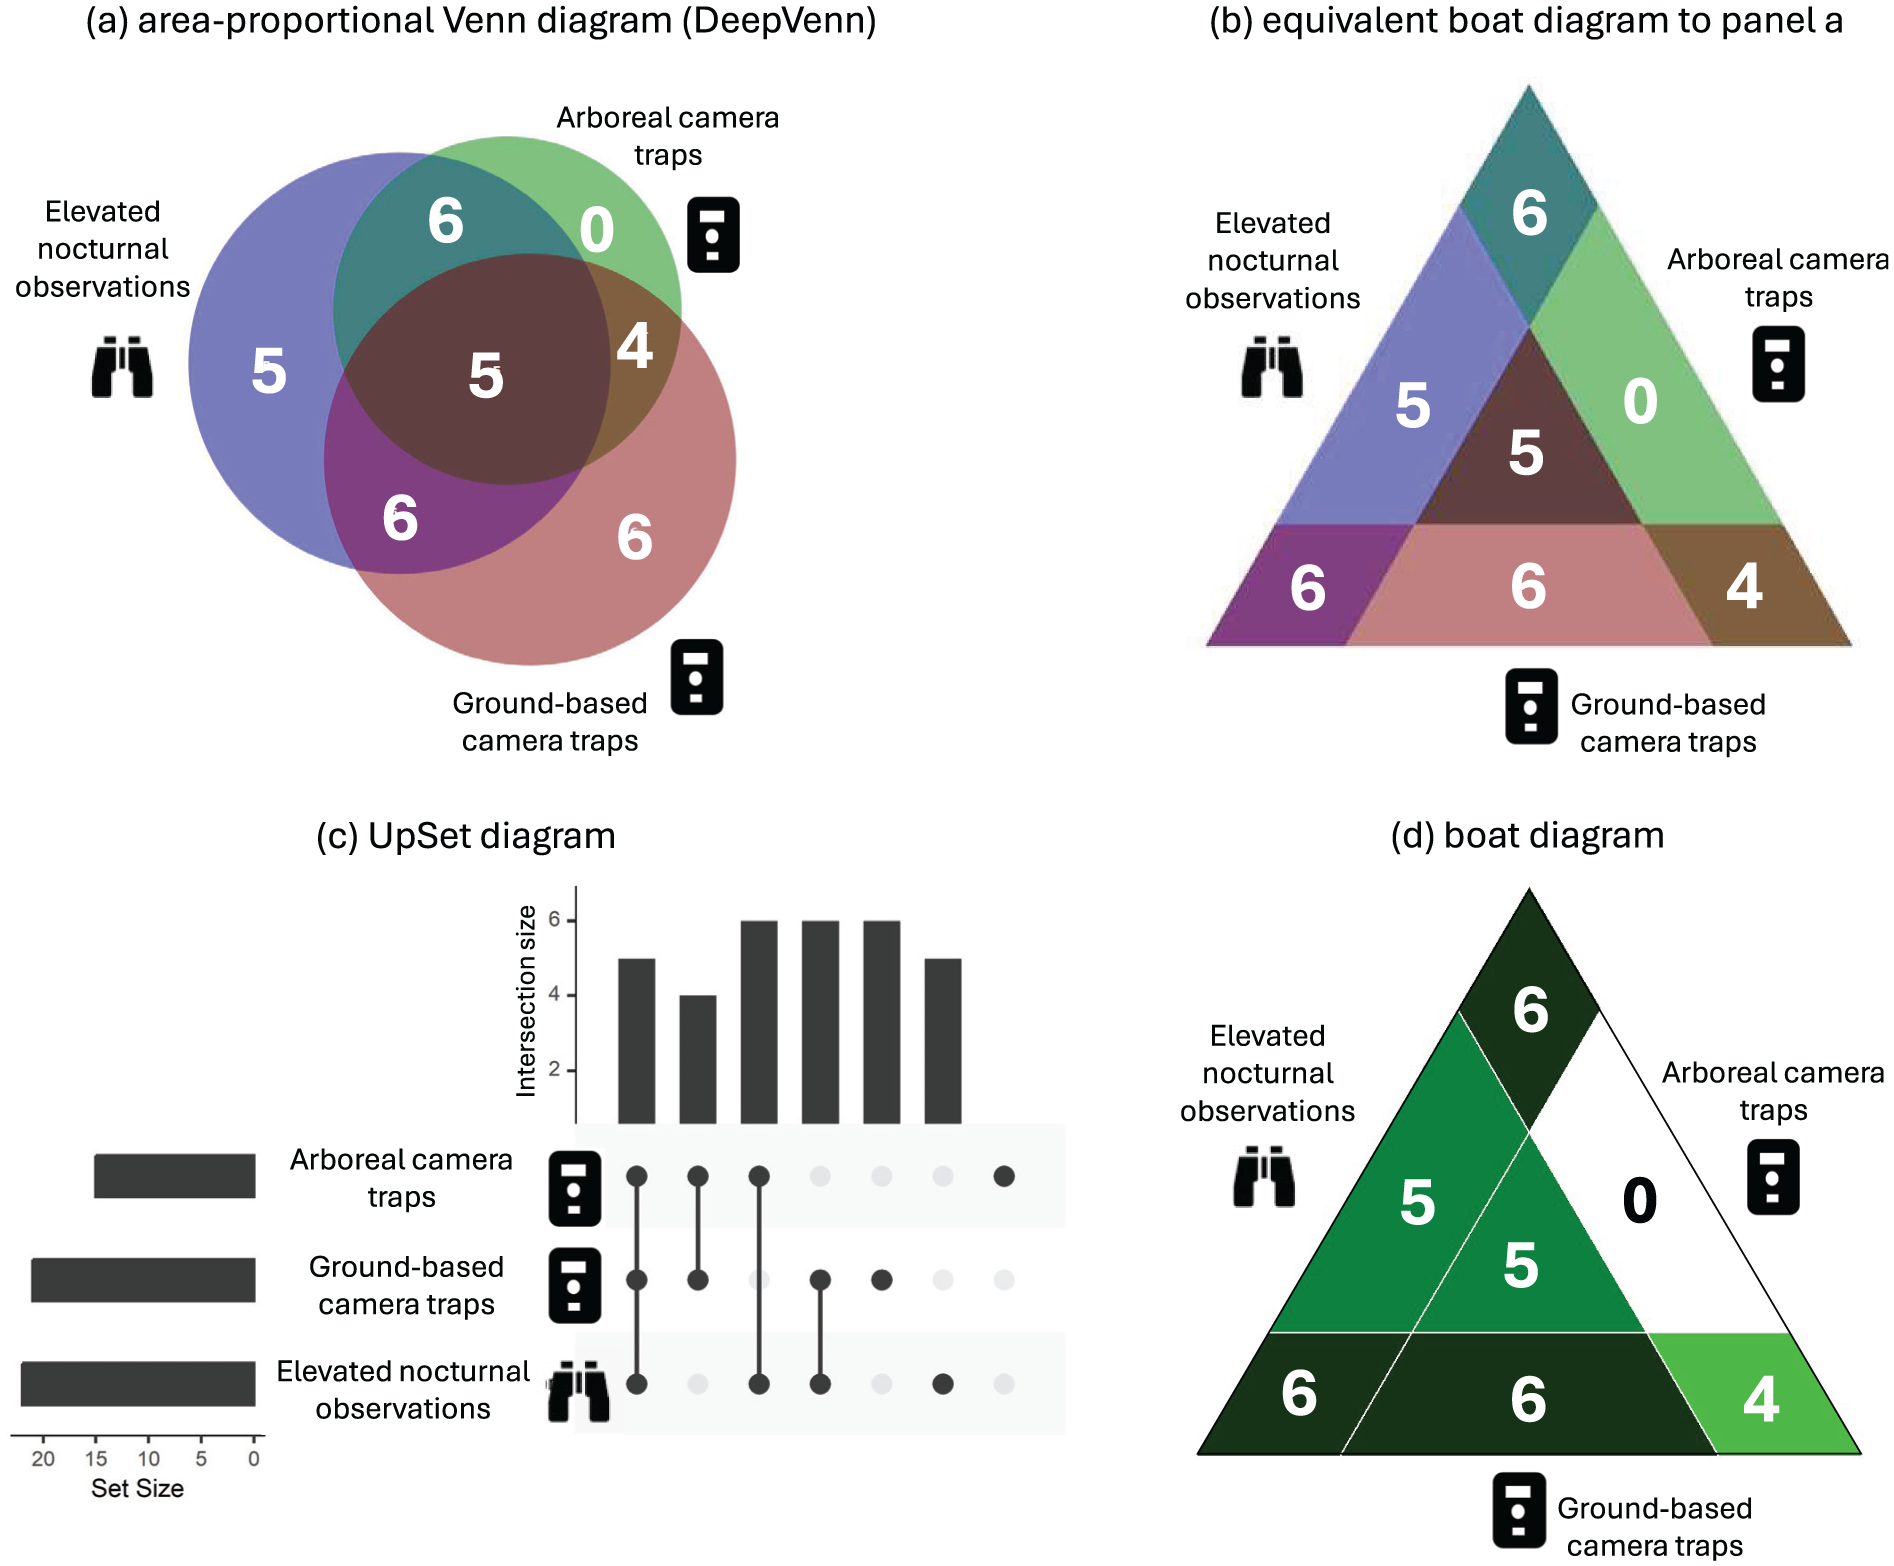
Comparison of Venn, UpSet and Z-variant boat diagrams to demonstrate species detected by three different wildlife surveying methods. The DeepVenn diagram in (a) is “area-proportional,” and the same colour scheme is replicated in the boat diagram in (b). An adapted UpSet diagram is in (c). The boat diagram in (d) uses a colour gradient getting darker as the number of species increases (hence white = no species).
In the direct comparison of the DeepVenn area-proportional Venn coloured diagram (Figure 4(a)) and the equivalent boat diagram with the same colour scheme, the colours better suited the circular Venn diagram because perceptually it was easier to tell that the shading in the intersections were the colour mixtures of the shading in the unique regions. The DeepVenn chart showed one limitation of area-proportionality with circles 10 in that for the number of species unique to arboreal camera-traps, which was 0, there was still a region shown. The boat diagram (Figure 4(d)) had the advantage that this empty region could be white, indicating clearly no unique species to this method, while at the same time visually emphasising the differences in number of species between other regions. The UpSet diagram was selected to be basic in colour scheme (Figure 4(c)). It had the benefit of showing total set size, which is something that the other diagrams do not show explicitly. For Venn diagrams, total set size can be assessed by adding cardinality glyphs together, or total set sizes could also easily be added to set labels.
The collaborators, two scientists from a conservation NGO who are working to develop effective methods for surveying tropical arboreal mammals, both found the boat diagram designed in the same colour scheme of the DeepVenn (Figure 3(b)) “clear.” One commented that “the equal size of the blocks lets my eye travel to the (to me) obvious conclusion that the large portion next to the icon is the number related to it (unique species seen by method) and by following out to the tip is the portion that shows the shared species seen paired with its neighbouring icon. In essence I see the relationships at a glance and the detail of number of species.” However, it was noted by the other that “Having the colour scheme the same as the Venn does not benefit the visual presentation or interpretation.”
The researchers had slightly mixed views on the proportional shading approach in Figure 3(d). One stated that “the shading density in relation to number works to create an improved diagram in terms of clarity than [Figure 3(b)],” whereas the other indicated that “I find the colouring a little misleading” in that “where the numbers are the same, by being the same colour (proportion), it implies they are paired and so it obscures the layers of independent species/all three species/paired species.”
Use case in early years mathematics education
A key use of Venn diagrams since their invention, as well as use in mathematical or scientific disciplines,1,6 has been in education to teach set theory. 6 A motivation of using Venn diagrams educationally is their intuitive, diagrammatic quality where we can take simple shapes and explain more complex concepts. In the same way that teachers have used wooden hoops to demonstrate circular Venn diagrams, 6 real paper boats that students construct, or triangular tables/boards could be used to demonstrate sets with boat diagrams. Here we discuss descriptive ways in which boat diagrams, and their component boat shapes, can be used to intuitively explain set membership.
A key difference between boat diagrams and symmetrical three-way circular Venn diagrams is that the two-way overlap regions A∩B−C, A∩B−C and B∩C−A are pushed outwards to the extremes, relatively further away from the category they exclude. Thus, another intuitive way of envisaging the seven regions of the boat diagrams is to imagine three children A, B, and C, colouring in on a triangular table (with, in the case of the P variant, the corners of the table cut off). Each child is sitting in the centre of one of the long edges of the table. For each child, they have some crayons they are happy to share between all of three of them, some they’re happy to share with only one friend (leaving out the other), and some they may want to keep all to themselves, out of reach of both other children. We can then imagine the “intersect” (∩) symbol to mean “share with” and the “not” (−) symbol to mean “leave out.” If you were child A, where would you put the different types of crayon? You would tend to put the ones you were happy to share with both child B and C in the centre of the table (region A∩B∩C; or “A shares with B and shares with C”), you’d put the crayons you wanted to share only with child B and not C in the corner of the table you share with child B, out of reach of child C (region A∩B−C; or “A shares with B but leaves out C”), and you’d put the crayons you wanted to keep only for yourself on the table just in front of you, out of reach of both child B and child C (region A−B−C; or “A leaves out B and leaves out C”). Note we also present an alternative scenario that could be used to teach sets in the Supplemental Material (Section S6).
Baron 6 reported teachers using wooden hoops to demonstrate circular Venn diagrams, and similarly we have suggested that triangular tables or boards could be used as a teaching tool for boat diagrams, following the above ‘children using coloured crayons’ scenario. In Figure 5 we show two age-appropriate scenarios that could be used for primary/elementary school-aged children to set a scenario and then in Figure 6 we illustrate questions that could be used to test understanding of sets and elements. These have been designed to give the basic initial same information and ask the same structured questions but using circular Venn diagrams and boat diagrams as teaching models. Both use concepts/ideas that may be familiar to children, that is, the concepts of sharing crayons with friends or explaining which flavours of sweet they do or do not like.
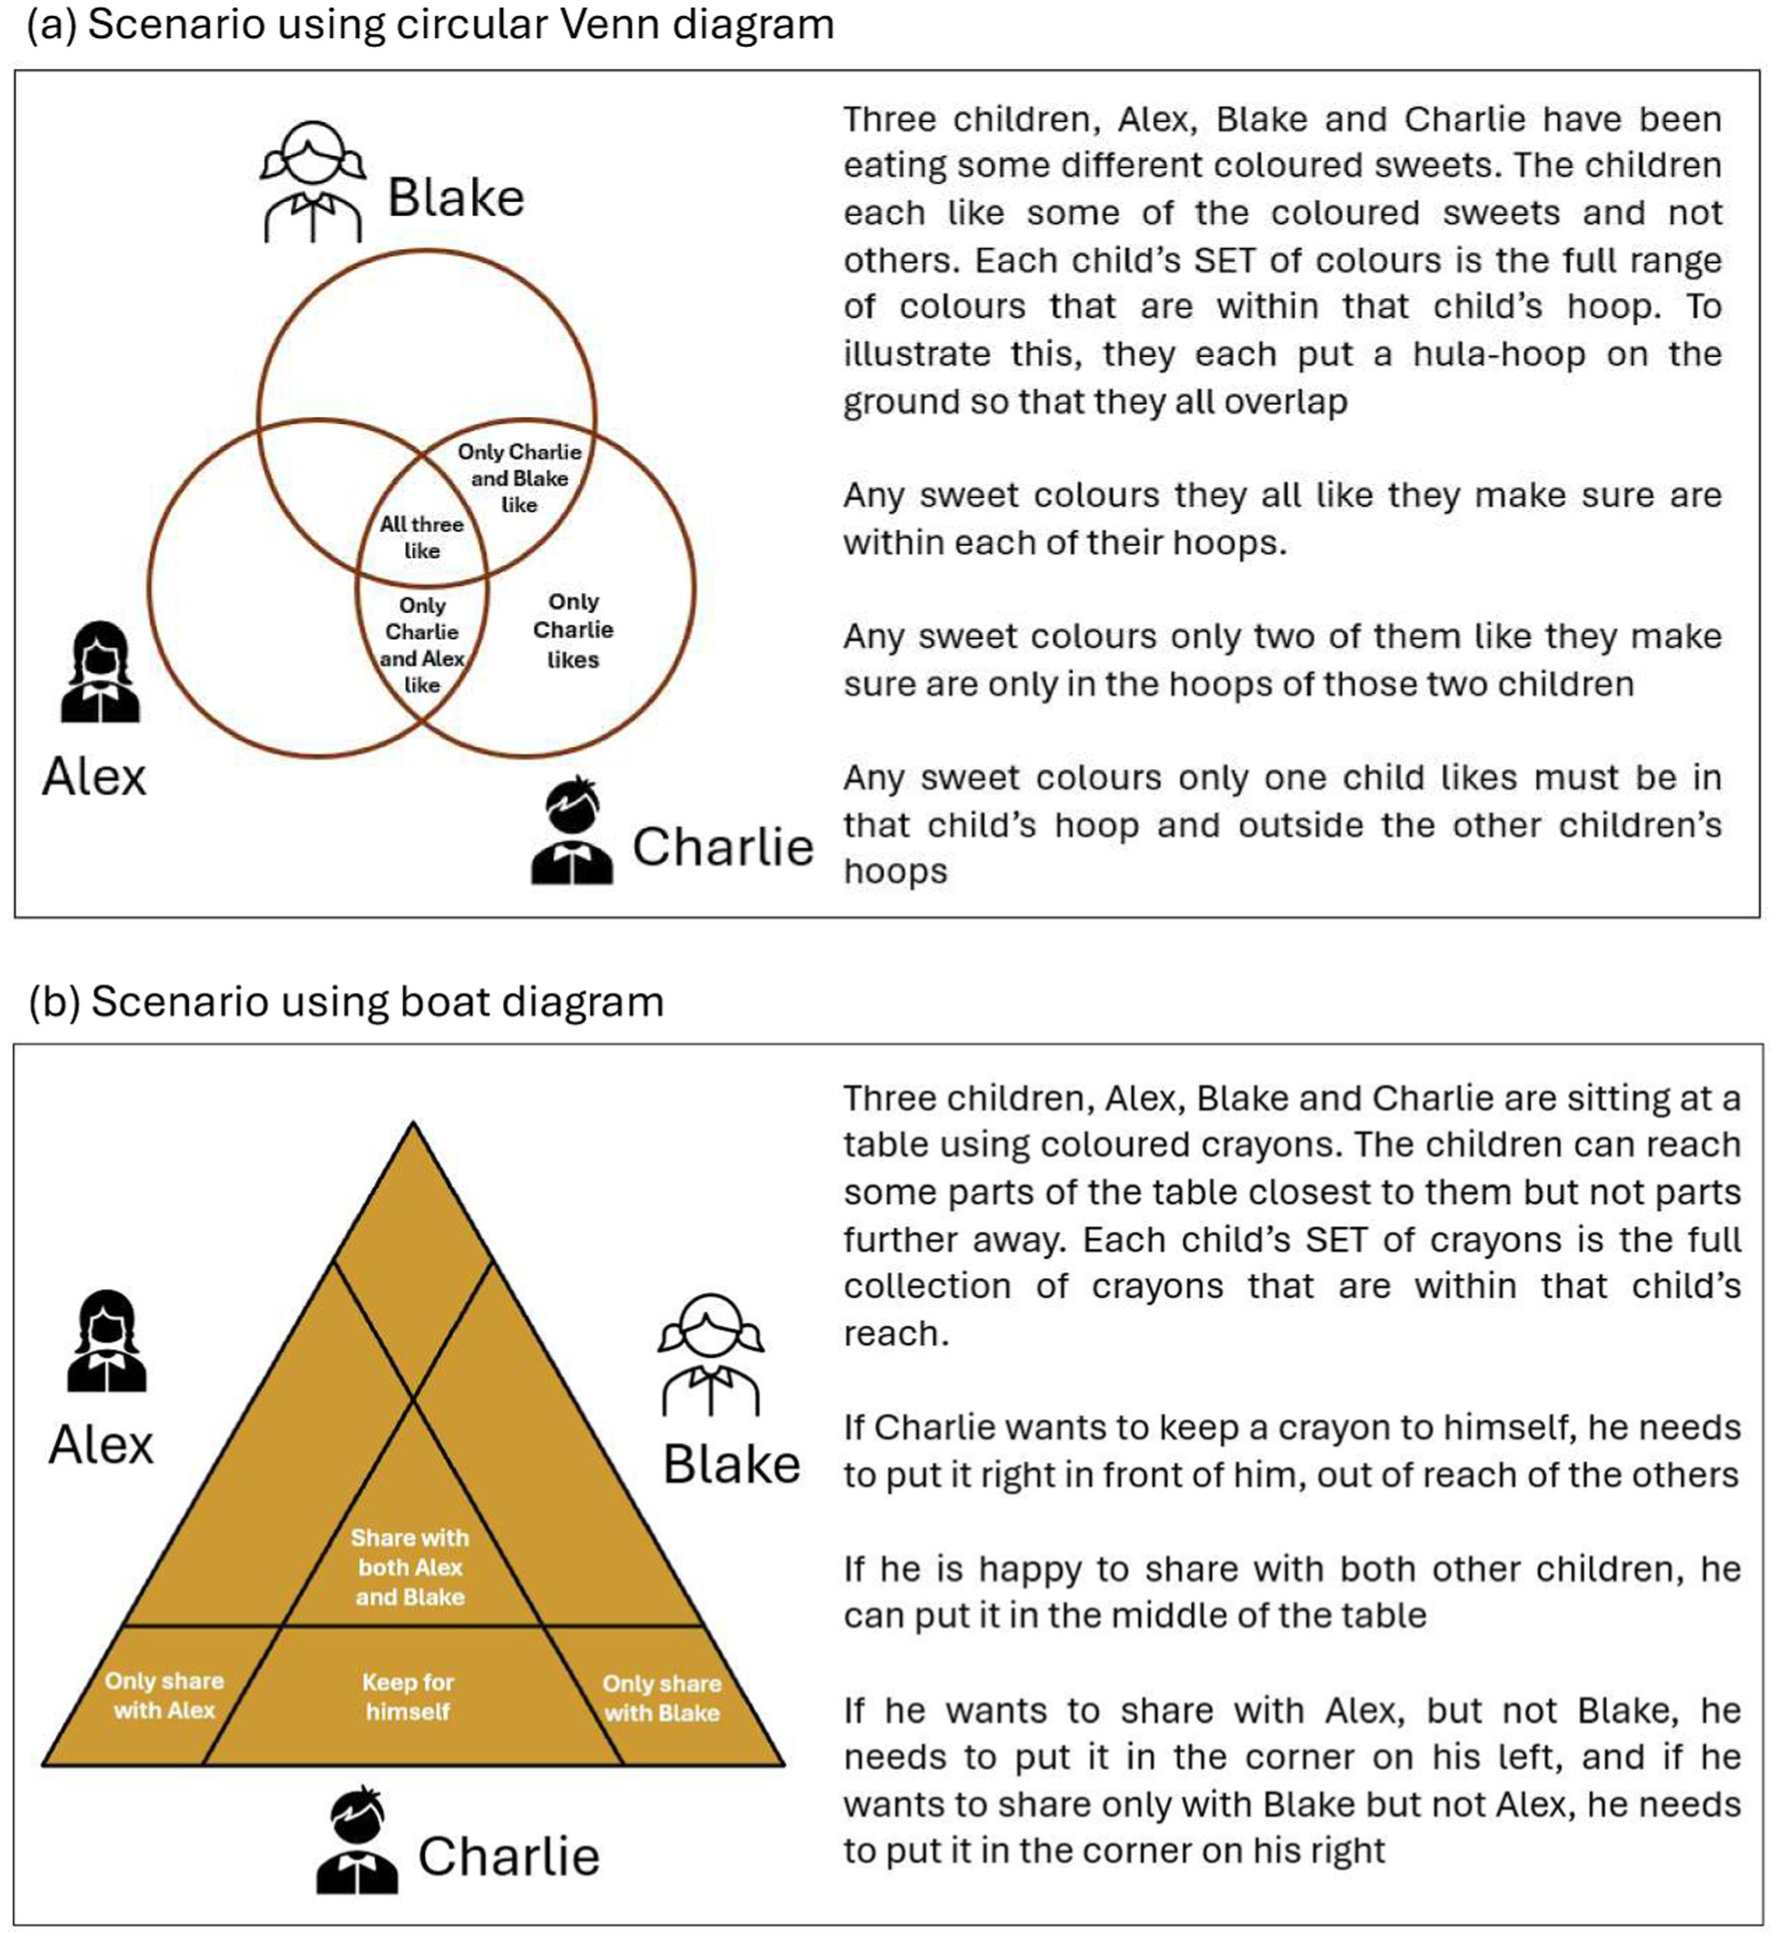
Example teaching materials to compare boat diagrams and circular Venn diagrams to teach sets to primary/elementary school-aged children. Here we set two scenarios using (a) circular Venn diagrams as per an example given by Baron 6 and (b) the Z-variant boat diagram.
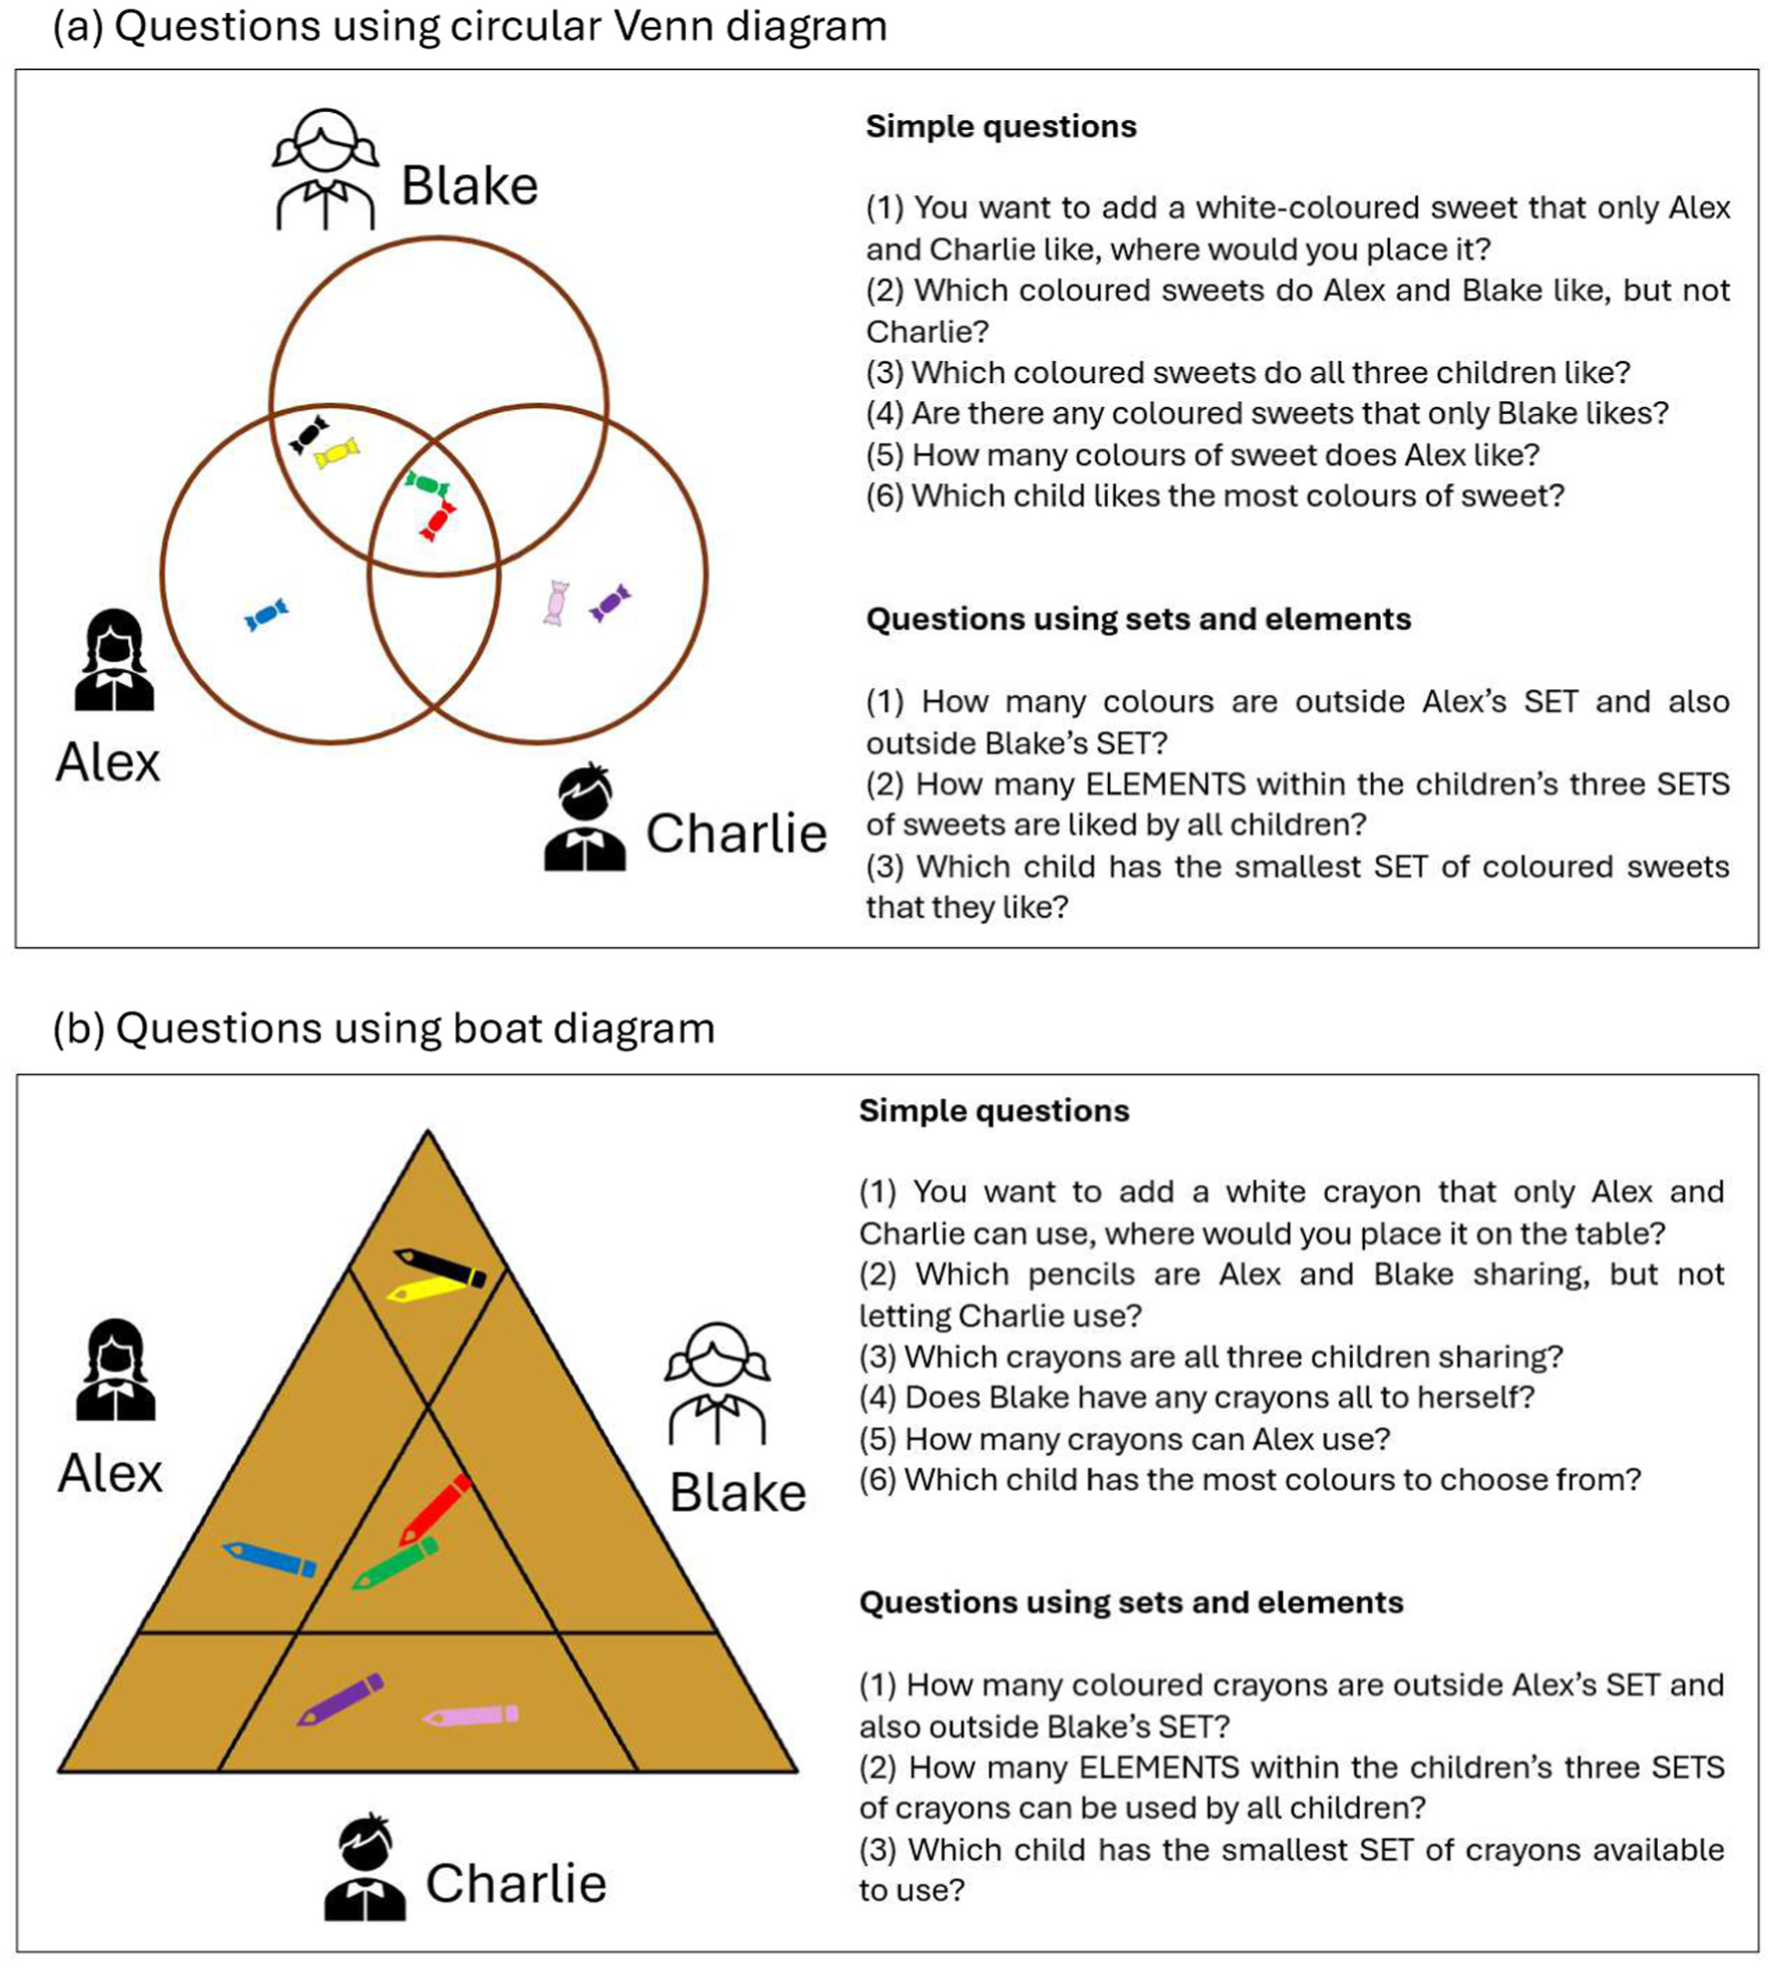
Example teaching materials to compare boat diagrams and circular Venn diagrams to teach sets to primary/elementary school-aged children. Here we set questions based on the scenarios in Figure 5 using (a) circular Venn diagrams and (b) the Z-variant boat diagram. Questions are first posed simply, and then using mathematical terminology of “sets” and “elements”.
A collaborator, who works as a Head of Teacher Education at a university and specialist in mathematical education, explored the scenarios in Figure 5. He stated that “I identified a notable and previously unconsidered advantage of the boat diagram. Specifically, the shared spaces between individuals were more clearly delineated than in the traditional Venn diagram.” In this he described that it may be more intuitive for a child to put items to be shared only with one other child to that side of them. As such, he commented that the boat diagram approach “could be more accessible and effective for teaching purposes” and “warrants further exploration with pupil groups to assess its impact on learners' comprehension and logical reasoning skills.” The materials in Figures 5 and 6 could thus be tested with children in the classroom to assess the relative extent to which they aid understanding. Such lessons could be carried out using real props (hula-hoops and sweets, or triangular tables and crayons), and assessed using learning reflection questionnaires and in-class discussions with children. 34 Alternatively, effectiveness could be tested quantitatively by measuring speed and accuracy of answering questions on a computer screen using an online questionnaire platform, such as with ’hoop diagrams’. 11
Discussion
Comparison of boat and three-way Venn diagrams
Boat diagrams are presented here as an additional visualisation tool for data, ideas, and concepts in situations where two- and three-way intersections are relevant and useful. Different diagrams have their strengths and weaknesses. Boat diagrams originated for practical reasons, as it was felt that the straight lines made it easier to include text, and their triangular nature lent themselves well to a three-way comparison of ecological survey methods. The Z variant is simpler and can be drawn with only six lines, compared to nine for the P variant, and allows larger relative two-way overlap sectors. However, the P variant is potentially aesthetically pleasing (an important component of science communication) and, for a given rectangular/square plotting area, leaves less negative space within a square plotting window. Nevertheless, circular Venn diagrams do have an almost universal recognition as a presentation tool; they retain the flexibility that allows the relative locations (and thus overlap) and sizes of each circle to be modified more easily, which remains a strength that boat diagrams lack. Symmetry in boat diagrams can be broken, but we have not explored this in detail.
Since within Venn diagrams the relative size of areas allows differential emphasis on similarities and differences between concepts, a key investigation here was to what extent the relative area of the internal regions was able to vary and at what value of λ the relative areas were most even. We enforced rotational symmetry in this investigation, and acknowledge that lower values of MSCLR may be possible with asymmetrical diagrams. The extent to which the relative areas differed with λ are strikingly different between the two boat diagrams and the circular Venn diagram. A notable difference is that for circular Venn diagrams the double-intersecting regions are largest at intermediate values of λ, while the triple-intersecting and non-intersecting regions are largest at extreme values (λ = 0 and 1 respectively). In contrast, for boat diagrams, it is the non-intersecting regions that are largest at intermediate values of λ, and the double-intersecting regions (which represent the “corners” of the diagrams) instead are largest at λ = 1. The Z variant achieved the lowest minimum MSCLR value of the three diagram types, whether considered across all seven internal regions or each type of internal region, although the circular Venn diagram came close. At the minimum, different diagrams emphasised different regions, the triple intersection being largest for the circular Venn, and the nonintersecting regions being largest for the paper boat and Zumwalt diagrams. The differences imply that the choice of diagram could be important, depending on the material being presented and the message being communicated.
In terms of science communication, our use cases and feedback from collaborators demonstrates that boat diagrams add a new tool to the toolkit for visualisation of three sets and their intersections. The broad array of set visualisation tools that are available (reviewed by Alsallakh et al. 10 and since broadened by further tools (e.g. Rodgers et al. 11 and Lex et al. 12 ) suggests demand for a range of tools that meet different functional and aesthetic requirements. Boat diagrams have their own unique aesthetic that broadens user choice, and the association of triangles with comparison across precisely three categories may be somewhat intuitive because of familiarity with ternary diagrams, which have been in use for more than a century. 35 Our code for drawing and rescaling boat diagrams is open source and we encourage further development of this approach. It was commented by one collaborator that a lack of familiarity of the boat shape within boat diagrams “could perhaps be remedied by borders of different colours or styles.” This could be an area for development of the online tool.
To our knowledge, boat diagrams have not been formally described before, although we do not rule out their use somewhere. A Google image search at time of writing for “triangular Venn diagrams” brings up no exact matches. Similar diagrams that do appear are typically templates for slide presentations and tend to be at the state prior to adding the two-way overlap areas (i.e. at the stage shown in Figure 1(b)) and thus contain only four regions (A∩B∩C, A−B−C, B−A−C and C−A−B). For an alternative to boat diagrams, the categorisation of the six outer regions, which alternate between the nonoverlapping regions and the two-way overlap regions (when 0 < λ < 1), can be rotated by one place (Figure 7(a)). This creates a variant whereby A−B−C, B−A−C and C−A−B are in the corners and A∩B−C, A∩B−C and B∩C−A are along the sides, in contrast to the original boat diagrams. In this variant the closed curves A, B, and C become themselves triangles rather than boat shapes. This version will have the same minimum MSCLR as the Zumwalt diagram, but with categories switched, and allows flexibility of presentation and relative size between the outer sectors. One potential downside of this variant is that it loses the polygonal boat shape and the intuitive descriptive concept of the diagram representing a tabletop, since the children described above would be sitting in the corners, not along the sides. Nevertheless, this version has a nice additional feature in that each closed curve A, B, and C, and the whole diagram, consist of triangles.
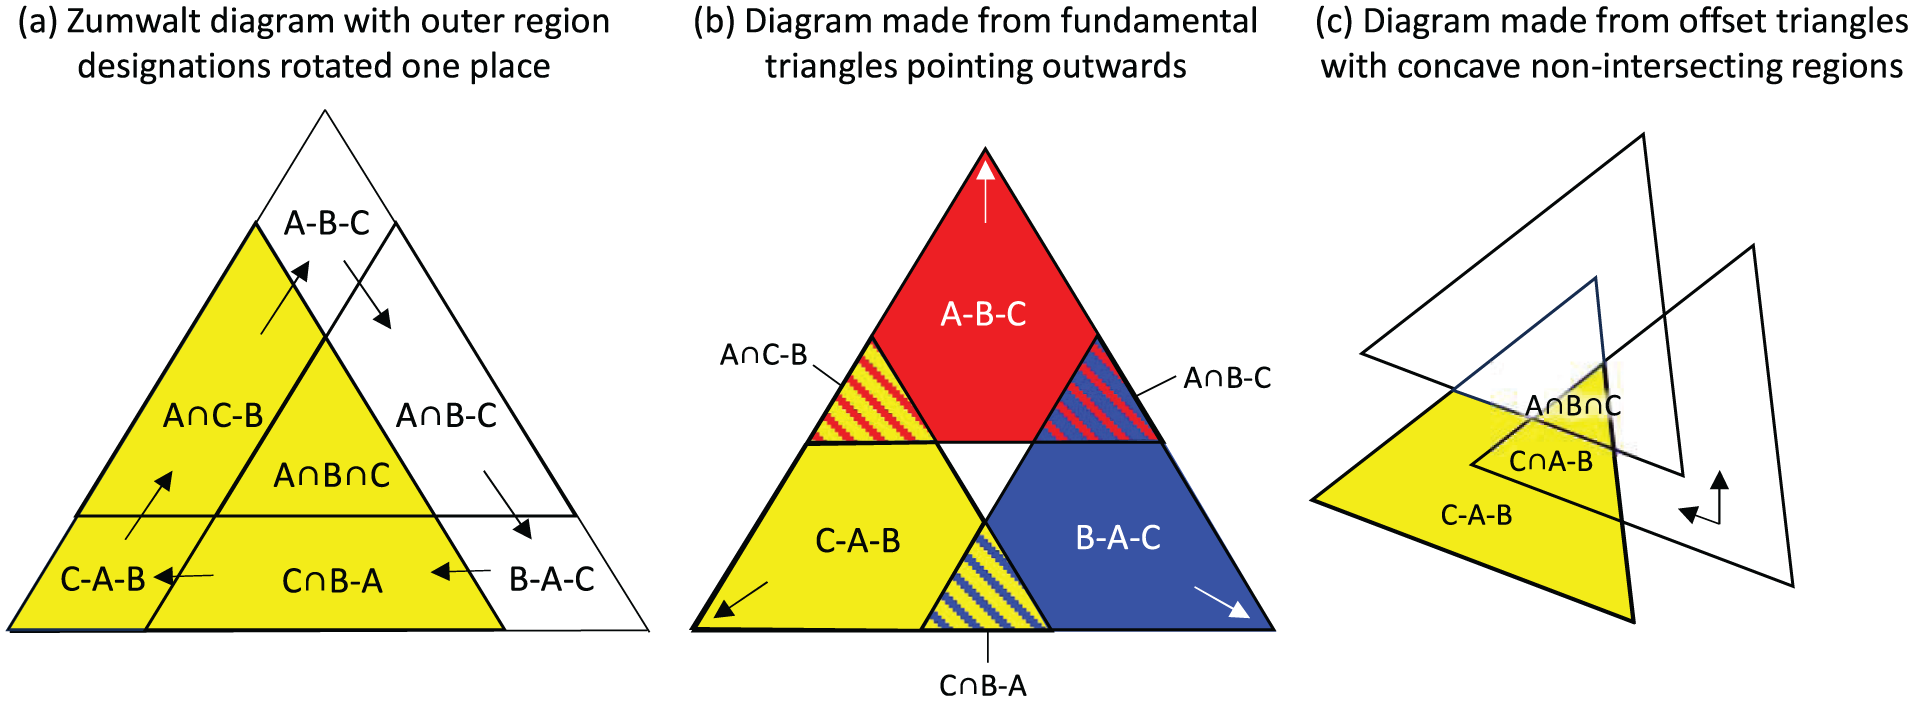
Some alternative variants of triangular Venn diagrams. Arrows indicate key features: (a) both the paper boat and Zumwalt diagrams can have the designation of outer regions rotated by one place, which makes the sets containing for example, C into a triangle, (b) rather than triangles pointing inward (Figure 1(a) and (b)) they can point outward (diagram shows triangles pulled out to such an extent that their triple intersection no longer exists), and (c) offset triangles can generate seven internal regions but the non-intersecting regions are concave polygons (idea is from a template shown on powerslides.com). For each diagram, the set containing C is highlighted in yellow (this can be compared to the set containing C shown in yellow in Figure 1(c) and (d)).
Another alternative triangular Venn diagram variant is possible for three triangles arranged with rotational symmetry, but where they are arranged pointing outwards not inwards (Figure 7(b), as compared to Figure 1(a)). An additional triangular Venn-type diagram found online is shown in Figure 7(c). This design has offset fundamental triangles, and no additional joining lines, which create uniquely shaped regions, with the non-intersecting regions being concave polygons.
Conclusions
Boat diagrams, a new form of three-curve Venn diagram, add a new tool for the visualisation of three sets, concepts or ideas in situations where we need to analyse or communicate what is unique and what is shared between them. They have a unique aesthetic, contrasting with the well-known circular version, and consist of three closed polygonal curves that have a characteristic boat shape. This and their triangular nature at most values of λ provide some intuitive ways to describe relationships between their shape and the classification of their regions, which could aid their use as a tool for teaching set theory in educational settings. Furthermore, the behaviour of the relative areas of each internal region differs within boat diagrams compared to the circular design. So far, we have investigated only versions with rotational symmetry; for one of these, the Z variant, the evenness of the relative areas of each region, as measured by the MSCLR, can be improved relative to the circular Venn diagram.
Supplemental Material
sj-docx-1-ivi-10.1177_14738716251381653 – Supplemental material for Visualisation of sets using boat diagrams: A new form of rotationally symmetrical three-way Venn diagram
Supplemental material, sj-docx-1-ivi-10.1177_14738716251381653 for Visualisation of sets using boat diagrams: A new form of rotationally symmetrical three-way Venn diagram by Patrick J. C. White and Nicholas J. Aebischer in Information Visualization
Footnotes
Acknowledgements
Data for and feedback on the use cases were provided by Lucy Hughes and Trevor Hughes of Conservation through Research, Education & Action (CREA) and Ben Blackledge and Andrew Gallagher of Edinburgh Napier University, and are used with their permission. Thanks also to Lucy Baird and Luke Holman. Thank you to the anonymous reviewers for helpful comments on earlier drafts.
Ethical considerations
This article does not contain any studies with human or animal participants.
Funding
The authors received no financial support for the research, authorship, and/or publication of this article.
Declaration of conflicting interests
The authors declared no potential conflicts of interest with respect to the research, authorship, and/or publication of this article.
Data availability statement
Anonymity
Supplemental material
Supplemental material for this article is available online.
References
Supplementary Material
Please find the following supplemental material available below.
For Open Access articles published under a Creative Commons License, all supplemental material carries the same license as the article it is associated with.
For non-Open Access articles published, all supplemental material carries a non-exclusive license, and permission requests for re-use of supplemental material or any part of supplemental material shall be sent directly to the copyright owner as specified in the copyright notice associated with the article.