
Abstract
Visualization is integral to uncovering hidden information in data and providing users with intuitive feedback for decision-making. Data visualization is crucial for transforming complex data into actionable insights across various domains. In recent years, coronavirus disease vaccines have become increasingly available to much of the population. However, the CDC (Centers for Disease Control and Prevention) often fails to consider multidimensional coronavirus pandemic data from a side-by-side perspective, limiting the ability of medical professionals and individuals to compare and interact with comprehensive data visualizations. Effectively displaying coronavirus and vaccination data collected from multiple sources is essential for interpreting pandemic transmission patterns and vaccine efficiency. This paper presents a new platform for innovative data visualizations that offers users intuitive feedback and a complete data story. We designed algorithms to seamlessly combine multiple parameters, synchronize attributes, and dynamically visualize data over time on a single webpage. Instead of integrating all attributes into a single plot, which can be overwhelming due to space limitations and make it difficult to extract crucial information from overcrowded display components, we developed algorithms to classify, enhance, and group all parameters based on their relationships and similarities. Furthermore, a side-by-side visualization method was created to dynamically link all parameters in multiple images for data exploration, trend comparison, hidden information detection, and correspondence analysis. Our platform provides real-time performance, enabling healthcare professionals to make informed decisions, communicate findings effectively, and uncover patterns that might not be apparent in raw data. The proposed multidimensional data visualization algorithms have broad applications in general data exploration and revealing hidden information.
Keywords
Introduction
A highly contagious coronavirus challenged the world on scales many could not have foreseen in the spring of 2019. 1 The virus has gone from a disease in a remote region of the Wuhan Province of China to a global pandemic that has affected everyone in the world either directly or indirectly. 2 In the United States alone, approximately 29 million cases and nearly 500,000 deaths have arisen as a result. 3 The spread of the coronavirus worldwide has sparked interest in data analytics and visualizations. Everyone wants to see and understand how case counts are rising, the virus’s impact on themselves and their community, and their role in slowing the spread.4,5
The coronavirus pandemic outbreak provides an opportunity to gain critical information for research and developing treatment strategies. It offers a significant case study on the importance of modern public communication for spatially related data and the effective implementation of tools whose insights can impact decision-making at different levels. As Anthony Fauci et al. states, “Every outbreak provides an opportunity to gain important information.” 6
Open data on the spread of pandemic diseases is published to make it easier for related parties such as the government, health organizations, research institutes, and the public to obtain an overview of the pandemic disease problem. However, published open data is still presented numerically, making it difficult to get visual feedback and reveal hidden information. 7 The coronavirus pandemic has forced the world to interact with data to make decisions at the individual level. 8 Visualization can generate an understanding of complex data and extract helpful information, playing a vital role in scientific analysis. 9
Visualization can enhance understanding, improve engagement, and facilitate efficient communication by presenting information in a more user-friendly way. It plays a pivotal role in transforming raw data into actionable knowledge. Collecting diverse data sets from various sources enables researchers to develop robust visualizations that allow a more precise story of the data to be told. 10 This empowers professionals to make informed decisions and communicate findings effectively. 11 Data visualization is a suitable tool to represent inherent trends in data, enhance decision-making, empower teams with human-centric situational awareness insights, and reveal hidden information, such as how each state or territory handles its vaccination rollout and response to an overworked public health system. 12 Viewing data in a format that provides intuitive feedback will enable more effective local, state, and federal decision-making. 13
However, visualization also has disadvantages. Creating high-quality visualizations can be time-consuming, leading to potential misinterpretation. Interpretation of visualizations can be subjective, as different individuals may derive different meanings from the same visual representation, and creating overly complex visualizations can be overwhelming. Therefore, developing efficient data visualization algorithms is a challenging task. 14 Failure to communicate effectively might significantly increase the possibility of delaying pandemic outbreak control, undermine public trust and compliance, and lead to unnecessarily prolonged economic, social, and political turmoil. 15
In response to the recent coronavirus outbreak, several organizations and private citizens have designed and published online explanatory data visualization tools to communicate disease data supported by a spatial dimension. Agencies such as the Centers for Disease Control and Prevention (CDC) and the World Health Organization (WHO) have collected data from various demographics of the world’s population. This data provides a comprehensive picture of how differently the coronavirus pandemic and other diseases affect different people, enabling doctors, first responders, and everyday citizens to understand how the disease is spreading and how to combat the rising case numbers and misinformation. Moreover, several data visualizations have been created to inform the public about the rapidly evolving crisis. For example, Zhang et al. 16 examined design practices in producing coronavirus data visualizations to provide a component of crisis information infrastructure. Padilla et al. 17 presented methods for improving trust while maintaining trend interpretation performance through multiple forecast visualization guidelines. Latif et al. 18 reviewed the rapidly growing body of recent research on various coronavirus research activities to leverage data science. Sharma et al. 19 proposed a data visualization tool that includes conceptual and data-driven information.
To demonstrate the temporal and spatial evolution characteristics of the epidemic development, Jia et al. 20 designed and developed an epidemic simulation and visualization system based on WebGIS. John and Shaiba 21 developed interactive maps, tables, and heatmaps to analyze coronavirus data, with maps playing a vital role in understanding the spatial orientation of infection spread. To better understand the epidemiological development in each country and obtain country-specific surveillance, a web application was built using R programing, 22 which has been used to interpret and visualize coronavirus data both nationally and internationally.
For the purpose of exploring the effects of the pandemic on the population through a geographical spatiotemporal view, Maciejewski et al. 23 developed a visual analytics toolkit (PanViz) for analyzing the impact of decision measures implemented during a simulated pandemic influenza scenario. They utilized Tableau for interactive visualization and analysis of coronavirus data. 24 Tao et al. 25 reviewed existing data analysis and visualization techniques along with their applications for coronavirus disease and future pandemic management. Engledowl and Weiland 26 discussed plausible reasons for the misrepresentation of pandemic-related data in the media and by governmental agencies.
Some publications utilized socio-economic factors to formulate and test causal hypotheses, such as Banerjee et al., 27 who advocated an explanatory framework from cooperative game theory to analyze socioeconomic disparities that are causal to the spread of COVID-19 in the United States. To find the difference in intrinsic vulnerability to coronavirus disease between countries, Kong et al. 28 studied the correlations of the basic reproduction number with social, economic, and environmental covariates by compiling data on predictors from seven categories, including demographics, disease, economics, environmental, habitat, health, and social for some countries. Raphael and Schneider 29 proposed narrative research on how the pandemic unfolded and reshaped the landscape of socioeconomic inequality in America.
Furthermore, the development of coronavirus vaccines has progressed at an unprecedented pace. Within nearly 2 years after the first lockdown was announced in the United States, multiple vaccines have been developed by various companies.30,31 Understanding the patterns and number of cases in relation to how vaccines are distributed at the state level can provide critical insights into how state and local governments can effectively address the evolving pandemic situation.32,33 Visualizations play a crucial role in revealing hidden patterns in the collected vaccination data and bridging gaps where data is incomplete or missing, particularly for marginalized groups or regions.34,35
Motivation and contributions
Incorporating vaccination data into visualizations is crucial for comprehensively understanding the pandemic’s progress. Visualizing the impact of vaccinations alongside other COVID-19 metrics can help policymakers, healthcare professionals, and the public make informed decisions. However, understanding and analyzing pandemic and vaccination data can be challenging due to complex structures, multiple parameters, and evolving dynamic features, making extracting critical information for data analysis and pattern Still, these tools cannot provide the functions and flexibility of simultaneously showing the multi-parameter coronavirus data acquired from many sources over time. The visualization research has prediction challenging. The published research and existing data visualization tools such as Tableau, 36 Matlab, 37 and Domo 38 can display multi-parameter data, including coronavirus data. not considered the effect of vaccination, so it cannot deliver a whole picture of the pandemic progress. There are also publications about socio-economic factors on COVID-19 causal hypotheses.27–29 However, this research usually fails to comprehensively integrate multiple parameters of coronavirus data to provide visual feedback and expectations. All these difficulties and shortcomings will delay the speed of providing scientific support for front-line medical workers and government agencies to make the most appropriate and timely decisions.39,40
Effective data visualization plays a crucial role in helping people understand complex information. To address the challenges of multi-parameter pandemic data visualization, we first present algorithms and a software platform for data visualizations that provide users with intuitive feedback and enable them to see a complete story of where the coronavirus data is concerned. Next, we seek to explore the coronavirus data further by considering multi-dimensional variables and various parameters over time. The critical point of this paper is to dynamically visualize and analyze the coronavirus and vaccination data collected from various sources, and multiple parameters are displayed interactively to analyze the relationship between vaccination, disease, and time. Visualizing such data dynamically can provide valuable insights and help users better understand the trends and patterns in the information.
The assumptions toward developing our solution are through cleaning, processing, and analyzing the data, which can lead to valuable insights and extract hidden information from coronavirus and vaccination data. The significant contribution of this research is the development of an extended web-based platform and new algorithms to represent all data sets from various aspects in one cohesive visualization. Due to the effectiveness of color and mapping diagrams possessing the ability to convey information hidden in raw data visually, 41 the visualization featured in this work is a dynamic choropleth map to show how data changes from state to state using color mapping, allowing us to visualize pandemic information tied to geography and analyze data across locations. At the same time, a multi-source synchronization scheme is developed to link the quantitative charts with a colored map to enhance all the selected graph components simultaneously. A bar chart overlay method is designed to show multi-dimensional variables in one graphic visualization. The connected scatterplot is combined with a bar chart to visually compare data acquired from multiple sources, enabling users to read the numbers for each state while also maintaining the ability to see how the disease trends overall and keep sight of both the forest and the trees as it were.
The novelty of our algorithm lies in its ability to process and explore high-dimensional data within an interactive framework effectively. Multiple attributes of pandemic data related to coronavirus disease and its impact on people in the United States are synchronized and dynamically visualized over time on a single webpage. We classified, enhanced, and grouped the data parameters based on their relationships, functions, and similarities. This information is illustrated using a side-by-side visualization method, seamlessly linking all parameters across multiple images on the web. This approach enables users to visualize how the pandemic varies across geographic areas and observe the level of variability within a region. For example, we group features by age, vaccination rate, case and death rate, and vaccination by age. While fewer than four features exist in each group, we synchronize multiple groups and dynamically link them together on a single webpage. This allows our method to explore data with very high dimensions.
We integrate textual information into our data visualization platform, dynamically displaying multiple parameters in one cohesive visualization. By aggregating diverse sets of coronavirus data and presenting them dynamically over time, our platform can aid medical researchers in gaining deeper insights into disease progression and transmission trends. When augmented with relevant socio-economic factors, enabling epidemiologists to formulate and test causal hypotheses, our platform has the potential to inspire pandemic operations experts and policymakers to devise effective strategies for detecting, controlling, and mitigating the impact of the coronavirus. As demonstrated in Figure 1, the progress of the COVID-19 pandemic transmission and its impact over time can be effectively visualized. This includes mapping the total vaccination rate, the relationship between vaccines distributed and people vaccinated, the number of people recovered and confirmed per 10,000, as well as the percentage of deaths due to coronavirus and boosters used per 100. Figure 2 illustrates the dynamic visualization results of vaccination progress, showing the number of vaccinated and boosters administered at four time points. Figure 3 demonstrates the dynamic visualization of coronavirus disease progress at four-time points.
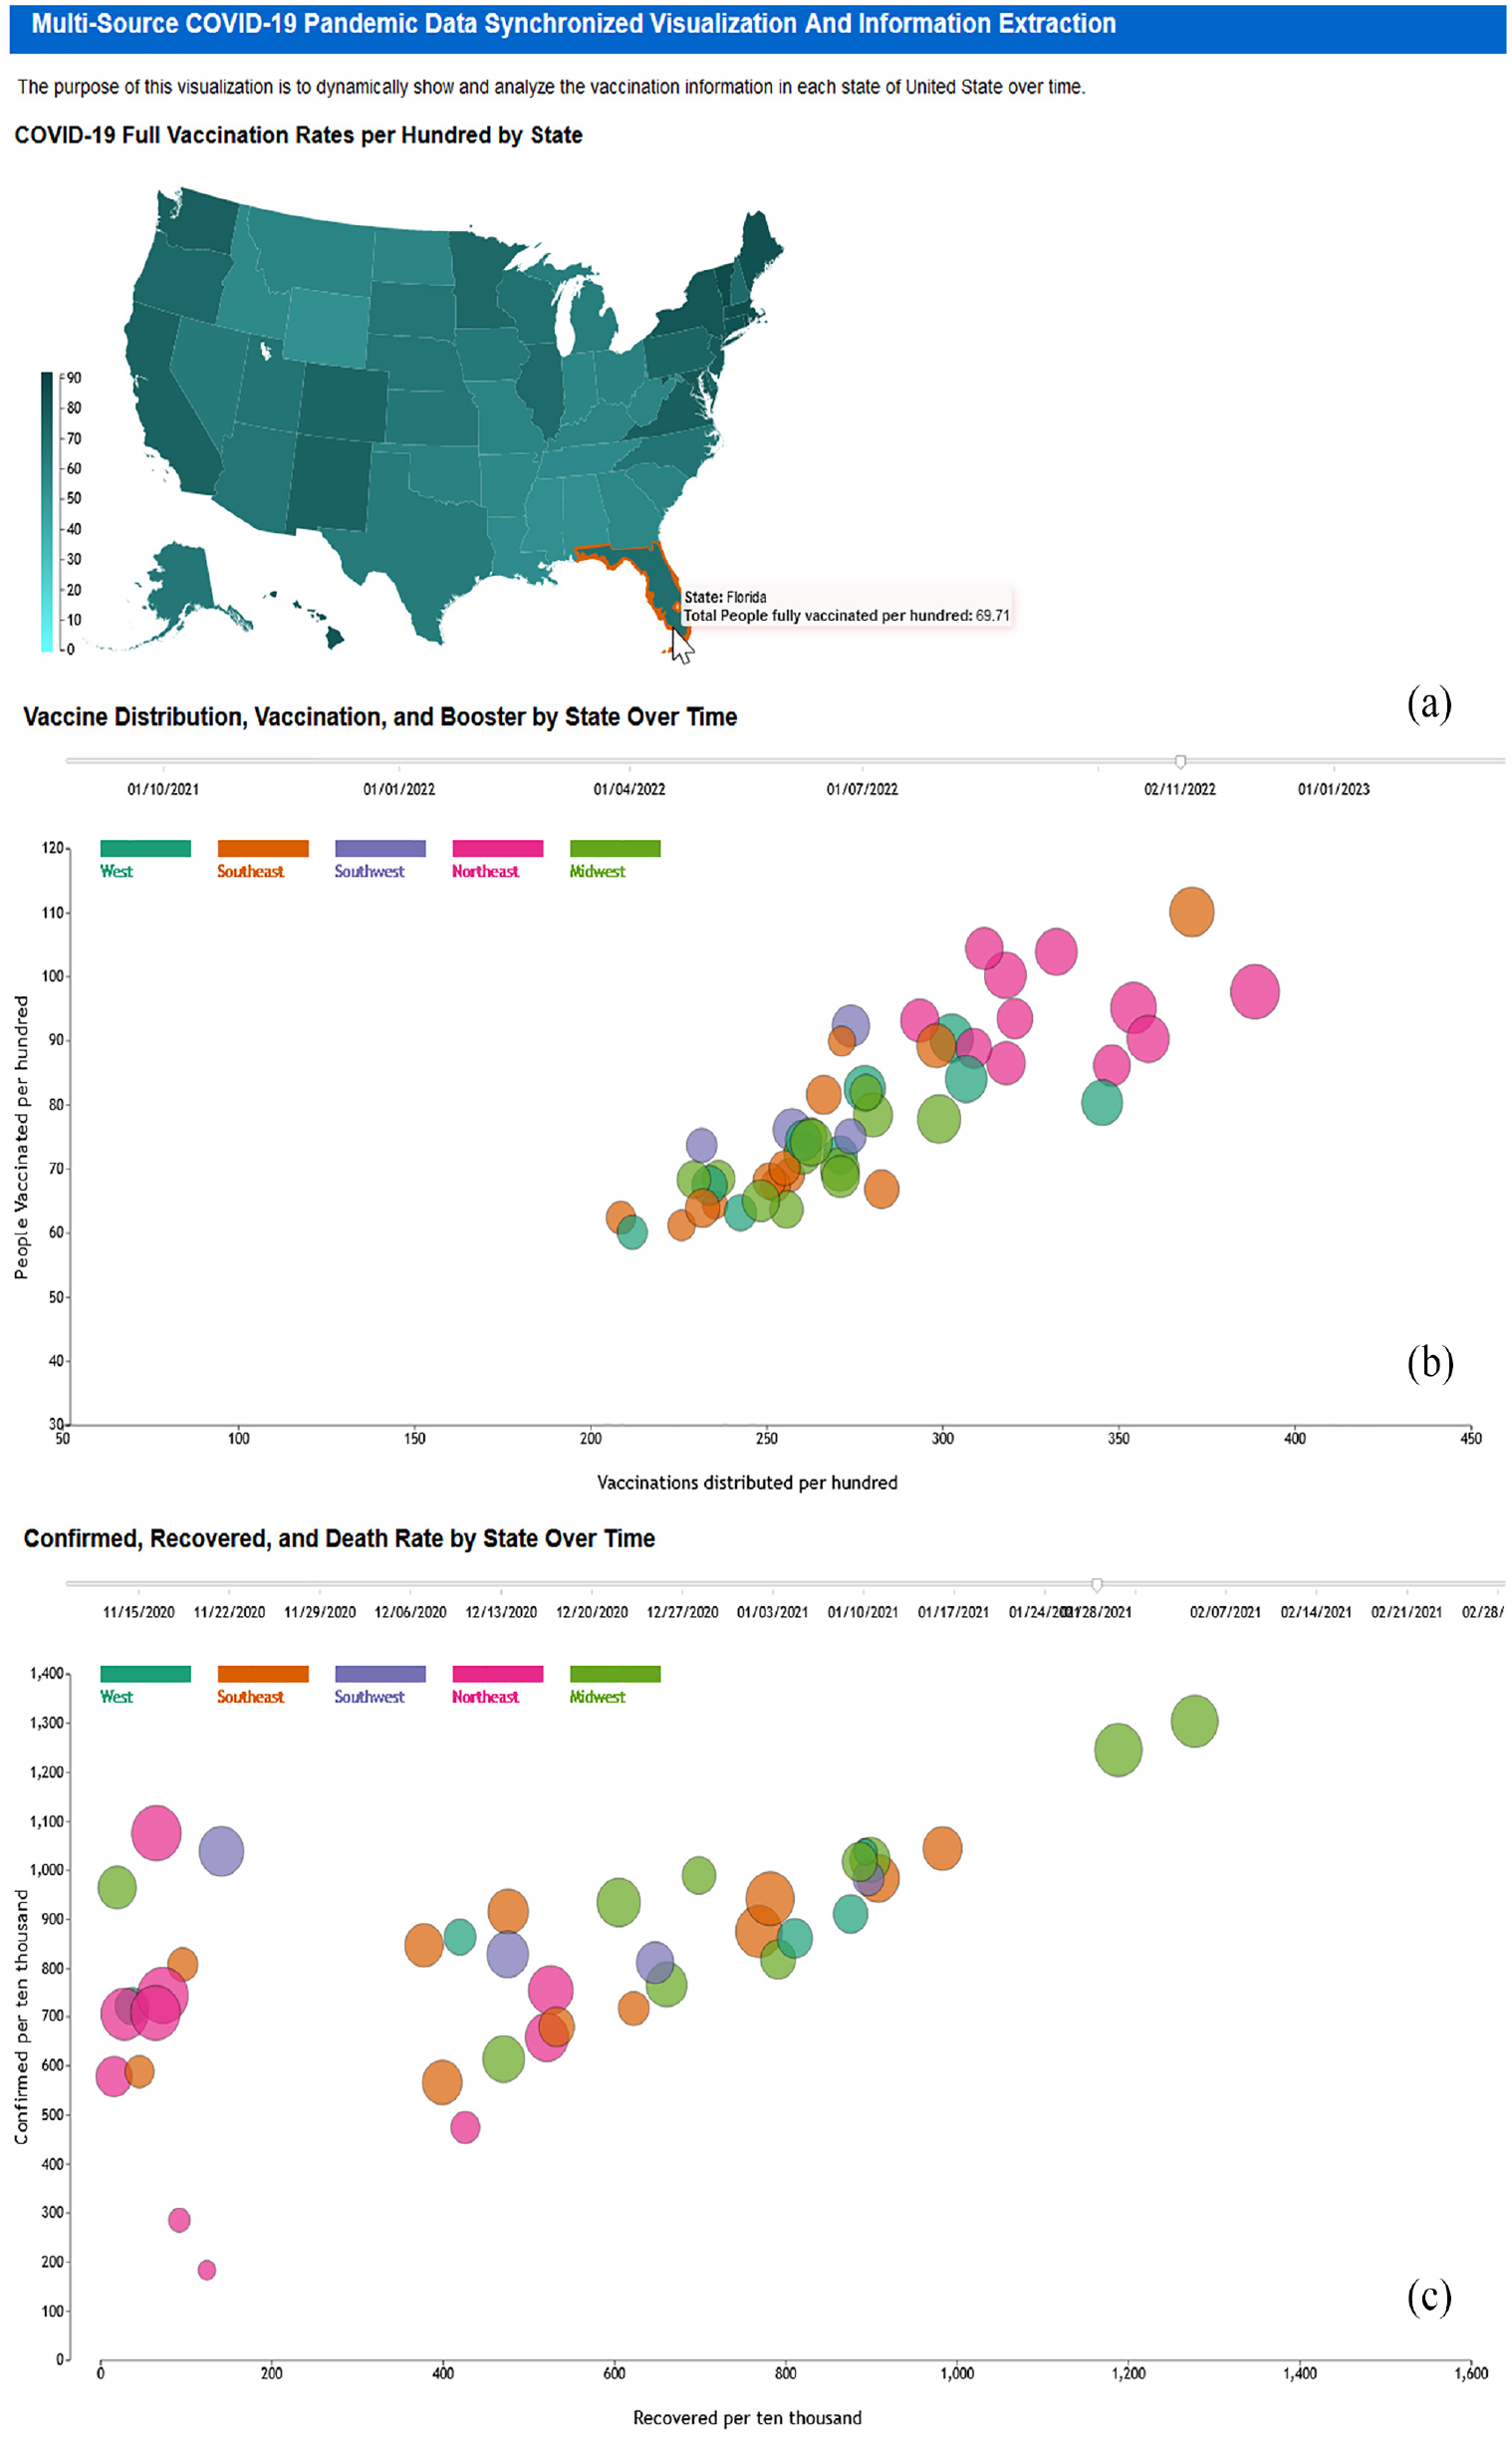
The dynamic rendering result of the progress on the covid pandemic transmission and affection over time, including full vaccination rate mapping, relationship between vaccination distributed and people vaccinated, people recovered and confirmed per 10,000, as well as the percentage of death due to coronavirus and boosters used per 100. (a) COVID-19 full vaccination rates per 100 by state; (b) vaccination distribution, vaccination, and boosted by state over time, and (c) confirmed, recovered, and death rate by state over time.
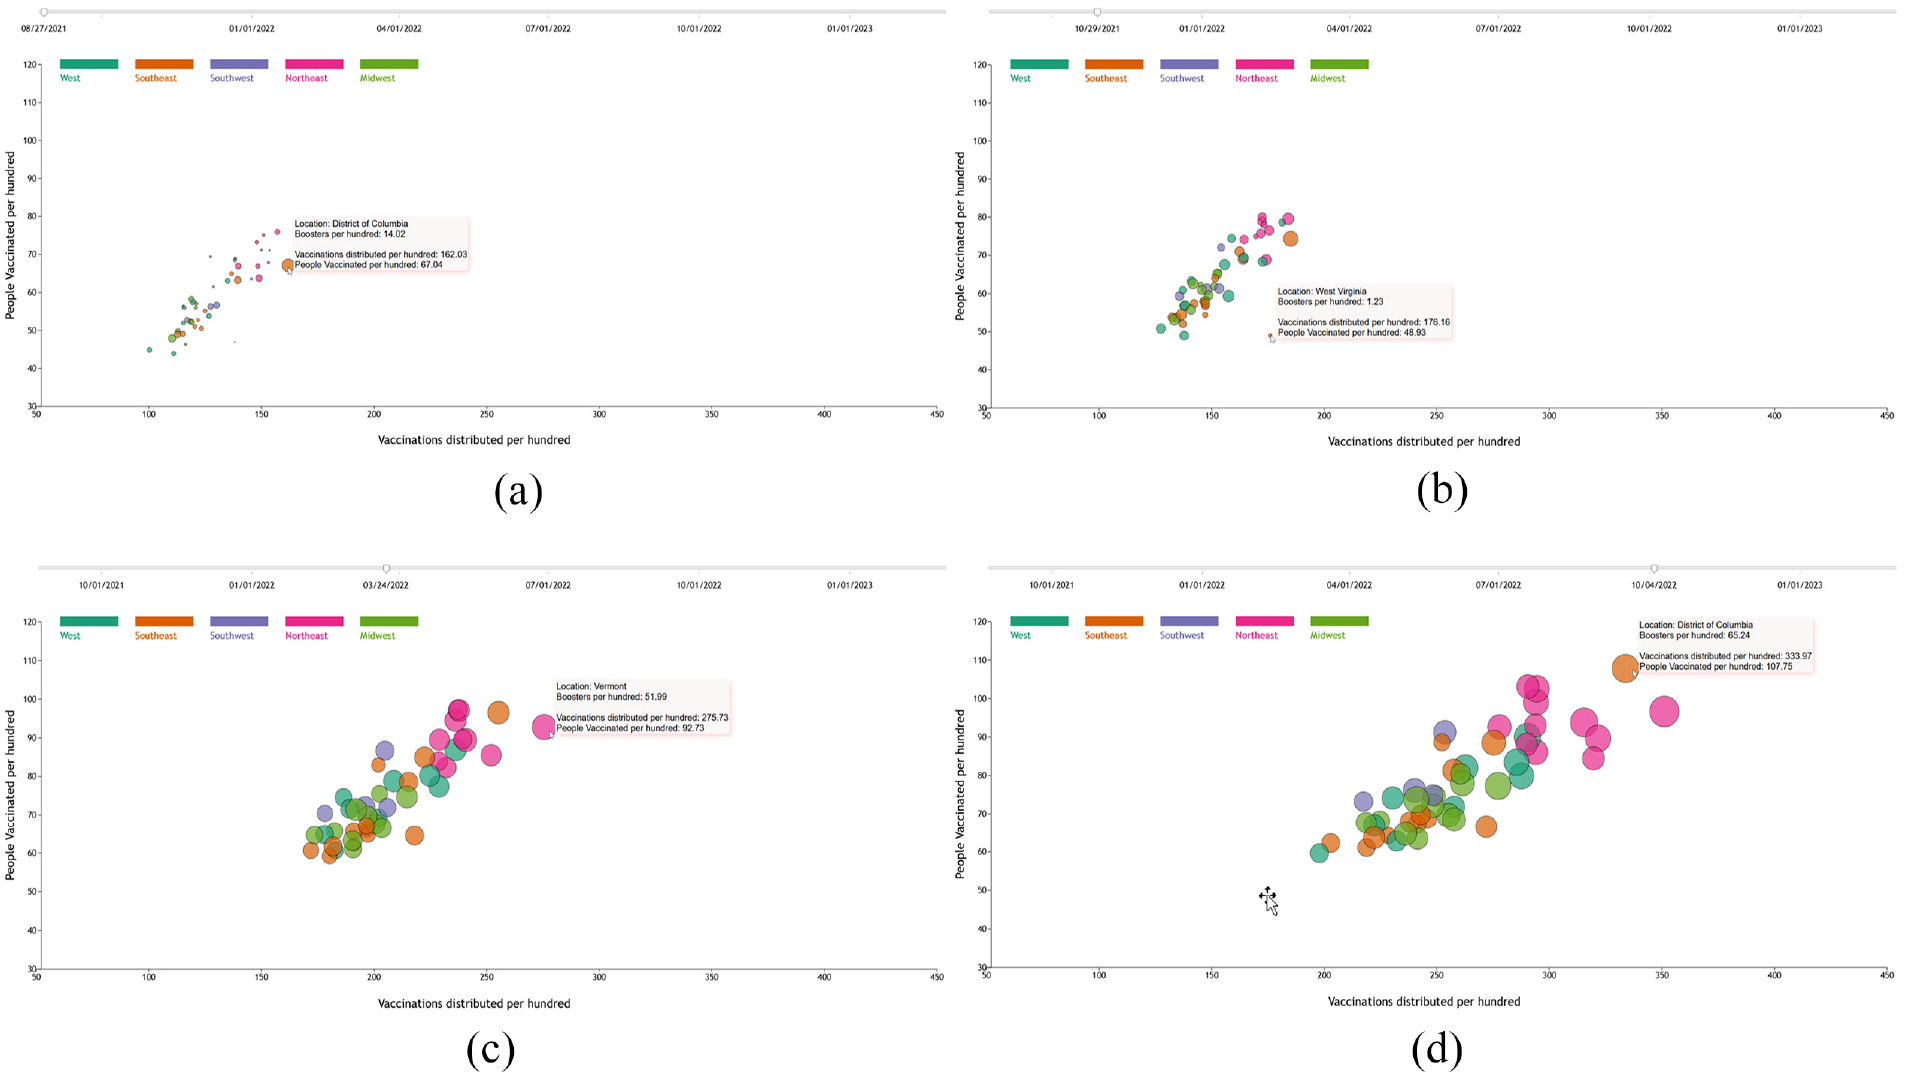
Demonstration of dynamic visualization results at four time points: (a) 08/27/2021, (b) 10/29/2021, (c) 03/24/2022, and (d) 10/04/2022 –to illustrate the progression of coronavirus disease. The x-axis represents recoveries per 10,000, the y-axis shows confirmed cases per 10,000, and the circle radius corresponds to deaths per 10,000. The 52 states in the United States are grouped into five regions, each distinguished by a unique color.
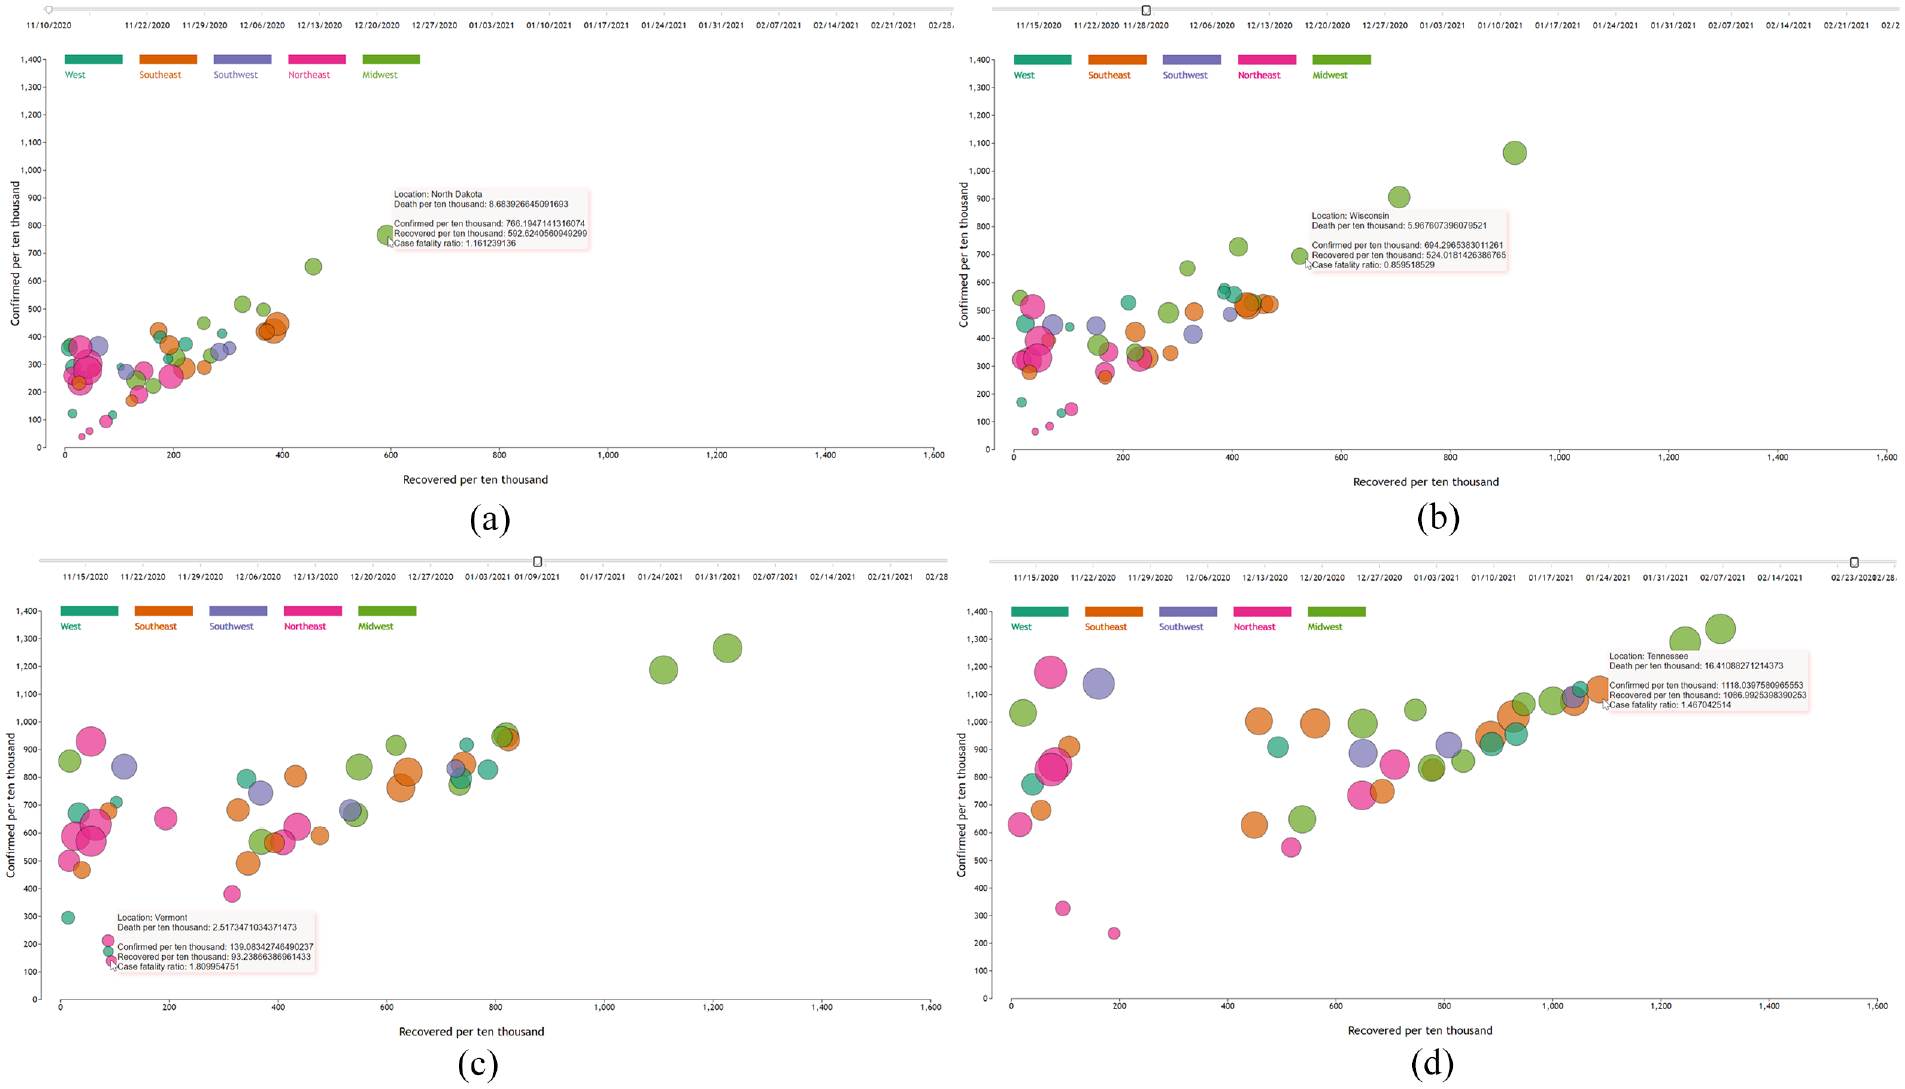
Illustration of four time points: (a) 11/10/2020, (b) 11/28/2021, (c) 01/09/2022, and (d) 02/23/2022 –from the dynamic visualization of the progression of coronavirus disease. The x-axis represents recoveries per 10,000, the y-axis shows confirmed cases per 10,000, and the circle radius represents deaths per 10,000. The 52 states in the United States are grouped into five regions, with each group distinguished by a unique color.
The developed platform aims to enhance risk perception by incorporating interaction as a critical component. This feature will help professionals effectively communicate the importance of pandemic data while assisting regular citizens in making informed and safe decisions in a world affected by coronavirus disease. In our next research phase, we will collect data on socio-economic factors and integrate it with the coronavirus data used in this study. We will design machine learning models to link socio-economic information with COVID-19 incidence rates and predict future development trends. Additionally, we will invite domain experts to evaluate our visualization algorithms and software platform through targeted case studies.
The organization of this paper is as follows. Section Materials and Methods introduces the platform and tools used in this research, along with the procedures for preparing and processing data. Next, it details the algorithms for data visualization and synchronization, followed by an explanation of how data rendering progresses over time. Section Results and Analysis presents the experimental results using the proposed system for multi-parameter pandemic data visualization and synchronization over time. Finally, Section Conclusion provides concluding remarks.
Materials and methods
Platform and tools used
In this paper, we focus on creating a modern, responsive, and user-friendly web application to address the new needs of the coronavirus disease outbreak. Multi-factor data about coronavirus and vaccination data over time from January 12, 2021, to May 10, 2023, are used in this research. To build a robust and visually appealing web application that works seamlessly across different platforms, cutting-edge web technologies, such as the programing language JavaScript, and the markup language HTML5 (Hypertext Markup Language 5), are used in our interactive system design for structuring and presenting content on the World Wide Web, and Cascading Style Sheets (CSS) is employed for the formatting of a document written in a markup language. Using JavaScript for interactivity, HTML5 for content structure, and CSS for styling reflects a standard and effective approach in contemporary web development.
Visual Studio Code is used for software development, in which the
An open-source, cross-platform JavaScript runtime environment Node.js 42 is used to build the server that runs JavaScript on server-side scripting, which enables an asynchronous event-driven JavaScript runtime, and Node.js web application framework Express 43 is employed to provide features for web application and launch client-side data visualization in web browsers.
Data preparation and processing
In this project, multiple data sets are taken from the New York Times “The Coronavirus Pandemic,” 44 the State Health Facts, 45 the Centers for Disease Control and Prevention (CDC), 46 and Kaggle, 47 respectively. The collected data are stored in five corresponding CSV (comma-separated values) files, which are text files that have a specific format allowing data to be saved in a table-structured format.
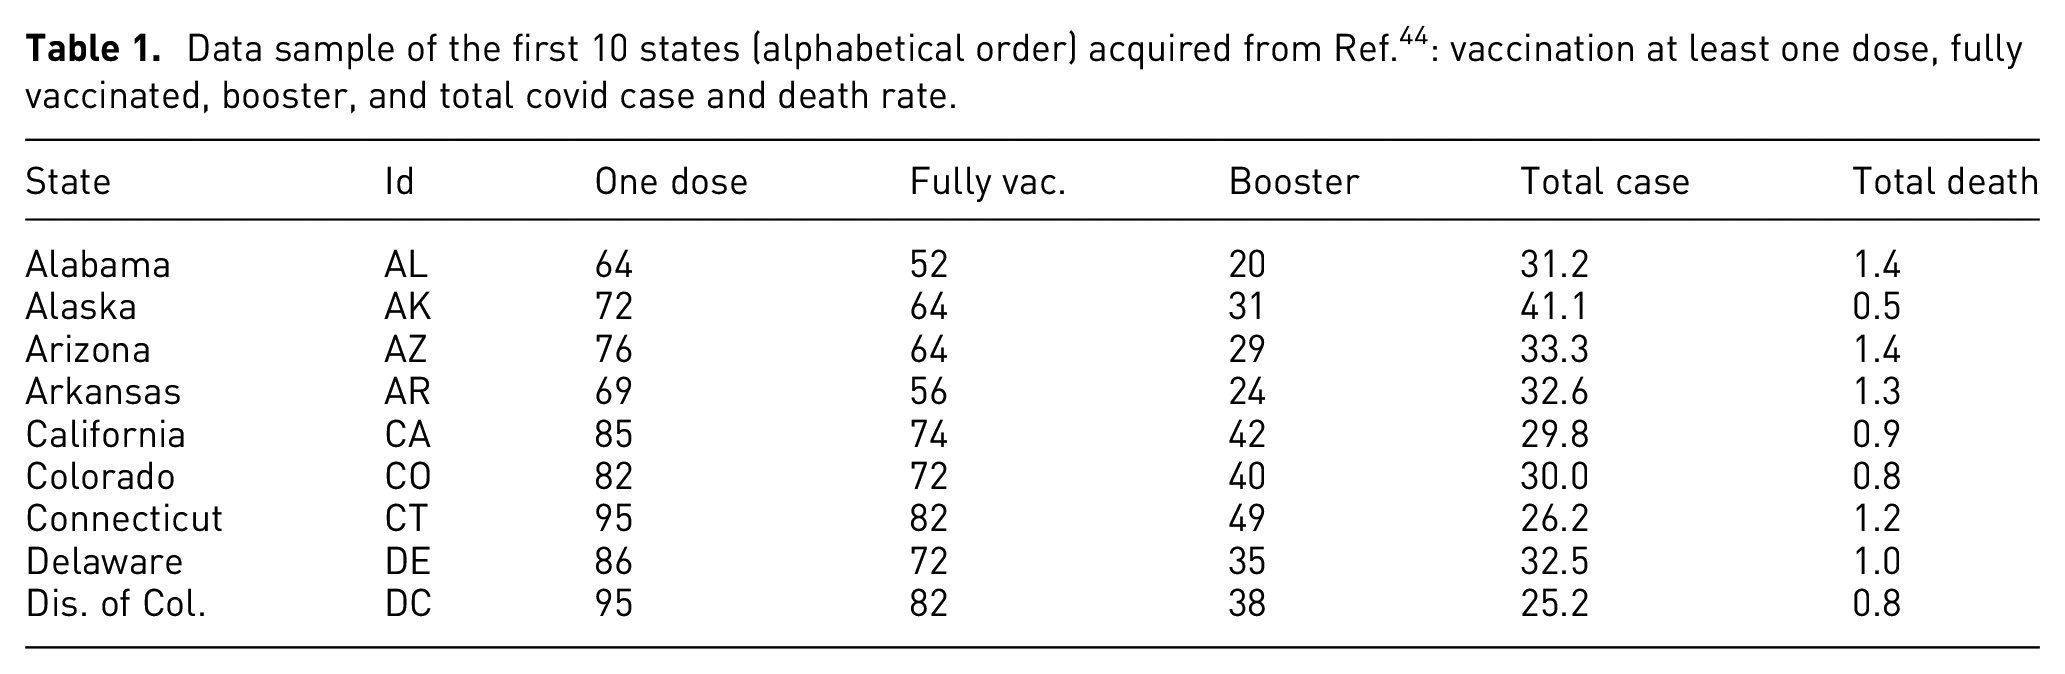
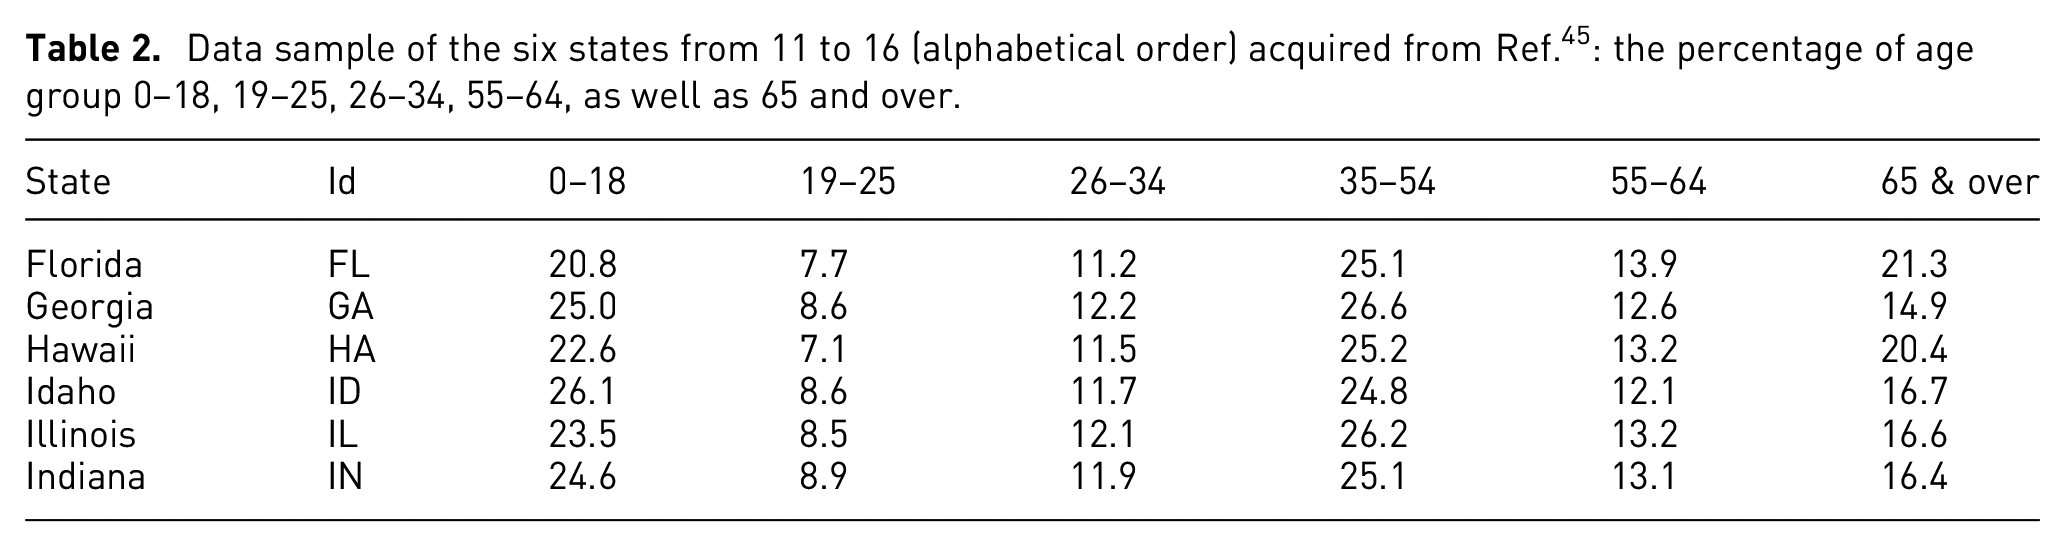
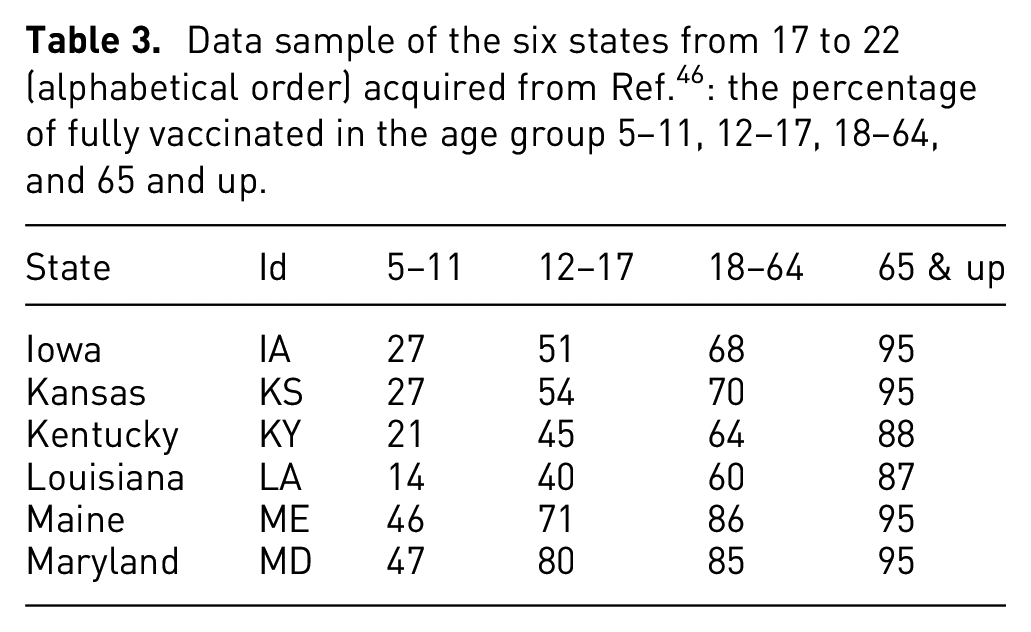
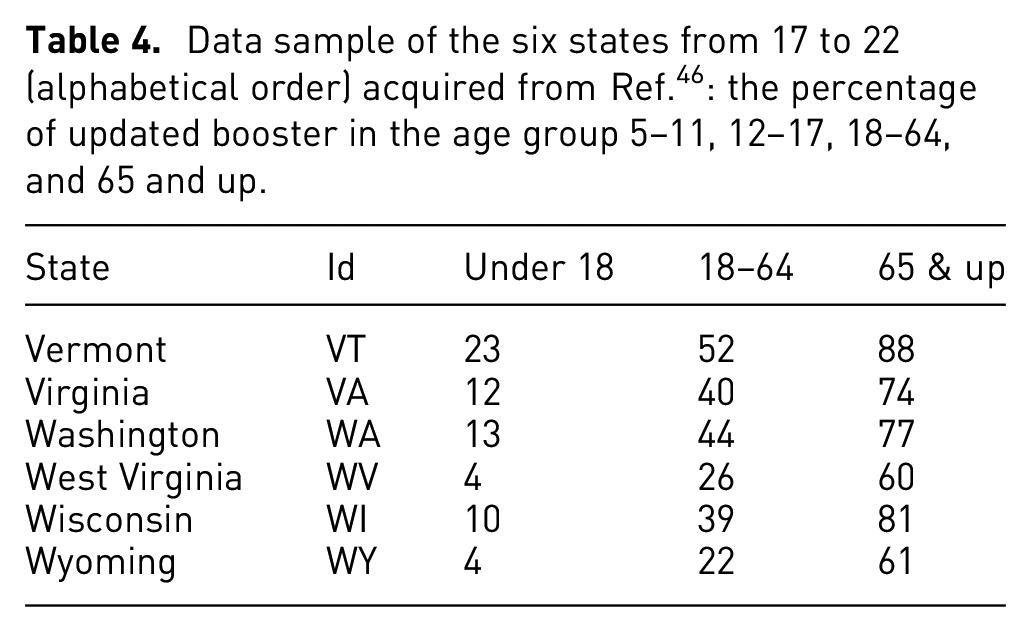
The major objective of this project is to visualize pandemic and vaccination data and extract information about their connections in each state of the United States. Therefore, we selected the data for vaccination (at least one dose, fully vaccinated, booster), as well as the total COVID-19 case and death rates (Table 1). To find relationship variations in different age groups, we collected the percentage of each age group in each state of the United States (Table 2), the percentage of fully vaccinated individuals in each age group (Table 3), and the percentage of updated boosters in each age group (Table 4). For these four tables, we only selected six states as examples to show the data format and values in each category. We did not list the entire dataset used in the visualization and analysis in these tables.
Data sample of the first 10 states (alphabetical order) acquired from Ref. 44 : vaccination at least one dose, fully vaccinated, booster, and total covid case and death rate.
Data sample of the six states from 11 to 16 (alphabetical order) acquired from Ref. 45 : the percentage of age group 0–18, 19–25, 26–34, 55–64, as well as 65 and over.
Data sample of the six states from 17 to 22 (alphabetical order) acquired from Ref. 46 : the percentage of fully vaccinated in the age group 5–11, 12–17, 18–64, and 65 and up.
Data sample of the six states from 17 to 22 (alphabetical order) acquired from Ref. 46 : the percentage of updated booster in the age group 5–11, 12–17, 18–64, and 65 and up.
We aimed to visualize and analyze the relationship between pandemic rates and vaccination over time in each state of the United States. Therefore, we collected data over time for total confirmed cases, deaths, and recoveries from 04/12/2020 to 03/07/2021 and the percentage of people vaccinated, vaccinations distributed, and boosters used from 08/27/2021 to 05/10/2023 (Table 5). This table only shows five states and three time periods as an example of the data format and value range used in this research. The collected vaccination data span over 2 years and are used to illustrate vaccination progress, providing a detailed summary with multiple metrics such as the number of vaccines given in each state, the number of people who received the first dose, the second dose, the booster percentage, and daily vaccinations per million, etc. We also display and analyze the dynamic connections between vaccination, booster shots, coronavirus disease confirmation rate, the percentage of recovery, and deaths over time.
Illustration of data samples of the six states in six regions of the United States acquired from Ref. 47
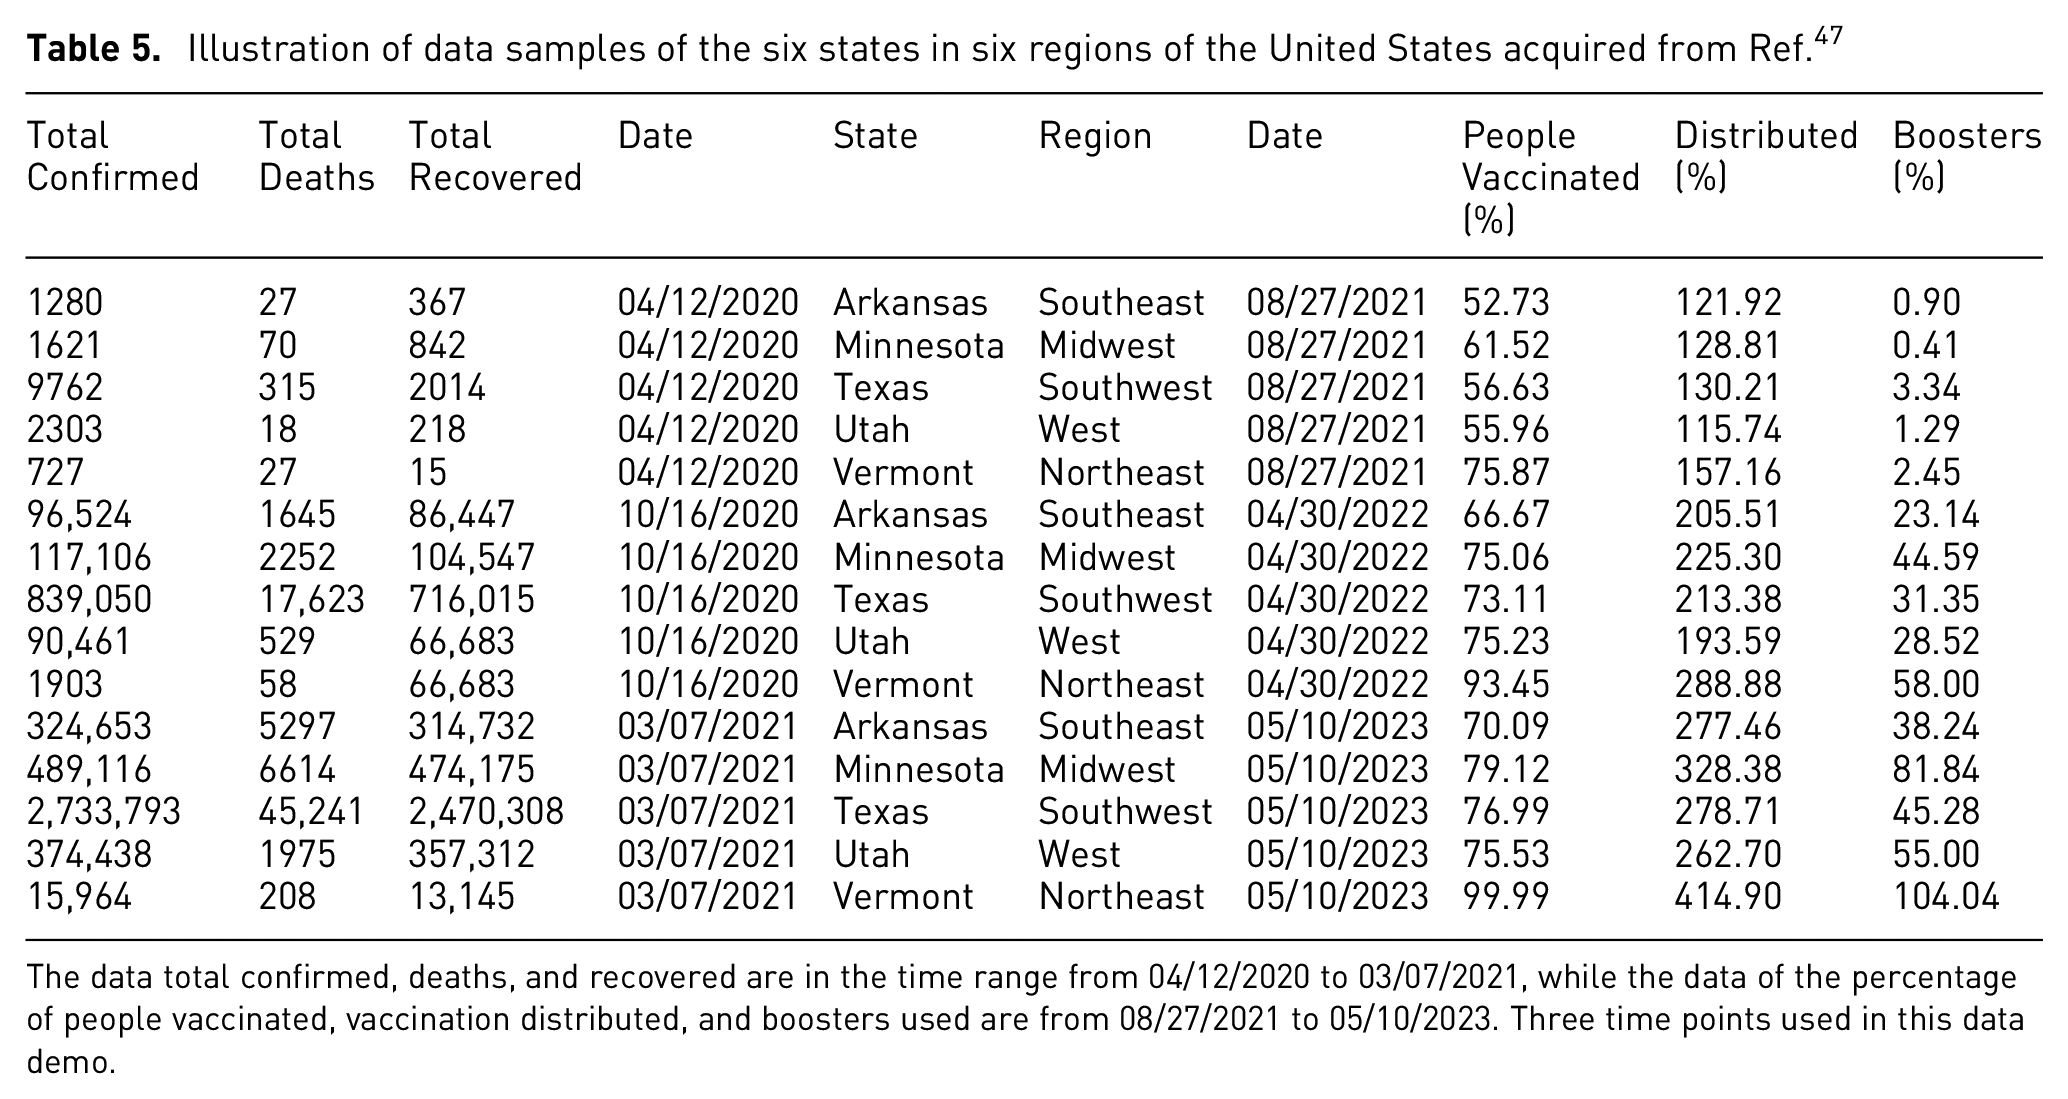
The data total confirmed, deaths, and recovered are in the time range from 04/12/2020 to 03/07/2021, while the data of the percentage of people vaccinated, vaccination distributed, and boosters used are from 08/27/2021 to 05/10/2023. Three time points used in this data demo.
Table 1 shows sample data of the first 10 states (alphabetical order) acquired from, 44 including the state names and corresponding IDs, as well as the population percentage of vaccination, that is, at least one dose, fully vaccinated, updated booster, and the total coronavirus disease rate and death rate at the time October 20, 2022. The data of the population distribution by age is scrapped from. 45 The data set contains the population percentage of five age groups in each state in 2021, and the six states from 11 to 16 are illustrated in Table 2. The data of coronavirus vaccinations in the United States by defined age groups is demonstrated in Tables 3 and 4, which contain six selected states to show information on fully vaccinated and updated boosters in the age group, respectively.
The example vaccination and disease cases data are shown in Table 5. The data of total confirmed cases, deaths due to coronavirus disease, and recovered are listed from 04/12/2020 to 03/07/2021 in five states, each from a different region. The percentage of vaccinated, vaccine distributed, and the percentage of boosters used between 08/27/2021 and 05/10/2023 is also listed in this table. The states in the United States are grouped with regions in unique colors, and the vaccination and disease information is visualized dynamically over time, which can be interactively rendered over time through changing time sliders on the web-based platform. The items used in our visualization include total boosters per 100, total vaccinations per 100, people vaccinated per 100, percentage of fully vaccinated, daily vaccinations, and vaccination distributed per 100. All the vaccination data is illustrated over time in more than 2 years.
The analysis framework identifies relationships among grouped features, including total confirmed cases, deaths, and recoveries. Total confirmed cases provide insights into the extent of pandemic transmission, while total deaths indicate disease severity. Recoveries help evaluate treatment effectiveness and highlight vaccine efficacy. Additionally, parameters related to vaccination rates gage the level of protection vaccines offer against health outcomes. This information is essential for public health authorities and healthcare professionals to develop effective, transparent communication strategies on vaccine safety and effectiveness. It also guides the selection of appropriate vaccines to control the pandemic effectively.
The
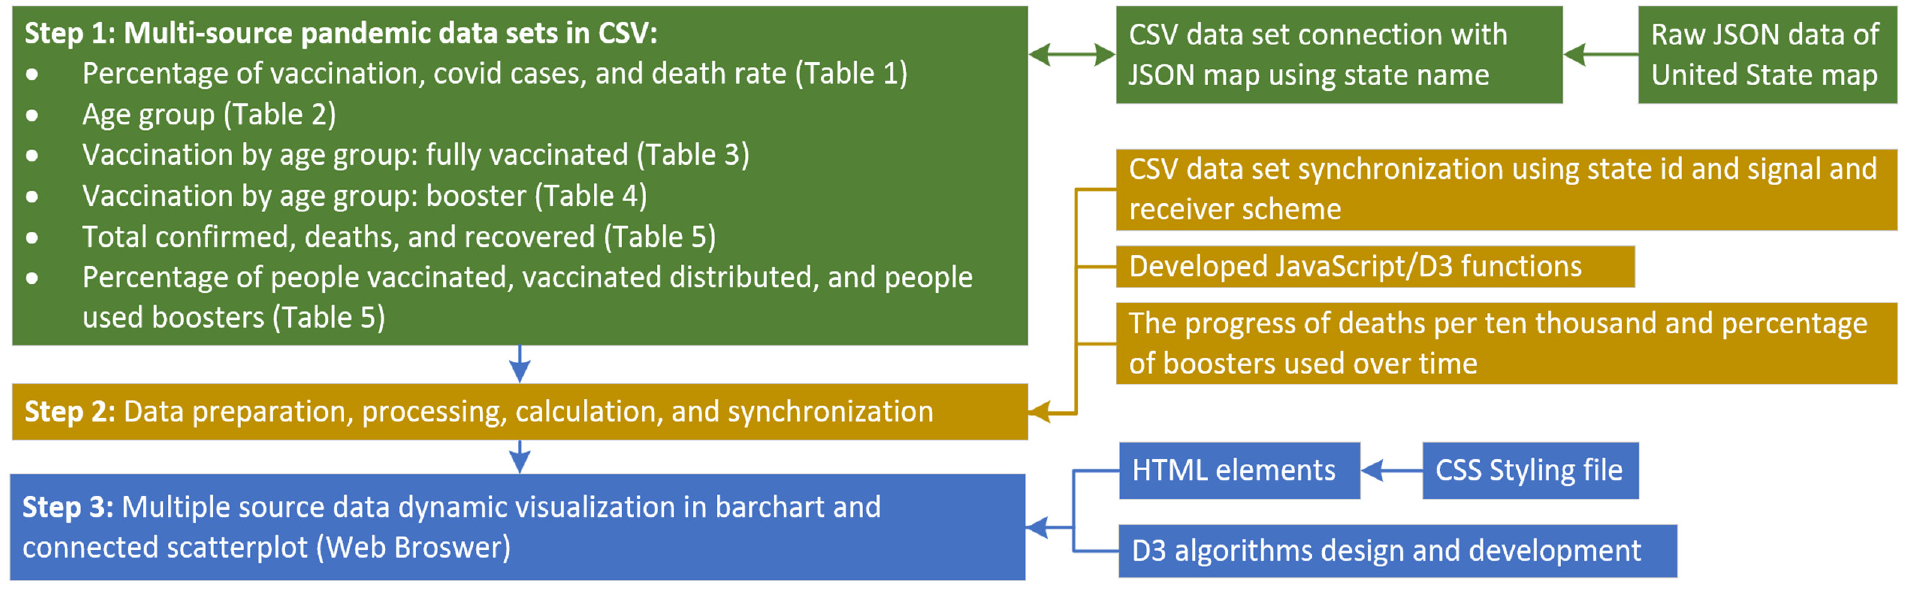
Diagram illustrating the research workflow, depicting the pipeline from synchronizing multiple raw data sources in CSV format and a JSON map of the United States through data processing and calculation to component transformation, dynamic visualization, and multi-parameter progress evaluation over time within a web browser.
We designed two types of synchronization mechanisms, as illustrated in Figure 4. The first type uses the state name as an ID to dynamically link all grouped attributes. Parameters are classified into several groups based on similarity and function, with the state name assigned as the parameter ID for each group. When users interact with a parameter widget on the graphical user interface, a signal is emitted to all the side-by-side data visualization components. Consequently, all components with the same ID are enhanced and updated based on the received signals. The second type of synchronization involves separating the data into individual time points. When users adjust the current time point using a slider, a signal is sent to all components in the web-based user interface. This triggers updating and synchronizing all parameter values to reflect the selected time point.
Data visualization and synchronization
In the developed platform, each graph chart is created on an independent SVG (Scalable Vector Graphics, which is an XML-based vector image format for defining two-dimensional graphics, having support for interactivity and animation) element, which is rendered with a corresponding JavaScript function. As shown in Figure 5, six graph charts are rendered simultaneously to display the acquired data sets listed in Tables 1 to 4. The data set columns of the percentage of vaccination, coronavirus cases, and death due to coronavirus disease are dynamically mapped to the United States map illustrated in Figure 5(a). The mapping is controlled by the menu, which is created with an HTML select element. The “As least one dose” is the default mapping, and users can change the mapping selection interactively. The five mapping graphs are displayed in Figure 6, which include “As least one dose”, “Fully Vaccinated,”“Booster Enhancement,”“Covid Case Rate,” and “Covid Death Rate.” When users change the mapping from the system menu, the SVG element is cleared, and the selected graph chart is rendered again with the corresponding new data.
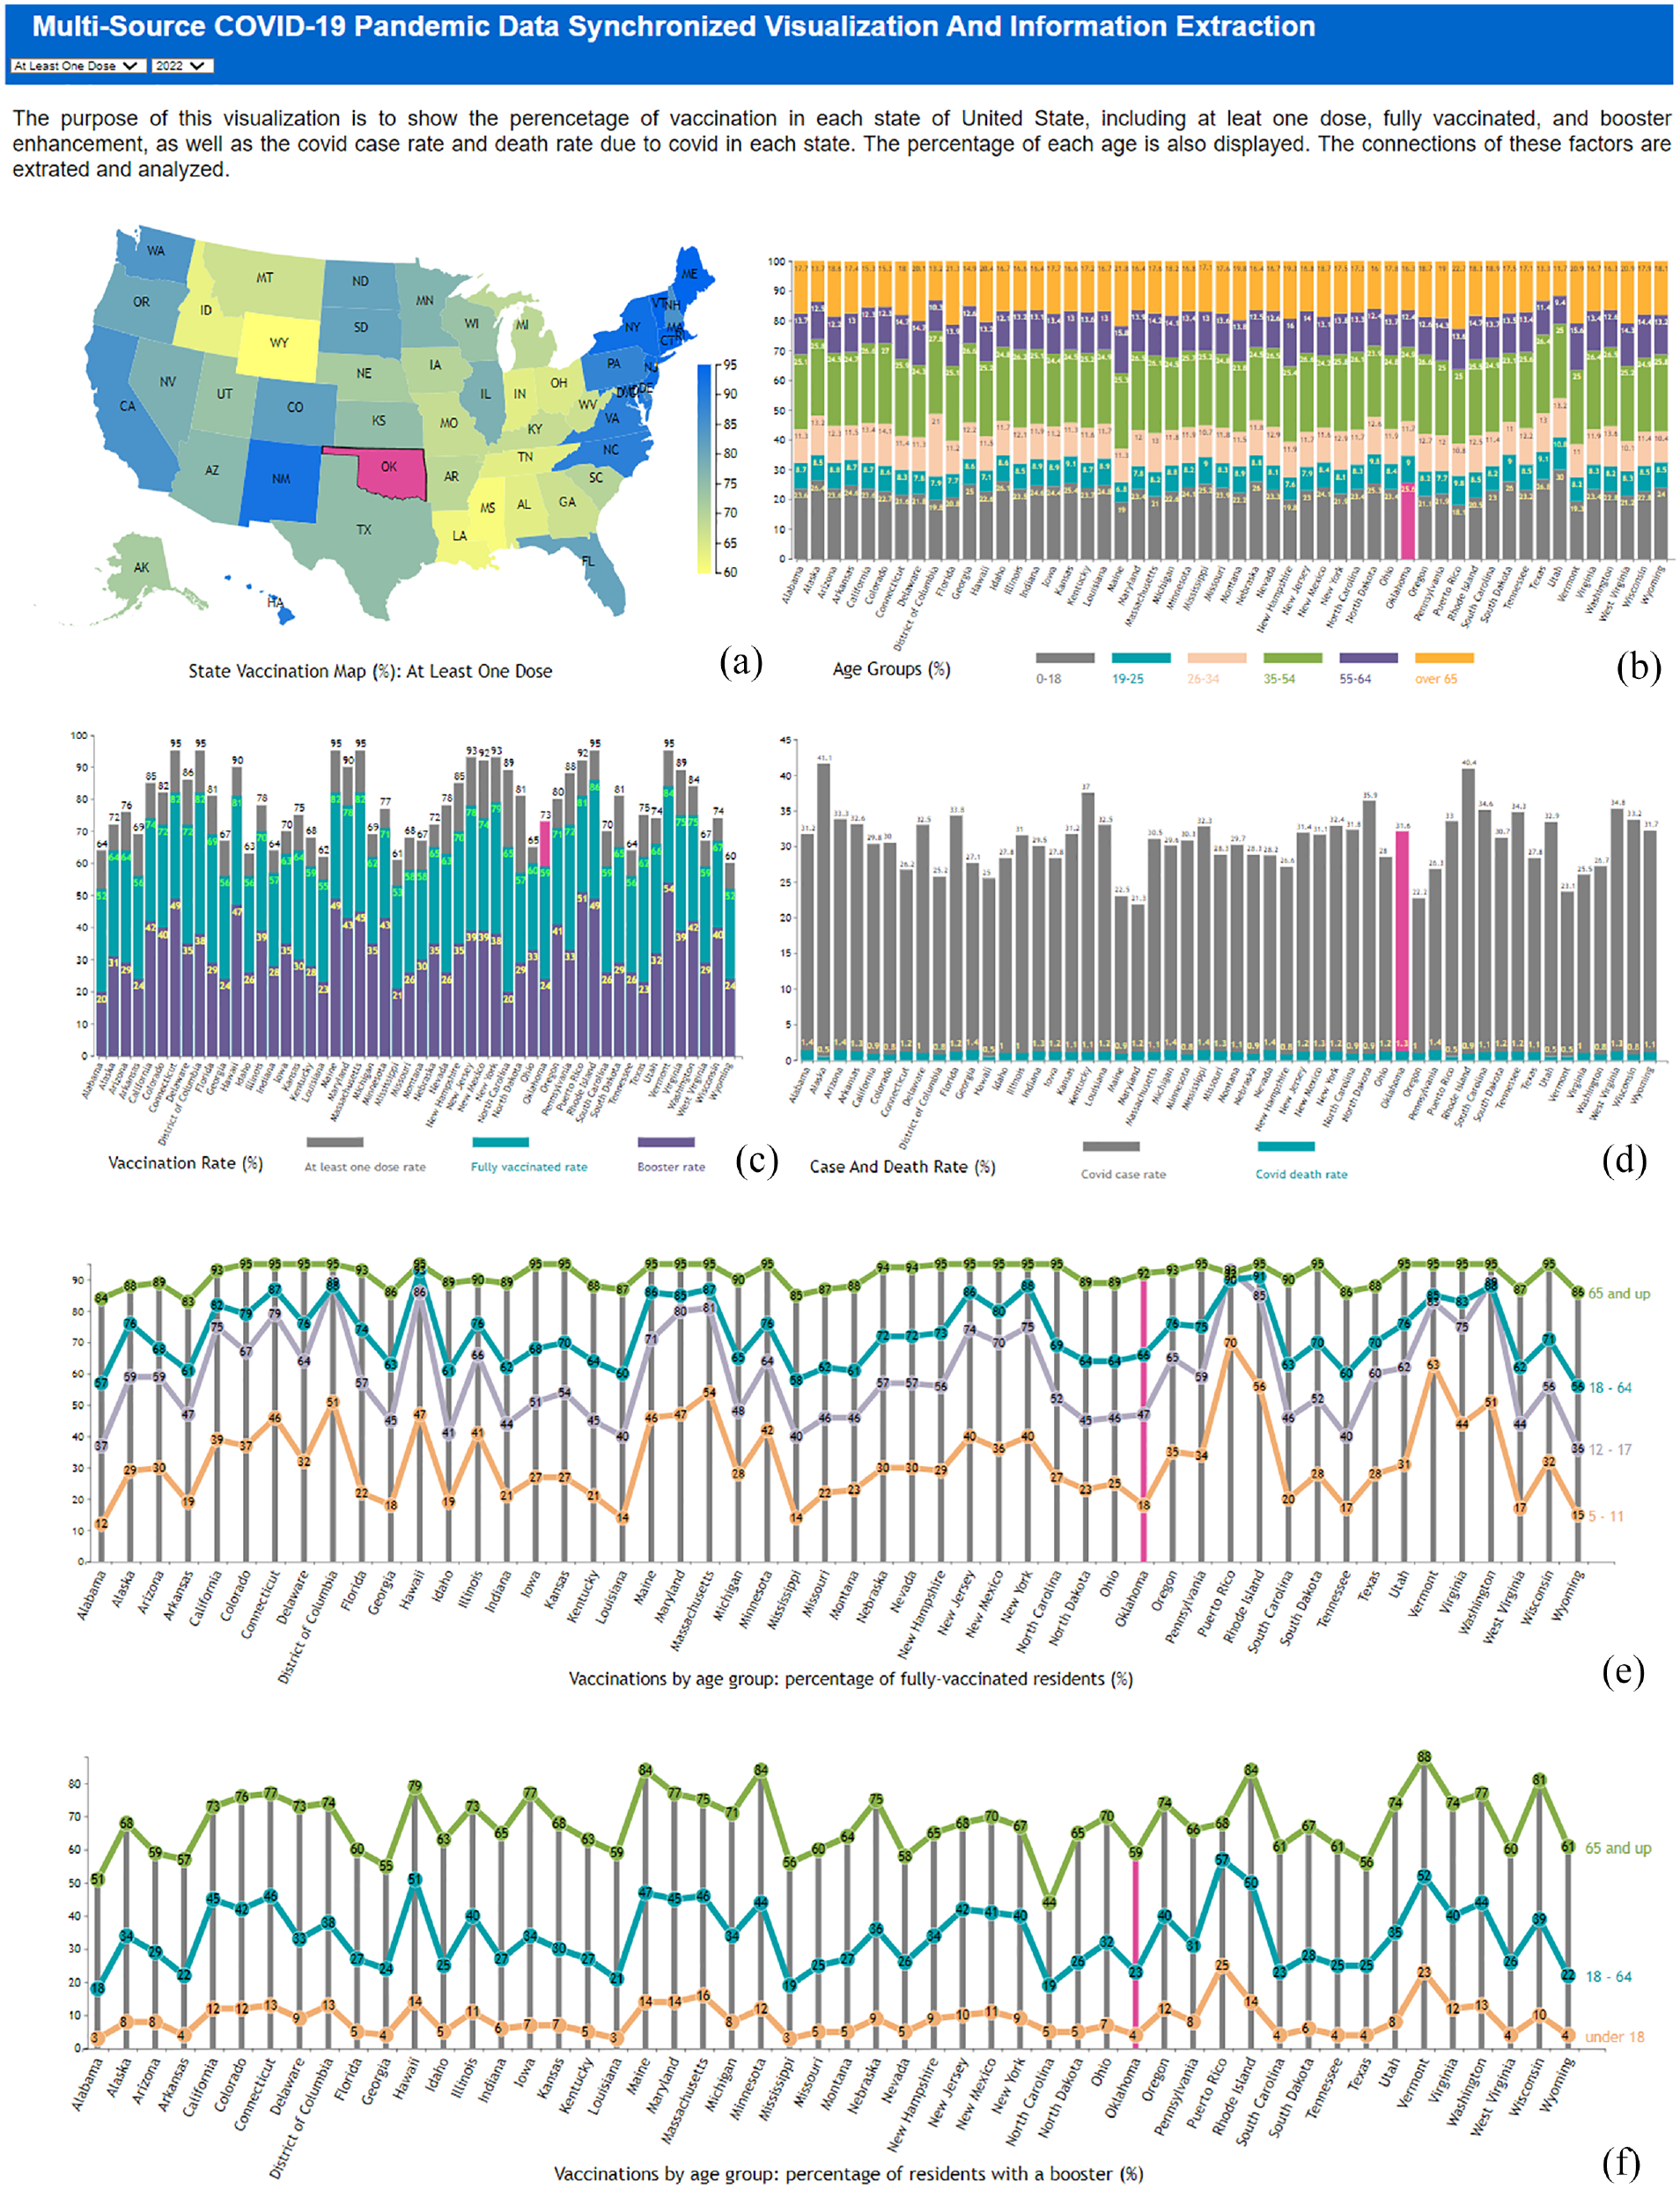
The platform diagram for data visualization in a web browser includes: (a) a map of the United States with states represented using different color scales, (b) state-specific age group population distribution, (c) vaccination and booster percentages, (d) COVID-19 case and death rates, and (e) vaccination distribution by age groups showing the percentage of fully vaccinated residents and (f) the percentage of residents with a booster. The state of Oklahoma is selected, highlighted, and synchronized across all visualizations.
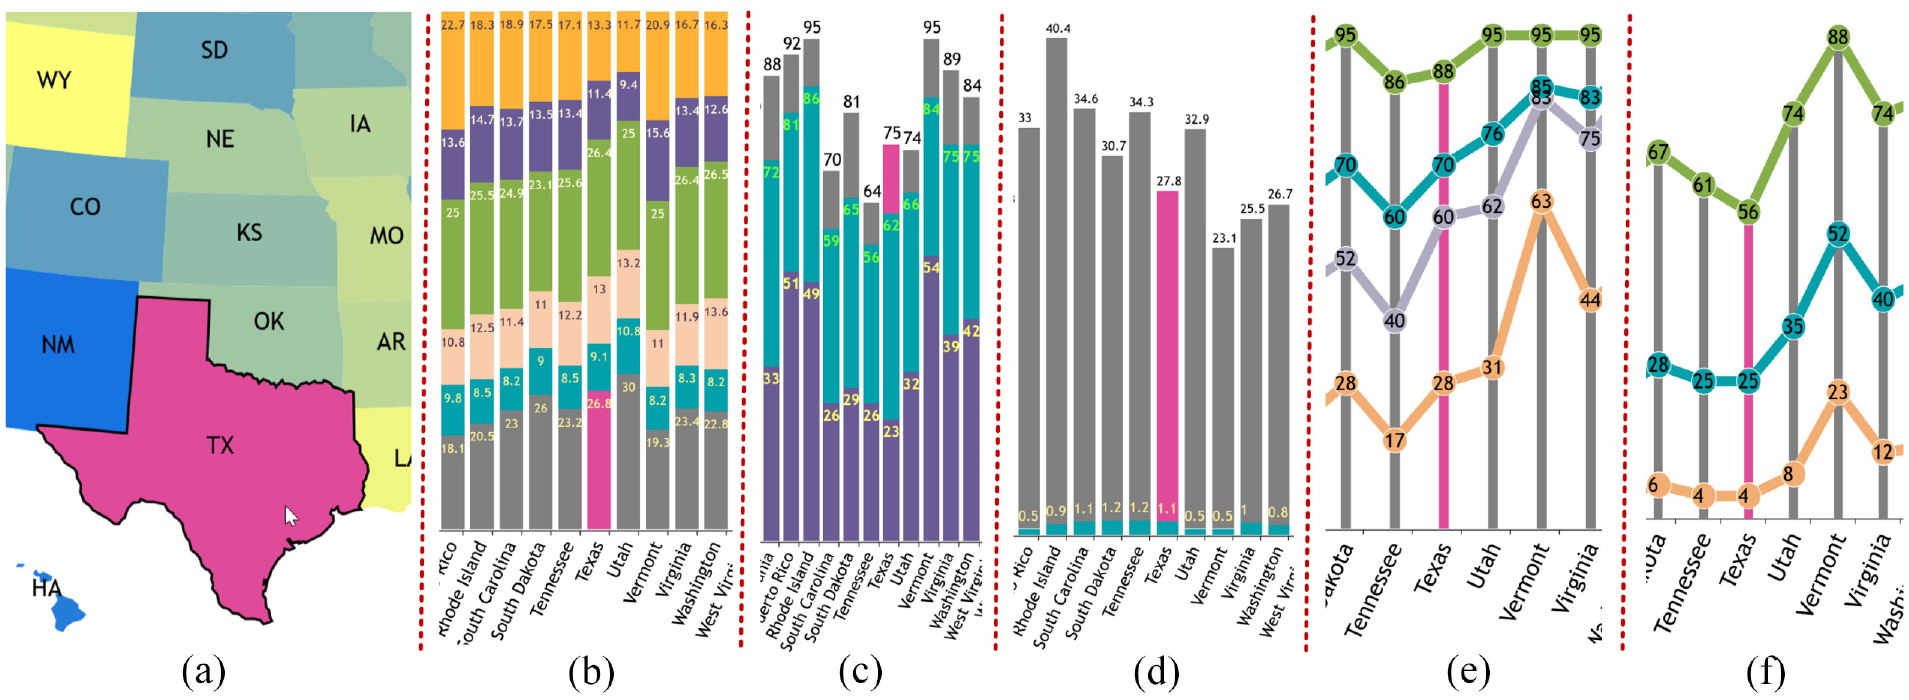
Demonstration of multi-source synchronized visualization using Texas as an example, dynamically enhanced with mulberry color, including (a) state vaccination map, (b) age group distribution, (c) vaccination rates (at least one dose, fully vaccinated, and booster), (d) COVID case and death rates, (e) vaccination percentage by age group for fully vaccinated individuals, and (f) vaccination percentage by age group for booster recipients.
The JavaScript portion of the code is contained in an HTML script element, and each data set is set to a unique ID and selected by D3. An SVG (Scalable Vector Graphics) element is appended to the ID for 2D graphics rendering. As demonstrated in Figure 5(b) and (c), our algorithm displays multiple data columns on one SVG element, which greatly improves the efficiency of space usage and quantitative information comparison. We also combine two display methods of the connected scatterplot and bar chart on one SVG element, which is described in Figure 5(d) and (e) and is used for information synchronization.
The connected scatterplot and bar chart use the same linear scale, mapping from zero to the maximum value in the current column, as selected by the second HTML select element. The mapped values are used in the y-axis, and the state names are extracted by their IDs and displayed on the x-axis using
To create the connected scatterplot and bar chart graphs, the data are used to calculate the width of each rectangle, and the index of each value in the data set is used to calculate the y attribute. The largest values are shown at the top of the bar graph, and the smallest are toward the bottom. Both the data map and bar graph represent only one column from one data set at a time. Different instances of visualization are used to compare different variables. The flowchart of the rendering process is shown in Figure 4. The initial rendering of the visualization is demonstrated in Figure 5.
The JavaScript element events mouseover and mourseout are used to synchronize the data enhancement among all the display graphs. When the mouse is on a display SVG element, which is identified by the state ID, all the graph elements corresponding to this ID will receive a signal about the selection, and their color is set to mulberry, which is demonstrated in Figure 6. When the mouse is moved out of the selected element, a signal is sent to all these elements about color changes, and all the corresponding elements will recover their original colors. This event-based scheme used in our platform will dynamically synchronize the state enhancement among all the displayed graphs in real-time. In the screenshot of Figure 5 the state Oklahoma with ID OK is selected and automatically enhanced among all the visualization results on the web browser.
Rendering data progress over time
As shown in Figure 1, the top figure (a) maps the total number of people fully vaccinated per 100. The mouse can show a tooltip of the numerical information with golden color enhancement on the corresponding boundary. The middle (b) is the progress of the boosters per 100 over time, with vaccinations distributed per 100 as the x-axis and people vaccinated per 100 as the y-axis. The bottom one (c) is the progress of deaths per 10,000 over time, with recovered per then 1000 as the x-axis and confirmed per 10,000 as the y-axis. The following items describe the algorithm for displaying the multi-parameter and multi-source data described in Figure 1.
a) Filter data set to ensure all data loaded are valid and have meaningful information. Load
b) Use
c) A series of health data about coronavirus over 2 years are loaded using
d) As shown in Figure 1(a), implement function
e) Develop function
f) Design function
Results and analysis
Multiple data sets and their associated variables and parameters are visualized dynamically with quantitative numbers to investigate the relationships between vaccination, coronavirus disease cases, and the death rate. Moreover, the progress of vaccination, booster shots, and the percentages of disease, recovery, and death are displayed and compared over time. The initial visualization web pages are illustrated in Figures 1 and 5.
Visual evaluation results demonstrate the benefits of our tool in providing a comprehensive and effective visual representation of important patterns over the past 2 years. This helps researchers and medical professionals gain a better understanding of the coronavirus, thereby enabling them to combat the disease more effectively. Moreover, in the next step of this research, healthcare professionals will be interviewed using our data visual analysis and explanation platform to gather their comments and feedback.
Information enhancement
The developed software platform introduces an interactive synchronization function to enhance feedback using events and signal schemes. When users move the mouse to hover on any bar or state in one of the six graphs, which corresponds to one state, all the other five graphs will enhance to corresponding state information with mulberry color
The Figure 6 demonstrates this function using the state Texas as an example, from which we can see that state Taxes is colored with mulberry in (a), and the age group of this state is also enhanced in (b). The corresponding vaccination and booster information and the coronavirus case and death rates are colored in (c) and (d) in real-time, respectively. At the same time, users can also intuitively detect the enhanced quantitative information of the vaccinations by age group, illustrated in (e) and (f) for showing the percentage of full-vaccinated residents and the percentage of residents with a booster, respectively.
Data mapping
The quantitative information visualized in Figure 5(b) to (d) can be mapped to the United States map (a) using color mapping with
We developed a multidimensional data visualization platform that uses a map of the United States to represent the percentage of vaccination, coronavirus case rates, and death rates due to coronavirus disease. Figure 7 shows five screenshots corresponding to the five selection choices in the dropdown menu depicted in Figure 8 for the year 2022. We collected data and created corresponding visualizations spanning from 2020 to 2022. The rendering categories include “At Least One Dose,”“Fully Vaccinated,”“Booster,”“Case Rate,” and “Death Rate,” with the mapping results illustrated in Figure 7(a) to (e), respectively. The mapping domain is determined by the corresponding dataset’s minimum and maximum values for the data column. The mapped range is from yellow to blue, meaning the ranges of the scale bar on the right in each of the five maps differ. For example, the range is from 60 to 95 in the “At Least One Dose” graph, while the coronavirus death rate graph ranges from 0.5 to 1.4. This allows for easy detection of color differences across states on the map.
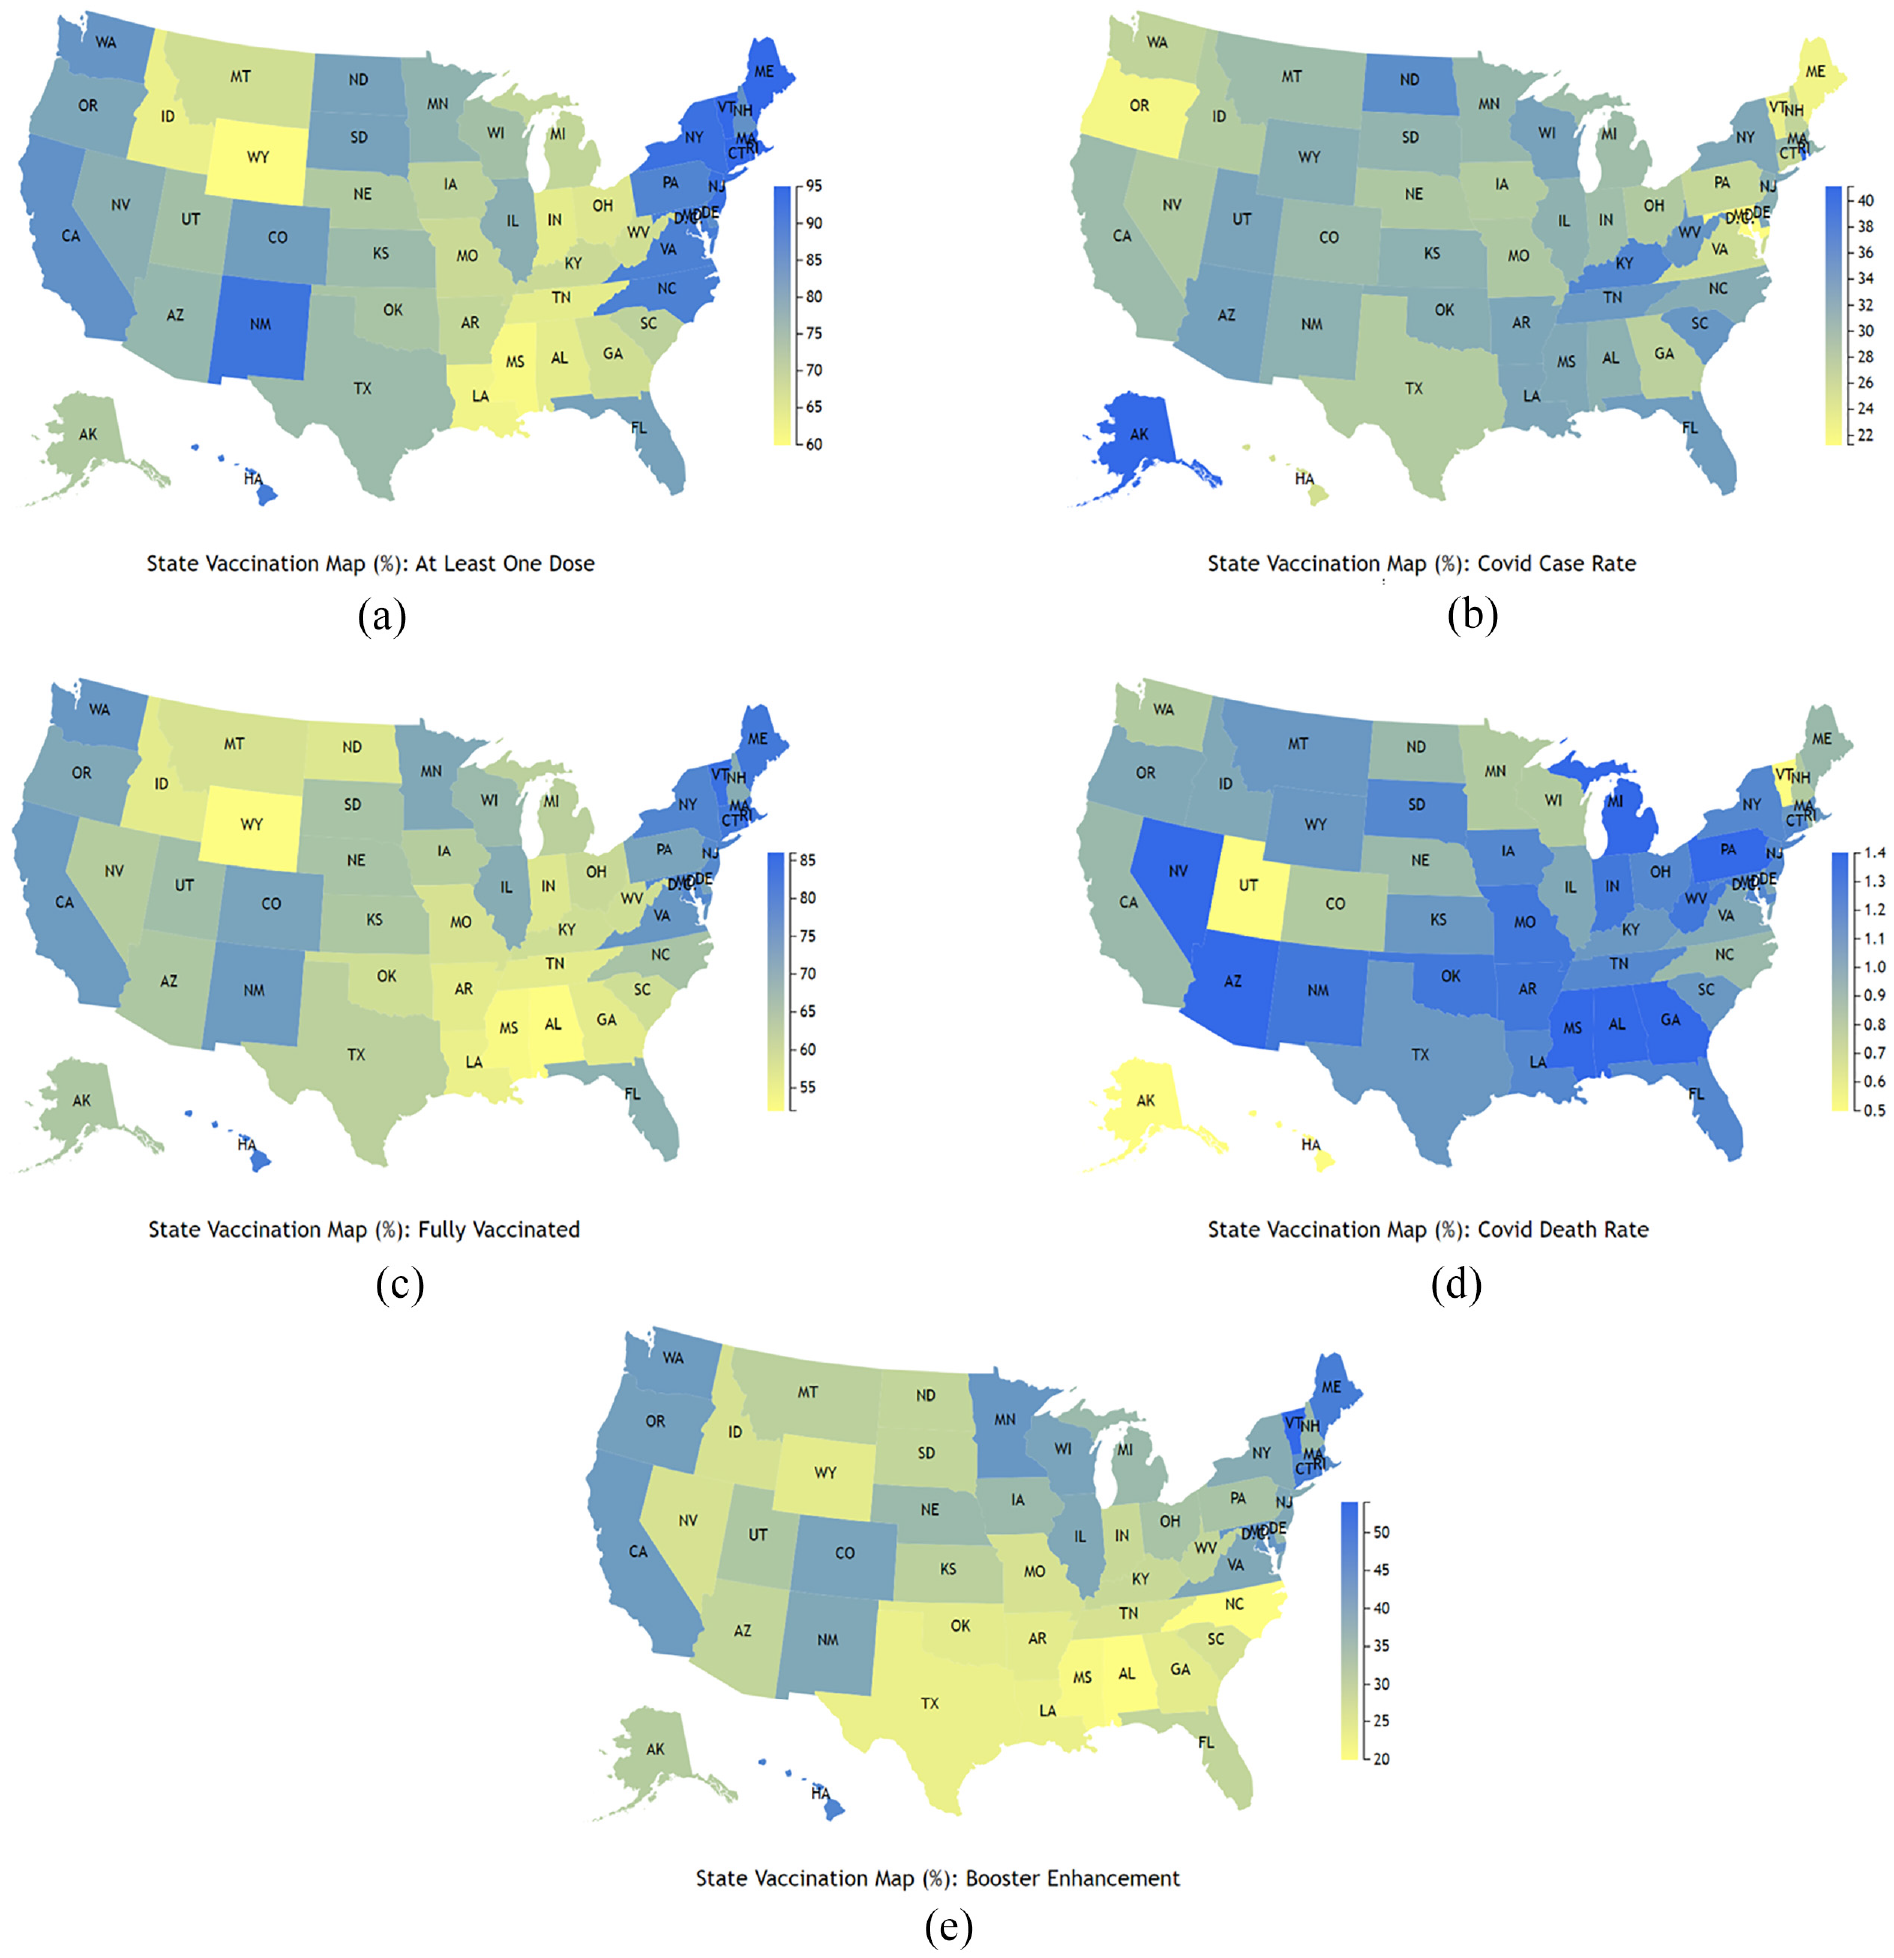
Screenshots of multidimensional data visualization on a United States map representing the percentage of vaccination, coronavirus case rate, and death rate due to coronavirus disease: (a) At least one dose, (b) Fully vaccinated, (c) Booster, (d) Coronavirus case rate, and (e) Death rate. The screenshots are depicted in Figure 7.
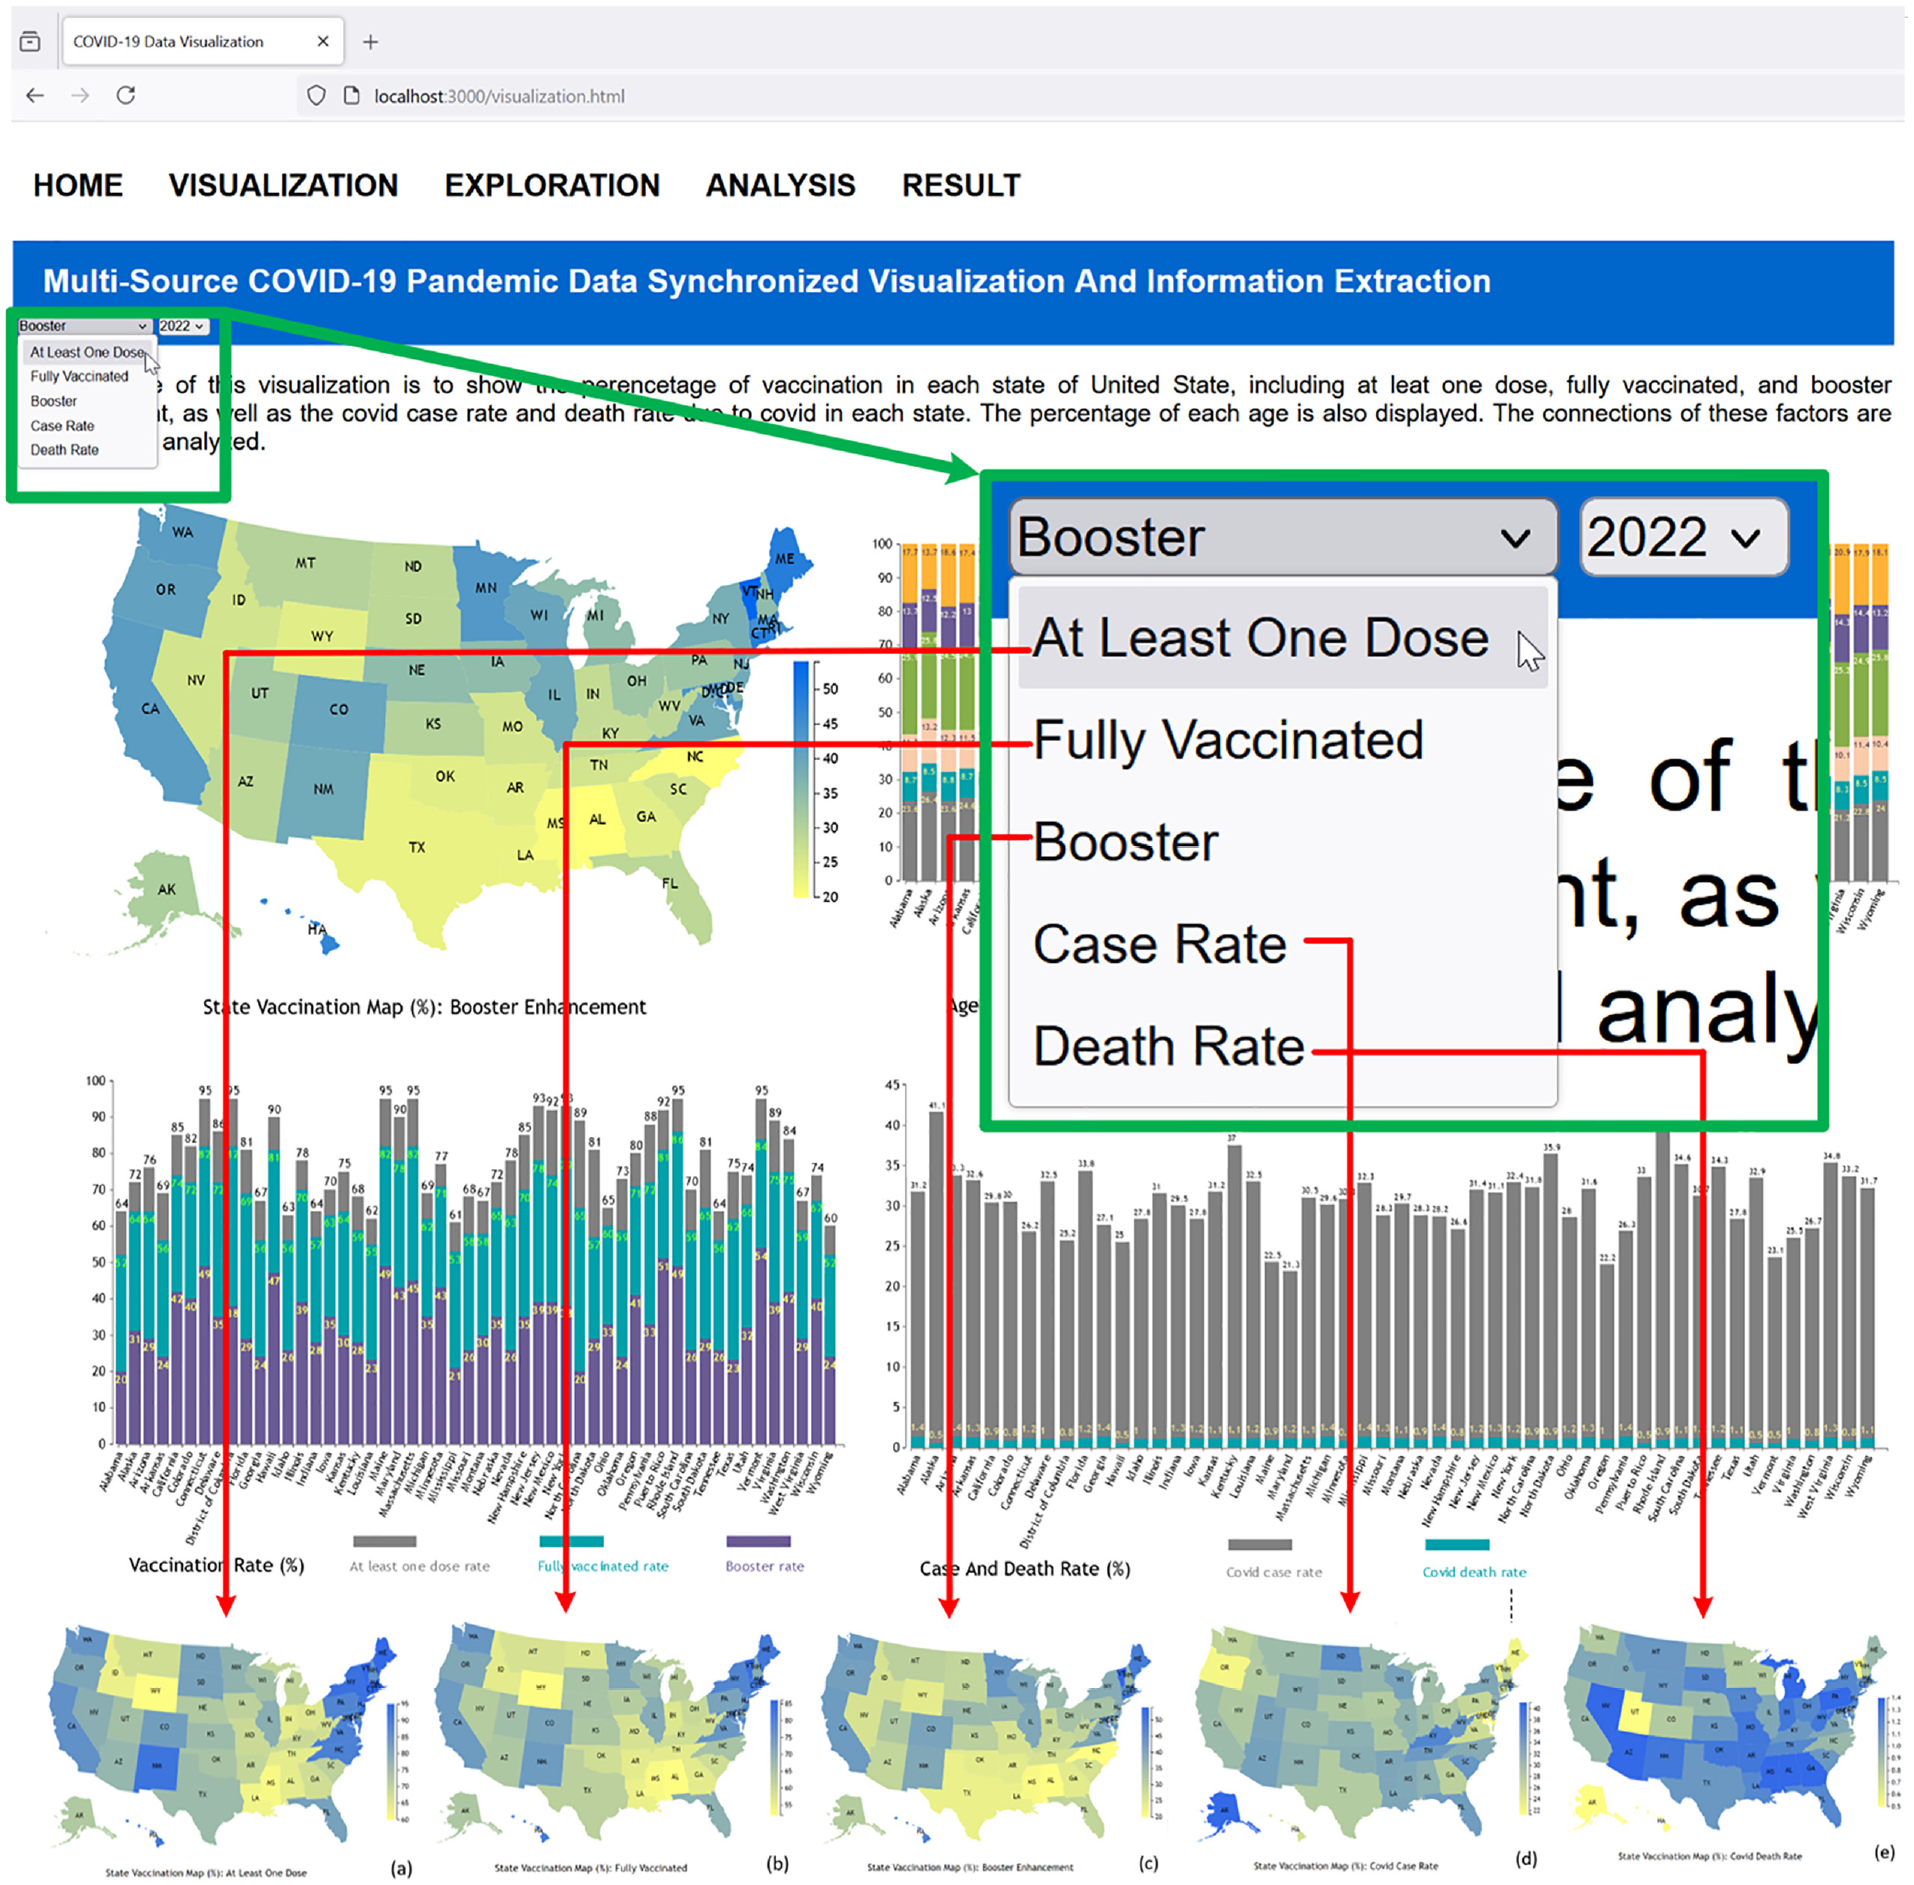
Selection of multi-parameter options from the dropdown menu (top left) and corresponding screenshots generated for the United States map representations in Figure 7, depicting: (a) At Least One Dose, (b) Fully Vaccinated, (c) Booster, (d) Case Rate, and (e) Death Rate in the year 2022.
From Figure 7(a) to (d), we can see that when a state has a higher at least one dose rate, this state usually has a higher fully vaccinated and booster rate, and vice versa. When comparing (c) - (d) with (e) and (f), we can detect that when a state has a higher vaccination rate, this state usually has a relatively lower case rate and corresponding lower death rate due to coronavirus disease. Moreover, we can see that the death rate due to coronavirus disease is low, which is <1.4%. We can conclude that coronavirus disease has relatively strong transmission capability, that is, it can be around 40% in the total population, but the mortality risk is relatively low.
We can also extract information that the vaccination is region-based, for example, the northeast region has a relatively higher vaccination and booster rate, which can achieve around 90%–95%, and this region also has a relatively lower coronavirus disease case rate that is <25%. On the other hand, the south region, especially Louisiana, Mississippi, Alabama, Tennessee, Kentucky, and West Virginia, has a relatively lower vaccination rate of around 60% fully vaccinated, and this region has a relatively higher case rate that is around 32%–37%.
Multi-source bar chart
The quantitative information on vaccination rate, including at least one dose, fully vaccinated rate, and booster, can be displayed in 1 bar chart in our system, described in Figure 5(c). We use the merge method to design this visualization, during which the largest data set, that is, at least one dose, is displayed first in the bar chart in gray color, then the second largest data set, that is, fully vaccinated, is visualized in the same bar chart in cyan color, so in each state, the light gray color is covered to the cyan color. Next, we display the smallest data set, that is, booster rate, in blue. The quantitative numbers in each state of the three categories are shown in each bar to analyze and compare this information between the states.
A similar method is used to visualize the quantitative information of case rate and death rate in Figure 5(d). We can detect the relationship between the vaccination rate and case rate using these 2 bar charts. For example, in the states Maine, Maryland, and Vermont, the fully vaccinated rates are 82%, 78%, and 84%, respectively, and the corresponding case rates are 22.5%, 21.3%, and 23,1%, respectively. On the contrary, in the states of Tennessee, Arkansas, and Louisiana, the fully vaccinated rates are 56%, 52%, and 55%, respectively, and the corresponding case rates are 34.3%, 31.2%, and 32.5%, respectively. We can see that a higher vaccination rate can get a lower coronavirus disease rate, which can prove the effect of the vaccination.
However, there are some exceptional cases, such as in the states of Rhode Island and Massachusetts, where the fully vaccinated rates are 86% and 82%, but the corresponding case rates are 40.4% and 30.5%. The death rate is 0.9% and 1.1%, respectively, the case rate is relatively high even with a high vaccination rate, the death rate in both states is among the average, so we also need to consider other factors that can affect the case rate. Figure 6(c) demonstrates Texas state enhanced in vaccination rate, while Figure 6(d) shows the case and death rate with the same state colored.
Age group consideration
Usually, the coronavirus disease rate has connections with the percentage of age groups in the population of a state, so we show the age group of all 52 states in the United States. The percentage of six age groups displayed in Figure 5(b), that is, 0–18, 19–25, 26–34, 35–54, 55–64, and 65 and over. However, we did not detect a direct relationship between the groups in a state with its coronavirus disease rate. Therefore, we also display the vaccination and booster rates in the age groups of all 52 states, which are illustrated in Figure 5(e) and (f), respectively.
The connected scatterplot is used with a bar chart to show the vaccination and booster rates in various age groups. The bar chart is used to connect different age groups in a state and to synchronize information enhancement, that is, when the mouse is moved over the bar of a state, the state’s visual information in all other graphs is enhanced simultaneously in mulberry color, which has been demonstrated in Figure 6 using Texas as an example. As demonstrated by Figure 5(e), for the percentage of fully vaccinated residents, four age groups are visualized, that is, 5–11, 12–17, 18–64, and 65 and up, while for the percentage of residents with a booster category, three age groups are visualized, that is, under 18, 18–64, and 65 and up, which is illustrated in Figure 5(f). From both (e) and (f), we can see that for both fully vaccinated and booster rates, the age group 65 and up has a significantly higher rate than the other age groups, which can achieve above 84% and 51% in all states. In contrast, the corresponding rates for the age group 18–64 are 67% and 18%, respectively. The age group under 18 is much lower than the first two.
From the vaccination rate in the age group analysis, we can conclude that even the senior residents have relatively higher chances of getting coronavirus disease. Still, this age group has a much higher vaccination and booster rate, so the coronavirus disease case rate is not higher than other age groups. We can also know that there is no direct connection between the percentage of age group and the state’s coronavirus disease rate. Figure 6(b) shows part of the vaccination rate with Texas state enhanced with mulberry color, and the corresponding partial figures of the vaccination by the group are described in Figure 6(b) and (f) with the same state selected.
Multi-parameter evaluation over time
As demonstrated in Figure 1, the final information of the percentage of total people fully vaccinated is visualized in (a), multi-parameter vaccination data is dynamically displayed to show the progress over time from 08/27/2021 to 05/10/2023, which is illustrated in (b). The coronavirus disease case number and recovery information are visualized with a time range of more than 1 year using multiple parameters. All the visual information can be updated in real-time and demonstrated in (c). The data in (b) and (c) are grouped into one of five regions with individual colors, and the time slider is designed for navigating the time to show the updated information, so the displayed data will be rendered dynamically.
The dynamic visualization result of the progress of the percentage of vaccination, people vaccinated, and boosters used in four-time points is described in Figure 2, from which we can see that at the beginning of the data rendering, the percentage of boosters is small, the District of Columbia has the largest percentage 14.02% in getting a booster dose of vaccine, and the state West Virginia has the lowest booster dose percentage of 0.07%. The state with the lowest percentage of vaccination distributed is Wyoming, with 100.41%, and the state with the lowest percentage of people vaccinated is Idaho, with 43.85%. The initial rendering result is illustrated in Figure 2(a). As shown in (b), the states of the largest and smallest percentage of getting a booster dose are the same as (a) but increase by 1.6 times. Also, we can see that most states have similar percentages of vaccine booster dose usage, and the states in the Northeast region have relatively high vaccination rates in both distribution and usage. The booster rate difference among the states in the region of the Southeast is the largest, which is in the range from 1.23% to 19.25%. When the time point changes to October 2022, the state of Vermont has the largest booster dose rate of 84.29%, which is illustrated in (d). All the states have increased the vaccination and vaccine booster dose rate, but the speed is different. The Northeast region keeps the highest average of all the three parameters of vaccinations distributed, people vaccinated, and booster dose usage. The overall web-based result of vaccination is illustrated in Figure 1(b).
The dynamic progress of coronavirus disease confirmed, recovered, and death is illustrated in Figure 2. The visualized information of this pandemic disease at the beginning time of 11/10/2020 is shown in (a). New Jersey and New York are the two states with the highest rates of death per 10,000, with 18.09 and 17.48, respectively. However, the confirmed and recovered number per 10,000 in these two states is relatively low, with 301.55 and 42.18, 278.22, and 41.82, respectively. The state of North Dako has the highest confirmed and recovered rate. Also, we can see that in most states, the relationship between the confirmed and recovered rates is close to linear. Most states with high death rates are in the region of the Northeast. As selecting the time point at the end of November 2022, the three parameters of the confirmed, recovered, and death in all the states have increased, but the increasing speed in the first two parameters is faster than the third one. The states in the Midwest region have the largest range in the confirmed and recovered ratios, described in (b).
When we select the next time point of 01/09/2021, as illustrated in Figure 2(c), the relationship between the rate of confirmed cases and recovered from coronavirus is almost linear for most states. However, the four states in the Northeast, that is, New Jersey, New York, Rhode Island, and Connecticut, have relatively low recovery and high death rates. At the same time, there are four states, that is, Vermont, Hawaii, Maine, and Oregon, that have much lower death rates even though they have low recovery rates, and the difference is around nine times when comparing Vermont with New Jersey. We think the isolation and precautions differences among these states need to be further investigated to explain the reason. When we select the end time point using the slider, as shown in (d), the four northeast states, including New Jersey, have relatively high death rates, and the corresponding recovery rate changes little. We can also see that Arizona and Kansas have relatively low recovery rates but high death rates. Also, the relationship between confirmed and recovered rates is almost linear in most states. The two states of North and South Dakota have the highest confirmation and recovery rate. At the same time, Vermont and Maine have the lowest death rates of 3.04 and 4.83 per 10,000, respectively, and both belong to the northeast region.
Here, we have visualized and analyzed the vaccination, dose distribution, booster dose usage, and death rate due to the pandemic. However, other factors such as isolation, wearing a mask when levels of coronavirus disease infections are higher, getting tested and staying home if a person is sick, getting tested if required by the workplace, and wearing a mask to protect the vulnerable should also be investigated and analyzed to explain all the rendering results logically. The difference in the states on the implementation of quarantine measures, application of social distancing measures at schools and workplaces, and lockdown of communities also should be measured and evaluated to understand further the visualized difference among all the states in the United States.
Conclusion
In this research, we have developed multiple innovative algorithms and a software platform for interactive, multi-parameter, high-dimensional pandemic data visualization and temporal synchronization. These advancements offer significant advantages over traditional methods for processing and displaying multidimensional data. We have introduced data rendering and visual analytics tools to display and evaluate multi-parameter epidemiological data, helping users understand pandemic transmission patterns and their interactions with vaccination from multiple perspectives. The developed software platform enables epidemiologists and decision-makers to uncover hidden information about the infectious disease caused by the SARS-CoV-2 virus, such as pandemic behavior and transmission trends, and to correlate these findings with results obtained through machine learning algorithms. 48 While our focus has been on exploring and analyzing coronavirus disease, vaccination, and demographic data, these innovative algorithms have broader applications in general data visualization, inspection, and uncovering hidden insights.
This research aims to develop dynamic visualizations in various dimensions that consider coronavirus disease and vaccination data. We have developed new algorithms and a web-based software platform to address the lack of publications on connecting and synchronizing pandemic data acquired from various sources on one web page to compare and analyze multiple parameters. Our platform dynamically displays multi-source pandemic data and extracts information such as coronavirus disease rate, number of people vaccinated, vaccinations distributed, percentage of mortality, vaccination distributions among various age groups, case and fatality ratio, booster usage, and their relationships with virus transmission rates over the past 2 years.
Using SVG (Scalable Vector Graphics) elements with D3 (Data-Driven Documents) as JavaScript extensions, we have designed a novel representation-transparent approach for web-based data visualization. Our platform can interactively adjust time points and map multi-source information with various parameters. Using HTML select elements, the choropleth map, bar chart, colored bubble plot, and connected scatterplot render multi-parameter pandemic data on a web page. The platform includes a time slider and tooltip elements to display extracted vital information over time, allowing multi-dimensional variables to be examined without needing to change the code and reload the visualization. Once the graphs and charts are generated, various collective instances of the visualization can be compared to identify hidden patterns from the multi-parameter pandemic data visually. When the system is used on a large scale, we will also consider sustainable and green computing technologies, such as virtualization and cloud computing.
There are some limitations in this research study, such as the data being collected only in the range of <3 years and at the state level. Based on the limited data this paper uses, reaching comprehensive conclusions in the long run will be challenging. Additionally, some information is missing in the data collected, necessitating the use of filters to delete these incomplete records to maintain the integrity of the data items for visualization and analysis.
In the next phase of this research, we will design deep learning algorithms for information extraction and analysis. We also plan to collect more comprehensive data spanning over 3 years and at finer levels of granularity, such as the county level, while incorporating additional parameters. This includes gathering data on socio-economic factors to formulate and test causal hypotheses, linking these factors with vaccination progress and pandemic trends. Additionally, we will interview healthcare professionals to gather their feedback on using our algorithms and how our platform can enhance their understanding of the pandemic. This feedback will help us refine the platform to develop more effective solutions for controlling coronavirus transmission and better meet real-world medical requirements.
Footnotes
Funding
The author(s) disclosed receipt of the following financial support for the research, authorship, and/or publication of this article: This work was supported by the Illinois State University, including the Research Grant, the Travel Funding of the School of Information Technology, the University Research Grant, the Publication Incentive Program of the College of Arts and Sciences, and the University Publication Support Program.