
Abstract
Guidance in visual analytics aims to support users in accomplishing their analytical goals and generating insights. Different approaches for guidance are widely adopted in many tools and frameworks for various purposes – from helping to focus on relevant data subspaces to selecting suitable visualization techniques. With each of these different purposes come specific considerations on how to provide the needed guidance. In this paper, we propose a generic method for making these considerations by framing the guidance problem as a decision problem and applying decision making theory and models toward its solution. This method passes through three stages: (1) identifying decision points; (2) deriving and evaluating alternatives; (3) visualizing the resulting alternatives to support users in comparing them and making their choice. Our method is realized as a set of practical worksheets and illustrated by applying it to a use case of providing guidance among different clustering methods. Finally, we compare our method with existing guidance frameworks to relate and delineate the respective goals and contributions of each.
Introduction
Guidance in visual analytics (VA) has received increasing attention in recent years. Defined as “a computer-assisted process that aims to actively resolve a knowledge gap encountered by users during an interactive VA session,” 1 guidance aids users in producing analytic results, generating new insights, and eventually building new knowledge. 2
Despite being a concept recently introduced to VA, the practice of using different forms of guidance to support users’ analysis processes has been widely adopted in many VA systems – from data 3 and visualization exploration4,5 to model building 6 and reasoning. 7 The wide and diverse usage of guidance validates the usefulness of the concept and provides a solid foundation for research on guidance mechanisms. With a clear characterization and a broad range of applications, recent research extends guidance beyond resolving knowledge gaps, 8 discusses when guidance should be used, 9 and lists the considerations to be made when designing guidance. 2 However, a generic guidance method for designing and providing guidance across its various applications and goals is still missing.
Facing this challenge, the main contribution of this paper is a step-by-step process to derive the practical “how” of providing guidance. To this end, we reformulate the guidance problem as a decision making problem and apply decision support models toward its solution. Our method passes through the following three stages:
Stage 1 identifies the decision points in VA processes where guidance is needed regarding the data, algorithms, visualizations, and reasoning.
Stage 2 utilizes multiple criteria decision analysis (MCDA) 10 to evaluate the alternatives to choose from in these decision points in order to generate guidance.
Stage 3 uses composite visualizations of multiple alternatives for inspecting and comparing the resulting alternatives to guide the users in their decisions.
In addition to its application-agnostic coverage of process, goals, and conceptual levels, there are various benefits of utilizing this method to provide guidance. From the perspective of designing VA systems, our method allows for quickly realizing and testing if and how guidance might work for the system. Once realized, it can also be more easily adapted and re-used in other systems. Finally, any scoring or ranking metric can be directly included as a criterion in MCDA models, making it backwards compatible to existing guidance methods as well as to a wide range of utility and quality measures for data, algorithms, and visualizations. From the perspective of using VA systems, our MCDA-based guidance exposes the criteria and their weights to the users, which makes the generated guidance more explainable. It further allows for adjusting these weights to user- and scenario-specific needs, making the provided guidance flexible and adaptive. Finally, framing and presenting guidance consistently through criteria and weights provides for a uniform guidance experience across domains and applications.
Background and motivation
To explain the rationale behind our guidance method, we present the research background and motivate the reasoning behind our method from three perspectives: guidance for resolving knowledge gaps, generic guidance beyond knowledge gaps, and guidance through decision support.
Guidance for resolving knowledge gaps
Framed around the concept of knowledge gaps, guidance supports users in their VA processes to overcome hurdles and successfully proceed in their analyses. In the following, we present the research on VA guidance from this perspective and provide our motivation for a generic guidance method that goes beyond knowledge gaps.
Background
Formally characterized in VA by Ceneda et al. guidance is usually framed around resolving knowledge gaps encountered by users in VA processes. 1 These knowledge gaps can be of different types, either target-unknown, where the optimal solution of a VA problem is unclear (I-know-it-when-I-see-it), or path-unknown, where the sequence of actions to reach a known target is unclear. Guidance can also be of varying degrees, ranging among orienting, directing, and prescribing; and lie in different domains, from data and tasks to VA methods and knowledge management. 1 Further research has brought forth some considerations and tools for designing guidance. A decision tree was proposed for deciding if guidance is needed and to what degree. 9 Five key requirements for effective guidance were established – namely for guidance to be available, trustworthy, adaptive, controllable, and non-disruptive. 2
The conceptual space covers a wide range of approaches that have proven useful in assisting users to resolve their knowledge gaps. 11 These approaches come in various guidance degrees and guide users in different domains. Orienting users toward regions in view space, Gladisch et al. provide visual cues pointing to where potentially interesting data points lie based on a degree-of-interest function. 12 Orienting users toward different levels of granularity in the data, Luboschik et al. provide heterogeneity-based guidance that indicates hidden details at higher levels of granularity and thus guides users to zoom-in for a closer inspection. 13 Directing users in carrying out their analytic tasks, Streit et al.’s Stack’n’Flip approach provides a guided view of the user’s analytic workflow and offers subsequent analysis steps to be taken. 7 Orienting and directing users among VA methods, Müller et al.’s Morpheus guides users through multiple parameters to choose the best ones for subspace clustering. 6 Directing and in part prescribing user actions in the space of generated knowledge and insights, the Nugget Management System from Yang et al. suggests and refines valuable information (nuggets) based on user interest. 14
Motivation
The outlined research provides high-level guidelines regarding guidance design principles as well as context-dependent examples of how to guide users in VA. However, for VA designers to effectively employ the concept of guidance, a concrete method to produce guidance from end to end – that is, from the specification of the guidance problem through requirements all the way to generating and presenting guidance to the end user – that is independent of the guidance domain or scenario is still lacking. Specifically – How to systematically identify the points where guidance is needed? How to compute and generate guidance with a unified underlying mechanism? How to present and adapt guidance according to the context? These questions motivate our guidance method that can be used in various guidance scenarios.
Generic guidance beyond knowledge gaps
The utility of guidance goes far beyond knowledge gaps. In the following, we present related research in guidance supporting this perspective and motivating a guidance design framework that caters to a variety of guidance aims including, but not limited to knowledge gaps.
Background
Collins et al. aptly observed that the goal of guidance can go beyond resolving knowledge gaps, including to inform, to mitigate bias, to reduce cognitive load, for training, for engagement, and to verify conclusions. 8
Indeed, when VA experts have sufficient knowledge to conduct their analyses, guidance can nevertheless support them by providing important meta-information, keeping track of their analyses, and making suggestions to reduce their cognitive load and improve their efficiency.4,15,16 Furthermore, no matter how knowledgeable a VA expert is, they might still be subject to various cognitive biases in their analyses – especially subconscious ones 17 – and guidance can also help to combat these biases through revealing them and providing suggestions when indicators for bias are detected. 18 Other research has also discussed guidance goals, such as attention management by guiding users to views that are currently important, 19 supporting user learning and training with onboarding guidance that walks users through visualization elements, 20 engaging users by prompting them when they are inactive, 21 as well as aiding the verification of analyses through monitoring of analytical hypotheses. 15
Motivation
To provide a generic guidance method that is applicable to a wide range of guidance goals, we need to base it on a concept that also includes the additional goals of guidance beyond resolving knowledge gaps, such as to reduce cognitive load, to mitigate bias, and to verify conclusions. However, critical challenges lie in not only finding such concept and establishing its connections with guidance, but also integrating its existing theories as well as applications with guidance in order to practically build our guidance method.
Guidance through decision support
To yield the missing end-to-end guidance framework that is inclusive of the extended set of guidance goals, a new perspective on user guidance in VA is needed. This is where decision making theory in general and decision support in particular come into the picture. In the following, we present related work in decision support, and motivate our method for using decision support to design and provide guidance.
Background
A large body of decision support research has focused on a similar set of goals as the one that Collins et al. proposed for guidance. These include, for example, to provide important information relevant for the decisions, 22 to reduce errors and mitigate various biases, 23 and to alleviate mental workload when the decisions are complex. 24
Research on Decision Support Systems (DSS) provides us with useful tools to realize a generic guidance method. Decisional guidance has been conceptualized in previous DSS research with when and why to provide deliberate decisional guidance, how to build it into DSS, and what consequences it might bring. 25 To practically relate guidance in DSS to guidance in VA, the Handbook on Decision Support Systems provides a useful overview. 26 Its chapter on DSS architectures and types summarizes the four basic components of a DSS, including language (input), presentation (output), knowledge (database), and problem-processing (model) (sub-)systems. Relating these components to the goals of guidance, the knowledge components contain important information to inform users and store expertise that reduces their cognitive load 27 ; the problem-processing components structure and model users’ decision making processes, helping users to combat their biases, and ease their cognitive effort 23 ; the language and presentation components also aid users’ mental work, while promoting users to be engaged in the decision making processes through interactions. 28
Among these four components, those focusing on problem-processing are particularly relevant to guidance generation, as they provide a mechanism to analyze decisions and generate evaluations of alternatives, which is essentially what guidance does. Multiple criteria decision analysis (MCDA) is a commonly used approach for problem-processing. 10 It takes multiple quantifiable metrics as evaluation criteria and evaluates alternative decisions based on these criteria. As the underlying criteria can be easily exposed to and manipulated by users, MCDA methods allow for communicating and potentially even changing the mechanism providing the guidance.
Research also exists on combining VA and MCDA. To orient decision makers among the multiple alternatives and criteria, visualizations are commonly used as a part of the presentation component in MCDA-based decision methods.29,30 MCDA models have also been integrated with geographical information systems (GIS) to support spatial decision-making through encoding the metrics and results of MCDA models in geographic visualizations.31,32 Particularly, Jankowski discussed the architecture and implementation of GIS and MCDA through either loosely coupling them with file exchange module or tightly integrating the two with a shared user interface and database. 31
Motivation
The similar sets of goals of DSSs and guidance make DSSs a suitable method to provide guidance in support of any decision making problem – be it which data to look at, which algorithm to choose, or in which direction to pan. Particularly MCDA methods are promising in this regard. However, the critical challenge still lies in how exactly to map the decision support research to specific steps for constructing a generic yet practical guidance method. This is where our work contributes by connecting research in decision support and VA to build a generic method for guidance design with concrete steps to follow.
Overview of the method
This section gives an overview of our guidance method through decision support. We first conceptualize guidance as a decision making problem, before structuring our method based on the decision making process.
Guidance as supporting decision points
When observing situations in VA in which guidance is needed, it is noticeable that users are often faced with making decisions among multiple alternatives. These can be decisions regarding a particular analysis target to pursue – for example: Which data (sub)set to zoom into? What aspects of the data to inspect – outliers, clusters, trends? Which keywords to search for? It can also be decisions on the particular analysis path that gets the user to a desired target – for example: What algorithms and parameters to choose to yield the envisioned clustering? Which direction to pan to reach a sought data region? What visual encoding to use to bring out best the patterns in the data? These decisions are inherent in VA: if no human decisions were required, then the analyses could be fully automated and neither a human user in the loop, nor guidance would be needed. Therefore, we can see the existence of “decision points” as a prerequisite for needing guidance. Knowledge gaps can then be seen as a common issue, among many others, that might arise at these decision points – when users lack the knowledge to make their decisions in the analysis, guidance can provide it.
This perspective of an analysis workflow as a series of decisions among multiple analytic alternatives is echoed in recent research by Liu et al.33,34 They studied how researchers experiment with different paths when analyzing data and identified the points where these alternative paths fork as “decision points.” Their work provides a fundamental understanding of what constitutes decision points in analytical work and how analysts reason in their decisions. However, how to support decisions with guidance is an open question. In addressing this question by connecting decision support systems with guidance, we provide a novel and tangible path for guiding users.
The concept of decision points also covers the realm beyond knowledge gaps. At decision points, the users’ preconceptions might lead them to choose certain analytical paths to confirm their hypotheses (confirmation bias), where guidance can suggest alternative solutions and mitigate such biases; or particular analytical decisions might be cognitively complex and demanding, where guidance can facilitate them among the space of alternatives and reduce the cognitive load. Therefore, decision points are a fitting concept to capture situations for which guidance is needed and can be provided through decision support.
In short, we extend the guidance concept to decision points and re-frame guidance as providing users with decision support when they are faced with decision points in VA.
Structure of the guidance method
Our method for designing and providing guidance is based on this re-framing into a decision making/decision support problem, whose overall structure is outlined in this section.
We look at decision points in VA from each of the three stages of decision making processes proposed by Herbert Simon – intelligence, design, and choice. 35 Simon’s model has been widely studied, including in the context of visualization tasks. 36 The intelligence stage refers to recognizing the conditions calling for decisions, the design stage refers to the development and evaluation of the alternatives, and the choice stage refers to choosing the desired alternative(s) based on the evaluation results. These three stages are visually presented in Figure 1.
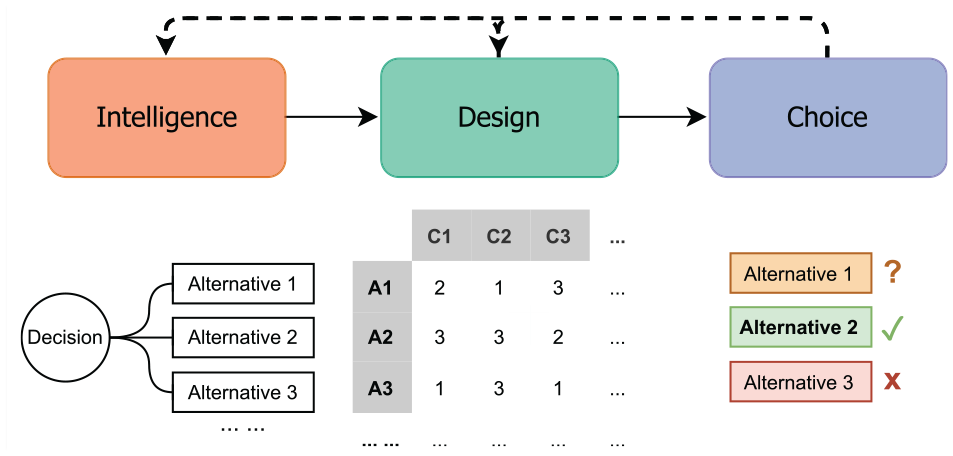
The three stages in decision making process by Simon 35 with illustrated explanations of the three stages.
The focus of our method in the intelligence stage is to detect and assess the decision points where guidance is needed. This stage starts with an inspection of the context in which the VA system is being used. This helps VA designers to systematically understand the conditions under which guidance might be needed. With the context recognized, we can then systematically identify the decision points calling for guidance. Finally, to evaluate if guidance is actually needed and prioritize these identified decision points, we assess the need for guidance at each decision point.
In the design stage, the focus is on constructing the mechanism for guidance generation through developing and evaluating the alternatives for each decision point that calls for guidance. Continuing with the assessment of decision points produced in the intelligence stage, we first aim to recognize the space of alternatives for each decision point by specifying the number of alternatives along with a list of examples to be evaluated. This allows VA designers to more tangibly consider how to evaluate and present these alternatives in the later steps. Thereafter, we discuss how evaluation criteria can be produced for the alternatives. Finally, to evaluate them, we introduce MCDA and how it can be applied and adapted to varying guidance degrees.
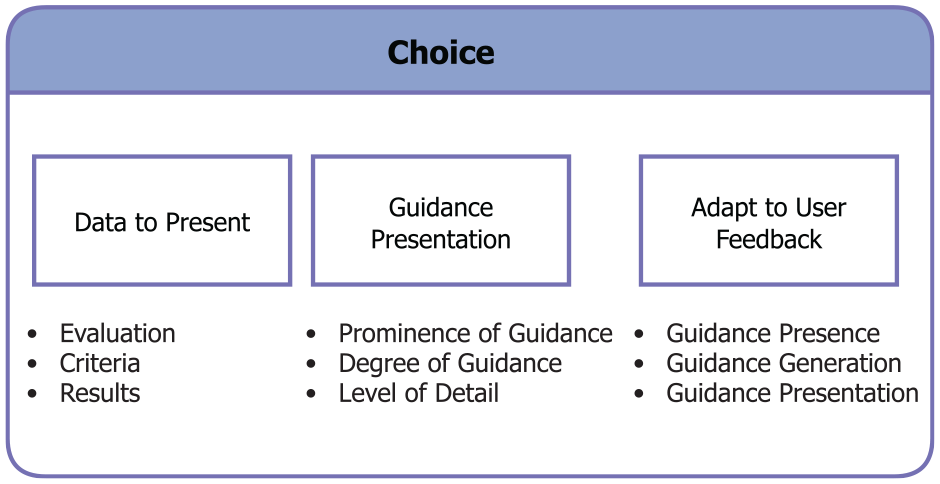
The main challenge at the choice stage of our guidance method is to present and adapt the guidance output for each decision point. The first step in this stage carries over the results from the design stage by recognizing what data to present in the guidance output. Combining this data with the corresponding guidance degree and number of alternatives, we then consider how to compose the presentation of alternatives in order to produce a guidance output suitable for the given guidance scenario. Finally, to allow the guidance to be adaptive and flexible, we inspect how to adjust the produced guidance in different contexts.
With the three stages described above, we have outlined our generic guidance method framed around decision points on an abstract level. The conceptual connections between the key concepts in the initial characterization of VA guidance and our method in are illustrated in Figure 2. In the next three sections, we further detail the concrete steps in each of these three stages.
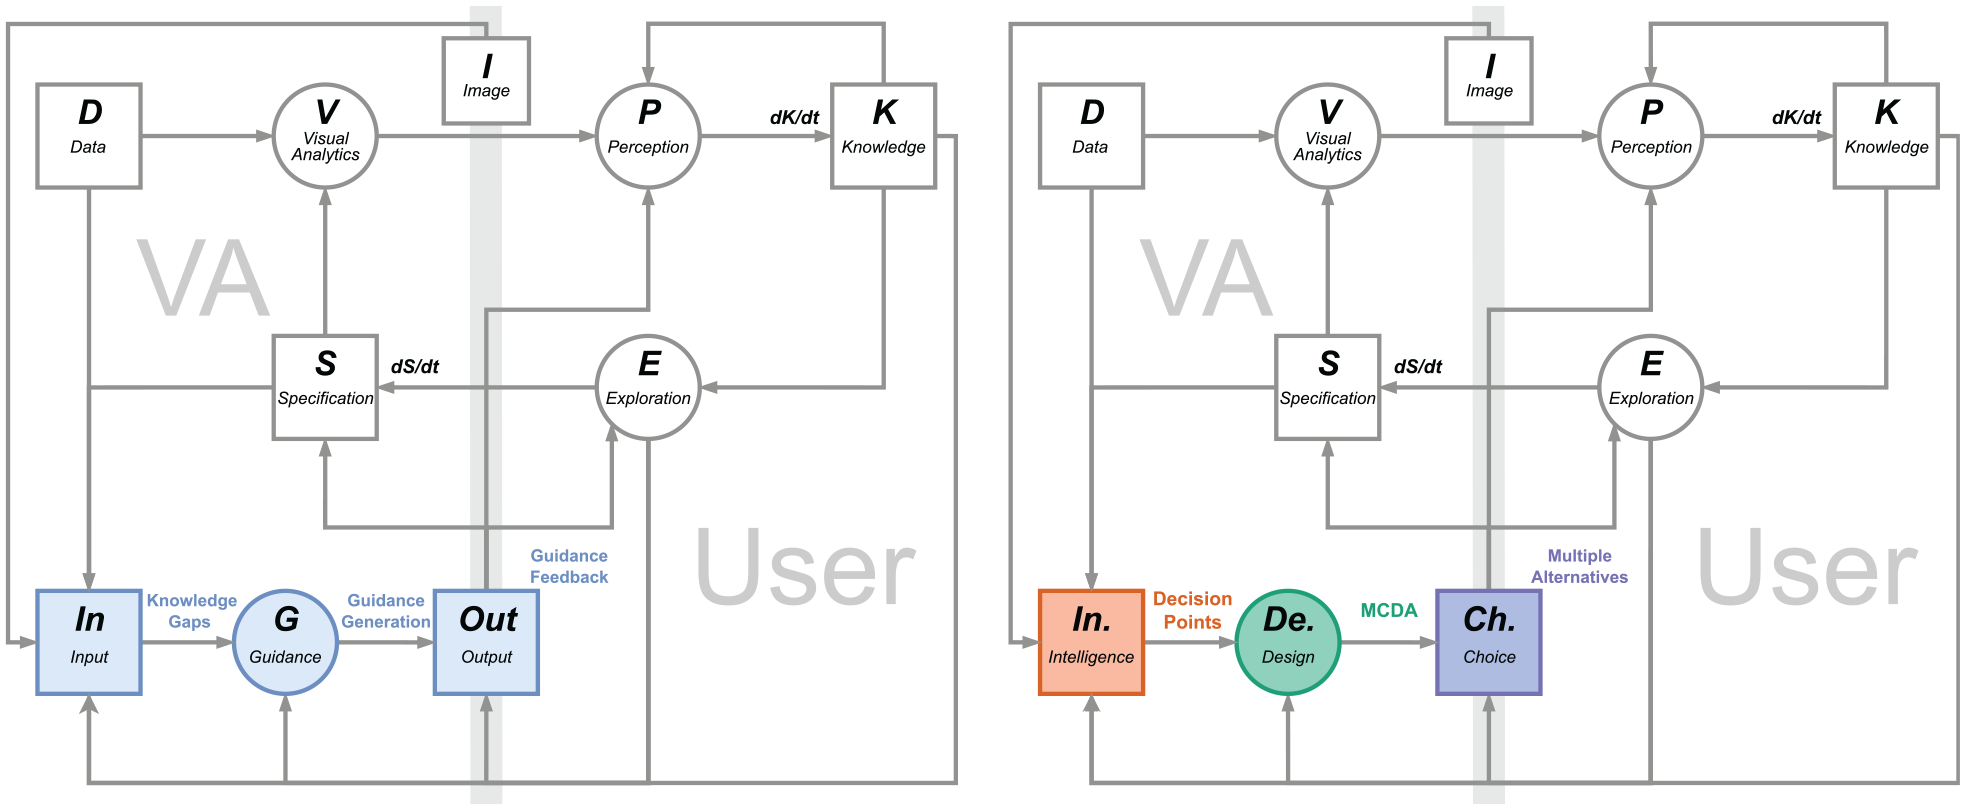
Adapting the guidance model by Ceneda et al.1,11 (left) to reflect the stages of decision making processes used in our method (right). For clarity, we subsumed the components of “history” and “domain” together with “data” and “knowledge” as “input,” and the three guidance degrees as “output.” Similar to the model by Ceneda et al. 1 the blue elements indicate the guidance components. Consistent with the colors used for the three stages of decision making in this paper, the orange elements indicate the intelligence stage, the green elements indicate the design stage, and the purple elements indicate the choice stage.
It is worth noting that the following design process formulates a middle ground that we expect to be applicable to most, but not necessarily all guidance scenarios. The reason is that guidance can vary greatly in its complexity depending on its context. In a simple analytical process with well-established “best practices,” guidance can be provided through a manually authored workflow with alternative paths without designing an elaborate evaluation model. Whereas in complex analysis settings where the alternatives’ evaluation criteria are challenging to define or compute, our design process may have to be reiterated multiple times and the evaluation model may include more complex considerations than can be expressed by weights alone. Therefore, the following description should not be used dogmatically as a fixed end point of all design considerations, but flexibly as a starting point from which to tailor a sensible design process for a guidance problem at hand.
Stage 1: Intelligence – Decision points calling for guidance
From the perspective of guidance as decision support, it is vital to first recognize the decision points for which to provide guidance.
In the following, we illustrate the steps in this intelligence stage by first articulating the context of use, then identifying the decision points in such context, and finally assessing the need for support in each of the decision points in order to prioritize them when implementing guidance. These three steps are listed in Figure 3.
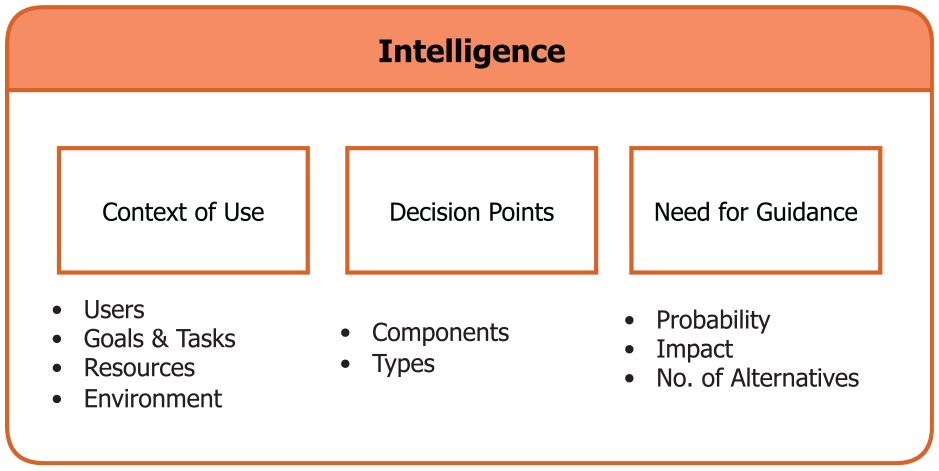
The steps in the Intelligence stage and the corresponding factors considered in each step.
Step 1.1 – Analyze the context of use
What
The context of use captures the conditions under which a product is used. Analyzing the context of use of a VA tool provides important information for devising effective guidance in later steps. For example, the offered guidance may differ depending on whether a VA tool is being used within or outside of its intended context of use.
Why
Context of use analysis is a prerequisite for designers to understand when, where, how, and by whom a system is being used to provide good usability. 37 This is also true for VA systems for which the context of use gives rise to the “conditions calling for decisions” 35 – that is, the concrete situations in which guidance is needed. A thorough context of use analysis helps VA designers to more concretely identify the decision point (Step 1.2) and assess them (Step 1.3), as well as to build adaptive guidance generation (Stage 2) and presentation (Stage 3) grounded in knowledge about users, goals & tasks, resources, and environment.
How
Context of use is an important concept in HCI that can be interpreted from various perspectives. 38 Hence, the following considerations taken from Common Industry Format (CIF) for context of use descriptions (ISO/IEC 25063:2014) provide a least common denominator as a starting point for analyzing contexts of use, 39 but they should by all means be extended by additional, possibly domain-dependent considerations if these help to further pinpoint usage scenarios in which guidance may be needed.
•
•
•
•
Notably, context of use is often dynamic and subject to change according to the purpose of the system and the progress of development. Especially at an early stage of the system development, designers might not be able to articulate all the factors. Thus, the context of use analysis should be an iterative process and adapt to different usages.
Step 1.2 – Enumerate the decision points
What
Having established the context of use, we now enumerate the decision points within this context where multiple alternatives exist among which a user must choose.
Why
Decision points are essential for generating guidance (Stage 2) and presenting guidance (Stage 3), as these indicate where guidance may be needed. This step generates an overview of the various decisions users are facing in a VA tool without yet prioritizing among them, to ensure that decision points are not overlooked.
How
In the early stages of developing a VA solution, designers might not have direct access to users yet. In this case, decision points can be listed through a cognitive walk-through. At later design stages, decision points can be enumerated by involving users through interviews and contextual inquiries, possibly following structured protocols to assess challenging situations. 42 In both cases, designers need to closely inspect each component in a VA tool in order to comprehensively recognize the decision points.
To do so in a structured way, we propose the use of suitable task taxonomies for VA. This makes sense, as fundamentally any task carried out by the user involves a decision – for example, Should I rather filter or sample the data to reduce it? Should I zoom-in here or there to see interesting details? If there was no decision to be made, the user would not have to carry out the task as the system could proceed by itself.
While many taxonomies exist for visualization tasks,
43
the literature is more sparse on VA tasks. After considering the taxonomies by Gotz and Zhou
16
and Heer and Shneiderman,
44
we settled on von Landesberger et al.’s taxonomy of VA interactions for its universality, high level of abstraction, and inclusion of analytic reasoning.
45
In particular, the reasoning component captures the implicit decisions of what the analytical focus is and how to carry it out, which might change along the course of the analysis. The inclusion of reasoning component helps to consider these unexpected and less defined tasks that often occur in exploratory analytical processes. Slightly adapted to the context of decision making in VA, it breaks down into
• Tasks relating to the
• Tasks relating to the
• Tasks relating to the
• Tasks relating to the
• Decisions on the
• Decisions on the
Step 1.3 – Assess the need for guidance
What
To help VA designers to assess decision points that would benefit from guidance and prioritize them accordingly in the development process, we outline an assessment of the need for guidance among the decision points.
Why
Existing research on guidance emphasizes providing the right guidance at the right time and making sure the guidance is non-intrusive.2,8 Hence, it is important to assess the need for support in each of the decision points to avoid providing unnecessary guidance that may distract from the analysis or even disrupt the analysis flow instead of enabling it. Furthermore, there can be a large number of possible decision points in a VA system, and to provide guidance for all of them can be an arduous task. Therefore, the decision points need to be prioritized to create clear priorities for the guidance generation (Stage 2) and presentation (Stage 3).
How
The need for guidance at the decision points is influenced by many contextual factors. Hence, such assessment is ideally done together with the end users to ensure that it reflects the real-life experience of users through qualitative methods such as interviews or workshops as well as quantitative ones like surveys or user performance. Previous studies in guidance also indicate the potentials of usage logs from user interactions for inferring the need for guidance. 8 Without direct access to user information or logs, a cognitive walk-through or an internal expert review can be conducted to assess the need for support.47,48
We formalize this process through an adapted version of risk assessment, which identifies and assesses potential risks at each decision point by quantifying the probability and impact of getting the corresponding analytic decisions “wrong.” 49 Seeing guidance as a support mechanism to mitigate the potential risks at each decision point, we utilize a risk assessment scheme to evaluate the need for guidance.
• The
• The
• Evaluating the
After analyzing these factors, they can then be combined to produce the decision points inventory with a priority ranking. In risk assessment, the factors are usually rated on a quantitative scale, multiplied together, and combined in the form of a risk assessment matrix or a risk inventory. 49
Stage 2. Design – MCDA to generate guidance
After identifying the decision points and assessing their respective need for guidance, we now specify the underlying mechanism that generates guidance for a decision point. To achieve this, we draw from the domain of decision support and propose to generate guidance through multiple criteria decision analysis (MCDA). MCDA integrates different criteria to evaluate the alternatives of decisions. 51 MCDA is a useful method for our goal of a generic mechanism to generate guidance, as any algorithm (e.g. heterogeneity-based guidance) or metric (e.g. degree-of-interest functions) can be easily incorporated in an MCDA model as criteria. 29
For this stage, VA designers need to go over each decision point in the previously produced inventory according to the priority ranking. Additionally, as some of the decision points might be interconnected – for example, choosing a clustering algorithm and choosing its settings are often jointly decided, as they form scheme and parameters of the same decision – the guidance generation of such interconnected decision points can also be developed in conjunction.
In the following, we first recognize the space of alternatives that guidance generation should consider, then describe how the corresponding evaluation criteria can be produced, and finally discuss how an MCDA-based evaluation model can be built using these criteria to generate guidance. These three steps are listed in Figure 4.
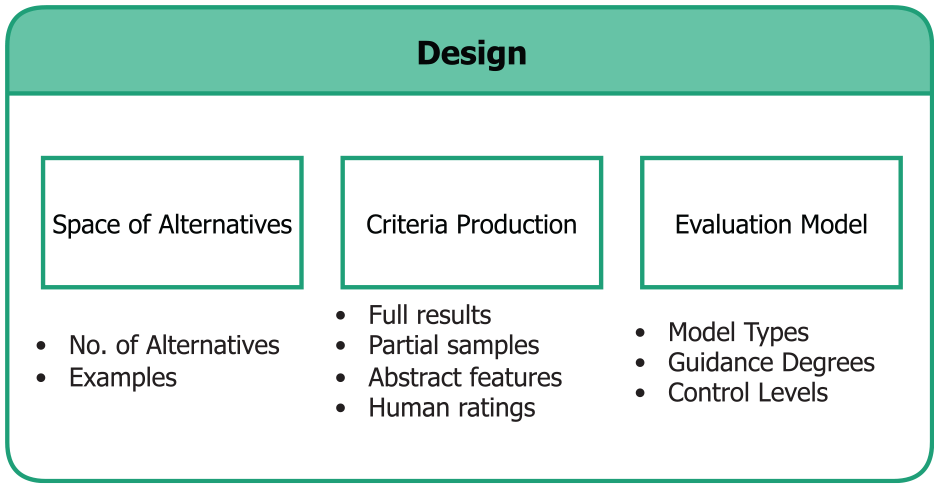
The steps in the Design stage and the corresponding factors considered in each step.
Step 2.1 – Recognize the space of alternatives
What
Although there might be a great number of available alternatives at each decision point, many of them may not be useful or possible to be considered. This step aims to recognize the space of alternatives that later feeds into the MCDA model in order to generate guidance.
Why
Recognizing the space of alternatives to be considered by guidance generation is essential for building the underlying mechanism that generates guidance. Specifically, the number of alternatives can influence how guidance should be generated and later presented in Stage 3. Moreover, recognizing some examples of the alternatives also helps VA designers to consider them in a more concrete manner and more easily identify the criteria to evaluate the alternatives.
How
To this end, we consider two elements that VA designers should inspect: the estimated number of alternatives and examples of alternatives. These two elements are considered under the constraints imposed by the identified context of use – users’ goals and tasks that govern how open they are to explore different alternatives; available resources such as the set of implemented algorithms or the time available for inspecting different alternatives before having to make a decision; and the environment such as the available user interfaces that influence how open-ended the exploration of alternatives is.
This step differs from the previous ones as we start to consider which of all the possible alternatives should feed into the MCDA model and be evaluated. Not all possible alternatives might be applicable or useful in a given context of use. And the subset of all those that are applicable may not be feasible to be evaluated due to time constraints or other limitations. And all those that are feasible to be evaluated may still be too many to then interactively inspect. For example, for a large multi-dimensional dataset, there can be almost infinite number of subsets to explore. Many processing algorithms also have numerous parameters that are continuous and need to be considered in conjunction. In these cases, corresponding sampling techniques can be used to produce a reasonable amount of alternatives under the limitations in the context of use, such as the computational and cognitive resources.52,53 Additionally, decision strategies that utilize heuristics to eliminate alternatives, such as Elimination by Aspects, can already be applied to narrow the space of alternatives. 54 To yield a clearer understanding of the practically relevant subspaces of alternatives, we look at the following:
•
•
Step 2.2 – Produce the criteria
What
The aim of this step is to produce the criteria to evaluate the alternatives for each decision point. These criteria will then later feed into an MCDA model and help to rank the alternatives and generate guidance.
Why
To evaluate the alternatives for a decision point, a way to judge them is needed. As we adopt MCDA models to calculate the overall evaluation from a set of input measures in Step 2.3, we need some form of quantifiable metric or quality measure to do so. It is also consequential for the subsequent presentation of guidance how these criteria are produced, as different methods to generate evaluation metrics may incur varying degrees of uncertainty.
How
To yield suitable evaluation criteria, we consider three kinds of measures based on the context of use and the number and types of the alternatives for the decision points.
• Measures
• Previews
• If the methods above are not applicable due to the limitations in the context of use, predictive metrics
• Finally, when the metrics cannot be quantitatively and automatically produced or when they are too uncertain and imprecise,
Suitable criteria are chosen based on the identified contexts of the analysis (e.g. available time to generate and evaluate alternatives) and the decision point in question (e.g. algorithmic decision vs visualization decision). To not only communicate the alternatives and their computed “goodness,” but also their trustworthiness, their uncertainty may also be established and shown as meta-data for each alternative’s rating.68,69 This is particularly important for criteria derived from partial or predicted results.
Step 2.3 – Construct the evaluation model
What
In this step, we combine the produced criteria for each decision point into an MCDA model to generate guidance.
Why
The evaluation model is an important element for generating guidance, as it forms the mechanism that produces the ranking among the alternatives that later enables guidance presentation (Stage 3). Here we consider how to build different evaluation models according to the varying degrees of guidance and user control, which allows the generated guidance to be adaptive and controllable.
How
MCDA methods come in various forms – Wątróbski et al. summarized 56 different MCDA methods and discussed how to choose the corresponding method to support different decisions. 10 Overall, there are three types of models when it comes to combining criteria in MCDA:
•
•
•
To use MCDA models for generating guidance, the construction of them heavily depends on how the guidance should be used. Here we present two factors to consider – degree of guidance and level of user control.
MCDA models can adapt to varying degrees of guidance:
• As
• For generating guidance,
•
Guidance can further be controlled explicitly or implicitly through user input. 8 Here we discuss how MCDA models can be constructed to allow different levels of user control, including presets with no user control, inferences with implicit control, and direct input with explicit control.
• To construct a basic MCDA model, the appropriate weights, value/utility functions, and decisions rules for the criteria can be
• Furthermore, MCDA methods can also be controlled through
• Experienced users who have abundant knowledge about these criteria and alternatives can also be exposed to the underlying evaluation mechanism and afforded with
Stage 3: Choice – Multiple alternative views for guidance output
After the alternatives have been evaluated, users need to closely inspect and compare them in the context of their own domain knowledge and make their choices. To this end, the generated guidance must be communicated to the users for them to interact with and provide feedback to.
In the following, we summarize the considerations in presenting guidance in ways that enable users to visually inspect, compare, and reason with these alternatives. While research has indicated a potential for providing guidance through other modalities than visual output (e.g. using vibrotactile feedback 77 ) these approaches are still experimental at this point and require special hardware. Therefore, we focus on the visual channel to communicate guidance in this work, as it currently stands as the main modality for guidance in VA. We first recognize what data regarding the alternatives to visualize. We then discuss how to compose the guidance presentation based on the previous considerations. Finally, we summarize how the provided guidance can be adapted to user interaction and feedback. These three steps are listed in Figure 5.
The steps in the Choice stage and the corresponding factors considered in each step.
Step 3.1 – Recognize the data to present
What
This step aims to specify what information/data about each alternative is relevant for users’ choices and should thus be presented.
Why
What data to present depends on the available results produced at Stage 2 and decides the content and level of detail with which to present each alternative in Step 3.2. Hence, this step connects the guidance generation stage with the following step of guidance presentation.
How
In the previous design stage, we have generated and evaluated the alternatives through MCDA. This process produces different types of data:
• The main output of the design stage is the
• The different
• Some of these evaluation criteria might have been produced from
Step 3.2 – Compose the presentation of alternatives
What
Having described which data to present for each alternative, we then need to visually compose that data in order to display the guidance. In this step, we outline how to compose views of multiple alternatives based on the considerations we have made in the previous steps.
Why
Visualizing for guidance differs from other visualization in its fundamental characteristics of presenting and aiding the decision among multiple alternatives, such as the different levels of details and varying guidance degrees. Therefore, we outline the considerations for composing such visualizations that adapt to various characteristics of the guidance scenario at hand.
How
To visually present and compare the alternatives for VA decisions, multiple presentations of these alternatives need to be composed in a unified view. Techniques that combine multiple visualizations have been widely studied and given different names, such as coordinated and multiple views,79,80 composite visualizations, 81 and visual comparison techniques. 82 However, to visualize for guidance, different data and numbers of alternatives need to be presented and varying guidance degrees call for dissimilar presentations. Therefore, additional considerations need to be made in terms of presenting multiple alternatives. Abstracted examples of the following considerations are illustrated in Figure 6.
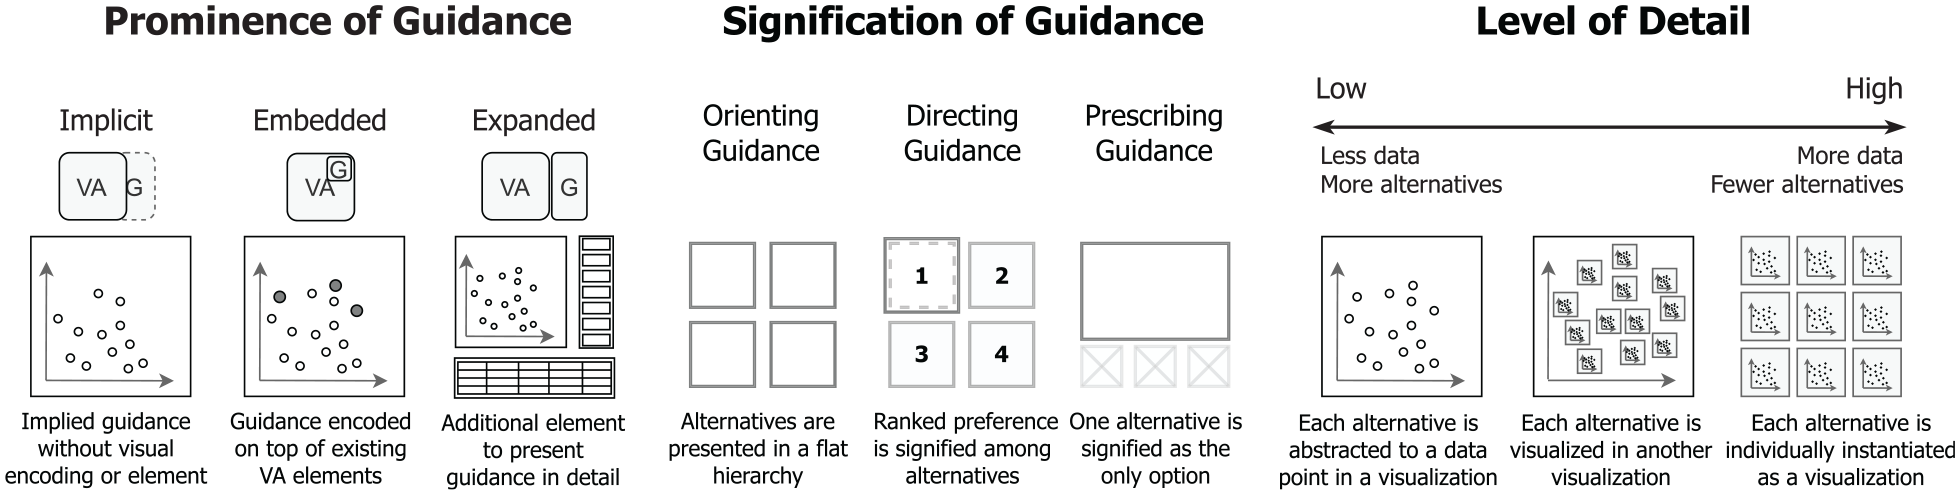
Abstracted illustrations of the guidance presentation according to varying prominence of guidance (VA – Visual Analytics, G – Guidance), signification of guidance, and level of detail.
The prominence of guidance refers to how visually noticeable the provided guidance is in comparison to the existing VA elements, which can range from being almost invisible and implied in the order of the options provided to users to a dedicated visualization of the options that is added to the existing VA system. Here we discuss the prominence of guidance by considering the visual relationship between guidance and the original VA system.
• With low prominence, guidance can be
• In existing techniques, guidance is most commonly
• With high prominence, guidance can be
To guide users through multiple alternatives, the signification of guidance can help to convey the relationships between alternatives and shift the focus to the important ones. For example, in Voyager, a “specified view” is put on top of other “related views,” signifying a higher relevance of the “specified view” to the context of use. 4 Here we discuss the signification of guidance through the three guidance degrees – orienting, directing, and prescribing.
• For
• For
• For
The level of detail of each alternative can be influenced by many factors. For example, the available screen size and mental resource in context of use limits the level of details of presented alternatives. A higher number of alternatives may also limit how detailed each alternative can be shown. And the preferred alternative in directing guidance or the suggested alternative in prescribing guidance may be shown in greater detail. In the following, we discuss which options we have to accommodate different levels of detail.
At the highest level of detail, the alternatives can be
When there are more alternatives, especially with some form of underlying relationships between them, their individual visualizations can be
At the lowest level of detail, each alternative can be
Additionally, these different levels of detail can also be combined to provide more adaptive and contextual guidance – the higher ranked or more important alternative(s) can be shown in greater detail with other alternatives abstracted into another visualization on the side, and more details about the abstracted alternatives can still be provided on demand when users hover over, zoom in, or select an alternative. In case the number of alternatives becomes too large to be shown at the desired level of detail, ensemble-based methods can be used to subsume multiple alternatives using a few representative exemplars. 91
Step 3.3 – Adapt to user feedback
What
In this final step, we consider how to adapt the provided guidance and its underlying MCDA model to user feedback to ensure the guidance is adaptive and controllable.
Why
The MCDA models in our guidance generation come with different means of criteria production and allow for different types of user input, enabling them to take user feedback into account. Using this possibility of adapting the guidance to the specific demands of data, task, and user fully enables the benefits of MCDA models.
How
As users interact with VA systems, many of their interactions can be recorded and analyzed as user feedback to adapt the provided guidance accordingly. To this end, the different components of guidance design must take into account the possibility of implicit (inferred) or explicit (input) user feedback. Making users aware of adaptations due to feedback is essential for them to make full use of the provided guidance – the occurrence and origin of an implicitly inferred adaptation should be communicated to users to avoid confusion, and the availability of direct control should likewise be signified.
Here we discuss three general perspectives on how guidance can be adapted to user feedback corresponding to the overall goals of the three stages of our method – considering whether or not guidance should be present as determined during the intelligence stage, the generation of guidance at the design stage, and the presentation of guidance at the choice stage.
To adapt the
Worksheets for applying the method
Passing through the intelligence, design, and choice stages, we have provided a step-by-step method to design guidance for decision making in VA. In doing so, our method establishes a unified, reusable, and widely compatible guidance mechanism that generates transparent, adaptive, and consistent user guidance.
To provide concrete means that allow VA designers to put our method into practice, we developed a set of guidance design worksheets to accompany our method. We chose the format of worksheets, as they are accessible, flexible to be edited for different contexts, and well-suited for generating ideas and pen-and-paper prototypes especially in early design stages. Design worksheets are also a common in many aspects of visualization, such as visualization design,92,93 teaching and learning, 94 and creative ideation. 95
To produce the worksheets, we went through a series of internal and external iterations to refine their design. In the beginning, we iterated on the worksheets three times internally. We started out by drafting the outline of each stage and step of our method on the worksheets. Then we went through a round of discussions that generated a list of improvements. After implementing them, we filled out the worksheets ourselves for a use case scenario of clustering analysis, and refined the worksheets based on this trial.
After the internal iterations, we went through a series of external iterations held in a workshop format. Three workshops were individually conducted with three experts and lasted around 90 min each. Two of the experts were VA researchers with experience in designing VA systems, and the third was a researcher in Data Visualization and Human-Computer Interaction. The workshops were semi-structured and consisted of three parts: introduction, method walk-through, and follow-up questions. We started the workshops with a short introduction to the overall concept and examples of guidance in VA, the structure of our proposed method, and a basic example of MCDA. In the method walk-through, we first asked participants to identify the context of a VA system that they designed or used. Thereafter, they were asked to identify the decision points that were relevant to the users’ workflows in the intelligence stage, develop a guidance generation mechanism for one important decision point in the design stage, and formulate the presentation of the alternatives in the choice stage. Finally, we ended the expert workshops with follow-up questions that we prepared and adapted with the observations from the method walk-through. In these questions, we focused on what could be improved in the worksheets and if the participants saw the benefits of using our method to formulate guidance.
Overall, the participants were all able to follow the steps in the worksheets, despite having some troubles articulating some of the key concepts. The two VA experts successfully identified a guidance problem in a VA system they previously designed and came up with a guidance solution with our worksheets, while the visualization expert was able to follow a set of pre-filled worksheets and provided some suggested improvements on the method and worksheets. In particular, they suggested to further clarify some of the key concepts in the method and emphasize the connections between the steps. Specifically, in the intelligence step, the meaning of the VA components –“data,”“algorithm,”“visualization,” and “reasoning,” as well as the types of knowledge gap –“which (scheme)” and “how (parameter)” can be challenging to delineate. We made revisions accordingly to produce our final worksheets. To clarify the key concepts, we added explanations to the worksheets. We emphasized the connections between the steps in the prompts to make the worksheets easier to follow.
The abstracted worksheets are shown in Figure 7. The detailed worksheets can be found at https://vis-au.github.io/guidance/.
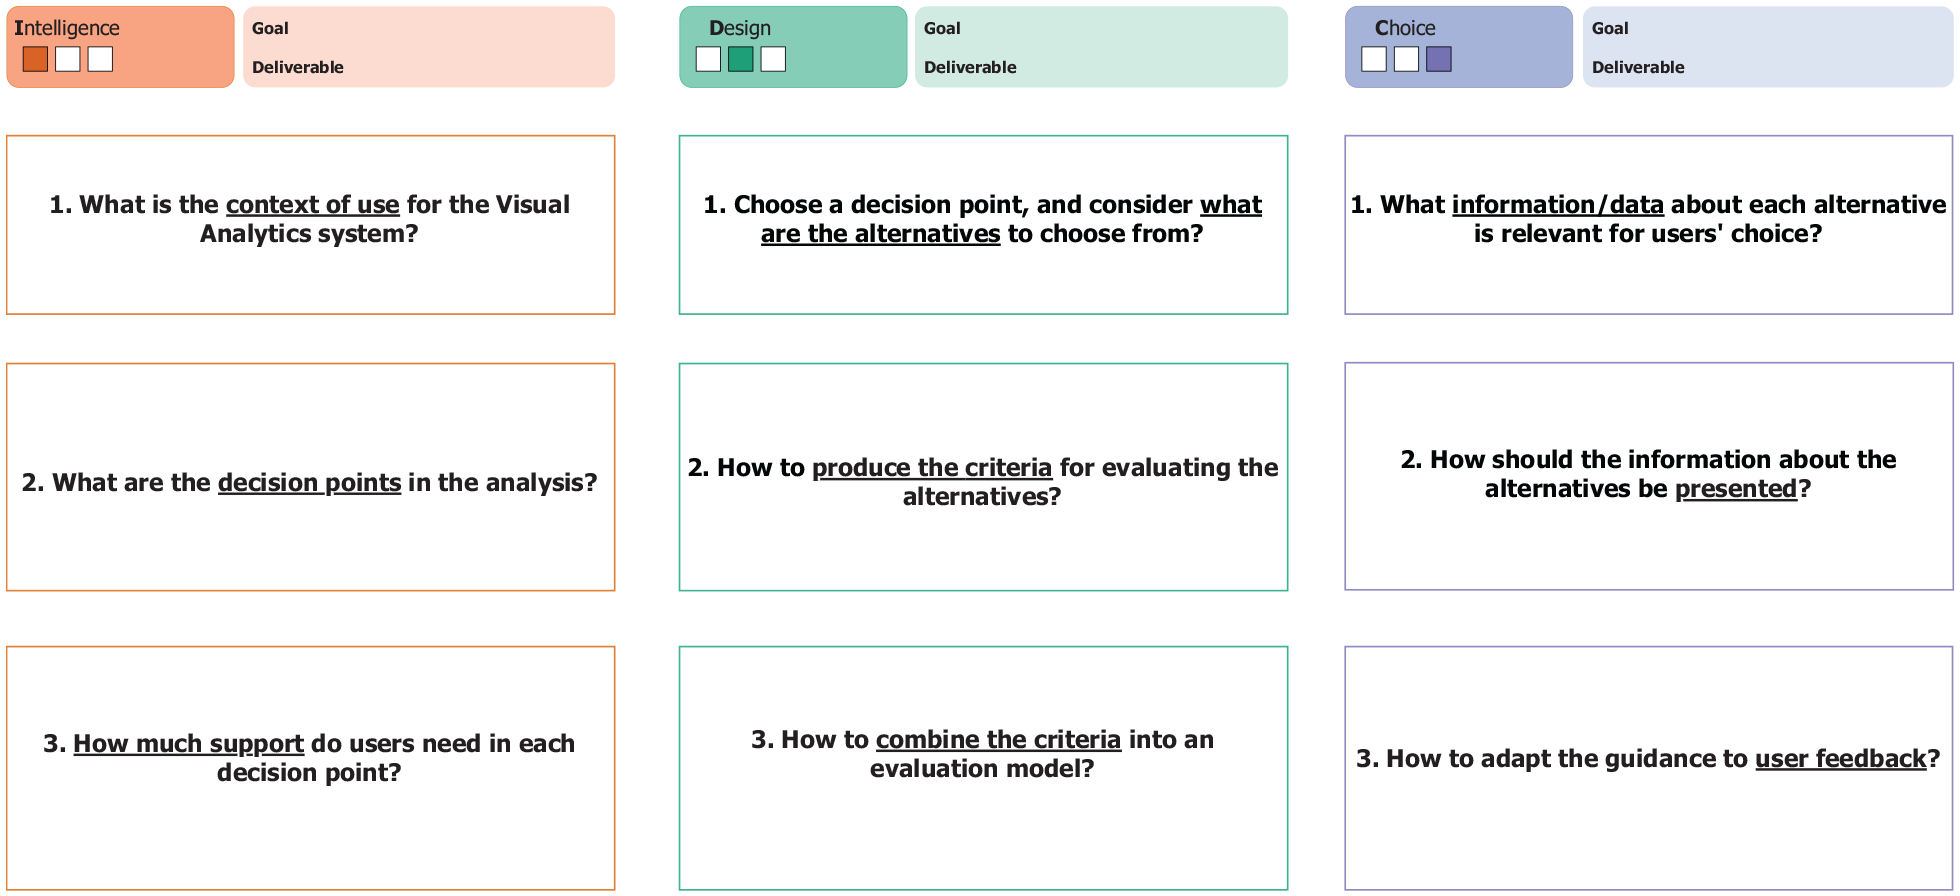
The abstracted worksheets accompanying our method correspond to its three stages, with three steps in each stage. Each worksheet consists of a title indicating the design progress, goal, and deliverable of the corresponding stage. For each step, the primary question to answer is presented with the keywords underlined. A prompt for each step outlines what the VA designers should achieve, and detailed instructions are provided to explain some of the key concepts.
Use case example and prototype
To provide a practical example, we present a use case based on our guidance method. To this end, we apply our worksheets on a scenario of cluster analysis and design an initial prototype through our method using existing visualizations and MCDA tools.
In the following, we describe how we apply each step in our guidance method in this use case, illustrate the developed prototype along the steps, and present the users’ workflow after implementing the guidance. A set of filled worksheets was completed along the process and can be found in the supplementary materials. For the prototype, we first drafted early iterations through pen-and-paper mockups and then implemented the prototype in Python. We utilized Bokeh for the visualizations, scikit-learn for the processing algorithms, and Scikit-Criteria for the MCDA methods. The prototype is available at https://vis-au.github.io/guidance/.
Stage 1 – Intelligence
We start our guidance design through a context of use analysis. The users in our context of use are epidemiologists who have domain knowledge about the diseases under study and knowledge about different VA methods. As the outcome of their analyses will inform future medical treatments and impact patients’ lives, they also tend to be less risk-taking in their decision making styles. Their goal is to explore and identify different types of patients for the same disease. To achieve such goal, the epidemiologists go through a series of tasks– they first clean the data and visualize them along some important features to first see if there are already some patterns in the patients. To further bring out these patterns, they then utilize dimension reduction and clustering algorithms to abstract the features and cluster the patients in different groups. During this process, they will need to experiment with different algorithms and parameters, then visually observe which set of results helps them to identify and determine the patient groups based on their expertise. As for resources, they often have limited manpower and computing power for a specific project before it proves promising. The environment that epidemiologists work in is usually a lab with desktop computers, where they can often be distracted with other ad-hoc tasks and experiments to run.
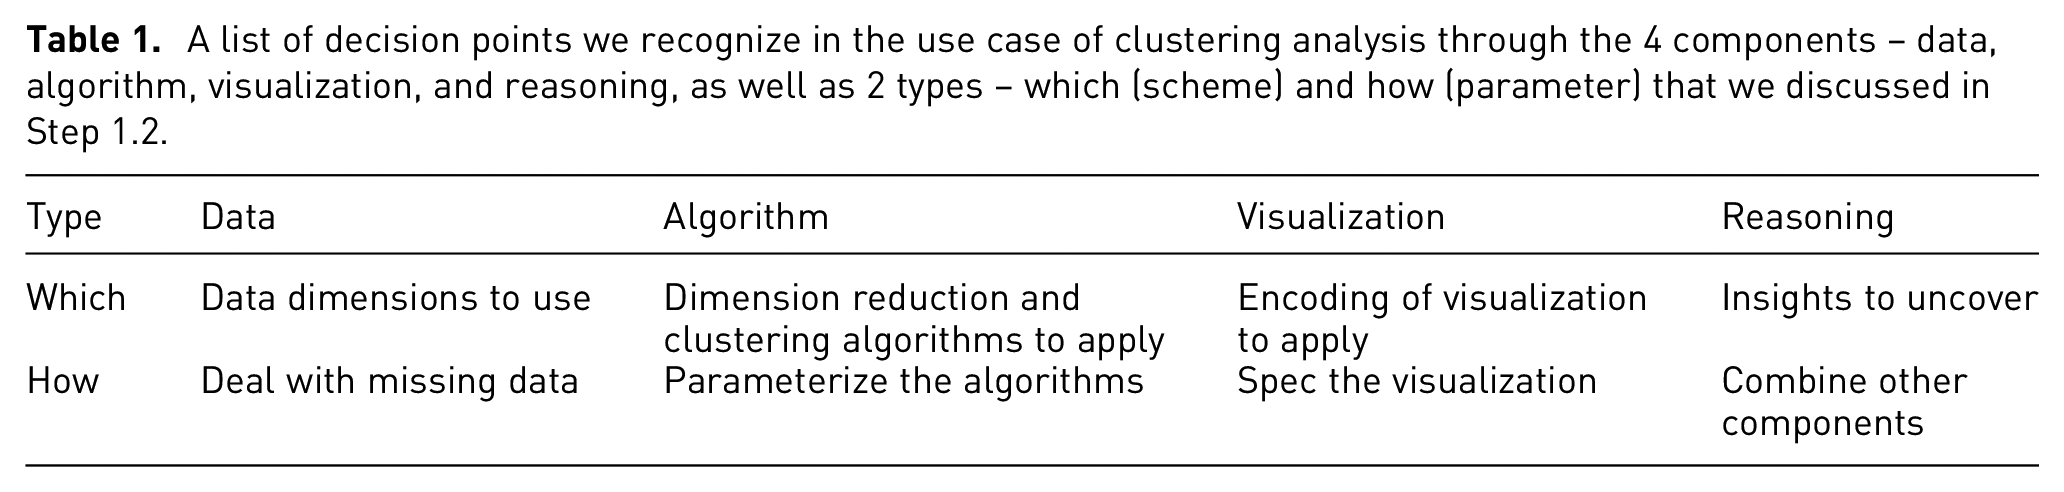
With the context analyzed, we then go through the four components of the users’ VA process in order to identify for which decision points guidance is needed. In the context of high-dimensional medical data, the epidemiologists would need to start with selecting the data dimensions to use and dealing with missing data that often appear in the medical context. With the data prepared, they then need to choose and parameterize the algorithms, such as dimension reduction and clustering, for grouping patients into different types. Finally, to uncover the patterns and insights from these computations, their results then need to be presented in visualizations with appropriate encodings and specifications to help epidemiologists visually observe these results and infuse their domain expertise. During these processes, the epidemiologists would also need to reason about how to combine the available data, algorithms, and visualizations together in order to uncover the insights they set off to seek. These reasoning decisions also govern exploratory analyses where the epidemiologists might go back and forth iteratively to try other alternatives, such as changing the included data dimensions after an initial exploration of the clustering results. The decision points are summarized in Table 1.
A list of decision points we recognize in the use case of clustering analysis through the 4 components – data, algorithm, visualization, and reasoning, as well as 2 types – which (scheme) and how (parameter) that we discussed in Step 1.2.
Based on the context and the identified decision points, we then assess these decision points according to the three factors of guidance need on a scale of 0–3 – with “0” to signify the factor as “not important at all” and 3 to signify the factor as “extremely important.” We multiply the factors and rank them from high to low to yield the final assessment (see Table 2). We chose to include 0 as the lowest point on the scale and to multiply the factors, as we consider if any factor in the assessment is 0 (not important at all), then there is no need for guidance at the corresponding decision point. For the data component, which data dimensions to use is a particularly important decision, as it directly impacts the final results of the analysis and some of the following decisions, such as which clustering algorithm can be used for the corresponding data types. For the algorithm component, different clustering algorithms and different numbers of clusters produce various stratifications of the patient cohort – each capturing a different property or insight into the disease. However, which clustering algorithms to explore and which sets of results are likely to contain reasonable stratifications are not known beforehand, and the epidemiologists would have to experiment with many of them to find the “needle in the haystack.” This is where guidance becomes particularly helpful to point them in the directions of the most promising clustering results and achieve their goals of identifying patient types. For the visualization component, clustering results (i.e. cluster membership of data items) are often encoded through colors in scatterplots, while the specifications can be more complex with different color palettes, sizes, and inclusion of other facilitating elements, such as centroids and convex hulls. Finally, as the goal of the analysis is clearly defined as finding different groups in patients, the reasoning decisions are less of a concern in this context of use.
Example inventory ranking the decision points’ need for guidance for the use case of clustering analysis.
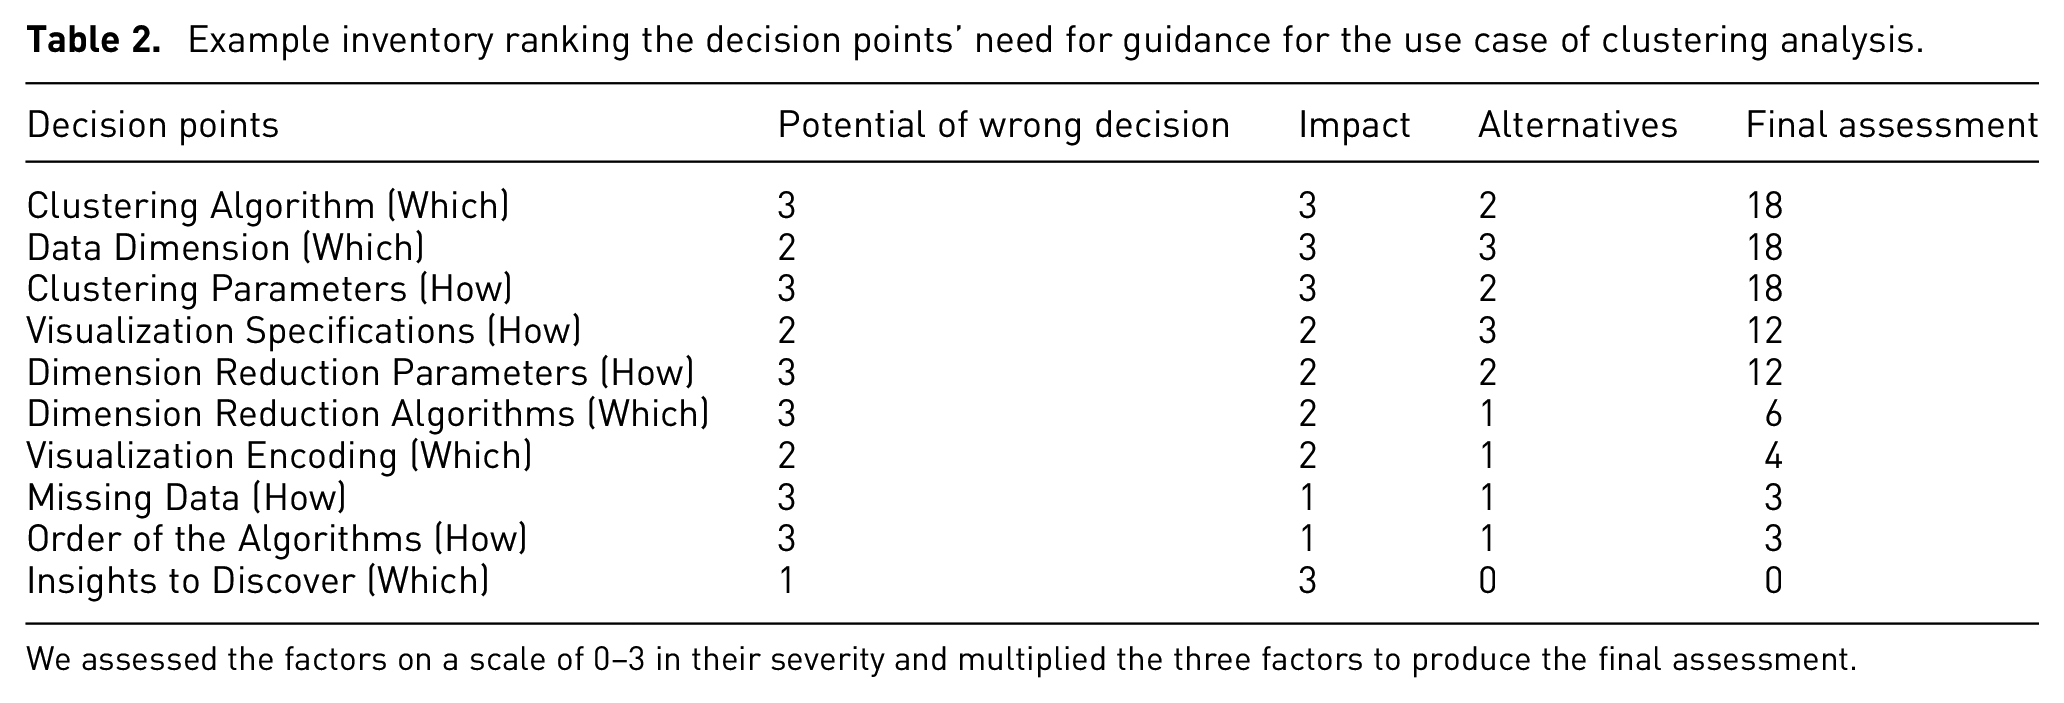
We assessed the factors on a scale of 0–3 in their severity and multiplied the three factors to produce the final assessment.
Stage 2 – Design
From the inventory of decision points, we have ranked the decision points and obtained the following three decision points with highest priority: clustering algorithms, parameters, and data dimensions. For the purpose of exemplifying our method, we focus on the two decision points of clustering algorithms and parameters, as these two decisions are interconnected and their guidance should be developed in conjunction.
The first step in this stage is to recognize the space of alternatives. The number of alternatives among the clustering algorithms is often not very large. For example, in the overview of clustering methods in the Machine Learning package for Python, scikit-learn, 11 algorithms are listed. 96 In our context of analyzing clusters of patients, the epidemiologists need to directly manipulate the number of clusters to explore the different resulting stratifications of the cohort of patients. Therefore, we focus on the 5 algorithms with “number of clusters” as an available parameter – K-Means, Spectral Clustering, Ward Hierarchical Clustering, Agglomerative Clustering, and BIRCH. In our context, there are often not many different types of patients for the same disease, so the range for the number of clusters is also limited. Therefore, we set the range for the number of clusters from 2 to 10.
To produce the criteria, the evaluation of clustering algorithms and parameters are often based on similar metrics. In our case, the extrinsic measures based on a ground truth of actual class labels are not available. Therefore, intrinsic measures such as Silhouette Coefficient, Davies-Bouldin Index, and Calinski-Harabasz Index can be used to evaluate the separation and consistency of the clustering results. 97 These measures need to be calculated based on actual clustering results, but clustering the full dataset can take too much time due to the limited computing power. Therefore, we produce these metrics with a small but representative sample of the full dataset, while users can also change the sample size according to their needs. As we run these different algorithms on the sampled data, we can also measure their runtime.
To construct the MCDA model, we then consider the degree of guidance and level of control. As the users in our context have some knowledge regarding the algorithms and would like to explore alternative results, we decide to apply primarily directing guidance with additional orienting guidance to help. To provide directing guidance, the aforementioned criteria then need to be combined and some form of preference or recommendation should be derived from the evaluation. We combined the multiple criteria with through weighted sums. The weights of each criterion were set based on our experiences in working with epidemiologists. Additionally, as the users in our context are able to understand the generated results and metrics, we then orient the users by presenting the clustering results and corresponding criteria from each algorithm and parameter. This helps to trace how the directing guidance was generated and orient users among the alternatives with detailed information. For allowing users to adapt the guidance to their specific needs, we present the underlying weights of each criterion and enable the users to manipulate the weights when they are not content with the provided guidance.
Stage 3 – Choice
To present the guidance, relevant data to be presented need to be recognized first. We present the produced results based on sampled data for each alternative, including the data points and their predicted class label. Furthermore, we present the meta-data including the evaluation criteria – specifically Silhouette Coefficient, Calinski-Harabasz Index, Davies-Bouldin Index, and runtime.
Next, we consider the degree of guidance and level of detail to produce the guidance presentation. For both of the decision points of clustering algorithms and parameters, we primarily apply directing guidance. Therefore, the preferences among the alternatives need to be signified accordingly. In the view of the produced results, we signify the ranking of the alternatives by highlighting the highest ranked one. Additionally, the evaluation table and figure of the algorithms and number of clusters also help to orient users among the alternatives by listing the alternatives and the evaluation results. For the level of detail, the number of alternatives for clustering algorithms is limited to the 5 algorithms that have “number of clusters” as a parameter. Therefore, they could all be presented in detail with the produced results and criteria. For the “number of clusters” parameter, we have 9 alternatives ranging from 2 to 10 clusters. We decide to visualize their evaluation results as a line chart on the side, where the users can hover over the data points to inspect the underlying criteria. The prototype with guidance is presented in Figure 8.
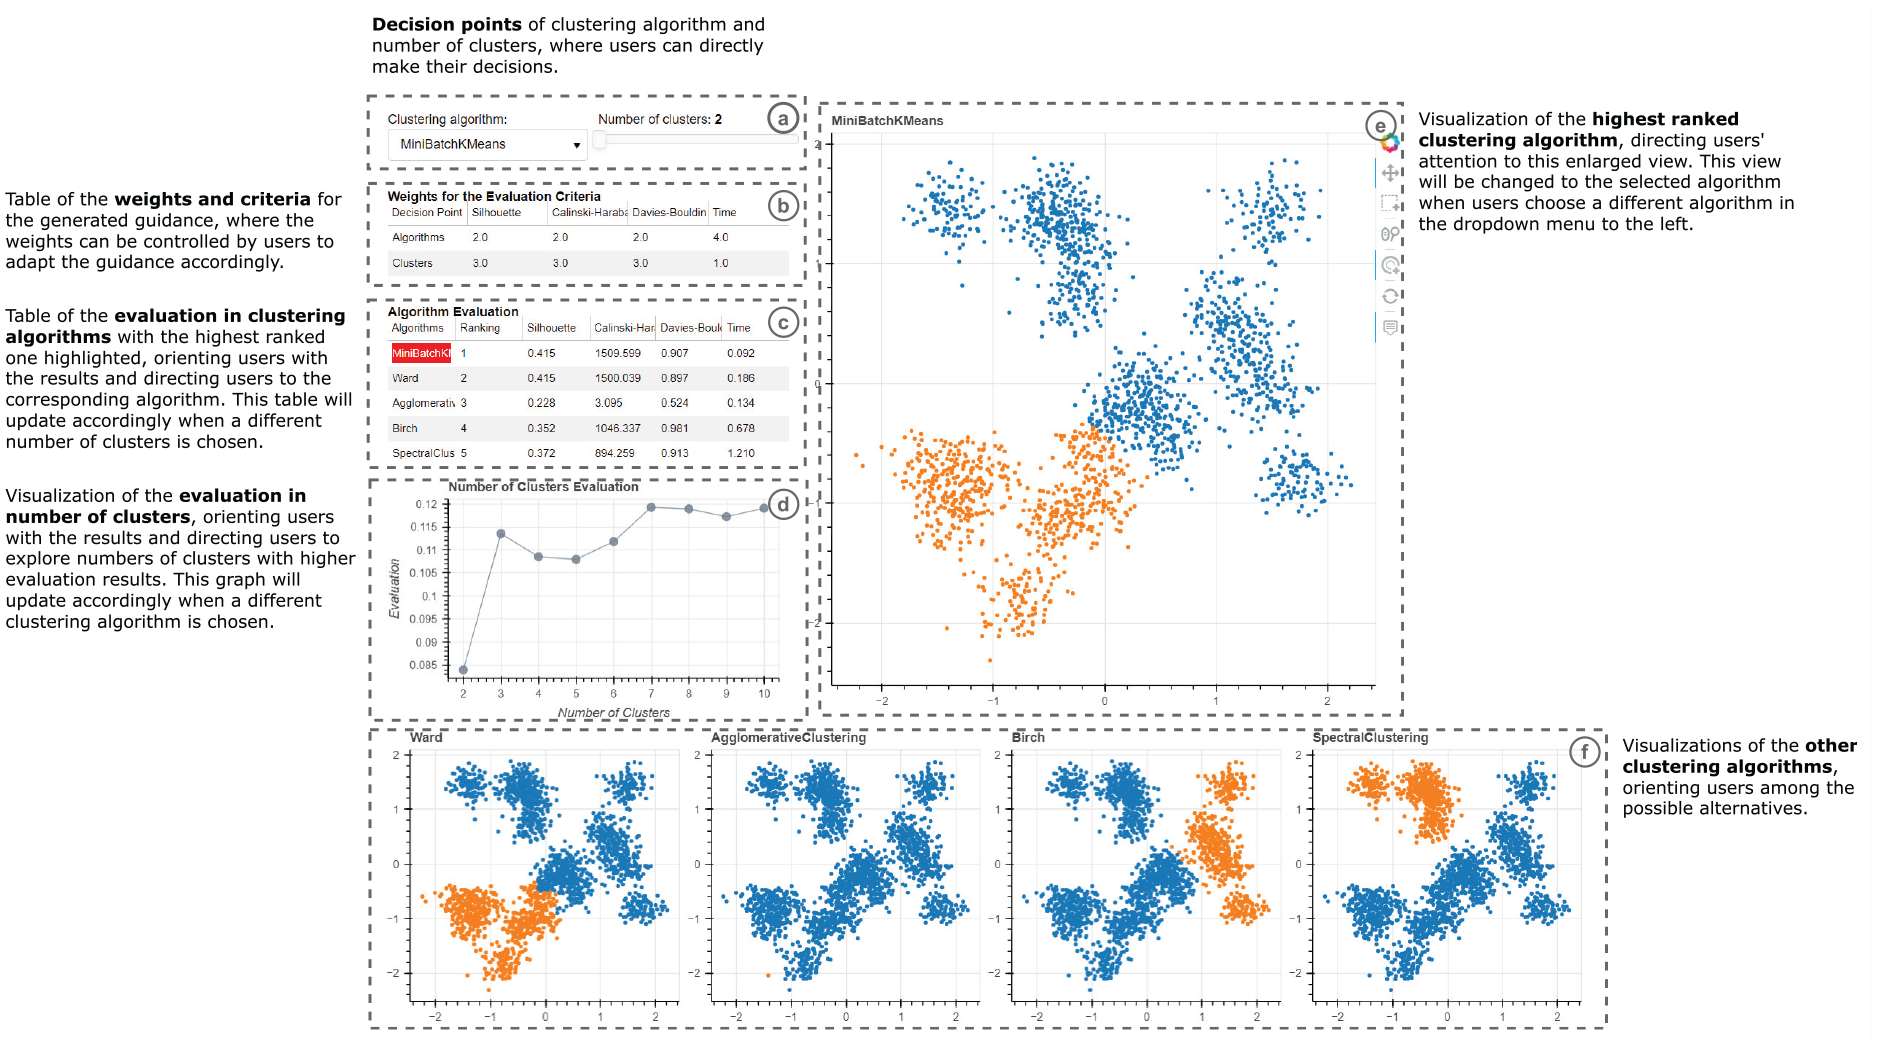
The annotated prototype for the use case with guidance produced based on our method: (a) prompts users for their analytic decision, (b) shows the criteria underlying the decision and how they are weighed, (c) and (d) show the results of computing the criteria for the different decisions – the different clustering algorithms and the different numbers of clusters, respectively, (e) previews the outcome of the highest-ranked decision, and (f) previews the outcomes of other alternatives.
Finally, we adapt the provided guidance to user feedback. For the presence of guidance, we allow users to manually enable or disable the guidance elements (evaluation and ranking of alternatives), especially when users do not need to inspect or do not understand these detailed criteria. This also influences the presentation of guidance – with the evaluation table and figure that provide orienting guidance hidden, the system only provides directing guidance by indicating the highest ranked algorithm with its enlarged size.
Use case example with guidance
After the guidance implementation, users enter their analysis with clear priorities and supporting information for the two decision points. For the algorithms, the enlarged view (Figure 8(e)) and highlight color (Figure 8(c)) guide users’ attention to the highest ranked algorithm at the first glance. The detailed evaluation metrics (Figure 8(c)) that generated the underlying guidance support the comparisons between the algorithms with important knowledge, while encouraging users to consider different alternatives. For the number of clusters, the evaluation chart (Figure 8(d)) also indicates how this decision point might influence produced results with the selected algorithm, guiding users to compare and consider different numbers of clusters for their analysis. Moreover, as users change the number of clusters, the guidance is updated accordingly to encourage users to consider how different combinations of algorithms and numbers of clusters might impact their analysis. With the implemented guidance for the two decision points, we bring out several benefits to users that address important challenges they might encounter.
First, the direct presentation of alternatives (Figure 8(e/f)) makes users aware of the decision points and their potential impacts on the results of the clustering analysis, encouraging users to explore the space of alternatives.
Second, the visual cues of color and size (Figure 8(c/e)) indicate the highest ranked alternative, guiding users toward it. Meanwhile, how the underlying mechanism generated this ranking (Figure 8 (b/c/d)) is shown to support the trustworthiness of the provided guidance.
In addition, the presented visualizations (Figure 8(e/f)) and evaluation criteria (Figure 8 (b/c/d)) allow the users to easily compare the alternatives, reason about them in a way that is grounded in the metrics, externalize their decision making process, and construct their evaluations, which in turn reduces their cognitive load. The possibility of manipulating the underlying criteria (Figure 8 (b)) enables users to adapt the guidance to their expertise and context of use, making the guidance design adaptive, flexible, and controllable.
Relations to existing guidance frameworks
To put our step-by-step design process in the context of existing research, this section discusses its commonalities and differences with four guidance frameworks that are closely related to ours:
Collins et al.’s paper collects a range of highly useful thoughts, arguments, models, and building blocks capturing guidance from its different perspectives of goals, requirements, roles, tasks, implementation, and evaluation. 8 The common theme underlying this paper is that of an “intelligent guide” or an “artificial intelligence-guided visualization.”
Ceneda et al.’s paper introduces a framework for making design decisions on guidance functionality to be provided during visual-interactive data analysis. 2 It details aspects such as the requirements and goals of guidance, the knowledge gaps it addresses, the generation of guidance, and the users’ feedback.
Pérez-Messina et al.’s paper proposes a typology of guidance tasks that connects the concept of guidance – its degrees (orienting, directing, prescribing) and the knowledge gap it addresses (target unknown, path unknown) – with user tasks (mainly search tasks). 98 This typology is not a design framework in itself, but it supports guidance design with a nuanced abstraction of guidance tasks.
Sperrle et al.’s paper describes a syntax to specify guidance functionality on the implementation level. 99 Its compact notation and low overhead allow for rapid prototyping of guidance, which makes it a good fit for iterative guidance design.
In the following, we will discuss these frameworks and our guidance design method with regard to common requirements and different contributions to guidance in VA.
Common requirements for effective guidance
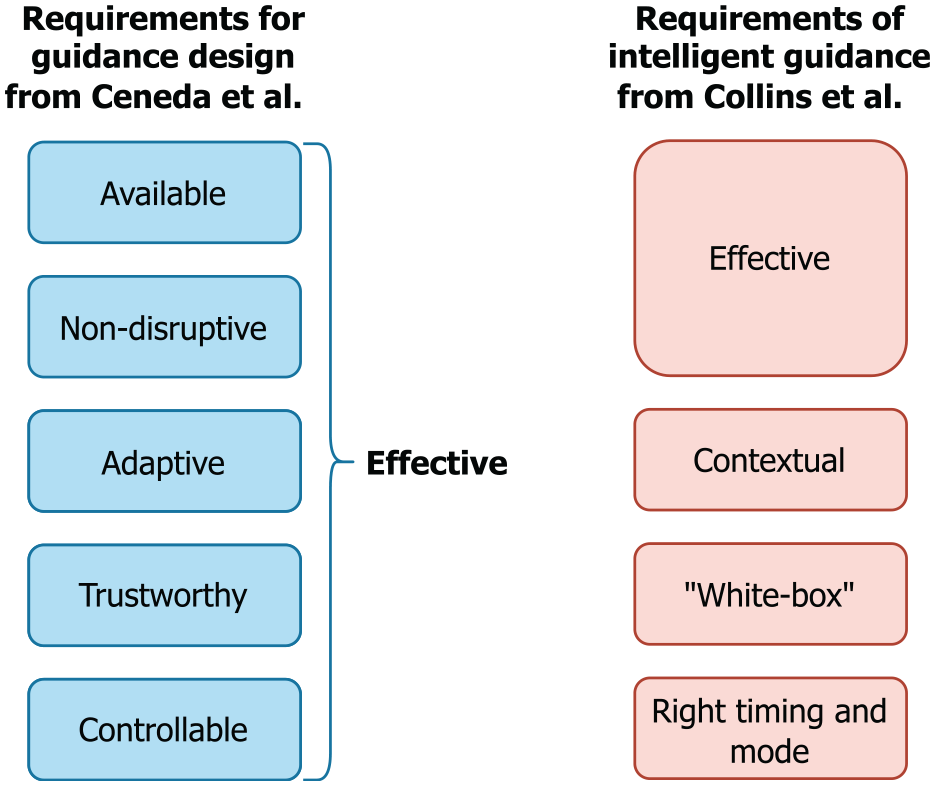
What makes for “good” guidance in Visual Analytics? Ceneda et al. state five requirements for “effective” guidance –available, non-disruptive, adaptive, trustworthy, and controllable. 2 Collins et al. includes similar requirements for “intelligent” guidance with different wording –effective, adapted to the context (contextual), white-box, and right timing and mode (see Figure 9). 8 Note that effective means in this case that the provided guidance should be “easily accessible” and “avoid distraction or obscuring the current visualization.” This corresponds more closely to the requirements of available and non-disruptive from Ceneda et al. than to their overall goal of “effective” guidance.
A requirement that has received a lot of attention in guidance research lately is that of providing adaptive guidance, as it is called by Ceneda et al. This requirement appears under the name contextual guidance in Collins et al. emphasizing that guidance “should be adapted to the context of the user analysis process.” Sperrle et al. cast this notion of adaptive guidance into a dedicated framework, 100 used it in complex guidance scenarios, 101 and built their recent guidance syntax around it. 99
Furthermore, Ceneda et al. discuss the importance of non-disruptive guidance. This notion can also be found in Collins et al.’s requirement of providing guidance at the right time and in the right mode, which explicitly discerns between synchronous guidance that may disrupt and intervene with the analysis process, and asynchronous guidance that can be used or ignored as needed. The task typology by Pérez-Messina et al. makes prominent use of this distinction in their framework as well. 98 Interestingly, neither Collins et al. nor Pérez-Messina et al. connote disrupting or synchronous guidance necessarily as improper or inadvisable, but instead highlight the importance of making an informed and explicit choice about it. After all, guidance should never be followed blindly and it is thus important that guidance is provided explicitly and noticeably.
Our method
Many elements of the guidance design method presented here were purposefully included to meet these requirements. Hence, it is not surprising that a certain overlap exists, for example, between the considerations in Stage 1 – Intelligence and the first two steps in Ceneda et al.’s design framework. Through identifying and evaluating the decision points in a structured manner, we ensure the guidance is available when it is needed, yet non-disruptive. Furthermore, our underlying MCDA models can adapt to different guidance degrees and levels of user controls, making the produced guidance adaptive. As our method emphasizes the possibility of exposing the MCDA model to users, we also enable the produced guidance to communicate essential information about its trustworthiness and to act as a white-box through revealing the underlying mechanism. Finally, through adapting the guidance presence, generation, and presentation to user feedback, we further strengthen the ability of provided guidance to be easily controllable.
Different contributions to VA guidance
All mentioned frameworks address guidance from their own distinct perspectives and therein make different contributions to VA guidance that range from conceptual models to designing and ultimately implementing guidance. A summary of these contributions is given in Table 3.
Comparisons of our work with selected papers on guidance design in VA.
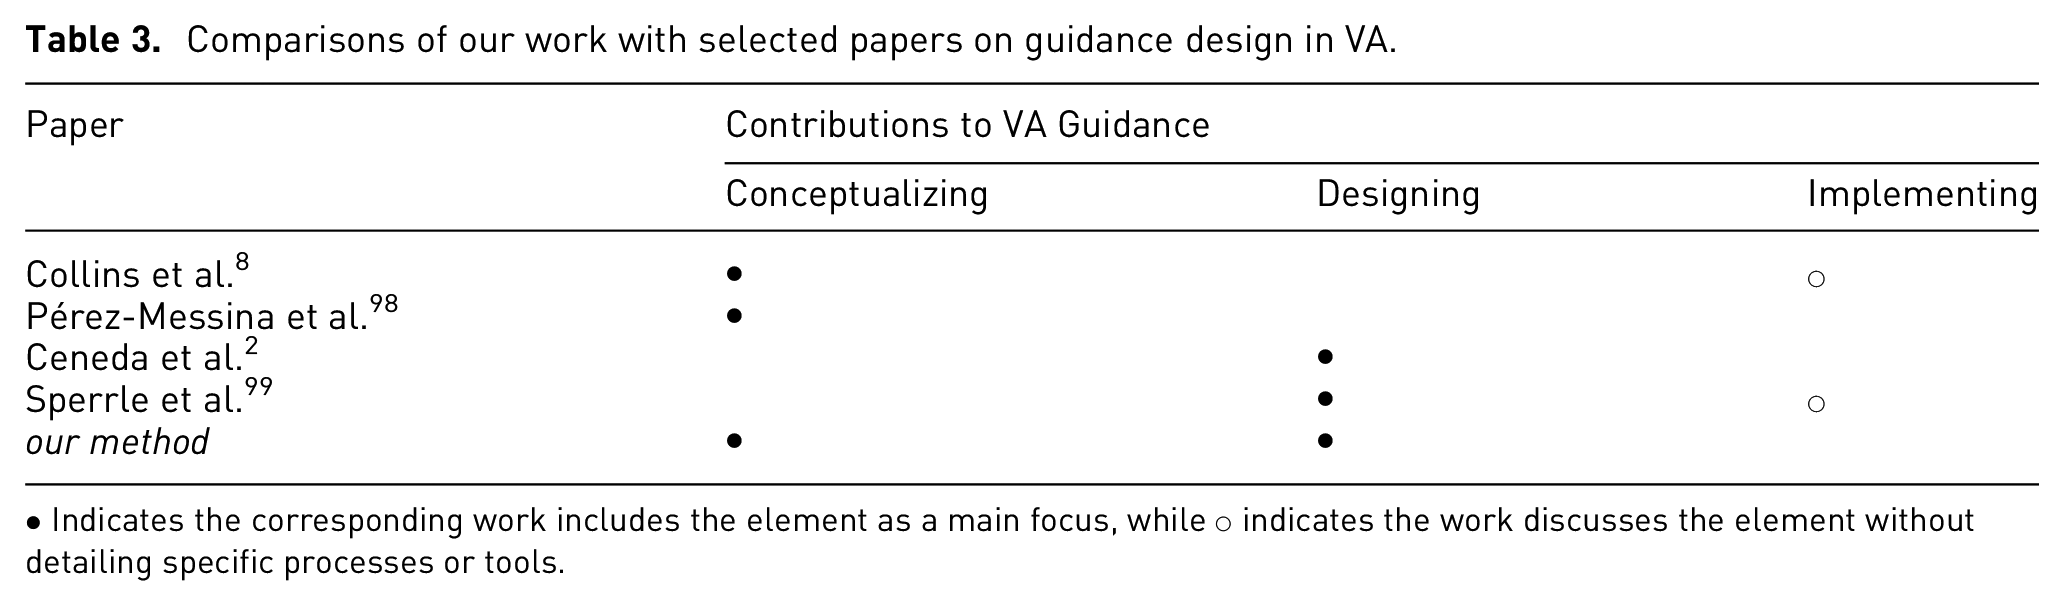
• Indicates the corresponding work includes the element as a main focus, while ○ indicates the work discusses the element without detailing specific processes or tools.
Conceptualizing guidance
From its inception, guidance in VA was likened to a car navigation system for visual-interactive analyses. 1 This metaphor is picked-up again by Collins et al. who point out the gap between this aspiration and the reality of current guidance functionality. 8 As the main issues causing this gap, they identify that existing guidance models – particularly Ceneda et al.’s original guidance characterization – are rather abstract and too far removed from practice to be useful. The paper then goes on to alleviate this issue by extending and detailing different aspects of guidance – for example, task abstraction, user roles, implementation, and evaluation – to make the concept more actionable. In particular the aspect of task abstraction is then revisited in more detail by Pérez-Messina et al.’s typology. 98
Designing guidance
While the conceptual papers describe the tools for providing guidance (e.g. requirements, tasks, building blocks for implementation and evaluation), they do not detail how to use them to get from an identified knowledge gap to a suitable guidance solution. These more procedural concerns are addressed by Ceneda et al.’s four-step framework for guidance designers in which they propose a sensible order in which to make the different necessary considerations for arriving at guidance solutions. 2 As this four-step framework aims to anticipate user problems at design time, it has only limited possibilities to adapt to changing user needs as they emerge at runtime during exploratory, open-ended analysis sessions. Consequently, Sperrle et al. call this a theoretical design process and instead propose a strategy-centered guidance design in which various different guidance strategies are developed at design time and then chosen dynamically as needed at runtime. 99
Implementing guidance
Having a guidance design – that is, all questions regarding the why, when, what, and how of guidance are answered – still does not realize the thus specified guidance in code. To that end, Collins et al. provide a high-level discussion on guidance implementation (e.g. sources of information, computational processes, interaction modalities) using an input-compute-output structure. 8 These can help to further detail the design considerations into implementation considerations, but it still does not lead to actual code. The framework from Sperrle et al. takes the next step in tackling this last mile bridging specification to implementation of VA guidance. 99 By expressing their guidance strategies through a declarative grammar, they are able to automatically generate guidance functionality from the specification. This narrows the gap between design and implementation considerably, leaving open only the implementation of the frontend for showing the guidance and interacting with it.
Our method
As can be seen, all existing frameworks have a particular focus in their contributions to VA guidance, and so does our method:
Conceptualizing Guidance: Our method reframes and extends the common notion of “guidance for knowledge gaps” to “support for decision points.”
Designing Guidance: This new perspective on guidance allows us to re-structure the guidance design process along the decision making process.
Implementing Guidance: Our framework is first and foremost a method for design and not for implementation. That being said, the use of existing decision support systems – in our case the MCDA models from Scikit-Criteria – may serve as a viable way to use off-the-shelf implementations to generate guidance.
In this way, our method combines a new way of thinking about guidance with a matching way of designing guidance. To bridge the gap between theory and practice, we provide the worksheets as practical tools to be used for guidance design and we root our method in the MCDA approach for which a wide range of libraries and packages in different programing languages are available to jumpstart guidance generation without much additional overhead.
Discussion of limitations
Throughout this paper, we have boldly called our design method a “generic” approach to providing guidance. In many regards, this statement holds true: Our method does not apply only to a single guidance domain or use case. It can be used to provide both types of guidance: assisting with unknown analysis targets and analysis paths. It is also not tailored to a particular guidance degree or constrained to a certain input.
Nevertheless, our guidance design method relies on a particular understanding of what guidance is and what it is not. It furthermore makes assumptions about the guidance problem that, if not met, limit the applicability of our method. These two aspects are briefly discussed in the following.
Scope of our method
The most common notion of guidance is that of an enhancement to an underlying unguided visual analysis process. Despite this agreed-upon intuition on what guidance means in the field of visualization and visual analytics, its delineation remains complicated. For example, it is not unreasonable to argue for any of the following to be forms of guidance:
overview and detail visualization – for example, a minimap providing information about the larger context of a currently inspected view region;
intrinsic emphasis effects 102 – for example, directing the viewers’ attention to outliers in the data simply by choosing a scatterplot for showing the data;
context-sensitive help 103 – for example, providing a tooltip with additional information when hovering with the mouse cursor.
Following this line of thought, any mechanism that provides additional information (minimap, tooltip, labeling, help texts, etc.) can be understood as an instance of informing guidance devised to resolve knowledge gaps. Any visual encoding that draws the reader toward the important aspects of the data can be understood as a form of directing guidance. Yet, if these are indeed instances of guidance then where does the plain and unguided interactive visualization end and where does guidance begin? After all, visualizations are in themselves tools to resolve knowledge gaps about the data. Otherwise, if everything about the visualized data was already known, why visualize it or even perform visual analytics on it? In that sense, any effective visualization design should be done in a way that guides the users’ attention toward the salient parts of the shown data and provides details on demand. Yet, our design framework is clearly not meant for general visualization design. Hence, it does not cover any of the above examples very well if one wants to consider them as guidance.
Assumptions underlying our method
Even if the scope of guidance to be provided fits the understanding of an enhancement to an unguided base visualization as discussed above, our method is not necessarily ideal for designing guidance in all cases. The reason is that our method is targeted to solve guidance problems characterized by three assumptions. The first fundamental assumption made by our framework is that all guidance problems can be framed as decisions in need of decision support. To back this assumption, we made the argument that all user tasks involve decisions as otherwise there was no need for the user in the first place. Hence, we reasoned that any task in need of guidance can be equated with a decision in need of decision support. This is true for many high-level analytic tasks. However, guidance for low-level tasks may not necessarily involve a decision making component. For low-level tasks, guidance is often provided to simply reduce interaction costs by automating particularly tedious aspects of the task in a prescribing manner. For example, interactive snap-to-grid brushing aids in precisely anchoring brushes at grid points, effectively taking over and guiding the hand in moving the mouse cursor toward the exact pixel spot once getting close to it. 104 Using the aforementioned analogy of a car’s navigation system, 1 this functionality could be likened to the self-parking feature of some cars as a means to navigate those last few meters. The second fundamental assumption of our design framework is that the decisions to be supported can be identified during the design phase of a VA system. Supporting this assumption, we have argued that our framework can and should be applied iteratively, so that crucial decisions in need of support are recognized as early as possible at different stages of the design cycle. Yet in particular for decisions identified in the very early stages of designing a VA system, it can be hard to already formally grasp evaluation criteria for an MCDA model as it is still unclear at this point what makes one alternative preferable over another. In these cases, the framework from Ceneda et al. might work better as a first design iteration to bootstrap the iterative process. 2 The last assumption is that a dedicated decision support mechanism can be put in place before a decision needs to be made. Yet, it is the very nature of exploratory visual analysis to try new analysis paths and approaches in order to discover the unexpected in the data. This is likely to lead to new and unforeseen analysis situations for which no preconceived guidance mechanism exists. Yet it is exactly these uncommon analysis situations in which guidance would be needed most. This conundrum is not specific to our design method, but shared with all existing design frameworks. The idea of guidance strategy templates proposed by Sperrle et al. that fit a wide variety of different concrete guidance situations – even those that were not explicitly anticipated when formulating them – might be a viable way to circumvent this problem in the future. 99
Conclusions
In this paper, we introduced a generic guidance design method through decision support. To this end, we re-framed guidance as supporting decision points, presented and detailed our generic guidance method through three steps for each of the three stages in the decision making process, and produced a set of flexible worksheets through internal iterations and expert workshops based on our method. Additionally, we developed an initial prototype with the produced worksheets to exemplify the usefulness and applicability of the method and discussed our method in the context of existing general research on VA guidance. With both theoretical and empirical insights, this work expands the concept of guidance in VA with decision making research and provides a practical guidance method covering the end-to-end process of producing guidance in VA.
As for future work, the discussion of relations between ours and existing frameworks make it obvious that a “nested model of guidance design” akin to Munzner’s nested model for visualization design is almost within reach. 105 By applying the different frameworks at the different levels of such a nested model – for example, Pérez-Messina et al.’s task typology for the task abstraction and Sperrle et al.’s Lotse guidance library or our MCDA models at the algorithm level – it should be possible to realize a nested design process specifically for VA guidance. Likewise, different aspects of Collins et al.’s considerations for evaluating guidance could then be related as validation measures to the different levels. For example, their suggestion to do user studies with “complex information seeking tasks” could be used to validate the guidance design, while the “metrics for automated monitoring” could be useful to benchmark the algorithmic implementation of the guidance generation. Filling in the still missing pieces to complete this picture – for example, a data abstraction for guidance in VA to complement the existing task typology – pose formidable research challenges in this direction.
Supplemental Material
sj-pdf-1-ivi-10.1177_14738716221147289 – Supplemental material for Providing visual analytics guidance through decision support
Supplemental material, sj-pdf-1-ivi-10.1177_14738716221147289 for Providing visual analytics guidance through decision support by Wenkai Han and Hans-Jörg Schulz in Information Visualization
Supplemental Material
sj-pdf-2-ivi-10.1177_14738716221147289 – Supplemental material for Providing visual analytics guidance through decision support
Supplemental material, sj-pdf-2-ivi-10.1177_14738716221147289 for Providing visual analytics guidance through decision support by Wenkai Han and Hans-Jörg Schulz in Information Visualization
Footnotes
Acknowledgements
We thank the participants of the expert workshops for their time and feedback, as well as the anonymous reviewers for their input on this work.
Funding
The author(s) disclosed receipt of the following financial support for the research, authorship, and/or publication of this article: the Innovation Fund Denmark (IFD) through the Grand Solution project “Hospital@Night”.
Supplemental material
Supplemental material for this article is available online.
References
Supplementary Material
Please find the following supplemental material available below.
For Open Access articles published under a Creative Commons License, all supplemental material carries the same license as the article it is associated with.
For non-Open Access articles published, all supplemental material carries a non-exclusive license, and permission requests for re-use of supplemental material or any part of supplemental material shall be sent directly to the copyright owner as specified in the copyright notice associated with the article.