
Abstract
In recent times, visual analytics systems (VAS) have been used to solve various complex issues in diverse application domains. Nonetheless, an inherent drawback arises from the insufficient evaluation of VAS, resulting in occasional inaccuracies when it comes to analytical reasoning, information synthesis, and deriving insights from vast, ever-changing, ambiguous, and frequently contradictory data. Hence, the significance of implementing an appropriate evaluation methodology cannot be overstated, as it plays a pivotal role in enhancing the design and development of visualization systems. This paper assesses visualization systems by providing a systematic exploration of various evaluation strategies (ES). While several existing studies have examined some ES, the extent of comprehensive and systematic review for visualization research remains limited. In this work, we introduce seven state-of-the-art and widely recognized ES namely (1) dashboard comparison; (2) insight-based evaluation; (3) log data analysis; (4) Likert scales; (5) qualitative and quantitative analysis; (6) Nielsen’s heuristics; and (7) eye trackers. Moreover, it delves into their historical context and explores numerous applications where these ES have been employed, shedding light on the associated evaluation practices. Through our comprehensive review, we overview and analyze the predominant evaluation goals within the visualization community, elucidating their evolution and the inherent contrasts. Additionally, we identify the open challenges that arise with the emergence of new ES, while also highlighting the key themes gleaned from the existing literature that hold potential for further exploration in future studies.
Keywords
Introduction
Visual analytics systems (VAS) are a relatively new field that is effective and intuitive for data analysis or data mining. Nowadays, it is used to discover problems and obtain insights from various researchers. Existing studies have highlighted the significance of justifying both its usefulness and usability aspects. To address this, we conduct a comprehensive review of over 100 papers published in top-tier journals and conferences over the past 6 years, focusing specifically on their utilization of evaluation methods. Our main objective is to gain a comprehensive understanding of the diverse evaluation techniques employed in visualization research as a whole.
Evaluation strategies for various applications.
First, we present an in-depth overview of VIS, identify the novel evaluation methods, and explore how these methods play a significant role in visualization research.
Second, we describe the popular state-of-the-art evaluation methods in the visualization community and offer a historical perspective by exploring numerous applications with these evaluation practices.
Third, we assist researchers to identify, justify and refine their evaluation approaches. Additionally, we apply the lessons learnt from previous research and detail several opportunities, challenges, and future directions to help researchers recognize and avoid the known pitfalls.
The paper is organized as follows: first, a thorough study of VAS is provided in the background section, followed by a detailed discussion of the article collection and analysis in the methodology section. Then the next section overviews the evaluation methods and their terminology. The opportunities, difficulties, and future directions are discussed in the discussion section. Finally, the paper is concluded in the last section.
Background study
What is a visual analytics system?
The study of analytical reasoning made possible by interactive visual interfaces is known as VA Cook and Thomas. 18 It is an analytical technique that enables the combination of knowledge and facilitates understanding from vast, dynamic, confusing, and often contradictory datasets, allowing for the identification of both anticipated and unexpected information. When employing human judgment to draw conclusions from data, this approach relies on a comprehensive understanding of the underlying cognitive and perceptual concepts and the reasoning process Stadler et al. 19
VAS assists users by presenting data effectively. It involves taking raw data as input, modeling it, and delivering the output in a comprehensible format Kosara. 20 Interactive visualization plays a vital role in this process as it allows users to easily identify patterns and trends when presented with a visual overview of the data, as opposed to analyzing hundreds of rows in a spreadsheet. This approach aligns with how the human brain processes information. Visualizing data enhances its value as data analysis aims to extract insights. Without the utilization of VA, data analysts may be able to reach conclusions based on their analysis, but effectively communicating those findings can prove challenging Liu et al. 21
VAS in various application domains
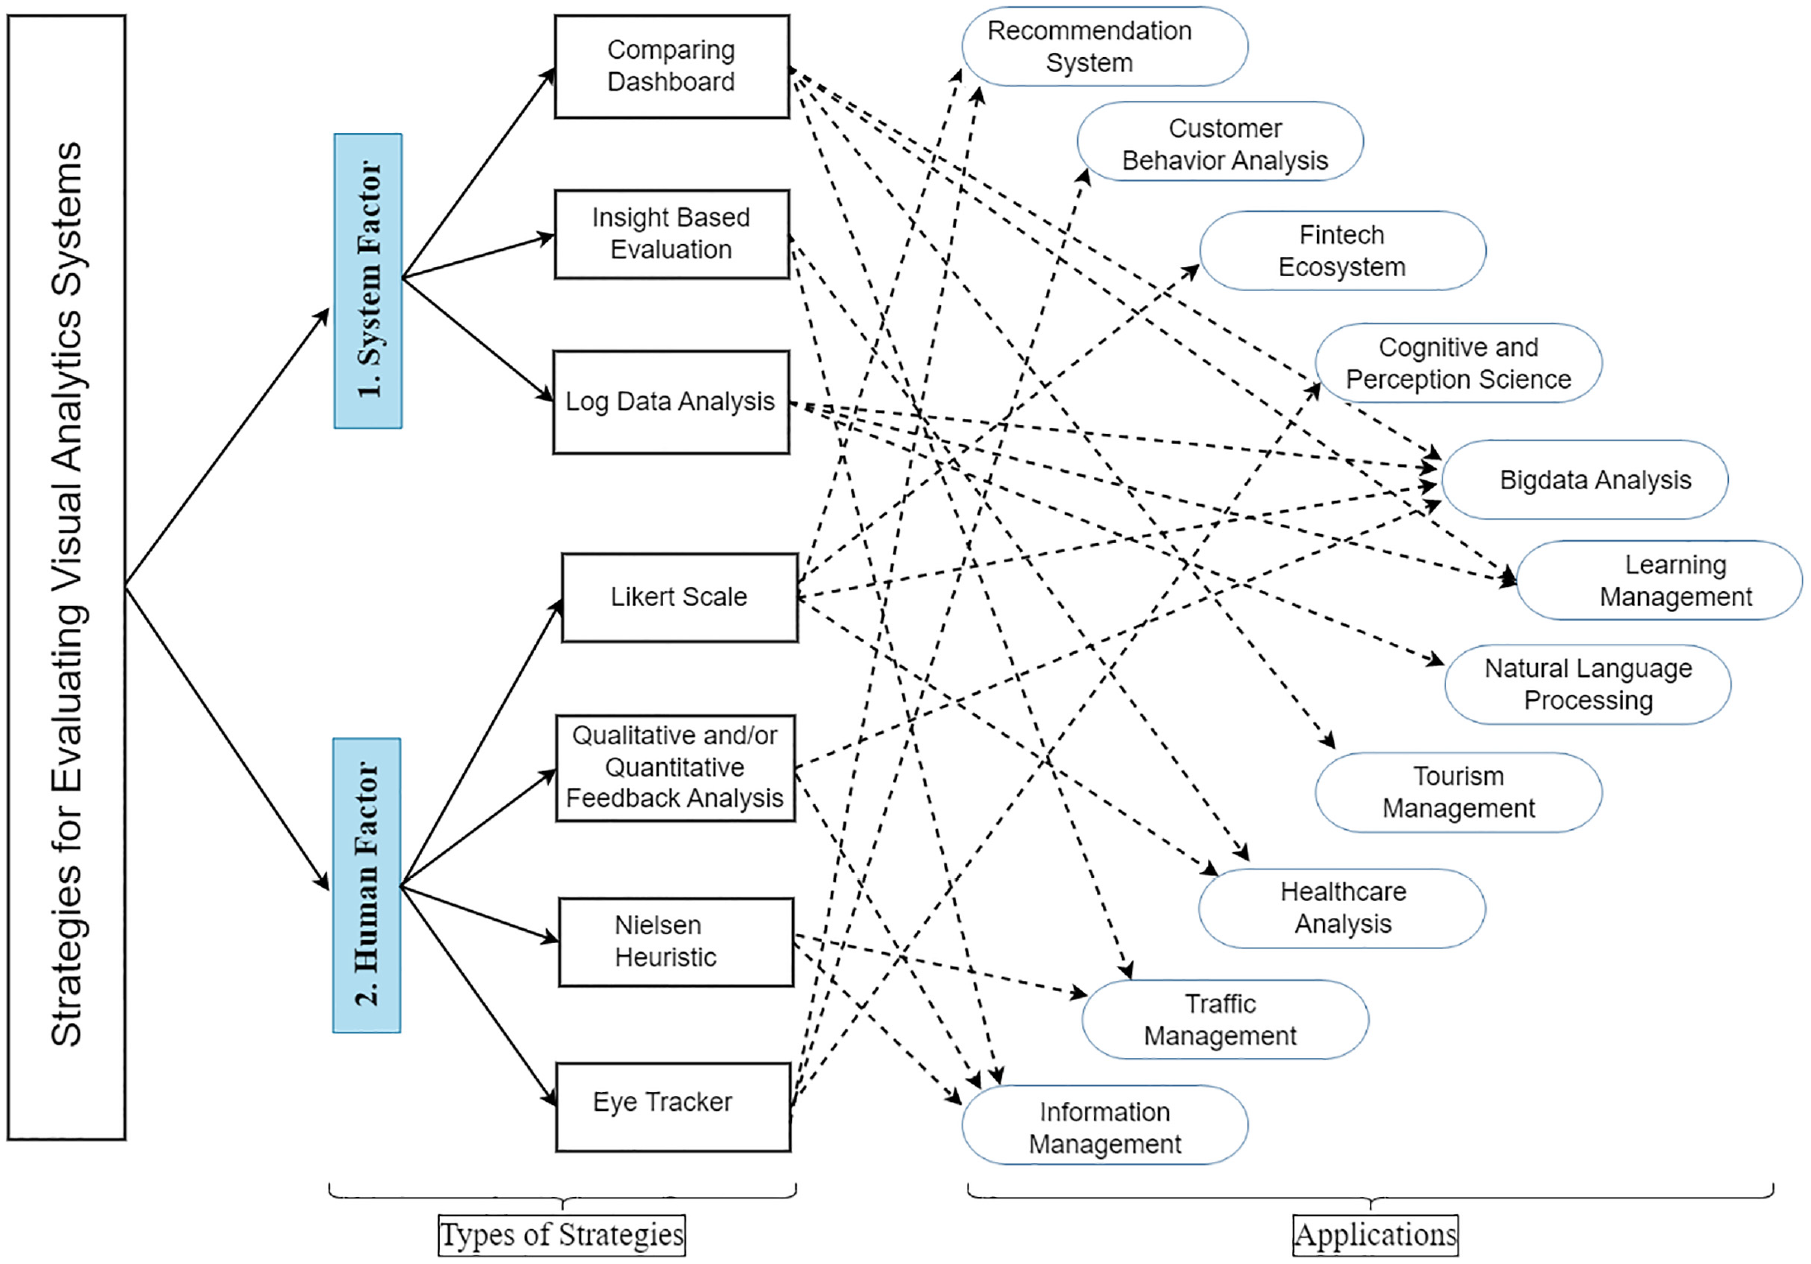
As shown in Figure 1, several interactive VAS have been applied in various application domains globally, where researchers have proposed and analyzed new techniques and discussed in detail how specific strategies might be applied to evaluate the system.22–30 These researchers widened the scope of various applications by developing a framework that encourages the adoption of modernized design techniques in the visualization sector. Additionally, they also focused on establishing methodological insights while providing insight into specific areas of VAS evaluation. According to the existing studies, the key application domains where various interactive VAS are applied are (i) big data analysis, (ii) cognitive and perception science, (iii) recommendation systems, (iv) healthcare analysis, (v) customer behavior analysis, (iv) natural language processing, (vii) tourism management, and (viii) fintech ecosystem. For example, Liu et al. 31 designed a new visualization tool using a virtual reality platform. Green et al. 32 introduced perception and cognition-based visualization systems. They designed their system to maximize the cognitive strength of both humans and computers. A hybrid interactive visualized recommender system is presented by Bostandjiev et al. 33 to recommend items from social networking sites like Facebook, Twitter, etc. The system accepts user preferences as input and recommends an item on the interactive interface. Most of these studies applied various evaluation methods to justify their system. Therefore, we aim to provide a systematic review of the novel methods which have been used to evaluate interactive VAS.
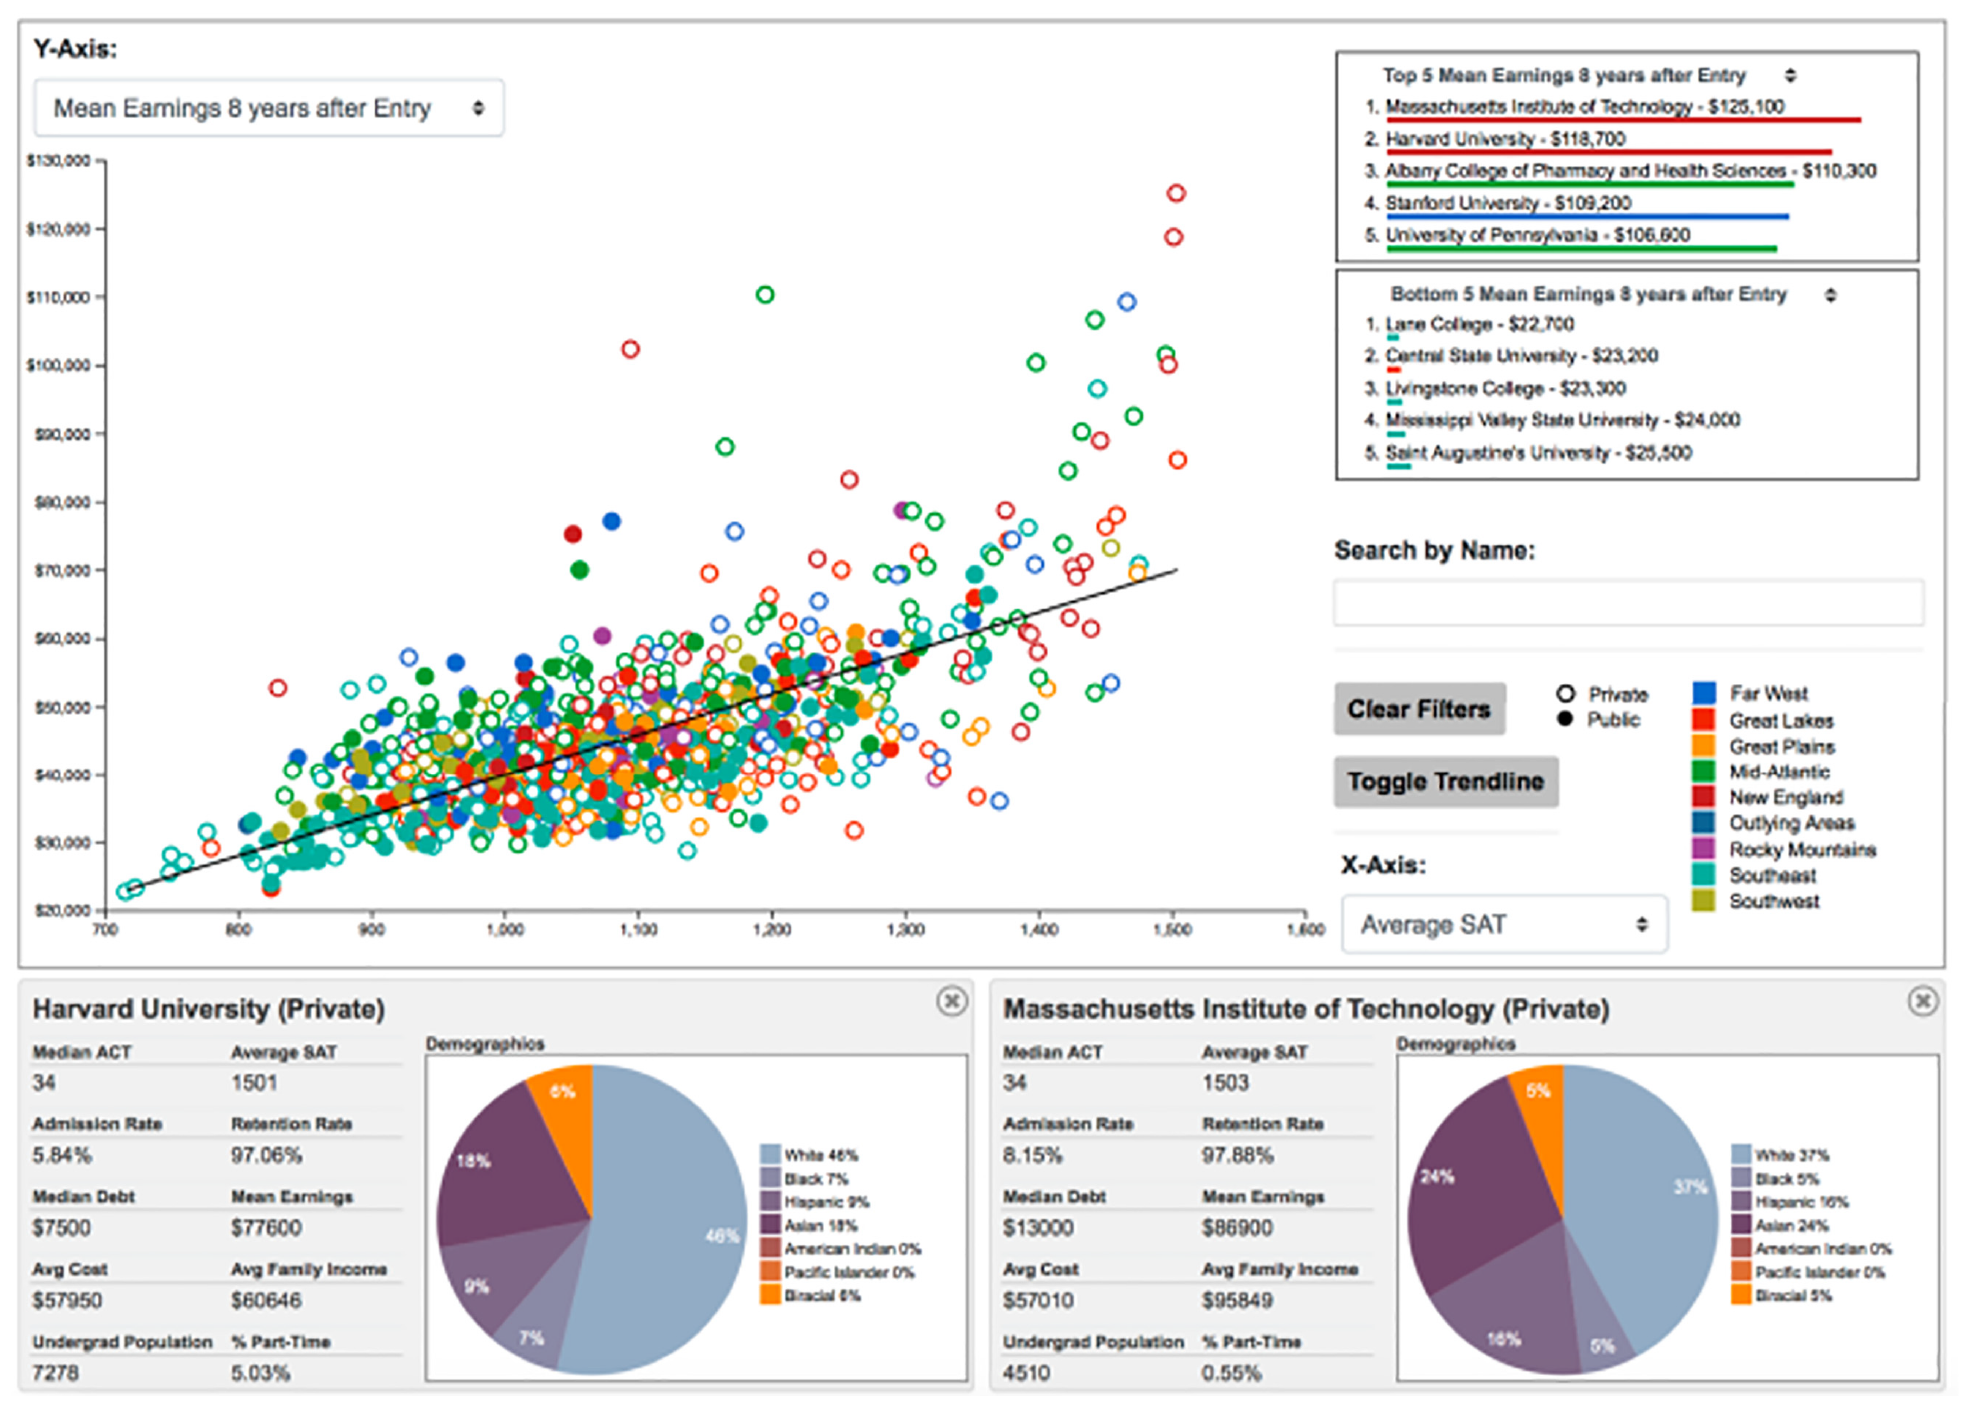
Role of evaluation strategies in visualization research
In recent times, interactive VAS have gained widespread usage as integral components of the creative process, empowering users to formulate hypotheses, uncover patterns and anomalies, and refine theories. In the realm of visualization research, evaluation strategies assume a crucial role, acting as foundational elements that guarantee the effectiveness, usability, and practicality of visualizations. These strategies are designed to evaluate and validate the advantages and disadvantages of visual representations and interaction techniques. For example, an interactive VAS is developed to identify, isolate, and present the information to analyze the immense volumes of complex data as shown in Figure 2. Using this system, individuals gain the ability to interact with data, enabling the visualization of potential insights in a manner that was previously unattainable with static graphs. However, as the data is large and complex, it isn’t always easy to examine in a prompt and efficient manner as it consumes significant time and money. Although several existing evaluation studies and experiments are helpful, there is an increasing demand for alternative evaluation methods that provide measurable advantages that promote the comprehensive adoption of interactive VAS Christmann et al. 24 Therefore, evaluation strategies’ play an increasingly important role in many domains because users may obtain unexpected findings that challenge their preconceived opinions, prompt new ideas, and lead to significant breakthroughs.34,35
An interactive deep visual analytics system (Figure courtesy of Wang et al. 36 ).
Interactive VAS is used to gain insight into vast volumes of abstract data, such as tables, hierarchies, and networks. These visualizations extend beyond conventional reports and records and prove valuable in various domains, including big data analysis Keim et al., 37 health care analysis Stadler et al., 19 customer behavior analysis Abdulla et al., 38 natural language processing Tupikovskaja-Omovie and Tyler, 39 recommendation systems Varu et al., 14 fintech ecosystems Basole and Patel, 40 and tourism management systems Almaimoni et al. 41 The goal is to recognize patterns, structures, and anomalies, allowing specialists to evaluate large amounts of data. Geographical information systems can also benefit from a visualization system Folorunso and Ogunseye. 42 Regional planning, transportation planning and management, weather forecasting, and mapping rely on VAS such as MapQuest and SmartForest Geisler. 43 Furthermore, visualization plays a crucial role in contemporary architectural and medical applications. Notably, the National Library of Medicine’s Visible Human Project Ackerman 44 provides an extensive digital library of anatomical images capturing the human body with exceptional precision, taken at 1 mm intervals from both male and female cadavers. These images are invaluable resources for health professionals, enabling the identification of diverse diseases and ailments, ranging from damaged ligaments to severe conditions leading to fatalities.
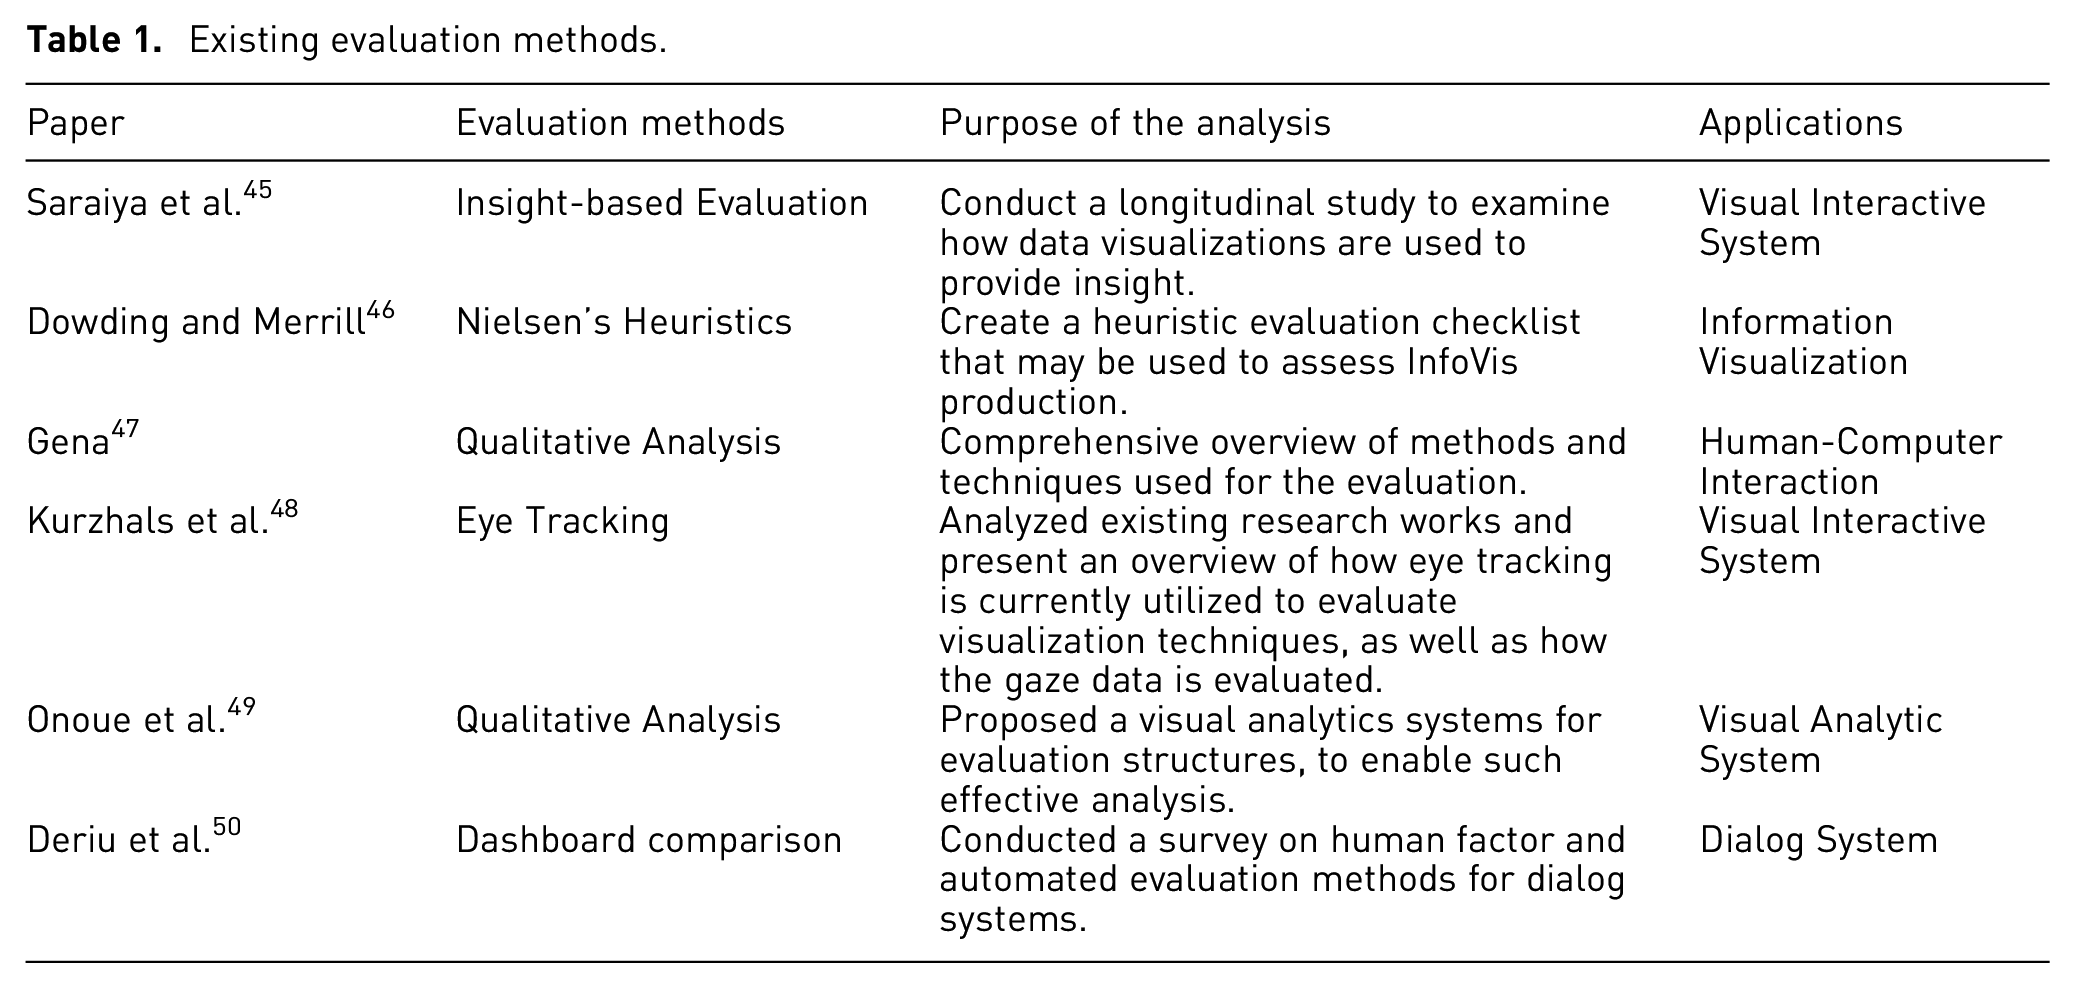
To ensure VAS quality and to compare the results, we need to evaluate the systems. As shown in Table 1, several evaluation methods are used to assess VAS, including Likert scales, log data analysis, eye trackers, dashboard comparison, etc. Many of these techniques have been employed to acquire research findings in the social and behavioral sciences. In the following section, we provide a brief overview and discussion of the benefits, limitations, and applications of evaluation methods predominantly employed in current visualization systems. The overall impact of a visualization system hinges on its advanced visualization and interaction capabilities. However, several research considerations arise, such as determining the evaluation scope, selecting the appropriate number and type of users, defining relevant tasks, choosing datasets, collecting relevant data, and conducting appropriate data analysis. Consequently, the research indicates that VAS are not only effective and impactful they also attract significant attention to verify the performance of the models.
Existing evaluation methods.
Study methodology
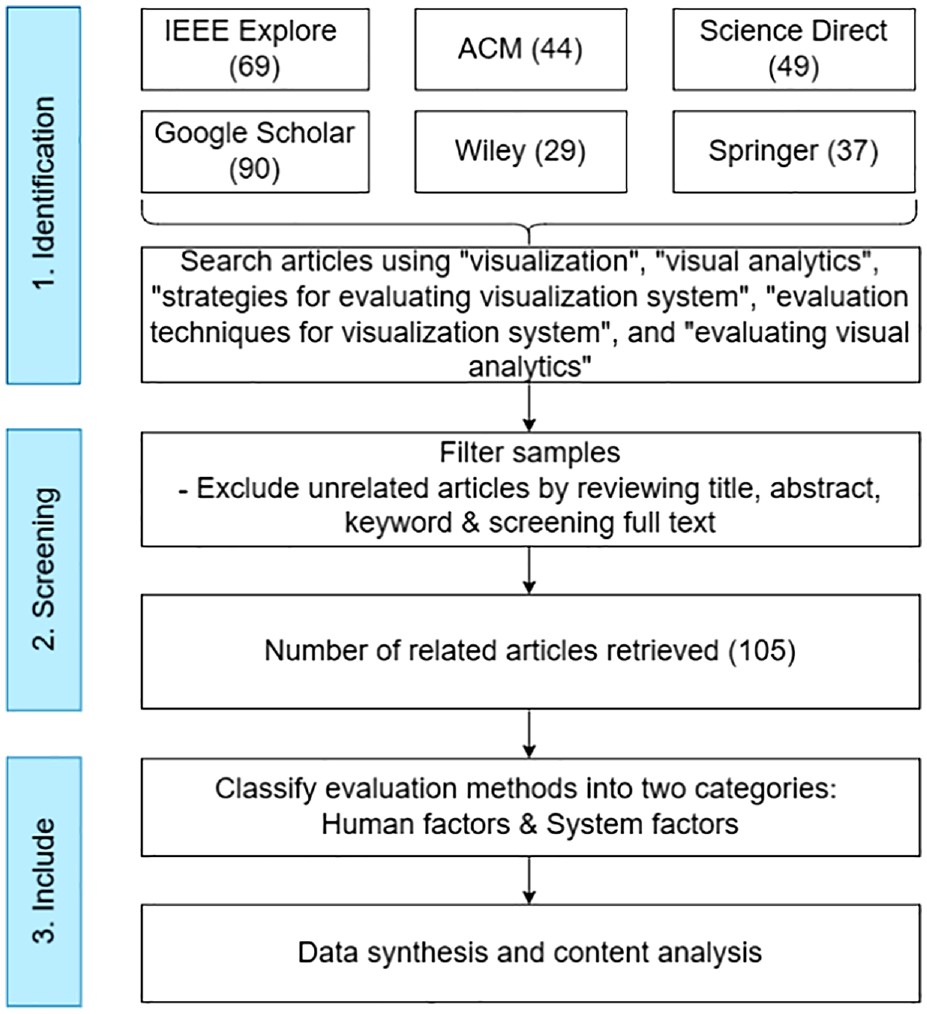
A systematic approach to performing a literature review can reveal themes and generalizable insights that aid in the better construction of an overview of the body of knowledge on a particular topic. For instance, valuable methods proposed for conducting a systematic literature review (SLR) can propel advancements in the field of information science (IS) through both research and practical applications Yasmin et al. 51 SLRs can motivate the development of evidence-based guidelines for practitioners and related investigations. The process involves three key rounds: formulating the research topic, locating and evaluating relevant studies, and finally, conducting a comprehensive document review where the data are consolidated. By applying the SLR technique, a deeper understanding of the current strategies employed in reviewing VAS research can be achieved. Figure 3 (study methodology) illustrates the sample collection and analysis process.
Review methodology for article collection and analysis.
RQ1: What are the existing evaluation methods used in visualization research?
VA is an emerging research topic that deals with a wide range of research globally. Although the primary goal of this study is to describe several strategies for evaluating VAS, it is difficult to cover all the evaluation strategies to monitor, interpret, and extract useful information. Therefore, based on the peer-reviewed articles, we determine the relevance of seven evaluation methods employed in visualization research namely :(1) dashboard comparison; (2) insight-based evaluation; (3) log data analysis; (4) Likert scales; (5) qualitative and quantitative analysis; (6) Nielsen’s heuristics; (7) eye trackers.
RQ2: Are the existing evaluation strategies valid in theory, understanding, and knowledge for evaluating visual analytics systems?
It is crucial to investigate the justifications and the specifics of the methods used when evaluating past studies to assess VAS to determine whether it can produce impartial and fair judgments when using human-centered methods.53,54 While reviewing descriptions of different aspects of these strategies, it is crucial to identify the types of strategies used, namely (1) system factors and (2) human factors, and to comprehend the underlying motivations behind their selection. It is important to analyze how these evaluation strategies were implemented, the input characteristics involved, the training parameters, potential biases, and any notable features Song et al. 16 More importantly, depending on the task which is being undertaken by the VAS especially risk detection. For instance, theoretical frameworks generated from and validated by the health sciences are used to support the human-factor-based evaluation technique that was first introduced by Wang et al. 36
RQ3: How effective are the strategies in terms of both computational performance and meeting the user’s needs?
As shown in Table 4, several strategies have been proposed to evaluate the performance of interactive VAS, such as Likert scales, eye tracker, log data analysis, model comparison, and so on. According to the existing studies, these strategies provide valuable insights for testing VAS in many application domains from the users’ perspective as well as from a computational perspective.
RQ4: What system artifacts have been created, and how did they perform when used in practical situations?
Developing an interactive VAS with unique evaluation artifacts is considered a primary research focus within the visualization community.55,56 Using these design artifacts, we can truly determine the effectiveness of VAS. Thus, it is crucial that researchers not only create and assess VAS but also to integrate them into applications so that humans can evaluate them in real-world settings Kamaleswaran et al. 57 For example, in risk detection, it is essential to know how the model is integrated into a system. 9
Study selection
First, we evaluated the titles of each article and then applied the previously established inclusion and exclusion criteria, obtaining a selection of possibly relevant articles. Following this, the team members manually reviewed each article and obtained the whole text before critically evaluating its contents. Duplicated research articles and those that may not address all of the research questions were omitted. After filtering, we retrieved 318 freely available full articles from six databases as shown in Figure 3. From this, 60 duplicates were eliminated. Additionally, 40 articles were discarded as newspaper or unreviewed internet content, while another 69 articles were eliminated for focusing on visuals rather than VA and lacking target information. Finally, 44 articles were removed after human inspection of the title, keyword, abstract, and full text revealed unrelated information. After classifying the articles into four groups, we verified that 105 addressed our study question and underwent the review analysis.
Information synthesis and review analysis
Content analysis is the practice of directly examining the content of any human interaction process, including verbal, visual, and written materials while analyzing the data using qualitative and quantitative research methods. Additionally, qualitative content analysis condenses the original data. Although both deductive and inductive approaches are widely employed, inductive analysis is the most useful when there have been no previous studies on the phenomenon or when the phenomenon needs to be more cohesive. This work uses an inductive approach to classify and categorize attributes from a few solution application design papers. We searched for each item thoroughly, describing procedures, evaluation methodologies, and design processes.
Overview of evaluation methods and terminology: State-of-the-art
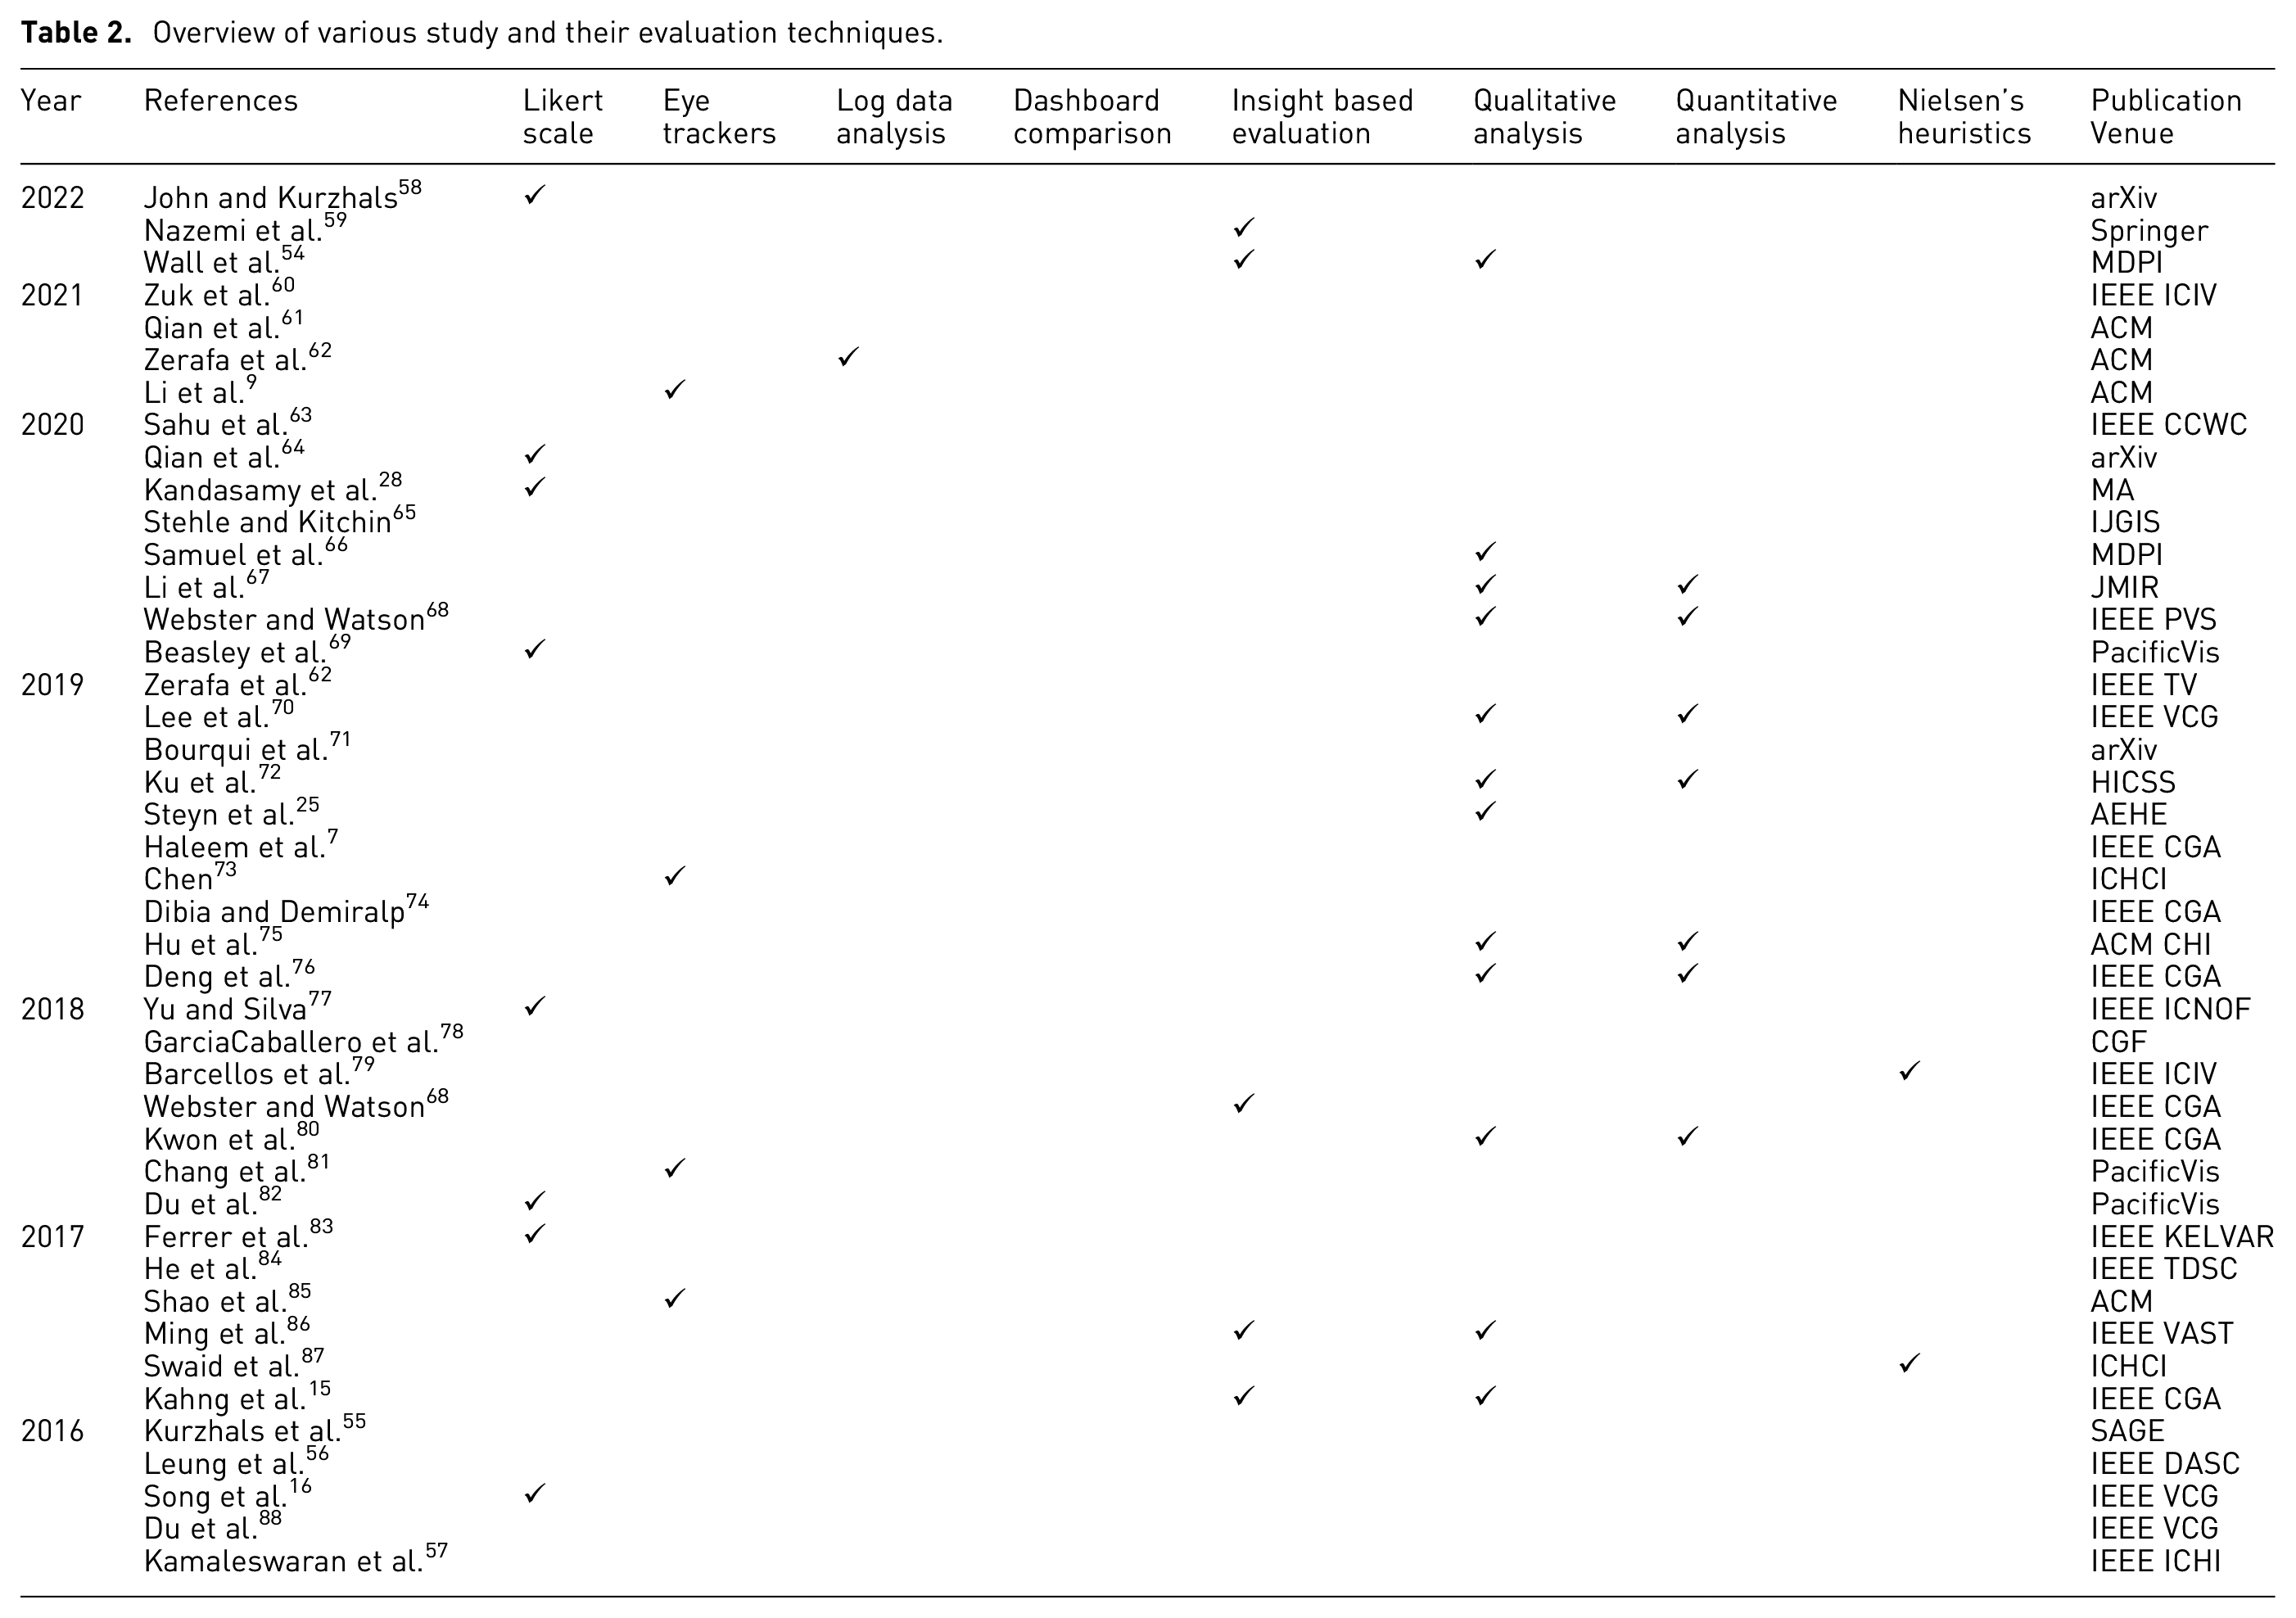
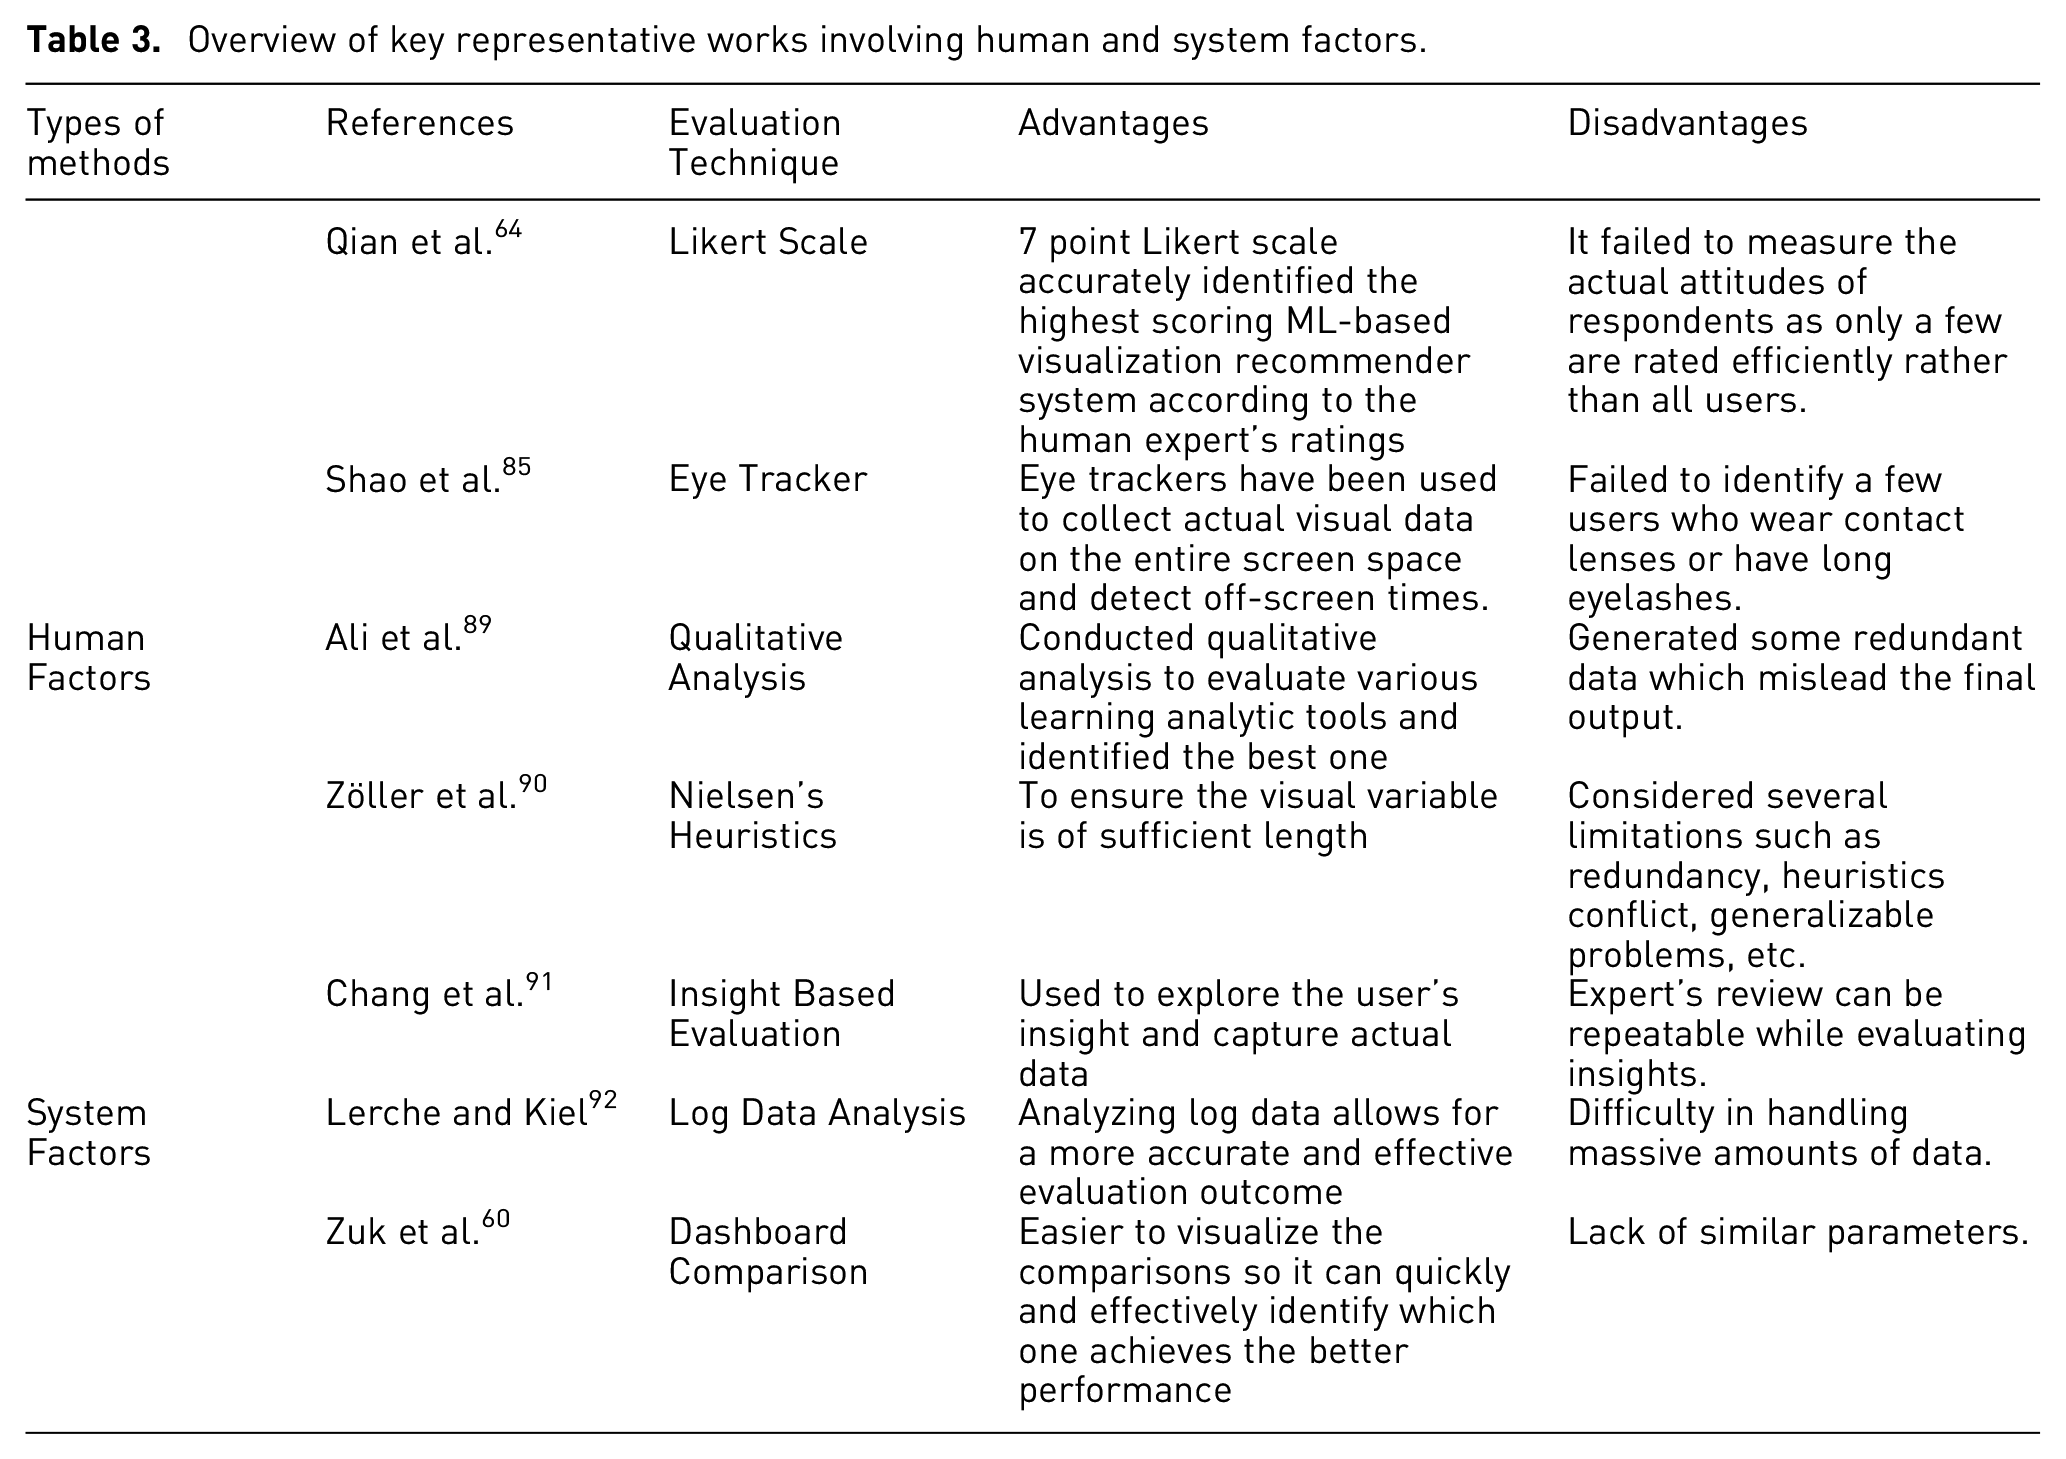
As indicated in Figure 3, a keyword search was conducted across six electronic databases to locate relevant papers from diverse publishers between 2016 and 2021. We identified the related studies by utilizing specific keywords to obtain the most relevant articles and to satisfy the PRISMA criteria Page et al. 52 In this section, we examine seven evaluation methods specifically within the context of VA. Our analysis involves reviewing over a 100 articles, with a primary focus on their application in VAS. These evaluation methods have been widely employed in assessing various aspects of VAS, as summarized in Table 2. Notably, recent research trends indicate an increased adoption of these evaluation methods. Consequently, we categorize these methods into two groups: system factors (SF) and human factors (HF), as illustrated in Figure 1. Table 3 lists the selected research studies and their advantages, and disadvantages.
Overview of various study and their evaluation techniques.
Overview of key representative works involving human and system factors.
System factors
System factors play a vital role in every stage of the visualization process, from designing to evaluating visualization tools. These factors focus on the technical aspects and characteristics of the system itself and encompass various technical aspects that directly impact the effectiveness and usability of visualization systems. By considering system factors, designers and evaluators can ensure the development of robust and efficient visualization tools.
Dashboard comparison
Conducting a dashboard comparison is a valuable approach to evaluating visualization systems. This evaluation method has been proved to be productive, efficient, and provides substantial insights into the effectiveness of visualizations. By comparing different dashboards, researchers can assess internal structures, functionalities, system behavior, accuracy, efficiency, and interactivity. The dashboard comparison evaluation technique is particularly effective when the analyzed parameters are closely aligned.
Several researchers have embraced evaluation techniques to assess their visualization systems. One noteworthy example is the study conducted by Keim and Kriegel 93 in the early stages of visualization development. In their research, they compared their visualization system with alternative techniques to validate its effectiveness in analyzing multidimensional datasets. To gage the model’s efficiency, they meticulously evaluated multiple test cases, revealing significant disparities and providing valuable insights. Moreover, Bourqui et al. 71 explored the interrelation between human and computer vision based on deep learning techniques and evaluated the graph visualization model. They compared their performance with user evaluations and other existing methods to enhance their model’s accuracy and execution. Stehle and Kitchin 65 evaluated a real-time archived data visualization technique, and proposed a city dashboard visualization system, and effective strategies for improving the dashboard design. They asserted that their visualization technique is significantly more effective than the existing ones. designed a visualization system ExtraVis, to evaluate and overcome road traffic incidents and assist in traffic management system control. They compared their approach to three incident dashboards and explored the practical benefits and techniques that are not available in the existing systems. As a result, the technique of dashboard comparison, particularly in visualization, has a wide range of applications since it is thorough and makes it easier to discover the scope of existing systems and overcome their limitations.
Insight-based evaluation: Insight has been commonly stated as the broader purpose of InfoVis, and it seems to capture the intuitive notion of visualization’s purpose North. 94 Insight-based evaluation is a technique aimed at acquiring valuable insights through visualization that differentiates a system from others and underscore its unique qualities when compared to alternative models. To evaluate this capability, visualizations can be measured in terms of insights. Typically, visualizations are evaluated using heuristics and expert reviews or controlled studies that measure user performance on specified tasks. Measuring insight enables a direct comparison to be made of visualization design alternatives and directly leads to visualization refinement and improvement.
Researchers evaluated several visualization systems using insight-based evaluation approaches and identified many issues, challenges, and advantages. Visualizations are frequently used to help the user gain insight into a data set. For example, North 94 introduced insight-based evaluation as a methodology to assess the effectiveness of visualization in facilitating individuals’ acquisition of meaningful insights from the presented information. In the proposed qualitative insight analysis, the users verbalize their findings using a think-aloud protocol so that evaluators can capture the users’ insights. A more modern approach is to conduct insight-based evaluations, in which participants are given open-ended, complex tasks and asked to report on the insights gained. Another research study promoted the insight-based evaluation of visualizations which required teams to report on insights gained while exploring data North. 94 Saraiya et al. 45 developed and implemented an insight-based approach to visualization evaluation that we believe may be applied to a variety of data domains. Their evaluation technique focuses on identifying and quantifying insights gained through exploratory visualization. Furthermore, they expanded their explanation and discussion of this insight-based evaluation technique and applied the method to bioinformatics visualizations Saraiya et al. 95 Their insight definition allowed them to quantify insight generation using a range of insight characteristics, allowing them to assess bioinformatics visualization technologies’ open-ended insight capability. However, this process requires time to capture insights. The researchers overcome these difficulties and limitations (user motivation) in future work. Therefore, it is clear from the aforementioned research that insight analysis is far more effective and is widely used as an evaluation technique.
Log data analysis: The evaluation, analysis, and comprehension of computer-generated records known as log analysis. Many programmable technologies produce logs, including networking devices, operating systems, apps, and more. A log is a collection of messages in a sequence that describes what is going on in a system. Log files can be broadcast to a log collector over an active network or saved in files to be reviewed later. Log analysis is the delicate process of evaluating and interpreting these messages to obtain insight into the system’s inner workings.
Researchers have explored various fields using log data analysis. For example, Vartak et al. 96 explored FlowSense as a new natural language interface for visual data exploration in a dataflow visualization system which enables the user to grasp the underlying parsing status using real-time feedback on certain labeled utterances. Lerche and Kiel 92 provided a linear model of student achievement that combines prior knowledge and log file-extracted online behavior as predictors. The model displayed a good fit with data obtained in three separate scenarios. He et al. 84 targeted automated log parsing for the large-scale log analysis of modern systems. They analyzed various state-of-the-art log parsing approaches in depth, evaluating their accuracy, efficiency, and efficacy in relation to future log mining jobs. They conducted an extensive evaluation on synthetic and real-world data sets, and their findings suggest that their parallel log parser, POP can reliably and effectively handle large-scale log data. Therefore, the abovementioned research shows that log data analysis is useful and is widely used as a VA evaluation technique.
Human factors
Human factors (HF) evaluation and design techniques are well-established across various HCI domains, however HF evaluation in VR is complex and encompasses multiple aspects such as human performance, cognition, and sensory capabilities. Consequently, HF plays a pivotal role and makes substantial contributions to the visualization process, tool design, and evaluation. When conducting HF analysis, it is advisable to employ objective metrics that measure performance based on quantifiable characteristics, such as the number of errors made or the time taken to complete a task.
Likert scale/validation points analysis: As indicated in numerous surveys, the most widely utilized evaluation tool is the Likert scale. A Likert scale is a psychological tool for assessing attitudes, values, and opinions. It involves individuals completing a questionnaire where they express their level of agreement or disagreement with a series of statements. The Likert scale assumes a linear relationship between the strength and intensity of an experience. The respondents’ agreement with different statements is typically rated on a five, seven, or nine-point scale. Each item is assigned a numerical score, enabling quantitative data analysis and visualization through graphs or charts.
Various researchers have implemented the Likert scale to evaluate data in a visualization system Islam et al. 97 The Likert scale is popular in survey research because it allows personality traits or perceptions to be operationalized quickly. For example, in 2020, Qian et al. 64 proposed the first end-to-end graphical recommendation system based on ML. They formalized and described a generic learning framework to solve the problem of ML-based visualization recommendations and used trained models to automatically generate, and evaluate a list of recommended views for new data sets which are unknown to arbitrary users. Indeterminate Likert scaling based on TRINS was introduced by Kandasamy et al. 28 To address inconsistent, uncertain, vague, and indeterminate records. Yu and Silva 77 designed and evaluated a combination of the LoRaWAN network with AR visualization. The instrument is a practical application addressing the sensor infrastructure maintenance use case to study the utility of such a combination in a close-to-life scenario. The designed application helps to locate faulty sensors and keep track of data accuracy. Ferrer et al. 83 compared user perception of two approaches to temperature data visualization in tangible augmented reality on mobile phones: (i) the current particle-based visualization and (ii) novel virtual human-based visualizations. Visualizing the Likert scale using horizontal diverging stacked bar charts is an excellent method to see how the participants respond to questions or statements on a survey or questionnaire. However, only a limited number of visual analytic frameworks have been developed, and the Likert scale procedure proves to be comprehensive and effective in evaluating those data visualization systems compared to others. As a result, most Likert-type scales require a diverging stacked bar chart to effectively convey their findings and insights.
Qualitative and quantitative feedback analysis: This is a comprehensive approach to assessment that combines both quantifiable results and metrics with individualized conversations. Quantitative feedback involves collecting factual data on employee and company performance, which can be used for routine evaluations or to establish new goals. On the other hand, qualitative feedback involves more personalized discussions about performance and quality. It can be gathered through various methods, including focus groups, document/material reviews, ethnographic involvement, and interviews. Both qualitative and quantitative feedback formats have their own advantages in different contexts and both may be necessary for a thorough review of a system, website, or mobile app.
Various researchers used qualitative evaluation and quantitative feedback analysis for data visualization. For example, Haleem et al. 7 presented a CNN-based model to evaluate the readability based on the coordinates of nodes and edges in the graph layout. They used previous representative algorithms to create the network design dataset and traditional methods to mark these design images with readability values as a fundamental truth. The suggested CNN model is then trained using this graphic layout image and the readability metric values provided. Steyn et al. 25 identified how feedback might be strengthened in the context of competency-based education. They concluded after reviewing the research that an evaluation that should precede feedback should be planned to maximize its didactic effect. Ali et al. 89 conducted two qualitative studies to evaluate two versions of LOCO-Analyst, a learning analytics tool. They update the system by updating the graphical user interface and applying data visualization techniques to show its generated inputs.
Therefore, from the aforementioned research, it is evident that qualitative evaluation and quantitative feedback analysis have emerged as highly productive and widely employed techniques in the field of VA. These techniques offer valuable insights and play a crucial role in enhancing the effectiveness of VA methods.
Nielsen’s heuristics: Heuristic evaluation is a streamlined and easily integrable process that can be incorporated within development iterations. It is as an informal method of usability analysis, involving a group of evaluators who are given an interface design and asked to provide comments and feedback. This approach was initially proposed by Nielsen and Molich. 98 It was originally developed as a usability engineering method in which the evaluators were asked to consider the system’s fundamental technical limitations. It is also a well-known bargain evaluation technique in HCI and visualization. The primary aim of this evaluation method is to the reveal usability flaws in an existing design. Without communicating with others, heuristic evaluations allow us to identify and focus on specific concerns. Furthermore, heuristic evaluation is used to discover usability issues with particular elements and how they affect the overall user experience.
Several researchers used Nielsen’s heuristics to analyze various visualization systems and compiled a list of their flaws and limitations. For example, Strobelt et al. 99 deployed heuristics evaluation techniques on visualization and usability guidelines. They summarized expert reviews and stated that heuristic evaluation should be used to analyze visualization systems. Dal et al. 100 discovered the benefits and drawbacks of a hierarchy visualization tool using heuristic evaluation. Shneiderman 13 proposed the well-known visual information-seeking mantra which is the heuristic evaluation of fact visualization primarily based on task and usefulness. Using heuristic evaluation, the mantra represents the summary data retrieved via experience, occasional empirical evidence, and practice designing visualizations. Christmann et al. 24 extracted the usability problems through heuristic evaluation. They identified the issues with the usability approach. They concluded the contribution of a heuristic evaluation to total usability efforts reduced the potential for adverse consequences. Z¨oller et al., 90 performed a meta-evaluation to look at the challenges of heuristic assessment for InfoVis, and additionally mentioned the generalizability and categorization of these heuristics. They evaluated the usefulness of heuristic utilization and identified implications for further research into the heuristic evaluation process in InfoVis. Still, researchers much prefer heuristic evaluation rather than others. As a result, the heuristic evaluation technique has a wide range of applications, particularly in visualization, since it is more thorough and makes it easier to discover the scope of existing systems and overcome their limitations.
Eye trackers for evaluation systems: Eye tracking is a well-known evaluation technique which was first proposed to evaluate maps but it has been increasingly used in the last 10–15 years Du et al. 88 Eye tracking has become a popular method for analyzing user behavior, becoming a new human-computer interaction and visualization research approach. Eye tracking is a unique method to study usability issues. Using eye tracking to evaluate visualization systems is advantageous and useful. It is also utilized for the analysis of human-computer interactions and to augment user interaction.
Several researchers proposed and implemented eye tracking support for VAS, which can be extended to be more supportive and adaptive by exploring eye tracking evaluation systems. For example, Silva et al. 101 used eye tracking to control a degree-of-interest display when analyzing hierarchically organized data, as shown in Figure 4. They proposed a framework to explore the eye tracker’s raw data and demonstrate the value of incorporating eye tracking into the VA system. Blascheck,
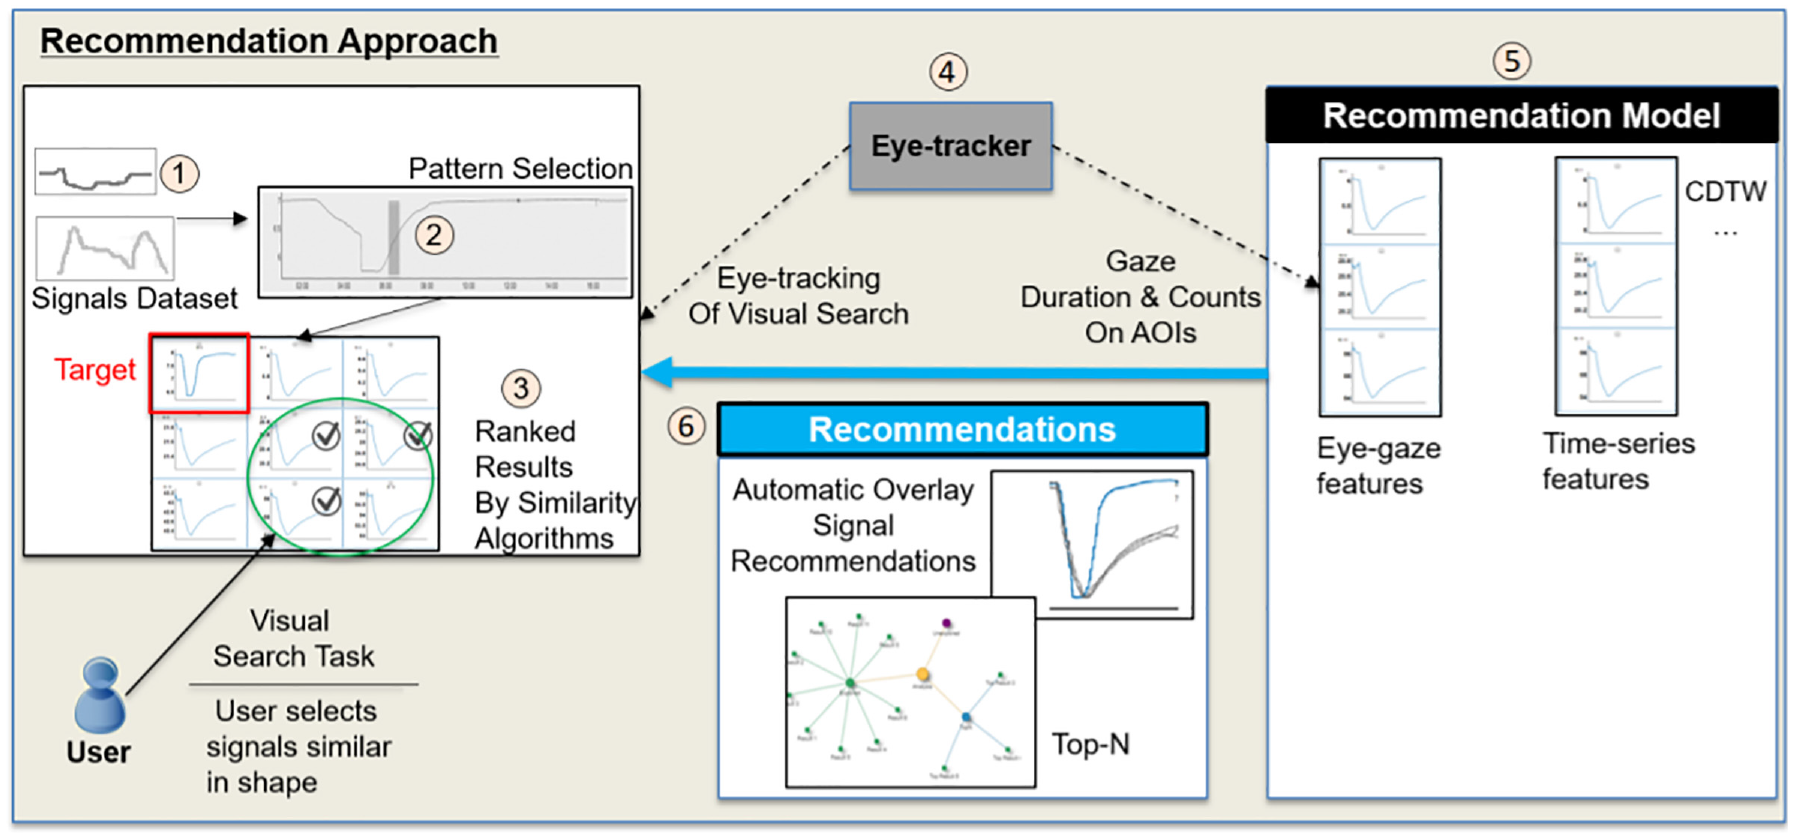
Eye tracking Evaluation System (Figure courtesy of Shao et al. 85 ).
John and Kurzhals 58 provided a novel method for visualizing eye tracking data, which is significant for user behavior analysis and overall evaluation. They analyze various VA systems using eye tracking techniques whenever they analyzed participants’ information. Another example is an exploration conducted on automatically guided data by identifying user interests using an eye tracker Shao et al. 85 Popelka et al. 102 introduced an eye tracking system named the EyeTribe tracker, which is designed for qualitative data recording. They used an eye tracking system to study and examine the quality of the experiment design and analyze the result to explore the strategies for design improvement. They also proposed EyeTribe accuracy evaluation method. IrinaFabrikant et al. 103 utilized eye tracking to assess a map series illustrating the progression of a phenomenon over time, as well as user comprehension of weather maps.
Based on the aforementioned research, it is evident that eye tracking technology is a highly productive and extensively utilized evaluation technique in the field of VA. Compared to data accuracy, the use of eye tracking technology has gained prominence due to its comprehensiveness and practicality in evaluating VA systems. Although there are already a few VA systems in existence, the application of eye tracking provides a comprehensive and practical means to assess and compare these systems against others.
Discussion
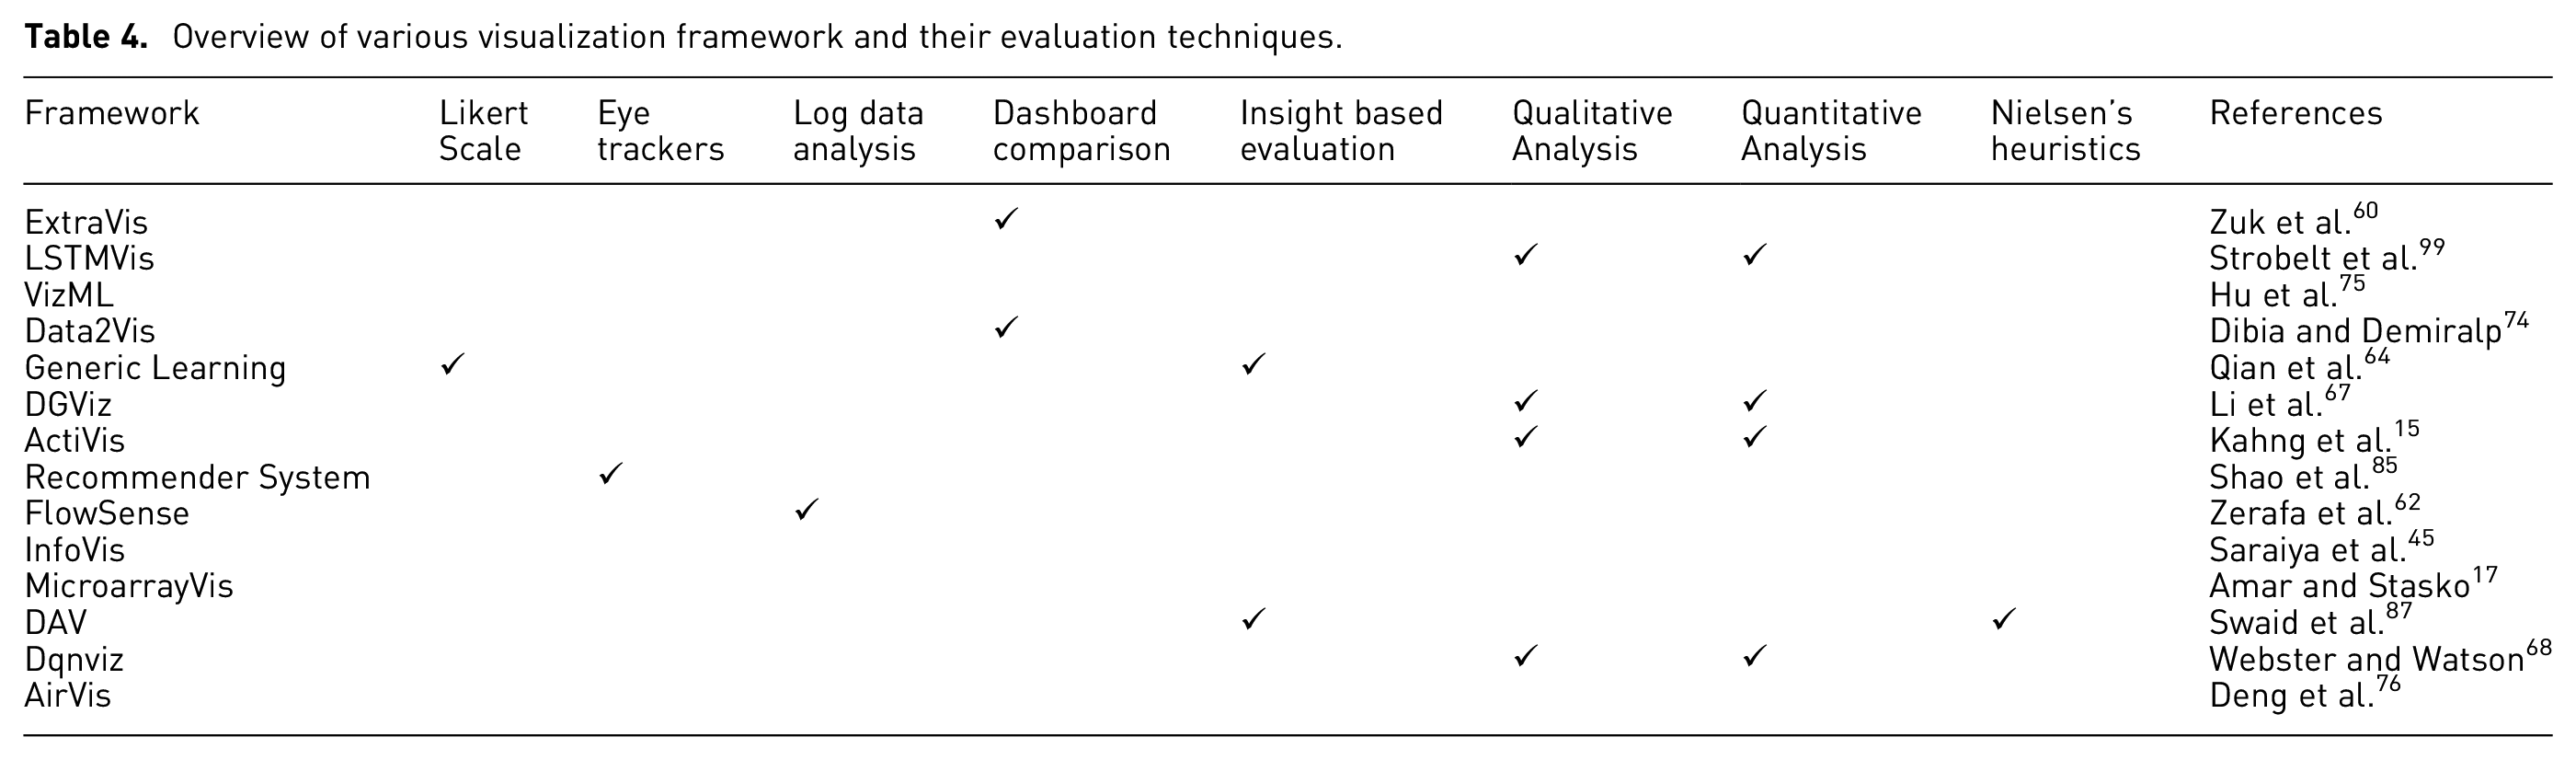
As the field of data visualization continues to evolve, researchers have introduced new methodologies and have engaged in extensive discussions on the utilization of specific evaluation methods. These advancements aim to make the evaluation of data visualization more accessible and user-friendly. Table 4 overviews these methodologies and their contributions to the field. Following a through evaluation of the literature, seven common situations of evaluation research were identified by Lam et al., 5 which provide a helpful overview. In addition, although evaluation might be a long and laborious process, there is a reasonable probability that essential solutions will be accepted and implemented in real-world scenarios.
Overview of various visualization framework and their evaluation techniques.
In our study, we analyzed the existing surveys in the field. Over the years, numerous evaluation systems have been proposed, as highlighted in Table 1. However, it is worth noting that several researchers have focused on applying single or multiple evaluation methods based on specific fields, rather than providing a systematic review of all the evaluation methods commonly used in the visualization field. Therefore, there is a need for a comprehensive survey that encompasses all the evaluation methods extensively applied in the visualization domain. This survey paper aims to provide a systematic review of evaluation procedures that are effectively applied in the field of VA. Despite being a topic of great interest among researchers, a comprehensive survey that demonstrates the strategies of evaluation methods remains somewhat elusive. While most researchers have utilized various evaluation methods for analyzing VAS, our survey paper takes a strategic approach by providing an overview of all significant evaluation methods. Our main objective is to offer a comprehensive and strategic understanding of the most important evaluation methods in the field of VAS, allowing readers to gain valuable insights at a glance.
Challenges
In the following, we outline vital insights into the challenges facing future research using the aforementioned evaluation techniques.
Future directions
In this article, various existing efforts related to the application of several evaluation techniques have been detailed from different perspectives. However, there are still gaps in the research that need to be addressed. Therefore, the following potential future research directions are proposed:
The protocols related to heuristic evaluation approaches demonstrate a concept for deploying a heuristic method that uncovers new insights in the field of heuristic evaluation. However, a heuristic evaluation questionnaire can be used to rate the assessment, using a five-point Likert scale.
The eye tracking data indicated that the users had difficulty extracting information from specific areas and frequently hunted for precise details in non-relevant regions of the screen. According to eye tracking evaluation data, a critical aspect is that the screen was too small. This limitation can be mitigated by exploring new strategies to extract user data.
Insight-based evaluation techniques are being increasingly used. It is challenging to acquire accurate insights and analyze them to evaluate a visualization system. Although humans rely on explainable evaluation methods, they interpret them to make decisions. Therefore, adding explainability to insights will make them more valuable. Researchers can explore new strategies and apply advanced technology to gain precise insights.
Heuristics might be redundant, inconsistent, or even context-specific, hampering the heuristic evaluation process. There could be flaws in its validation and there is a need for more rigor, robustness, and standardization in its analysis.
As new technologies continue to evolve in the field of visual analytics, it is crucial to evaluate their impact and effectiveness. 105 Further research can explore the utilization of established ES to assess the effectiveness of advanced technologies such as augmented reality, virtual reality, or natural language processing in visual analytics systems. Additionally, future studies can also investigate the possibility of combining and integrating diverse evaluation methodologies to enhance our understanding of these systems as shown in Figure 5.
Shneiderman and Plaisant 104 combine observation in the typical user environment, automated activity monitoring, and long-term involvement with researchers. Longitudinal research was not used as an evaluation approach in any of the papers in our research. So adapting new strategies to longitudinal studies will be a direction for future research.
Very few studies employed observational techniques to study how users interact with visualization systems where system interactions are logged and analyzed as part of the evaluation. Thus, several new directions for security visualization system evaluation and design are explored by logging and analyzing interactions.
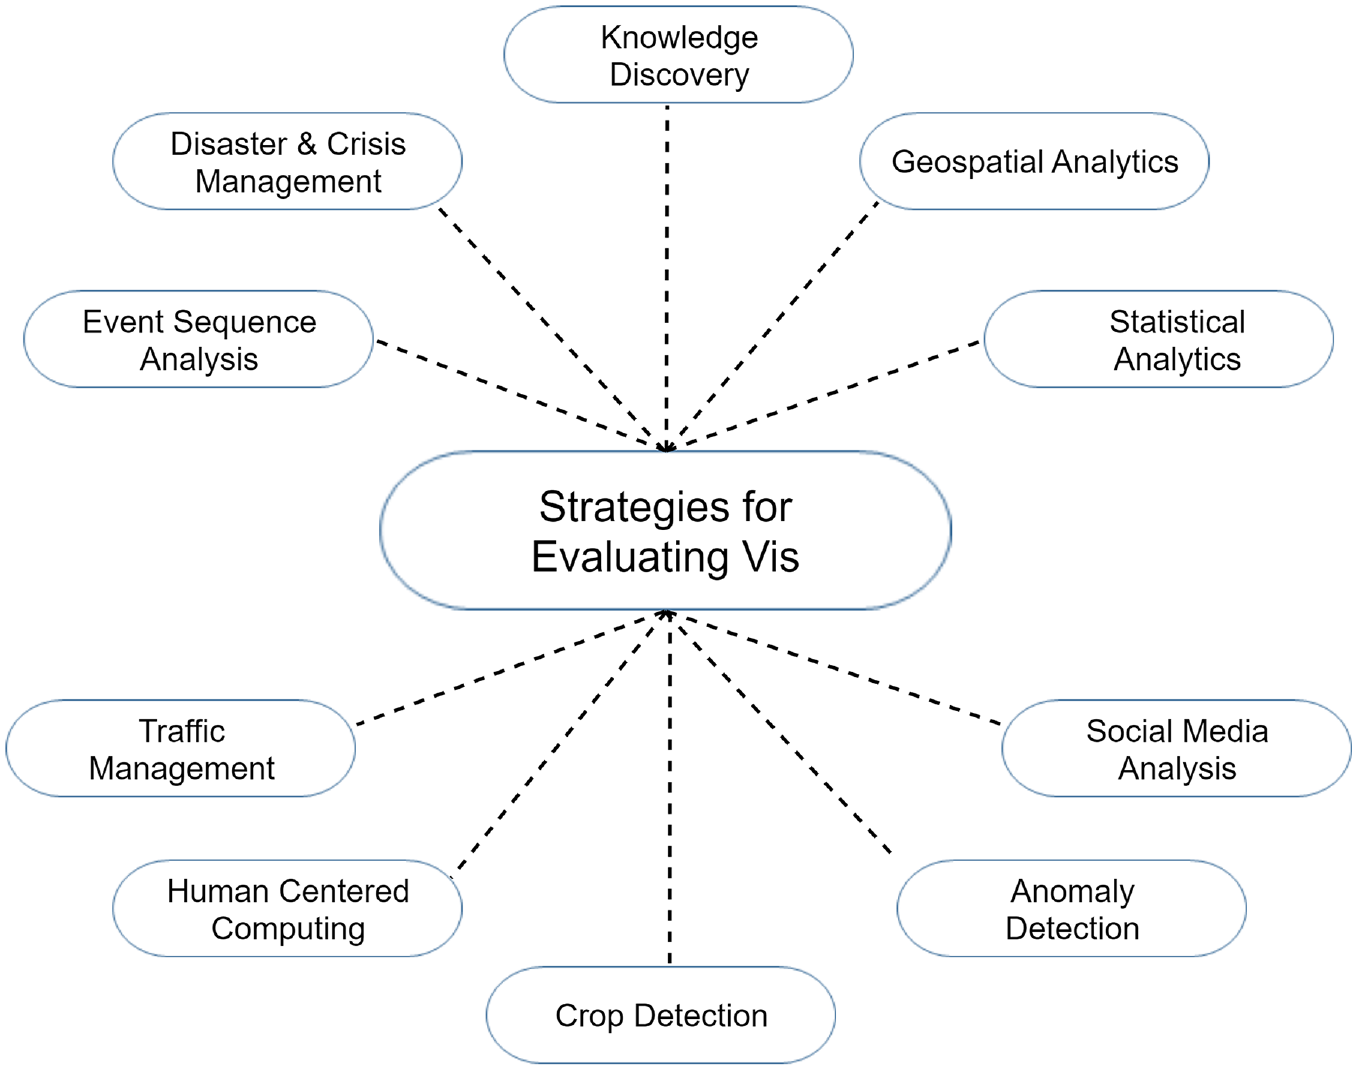
Miscellaneous applications of evaluating visualization system.
Conclusion
It is necessary to use novel evaluation methods to improve a visualization system’s development. Existing studies reveal that the general level of rigor of reporting evaluations needs to be improved. There needs to be a detailed discussion on how evaluation methods work in visualization research to significantly improve the impact of research results. Therefore, in this paper, we provide a comprehensive review with an emphasis on seven evaluation methods,namely (1) dashboard comparison; (2) insight-based evaluation; (3) log data analysis; (4) Likert scales; (5) qualitative and quantitative analysis; (6) Nielsen’s heuristics; (7) eye tracker. We investigated the limitations of these works and identified the open research challenges facing all seven methods. We also provided several future research directions.
In short, this study provides a comprehensive analysis of the various state-of-the-art evaluation methods and their implementation in different applications. This study will help enhance the current visualization system development landscape to solve multiple problems.
Footnotes
Funding
The author(s) disclosed receipt of the following financial support for the research, authorship, and/or publication of this article: We would like to acknowledge the financial support from the Australian Research Council (ARC) under Grant No. LE220100078 and DP220103717.
Data availability
No data was used for the research described in the article.