
Abstract
Comparing text documents is an essential task for a variety of applications within diverse research fields, and several different methods have been developed for this. However, calculating text similarity is an ambiguous and context-dependent task, so many open challenges still exist. In this paper, we present a novel method for text similarity calculations based on the combination of embedding technology and ensemble methods. By using several embeddings, instead of only one, we show that it is possible to achieve higher quality, which in turn is a key factor for developing high-performing applications for text similarity exploitation. We also provide a prototype visual analytics tool which helps the analyst to find optimal performing ensembles and gain insights to the inner workings of the similarity calculations. Furthermore, we discuss the generalizability of our key ideas to fields beyond the scope of text analysis.
Introduction
Comparing text documents for similarity is an important task since the similarity distribution within a corpus may give important insights to it, which could in turn potentially be used for a variety of applications, such as recommender systems, topic detection, plagiarism control, analysis of authorship of historical documents, semi-supervised machine learning, and others. However, comparing natural language text is an inherently complex and ambiguous task and many challenges therefore exist, mainly because similarity is an elusive concept that very much lies in the eye of the beholder. Several methods have been developed to tackle these challenges, including string-, corpus-, and knowledge-based approaches,1–3 for instance, and among these distributional word/text embedding technologies are especially interesting since they can handle semantic similarity and also be computationally efficient (if a pre-trained model is used). In this paper, we focus on the problem of finding similar articles within a large set of scientific publications. And to augment the quality of the similarity calculations, we propose a new method for combining several different embeddings. As we will show, this method could in turn be used to enhance and/or extend applications within fields such as Bibliometrics, Scientometrics, or Science Mapping, among others.
Embeddings are (often low-dimensional) numeric vector representations of complex and/or unstructured data, created in order to be suitable for computational analysis tasks such as clustering, classification, and similarity calculations. 4 The main goal of embedding algorithms is usually to produce embeddings where items that are similar in the original data set (according to some domain-specific aspect) are embedded into vectors that lie close to each other in the embedding space, with regard to some chosen distance metric. This makes embeddings highly suitable as input for computational analysis tasks such as clustering, classification, and similarity calculations since it is more straightforward to calculate a distance measure (such as Euclidean or cosine distance) with numeric vectors than it is with other types of complex and/or unstructured data.5–7 How well the embedding captures the underlying targeted similarity is crucial since poor quality embeddings will elevate the risk for poor quality results when used in any further calculations. Therefore, the search for new and better ways to embed different types of data has attracted a lot of interest in recent years. For some data types, such as graphs/networks and words/text, there exist several different algorithms, each with its specific characteristics and trade-offs.8–10 As a consequence, choosing the best embedding technology for a given application is an important and often non-trivial task. A straightforward way to handle this type of choice would be to: (1) choose a quality metric of importance for the current application, (2) evaluate all algorithms on this metric on a representative data set, and then (3) choose the one with the highest score. This intuitively appealing strategy provides a deterministic way for an optimal single-component choice and is in line with the existing works.11–13 However, one might also consider an alternative approach inspired by the question: “Would it be possible to combine several different embedding types as a means to achieve higher quality?”, and this is the path that we will explore in this paper. Our starting point for this new approach is the observation that ensemble methods (i.e. different strategies for combining the results from several classification algorithms) are a well-established and powerful means for augmenting the quality of the results for supervised classification problems.14,15 Hence, if a similar methodology could be applied to embedding-based similarity calculations, this approach could hold the potential to achieve state-of-the-art results and outperform any of the single embeddings taken on its own.
Since both embedding calculations and ensemble methods typically involve intricate computational models (i.e. neural networks or computational optimizations), our problem domain is clearly related to the general challenges of interpretability, explainability, and trustworthiness in machine learning (ML) and artificial intelligence (AI).16–19 One strategy proposed for these challenges is to make use of perceptual and cognitive abilities of human analysts, allowing them to construct and interact with ML models through the means of interactive visual analytic (VA) solutions.20–23 In particular, several VA approaches focusing on exploration or comparison of individual embedding algorithms have been discussed in the literature, including the works by Smilkov et al., 24 Park et al., 25 or Ji et al., 26 for instance. Inspired by these ideas and also by the general ideas of VA27,28 we have attempted to bring the human into the process by developing a prototype VA tool which provides a visual representation of the optimization process29,30 and also displays specific directive guidance. 31 The use of the tool gives direct insights to the inner workings of the similarity calculations, and hence it supports the construction of a mental model of this complex process.32,33 Our hope is therefore that our work will also contribute to the field of human-centered AI in the sense that it opens up the “black box” of ML a little bit and thus enables better understanding and higher trust.
The main contributions of our work are:
a novel way to apply ensemble methods to embeddings which can be used as a means to improve the quality of embedding-based similarity calculations; and
a VA tool, called EEVO (see Figure 1), that guides the search for better hyperparameter settings and allows the analyst to build a mental model of the inner workings of the ensemble calculations.
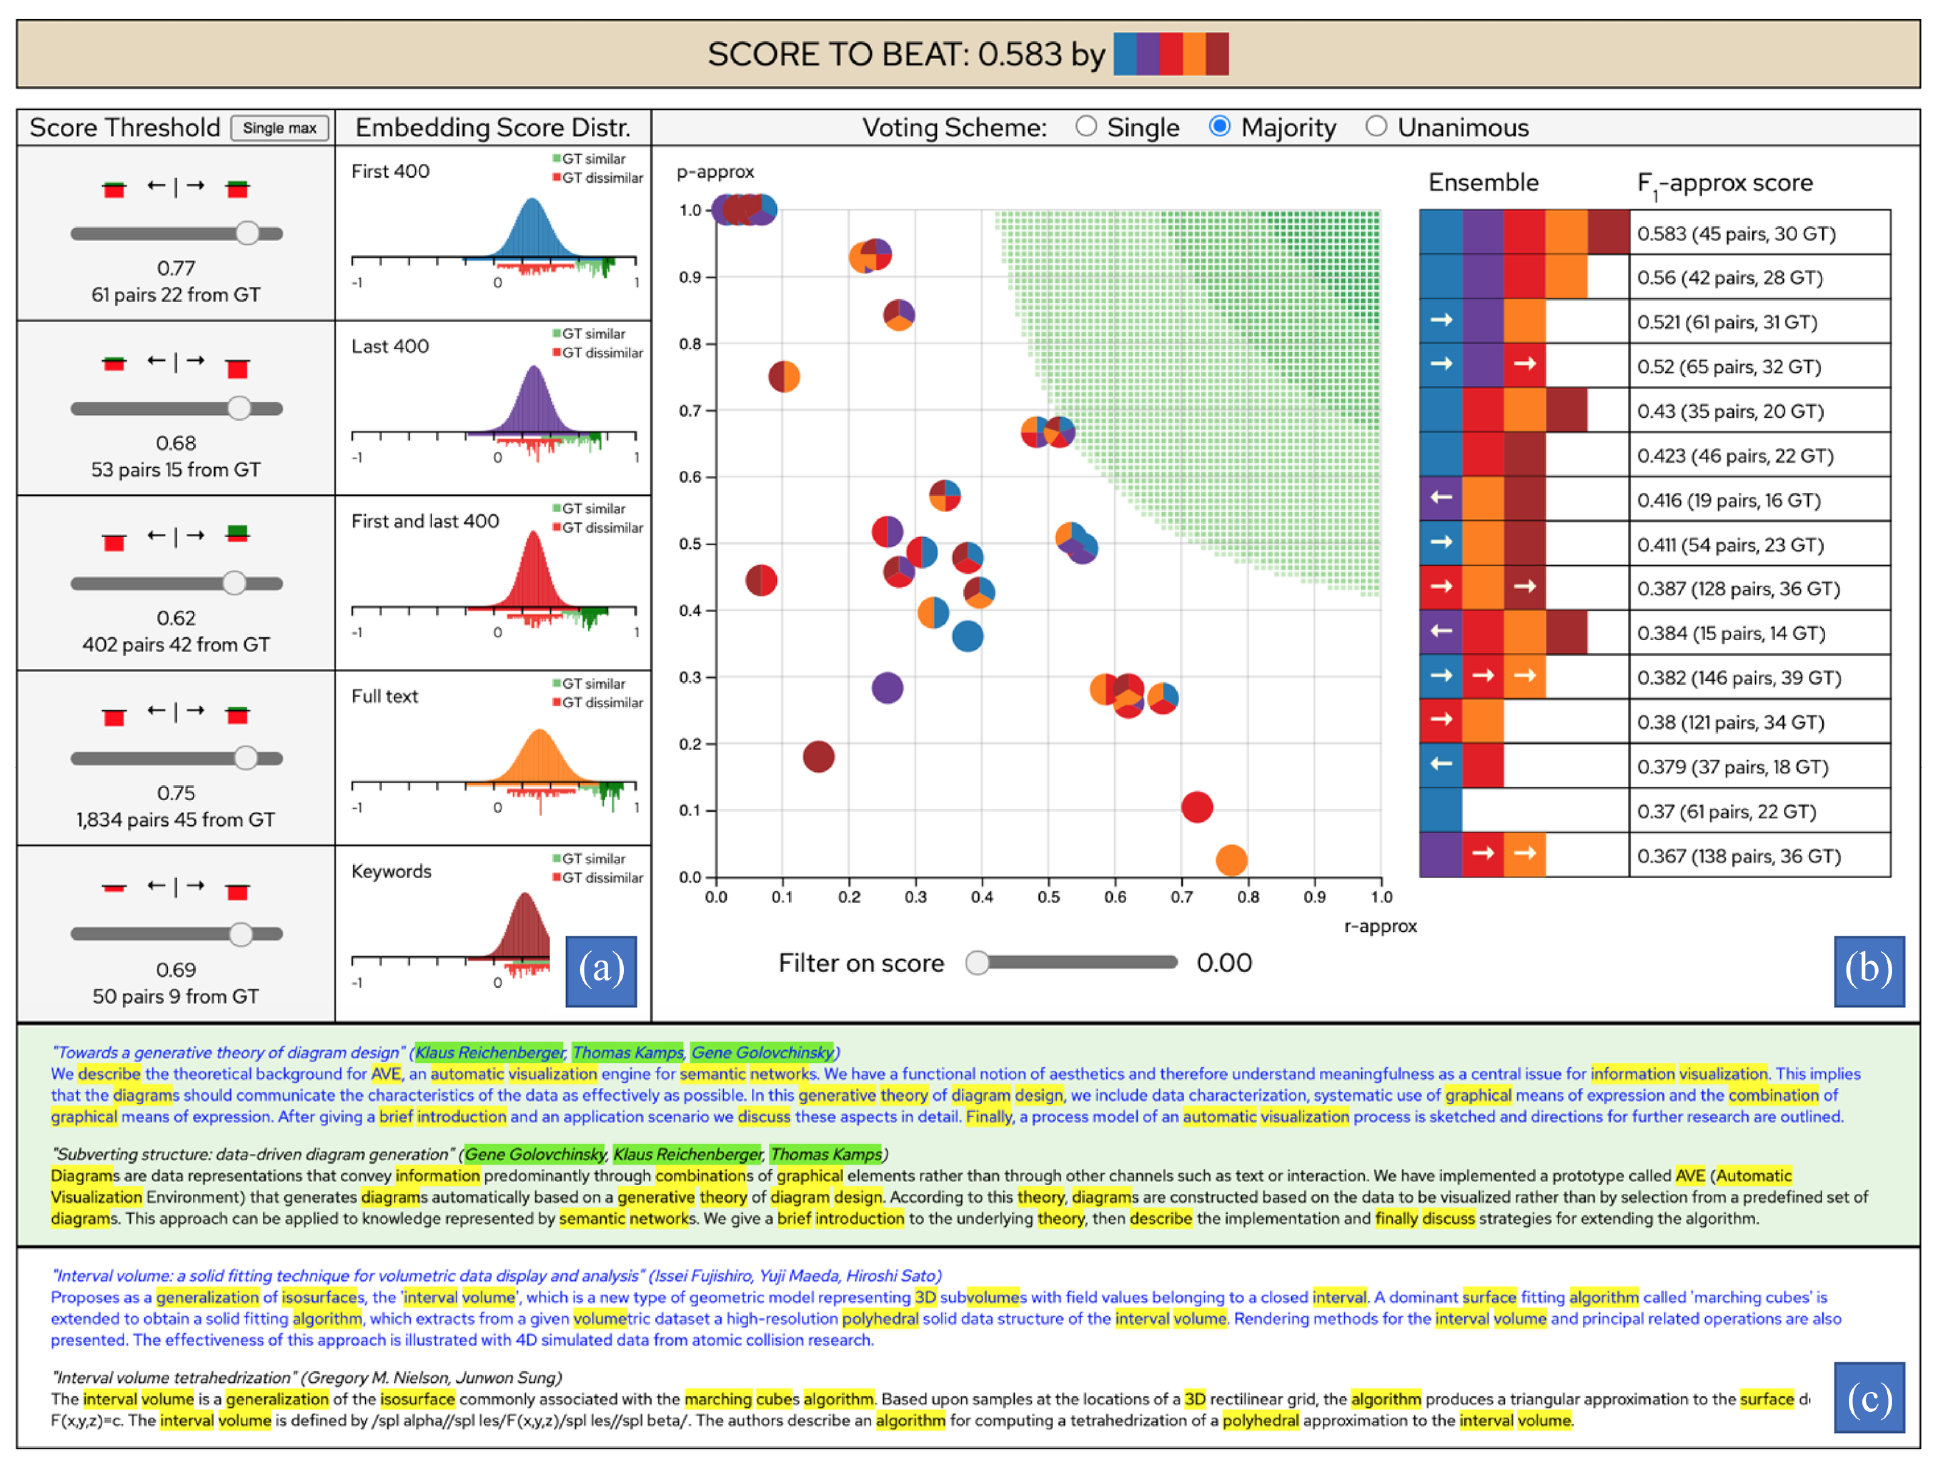
Using the EEVO tool to visualize the performance of embedding-based ensembles conducting text similarity calculations on a large set of scientific publications (see further Section Visualization). In the left view (a), called Embedding View, the similarity score thresholds can be adjusted and the corresponding results of the single-embedding similarity calculations are displayed. In the right view (b), the Ensemble Performance View, a voting scheme can be selected and the performance scores of the ensembles are displayed, both in a scatterplot and in a highscore table. In the bottom view (c), entitled Similarity Assessment View, the texts that have been classified as similar can be assessed and compared in a close-reading fashion. By using the visualization, the analyst can gain insights to the optimization process that could not have been obtained if a purely computational approach had been used.
Furthermore, the generalizability of our method is promising since the general ideas could be used for any embeddable data type, as we will discuss in the final section of the paper.
The rest of this manuscript is organized as follows. In Section Related Work, we discuss the relevant work on both the underlying computational analyses as well as existing VA approaches relevant to our problem. We describe the general methodology and specific tasks supported by our proposed approach in Section General Methodology and describe the data set and the computational steps in Section Data Set and Process Steps. In Section Visualization, we present our proposed visualization approach, and the results of our user study are presented in Section Evaluation. Finally, in Section Discussion and Conclusions, we present the outcomes and limitations of this work as well as the opportunities for future work.
Related work
In this section, we present previous research that is related to our work.
Word and text embedding
In general, word embeddings are distributed representations obtained from unsupervised training of a deep learning model on some large corpus of natural language text.4,34–37 By using a large amount of training data to predict words given a specific context (or vice versa), the model will be able to learn semantic similarities of word pairs, for example, good is similar to super, and bad is similar to awful. The algorithm then projects such similar word pairs to embedding vectors that lie close to each other in the embedding space.10,12 This ability to group together words with similar meaning can then be exploited for advanced tasks such as, for instance, text alignment.38,39 Arguably, the single most influential word embedding technology is Word2Vec, which was introduced in 2013, 40 and the current state-of-the-art is the BERT model. 41 There are different approaches on how to use word embeddings to obtain embeddings for sentences or paragraph-sized text, 42 starting from the intuitive (but limited) approach to take the average of the embeddings of each word in the text. However, sophisticated approaches are needed in order to exploit the syntactical structure of sentences, which is crucial to do since the same set of words may be arranged to form sentences with very different meanings and the same word may have different meaning depending on the context. 43 More specifically, this means that many words will need to have several different embeddings so that a context-dependent choice can be made for each situation. 44 To achieve this, the use of deep learning models is a popular choice, and approaches have, for example, been developed for recursive neural networks, 45 convolutional neural networks, 46 and recurrent neural networks. 47 Arguably, the current state-of-the-art technology for text embedding is the Universal Sentence Encoder (USE), 48 but the previously mentioned BERT algorithm also works for text of sentence length. Both of these can be downloaded as generically trained models which, if needed, can be further fine-tuned on domain-specific corpora. The models can be used as “black boxes” in the sense that they can be fed text to return an embedding vector that tries to capture the semantic meaning of the whole sentence or paragraph.
Ensemble methods
Ensemble methods are a well-studied and successful field of classification optimization. The main goal is to find a combination (called an ensemble) of several classifiers that provides better results than any of the individual classifiers taken on its own.14,15 The bagging approach 49 involves classifiers of the same type of algorithm that are trained in parallel, and the final combined result is obtained by applying a deterministic algorithm (e.g. average or majority vote) to the set of individual predictions. In contrast, the boosting approach 50 involves classifiers of the same type of algorithm that are trained in sequence, where each misclassification is given a higher weight of importance for the next training round. Hence, classifiers added late to the ensemble will have put more focus on correctly classifying items that were misclassified by early added classifiers. In this way, the total ensemble will be actively steered toward having the potential for correctly classifying a major part of all the items. The final combined result is obtained by taking a linear combination (inversely weighted by the error of each classifier) of the individual results. Another alternative approach is stacking 51 : classifiers of different types of algorithms are trained in parallel, and the final combined result is obtained by applying a deterministic algorithm to the set of individual predictions or by using this set to train a meta-model for making the final decision.
Ensemble methods for embeddings
The existing work within this field is mainly focused on: (1) the task of combining word embeddings obtained from different models and/or different text corpora52,53 and (2) on enhancing existing word embeddings with specific domain knowledge. 54 The aim of these methods is to leverage the information from all input sources and produce a new set of word embedding vectors with the potential to outperform the original set(s).
Visual analytic methods
Previous information visualization (InfoVis) and VA contributions have provided guidelines for designing, implementing, and evaluating interactive solutions that allow users to gain and externalize knowledge32,33 about data and complex computational analyses. Such approaches often rely on individual or multiple interactive views55,56 designed to facilitate certain user tasks, 57 including comparison, 58 provenance, 59 and guidance, 31 among others. The existing work in InfoVis and VA covers multiple techniques supporting various data types, including texts60–62 and graphs/networks,63,64 and various applications, including the analyses of social media 65 and scientific publications, 66 for instance.
One core idea of VA is the involvement of human analysts in complex computational analyses via interactive user interfaces. The necessity for such human-in-the-loop approaches was recognized decades ago, for instance, by the operations research community, 67 and applied for the tasks associated with combinatorial complexity, 68 human-guided search, 69 and multiple criteria decision making 70 ; the survey by Meignan et al. 29 covers this field of interactive optimization methods in operations research. Some of the relevant contributions for this problem originated from the VA community, including the visual optimization techniques for RFID benchmarking by Wu et al., 71 visual multiobjective optimization approaches by Berger et al.,72,73 and hybrid visual steering technique for simulation ensembles by Matković et al. 74 Further review of visual analytic methods for interactive optimization is provided in the recent work by Hakanen et al. 30 Our work shares the idea of involving the human analyst in the interactive search for optimized configurations via VA. But in contrast to the approaches discussed above, our work has a focus on different models and tasks, discussed next.
Recently, the attention of the VA research community has been drawn to the various problems in ML.20–23,75,76 More specifically, VA approaches have been applied for the results of embedding calculations and also for the purposes of understanding such embeddings better. For instance, Embedding Projector 24 applies dimensionality reduction (DR) methods to display a projection plot for embedding vectors while allowing the users to search and inspect the underlying data items in the original space. Several other existing approaches directly relate to the tasks of text and document visualization as well as visual text analytics, the research subfields concerned with representation of textual data and results of text mining approaches, as discussed by Kucher and Kerren 60 and Liu et al. 62 The more traditional text visualization approaches mentioned in the respective surveys have been joined during the past years by the approaches that either use word or text embedding features in order to arrive at a suitable visual mapping, or treat the embeddings themselves as the study objects. For example, cite2vec by Berger et al. 77 focuses on the particular task of interactive citation-driven document collection exploration that is based on joint word-document embeddings. ConceptVector by Park et al. 25 allows the users to construct lexicon-based concepts for text analysis purposes, which involves interaction with the output of one of the supported word embedding algorithms. Another relevant application for document collection analysis is discussed by Ji et al., 26 who make use of a paragraph embedding approach in their VA system. Word Embedding Visual Explorer by Liu et al. 78 focuses on the investigation of semantic relationships in word embeddings; this approach is supplemented by a case study with a comparison of embeddings produced by two algorithms, Word2Vec 40 and GloVe. 79 Liu et al. 80 discuss Latent Space Cartography, a more general approach for interactive analysis and interpretation of latent spaces and distributed representations, which includes the task of comparing latent space variants (i.e. embeddings), among others. embComp by Heimerl et al. 81 allows the user to explore word similarity between two different corpora, or for the same corpus embedded by two different methods, by analysis of nearest neighbors within the two embedding spaces. Finally, Parallel Embeddings by Arendt et al. 82 support exploration and comparison of clusters and cohorts of embedded data over time. While the contributions discussed above provide an important foundation for visual analysis of embeddings, we focus on investigation and comparison of not only individual embeddings for the given data sets, but rather ensembles of multiple embedding types used for joint decision making. Here, we should acknowledge the existing works discussing VA support for ensemble learning, including EnsembleMatrix by Talbot et al., 83 the workflow discussed by Schneider et al., 84 StackGenVis by Chatzimparmpas et al., 85 and ExMatrix by Neto and Paulovich, 86 for instance. However, these approaches address construction of ML model ensembles for tasks such as classification, while the focus of our proposed approach is on investigating ensembles of embeddings for similarity calculations.
Text similarity calculations
While the problem of calculating text similarity can be approached at different scopes and from different perspectives, 3 there are two major subgroups of methods for calculating the similarity between two text documents that are of interest for our work: word-based and embedding-based. The main advantage of the word-based group is that it is conceptually simple and easy to implement, while the main disadvantage is that pre-processing of the text is usually needed and that semantic similarity is not supported. The main advantage of the embedding-based group is that it can handle semantic similarity and exploit syntactical structure, while the main disadvantage is that they are complex to implement and require substantial training. (The disadvantage of training can however be alleviated by using pre-trained models.) One of the earliest word-based methods is the Jaccard index/similarity 87 which is calculated by dividing the number of unique common words by the total number of unique words. A more sophisticated, and very popular word based method, is the TF-IDF-method 88 in which a vector representation of the text is created with a dimension for each unique word in the corpus and with the values calculated as the fraction [the number of occurrences of the word in the document]/[the number of occurrences of the word in the corpus]. The similarity score can then be calculated by using the document vectors, for instance by calculating the cosine similarity value.
As already mentioned in this section, most embedding based text similarity methods make use of some form of deep neural networks to compute a vector representation of the text, and a similarity metrics of choice can then be calculated by using the embedding vectors.
General methodology
The main goal of our method is to combine several embeddings (of the same underlying data) with the aim to achieve higher quality in the similarity calculations than what would have been possible if using only a single embedding. As previously stated, we intend to use ensemble methods for this, but since ensemble methods are intended for item classification problems (and not for similarity calculations) we first need to adapt the main ideas to fit our purposes. We first make this adaptation in a general scope (i.e. not only targeting text embeddings), and we then end this section by relating this back to our specific problem of text similarity.
Although similarity calculations using embeddings are not equivalent to item classification problems (since the former is a way to score a relation, and the latter is a way to classify an item), there are some resemblances that we will exploit to make our adaptation. First, we note that similarity calculations over a set of embeddings typically assign similarity scores to all item pairs in the set, for instance by calculating the cosine similarity value for each pair. Second, we observe that a common way for applications to exploit the similarity scores is to introduce the concept of similarity score threshold(s) that divides the set of all item pairs into (at least) two subsets depending on how similar/dissimilar they are. We may therefore regard a similarity calculation with a single similarity score threshold as a classification of a pair of items into one of the two classes, similar and dissimilar. Loosely speaking, we may view this as creating a new set (where the items to classify are all possible item pairs from the original set) and then performing binary classification on these new items. Based on this reasoning, we therefore conclude that: (1) if it is possible to obtain different embeddings for the same underlying data item (e.g. by using different algorithms or by using the same algorithm with different hyperparameter settings), then (2) it should be possible to combine these different embeddings by ensemble methods to yield a combined result for the similarity calculations. In other words, our proposed methodology is to use several different embeddings to calculate several similarity scores (for a given item pair) and then combine these scores to obtain a final classification. For instance, a straightforward way to combine the results of several embeddings would be to use the concept of bagging (outlined in Section Word and Text Embedding) and to apply a majority voting scheme. This combined result would then, hopefully, have the potential to outperform similarity calculations using any of the contributing embeddings by themselves (see Figure 2 for a generic example). Furthermore, we note that the choice of a specific combiner function and the score threshold values act as hyperparameter settings for the ensemble calculations. Hence, trying to achieve the highest possible quality would be equivalent to searching for the best-performing hyperparameter settings for the ensemble calculations. Finally, we need an equivalent to the training step, during which the ensemble performance is evaluated against sets of already correctly labeled (i.e. correctly classified) training and verification data. The goal for this step is both to obtain a high performance score on the training data and, equally important, to obtain a good generalizability to previously unseen data. As an equivalent to the labeled training set, we introduce the concept of a “ground truth” (GT) set which we use for the performance evaluation (see Section Data Set and Process Steps). It contains a limited number of pairs which have been verified by the analyst to be similar. Hence, finding the best possible hyperparameter settings with regards to the GT set is, in essence, equivalent to the training process. Furthermore, giving the analyst the possibility to provide examples of “true similarity” within the current corpus is a key factor for giving the human more control and achieving “real world” quality. That is, we balance the computational-centered approach of “These items received a high similarity score and therefore we classify them as similar” with the more human-centered and real-world-quality-centered approach of “These items are similar and therefore they should receive a high similarity score”.
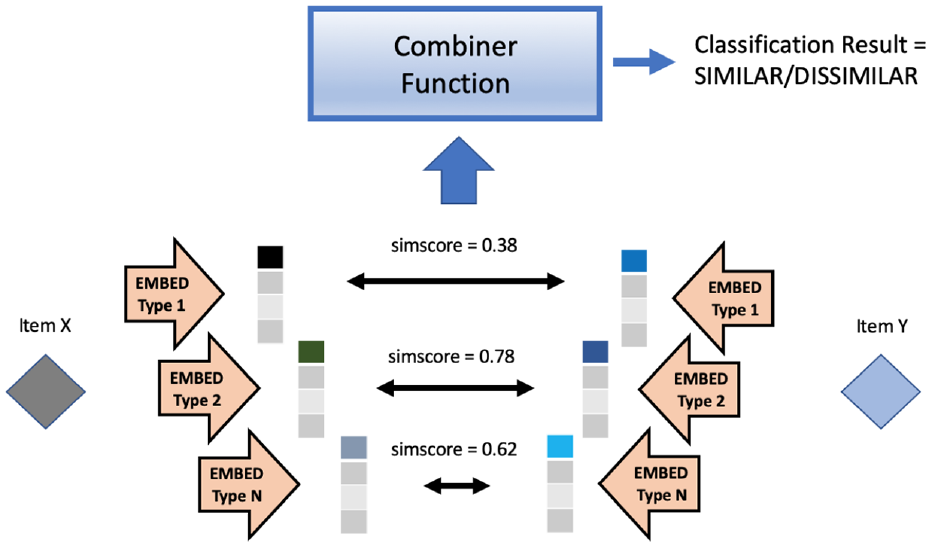
A generic example. The underlying data items are embedded in several different ways (i.e. by using different algorithms or by using the same algorithm with different hyperparameter settings) and the pairwise similarity scores are calculated for each embedding type. The scores are then combined to yield a final combined classification of similar or dissimilar. The combiner function can range in complexity from a simple voting scheme up to a separately trained machine learning model.
We end this section by relating the generic adaptation, described above, back to our specific problem of finding similar articles in a large set of scientific publications (see Figure 3). Keeping in mind that our main goal is to explore the benefits of using several embeddings (instead of only a single one) our process can now be outlined as follows: (1) embed the text from each article in several different ways, (2) create a GT set of article pairs which have been verified as being similar/dissimilar, and (3) find a way to determine which embedding combination, which score thresholds, and which combiner function to use to achieve the highest possible quality for the similarity calculations. (The specific steps of the process will be specified in more detail in the next section.) When this process is finished, we have “trained” an optimal ensemble configuration which will hopefully generalize well to the whole data set, or even to an extended data set of the same type of documents. Furthermore, we expect this ensemble to also be suitable for finding similar article pairs that do not belong to the GT set (which is the main goal since those of the GT set are already known). In other words, similarity is defined by the article pairs in our GT set, and the process seeks to build a classifier that generalizes this knowledge in the best possible way. This ensemble configuration could then in turn be used for classification within a larger application that seeks to exploit text similarity (for instance, a recommender system for scientists that would be able to recommend similar articles from a chosen publication of interest). This final step is however beyond the scope of this paper since our focus lies specifically on augmenting the quality of the similarity calculations.
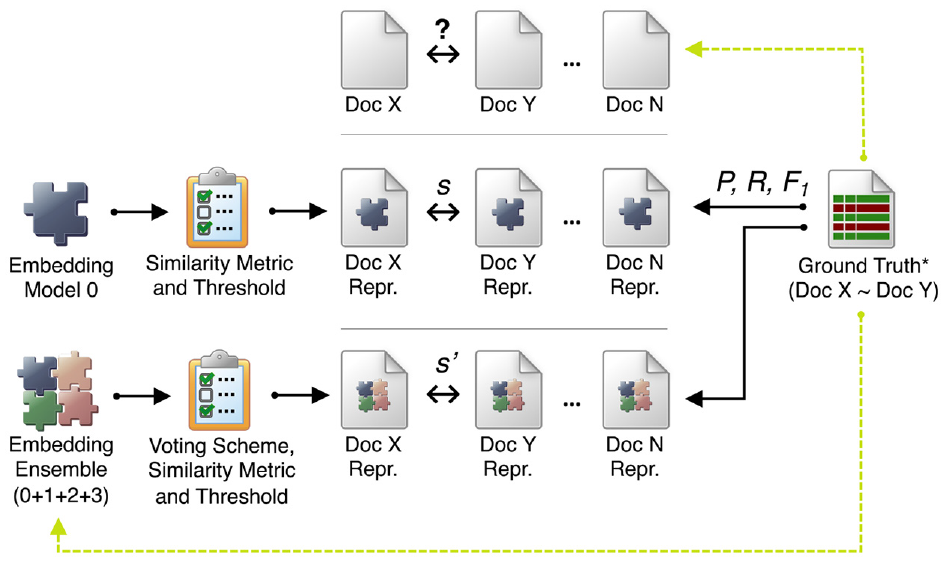
An example of calculating and evaluating similarity with individual embeddings and embedding ensembles for text documents. To assess similarity of documents X and Y, we compute vector representations based on a particular embedding model (e.g. USE or BERT for the first 1000 words of the document text), and then compute a particular similarity score s, for example, by calculating cosine similarity. Instead of a single embedding model, we might combine the results from several models (an embedding ensemble) and thus obtain another similarity score value s’ for the same pair of documents. In order to compare the results, we annotate a small sample of the document pairs data as the ground truth (GT) set, which allows us to reason about the performance of particular individual embeddings or ensembles (the GT set is a (small) subset of the complete set of document pairs, hence the asterisk in the figure). The chosen embedding (ensemble), combined with the chosen threshold of the similar/dissimilar decision, could then be used to explore the rest of (unlabeled) document pairs.
Data set and process steps
In this section, we outline the step-by-step process that we apply to our data. This process is in turn partly supported by the EEVO tool, which will be presented in detail in the next section. We employ the IEEE VIS data set 89 which contains information of articles published at the IEEE VIS conferences. The choice of the data set is motivated by its quality, visibility in our research community, and our own familiarity with its topic. From this set we have extracted roughly 3000 articles published during the period 1990–2018. We use the text from the article abstracts since: (1) it captures the essence of the article content and (2) similarity/dissimilarity between abstracts is expected to generalize well to similarity/dissimilarity between the corresponding publications.
Step 1: Embed the data
We embed the text of each abstract in five different ways by using USE 48 on different parts of the text, as described below. Hence, the variation between the embeddings is due to which part of the underlying text that has been fed into the embedding algorithm. The assumption is that the more semantically similar a pair of abstracts are to each other, the higher the similarity score that is yielded by their corresponding embedding vectors. When developing the tool we also tried embedding the text with the BERT model, but our tests showed that ensembles of USE embeddings only were performing better than mixed USE/BERT ensembles or pure BERT ensembles. However, for clarity, it is important to point out the methodology allows for mixing embeddings from any combination of algorithms for paragraph-sized text embedding (cf. Figure 3). Furthermore, we also want to point out that the focus of our work is on ensembles of embeddings rather than new or improved embedding algorithms themselves; and thus we have not performed any corpus-specific retraining or fine-tuning for any of our used models. Nevertheless, as can be seen in our provided use case, these generically trained models are still able to find pairs with high semantic similarity for our corpus, which is a promising sign for the generalizability of our method. For corpora where a generic model is not performing well enough, the option of domain-specific fine-tuning could therefore be used to further augment the quality.
Type 1– Embed the first 400 characters of the text and thus capture similar beginnings, but ignore everything else.
Type 2– Embed the last 400 characters of the text and thus capture similar endings, but ignore everything else.
Type 3– Concatenation of Type 1 and Type 2. Capture abstracts with similar beginnings and similar endings.
Type 4– Embed the full text and thus capture overall similarity, but with the risk of being “diluted” in the sense that it becomes more and more challenging to capture “a single meaning” as the text grows longer.
Type 5– Embed keyword sentences extracted from the text and thus capture overall similarity, but with the risk of the keywords not being representative.
The rationale for this partitioning of the text is that there is often an implicit structure regarding what is written in the beginning and what is written at the end of an article abstract, and therefore this structure could (at least in theory) be exploited in our calculations. Furthermore, the limit of 400 characters (which is a somewhat arbitrary choice) has been set in relation to the average length of the abstracts, which is just below 1000 characters (or roughly 150 words in about 8–10 sentences). Setting it as a fixed limit instead of a relative limit in percentages alleviates the problem of ambiguity if a much shorter text is being compared to a much longer one.
Step 2: Calculate the pairwise similarity scores
We calculate the cosine similarity score (which lies in the interval
Step 3: Create a GT set
To be able to assess and compare the quality of the similarity calculations we need to have some a priori knowledge of article pairs that are similar/dissimilar. We therefore create a small GT set consisting of 58 sampled pairs that are verified to be similar and 58 pairs that are verified to be dissimilar. (Coding was carried out by two authors of this article and they agreed on the labeling of all pairs. Sampling was made by selecting pairs with top/bottom similarity scores from the single-embedding calculations in Step 2 above.) The rationale for using such a small GT set (i.e. 116 sampled pairs out of a total of almost 5 million possible pairs) is that we want to specifically demonstrate that our method can be used for real-world scenarios with very little a priori knowledge. However, the larger the GT set, the more accurate the quality can be calculated and assessed.
Step 4: Calculate single-embedding ensemble performance
In this step, the single-embedding ensemble performances are evaluated to obtain a benchmark for the coming multiple-embedding ensemble calculations. In order to make performance ranking of the ensembles possible, we first need to choose a quality metric that is adapted to our specific problem and makes good use of our very limited GT set. Since we are searching for similarity, and we have reason to assume that it is sparse within the set of possible pairs (i.e. we expect most of the article pairs to be dissimilar), it is a reasonable strategy to favor ensembles that (loosely speaking) “Correctly classifies as many as possible of the similar pairs of the GT set, but still keeps the total set of pairs classified as similar small.” The main reason for keeping this set small is the overall sparsity of similarity which implies that, all other things equal, a larger set has a higher risk of having a higher fraction of false positives than a smaller set. Since this, more formally, translates to having a balance between recall and precision we have opted to use the
For calculating the
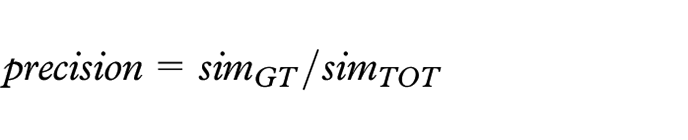
Here
Set the starting similarity score threshold for the embedding to 1 and the granularity of the steps to 0.01.
Pairs with scores above or equal to the current threshold are classed as similar, and the others are classed as dissimilar. Check the current classification result against the GT set and calculate the current
Decrement the similarity score threshold by 0.01 and return to the previous step.
When finished (i.e. arrived at threshold −1) the maximal performance of the current embedding is the maximum of all the yielded
When max performance has been calculated for all embedding types: the maximal
This benchmark represents the best possible result that we can achieve with a single-embedding strategy (for our chosen metric) and by calculating it we answer the question “If we could use only one of the embedding types for the task of classifying articles pair on similarity, which one should we choose?.” Thus, if we can find a multiple-embedding ensemble that performs better than this, we would have sustained the claim that ensemble methods can work also within the field of embedding-based similarity calculations. As a final note, we would like to point out the fact that the process remains essentially the same even if another quality metric than the
Step 5: Search for optimal ensemble configuration
This process step is the main focus of the EEVO tool, and it will be covered in greater detail in the next section. The aim of this step is to determine: (1) which embeddings to combine, (2) which score thresholds to set, and (3) which combiner function to use to achieve the highest possible quality for the similarity calculations.
Visualization
In this section, we give an overview of our proposed interactive visual analysis tool, called EEVO, by showing how it can be used for our data set. EEVO is implemented as a web-based tool using D3 90 and makes use of embeddings computed via the Google Colab platform. 91 As mentioned before, the rationale for providing a visualization for the optimization process is that similarity is an elusive concept which very much lies in the eye of the beholder and is hard to capture by purely computational methods. Furthermore, by visualizing the process, the analyst can get important insights to the inner workings of the similarity calculations and therefore in turn tune the process better to meet the current needs. A generic example of this is shown in Figure 4.
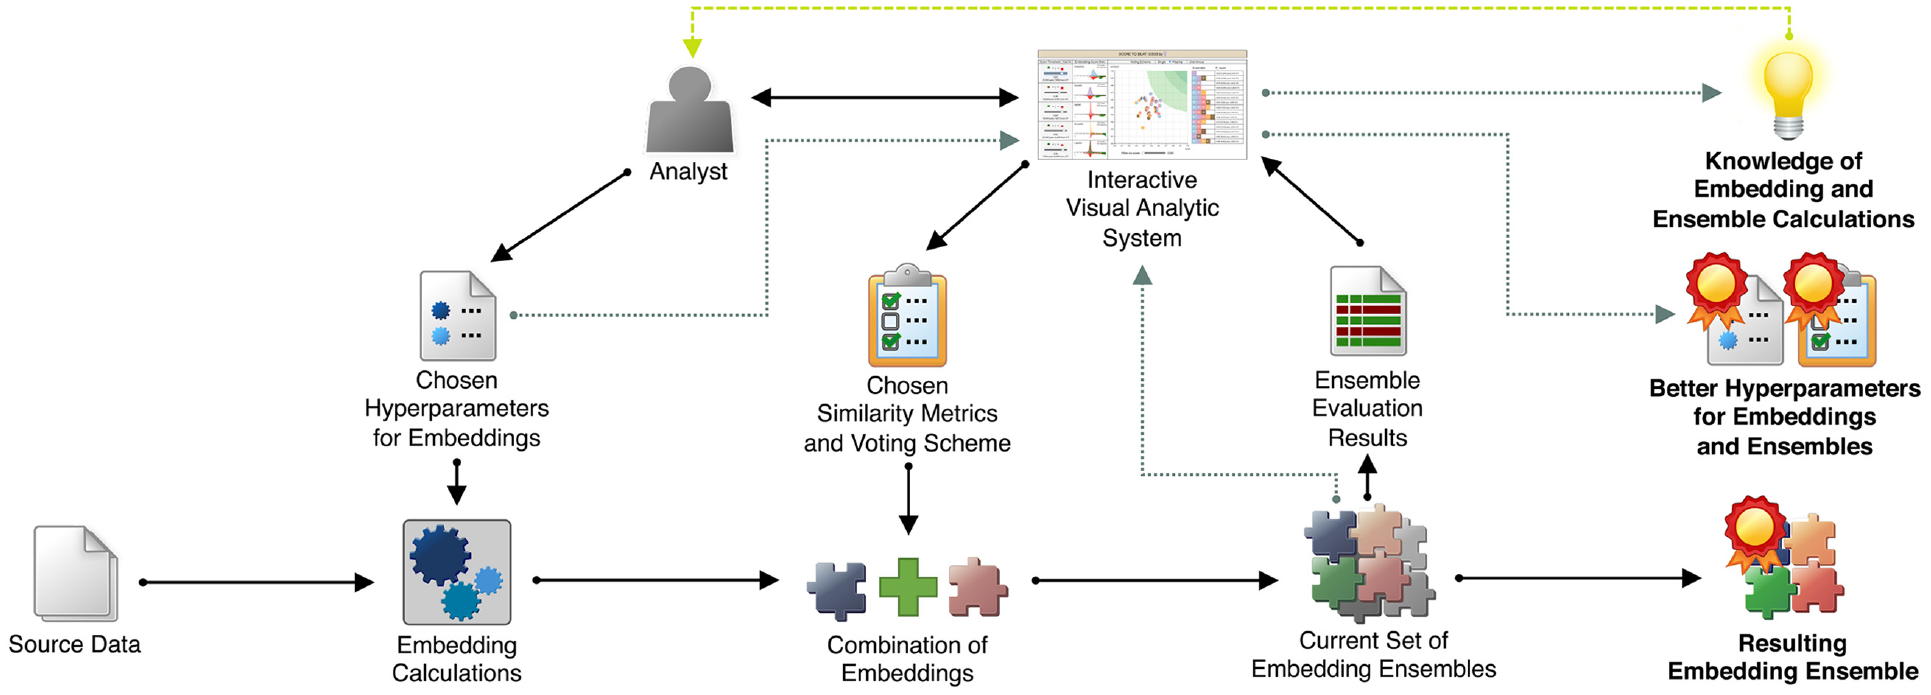
Using a visual analytic approach, the analyst can combine multiple embeddings computed for the given data and investigate the performance of the ensembles with regards to the specified metrics and the voting scheme. This leads to better-performing embedding ensembles, better hyperparameter settings, and improved knowledge of – and trust for – embedding calculations and ensembles of embeddings. Dashed and dotted edges represent indirect interactions.
Since we are loading five different embedding types into the application (see Section Data Set and Process Steps), this means that we will have a total of
Single– A pair is classified as similar if at least one of the embeddings in the ensemble has classified it as similar.
Majority– A pair is classified as similar if more than half of the embeddings in the ensemble have classified it as similar.
Unanimous– A pair is classified as similar if all embeddings have classified it as similar.
As can be seen in Figure 1, the visualization interface of EEVO consists of three main views: (A) the Embedding View, (B) the Ensemble Performance View, and (C) the Similarity Assessment View (displayed on demand by clicking a statistics cell in the highscore table). In the Embedding View, the embedding score thresholds can be set, and the corresponding classification statistics can be assessed directly under the sliders. In the Ensemble Performance View, the voting scheme can be selected, and the ensemble performance is displayed on a scatterplot (which can be filtered using the “Filter on score” slider) and in a high-score table. The ensembles are represented by circular multi-colored glyphs in the scatterplot and by multi-colored rectangles in the high-score table. The color encoding (i.e. categorical attributes) corresponds to the colors of the participating embeddings. For instance, an ensemble that consists of the blue, red, and purple embeddings will have these three colors on its glyph and on its high-score rectangle. The glyphs are plotted with regards to the ensembles current precision (y-axis) and recall (x-axis). This means that the higher the
When EEVO is loaded, all similarity score thresholds are put just above the score of the highest scoring pair for each embedding, and therefore all pairs start out by being classified as dissimilar (see Figure 5). When updating the hyperparameter settings (i.e. the similarity score thresholds or the type of voting scheme), the performance scores of all possible 31 ensembles are continuously updated, so that the analyst does not need to make an active selection on which ensembles to track. The design of EEVO is intended to facilitate the construction of a mental model of the transformation of single-embedding classifications (on the left-hand side) to the resulting ensemble classifications (on the right-hand side). An example of this can be seen in Figure 1, where the number of pairs classified as similar is much higher for some of the individual embeddings (see the numbers below the sliders) than for the combined ensemble results (see the numbers in the high-score table). This is due to the fact that we are using voting scheme “Majority” as combiner function, and it has a filtering effect. Using a different voting scheme would, of course, have yielded a different result.
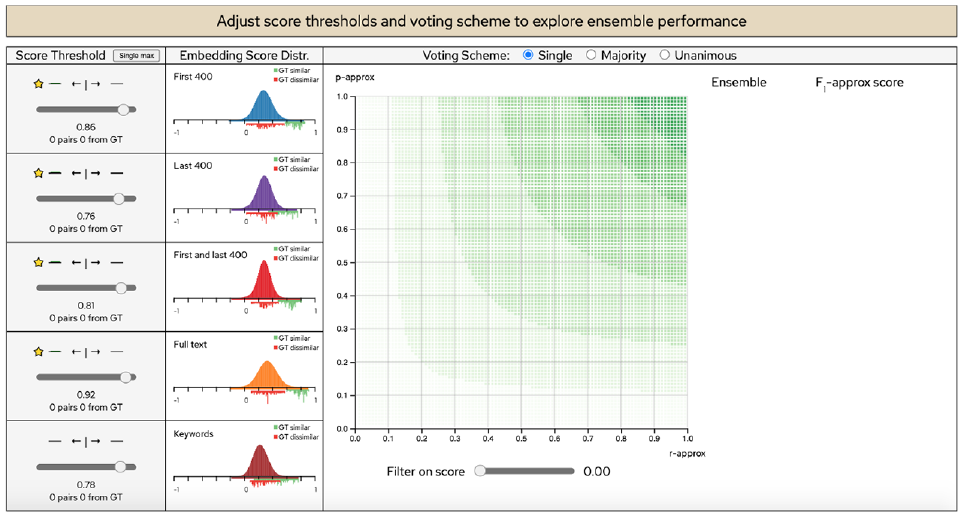
The initial view of EEVO. The default slider settings lead to all pairs being classified as dissimilar and therefore all ensembles have
Use case
Assess the different embedding types
Before making any adjustments to the hyperparameter settings, the analyst focuses on the “Embedding Score Distribution” column of the visualization (see Figure 5). Visualizing the pure score distributions (see Figure 6, left) does not allow for any deeper insights, but by keeping track of the scores of the pairs of the GT set, EEVO is able to provide more interesting details (see Figure 6, right). The analyst notes that there is a general, and encouraging, tendency for all the embeddings to assign higher scores to the similar pairs than to the dissimilar. He/she also observes the differences in how well the embeddings succeed in separating the two sets and the variation in distribution shapes (both regarding the upwards-oriented total distributions and the downwards-oriented GT distributions) and therefore anticipates that this could be exploited by an ensemble combination.
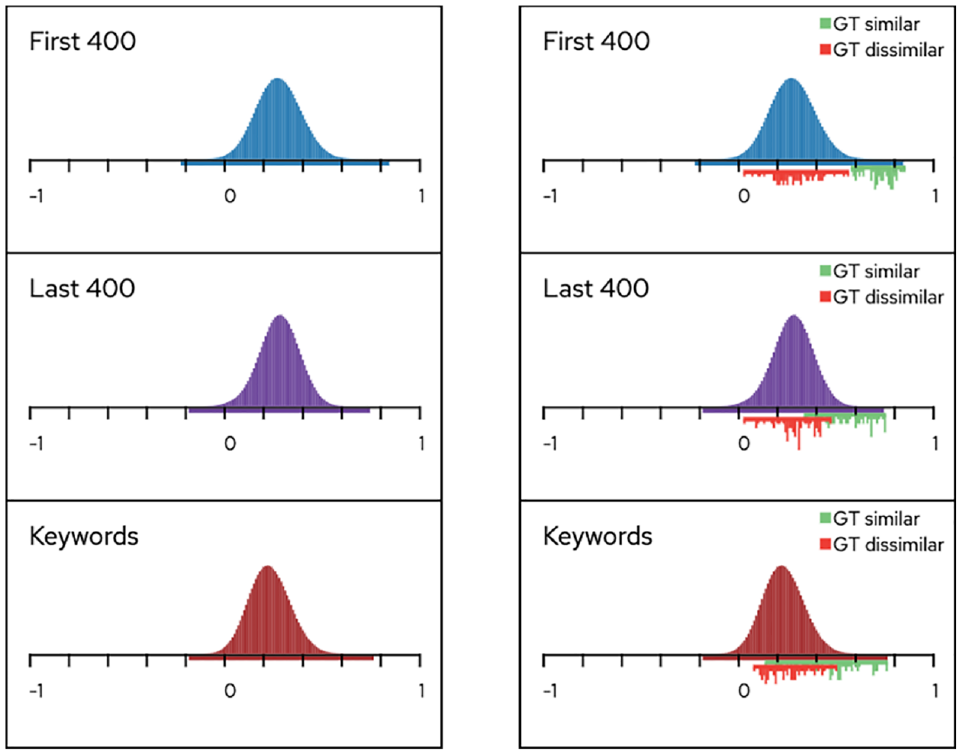
From the pure score distributions (left), we can only observe a slight difference in the shape and the location of the curves, but no detailed conclusions can be drawn. However, adding the downwards score distribution chart for the GT set (right; green and red for the similar and dissimilar pairs, respectively) clearly reveals that the different embedding types distribute the scores differently and that they are not equally successful in separating the two subsets.
Assess single-embedding performance
By adjusting the similarity score threshold on one slider at a time (leaving the others at their initial values), the analyst can assess the maximum performance score for each embedding one at a time. By doing so (and observing the scatterplot and the high-score table), it is straightforward to verify that the highest scoring single-embedding ensemble is First and last 400 with an
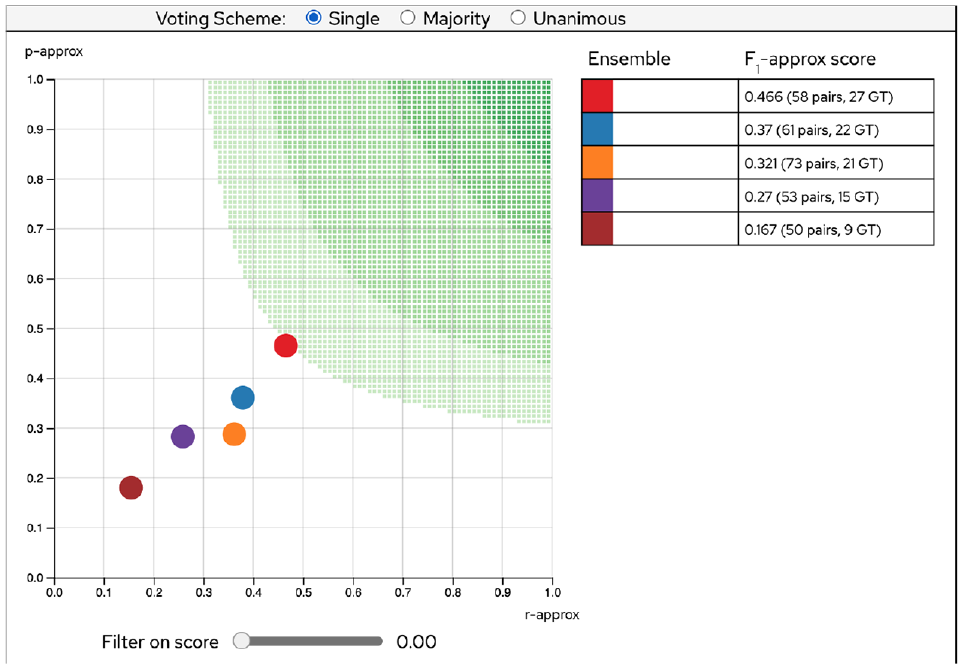
The maximum
Assess ensemble performance
The analyst now focuses on trying to find an ensemble combination that performs better than the benchmark score found in the task above. As mentioned before, this is in essence a search for optimal hyperparameter settings within the parameter space of the possible voting schemes and the possible similarity score threshold values. To facilitate the search, the tool continuously calculates and displays directive visual guidance, 31 which conveys information on what would be the consequences of decrementing or incrementing each score threshold by 0.01. Aggregated guidance information is displayed as “information scent” above each slider (see Figure 8), while the ensemble-specific guidance is displayed in the high-score table (see Figure 9). The aim of the design is that the analyst would combine the guidance with logical reasoning to augment the chances of finding optimal performing ensembles. Furthermore, some key aspects need to be considered:

Guidance above the score thresholds sliders indicates what would be the effect of moving the threshold one step up or down. The bar size encodes the number of affected ensembles, and the color and direction encode the potential effect: green and upwards for higher scores, red and downwards for lower scores. A star indicates that a new session high-score can be obtained. The guidance does not necessarily have to be consistent over all ensembles, since some may benefit from a move while others might not: as we see here, a move to the left would benefit only one ensemble and be disadvantageous to several others. Nevertheless, the star indicates that it would still result in a new session high-score.
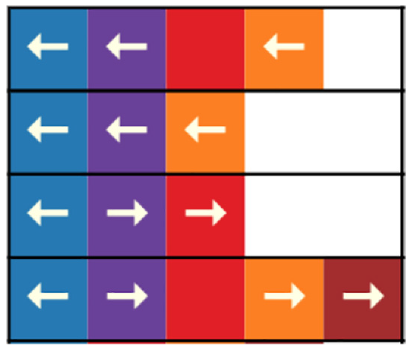
Guidance in the high-score table indicates the moves that would be beneficial for a specific ensemble. Color encodes the embedding identity, and the arrow direction encodes in which direction the corresponding slider should be moved to augment the score of this ensemble: left means lowering the threshold and right means raising the threshold. For instance, clicking an arrow within any orange rectangle will change only the threshold value for the orange embedding (leaving the other thresholds unchanged), and it therefore affects all ensembles which include this embedding. As can be seen regarding the different arrow directions for purple and orange embeddings, the guidance does not necessarily have to be consistent over all ensembles, since some may benefit from a move while others may benefit from the exact opposite.
Inconsistent guidance: A move that is beneficial for one ensemble may not be so for another, so the sum of all guidance may very well appear inconsistent.
Many vs. few: When in conflict, always choosing the move that is beneficial for the highest number of ensembles may not be the best strategy, especially when close to an optimum. Typically, the final moves will only be beneficial to the very top scoring ensemble(s).
Preserving potential: Existing guidance can be viewed as “potential for improvement” and is calculated under the premises that all other sliders are kept fixed. Therefore, if there is guidance on several sliders, moving one of them might very well “destroy” the potential on the others since the conditions now have changed. Thus, when given a scenario with potential on several sliders, it is prudent to proceed in smaller steps on alternating sliders and with readiness to backtrack. Otherwise, there is a risk of “over-shooting” a branching point where new (and possibly important) guidance would have been discovered.
To start the search, the analyst must first consider which initial settings to use on the sliders and also what voting scheme to use. (Here, two different starting points may result in different guidance, which in turn may lead to different local optimums.) For both, the main options are: (i) a random setting or (ii) an educated guess. The analyst chooses to start by setting the slider positions to the values that are optimal for the corresponding single embedding. He/she then tries the different voting schemes and observes that using voting scheme “Single” leads to a top score higher than the benchmark for two ensembles (see Figure 10). Encouraged by this, the analyst now applies logical reasoning and follows the main direction of the guidance and is hereby able to achieve a score of 0.553 (which is an improvement of 19%). The analyst can therefore conclude that using an ensemble of embeddings is a better choice than using only a single embedding.
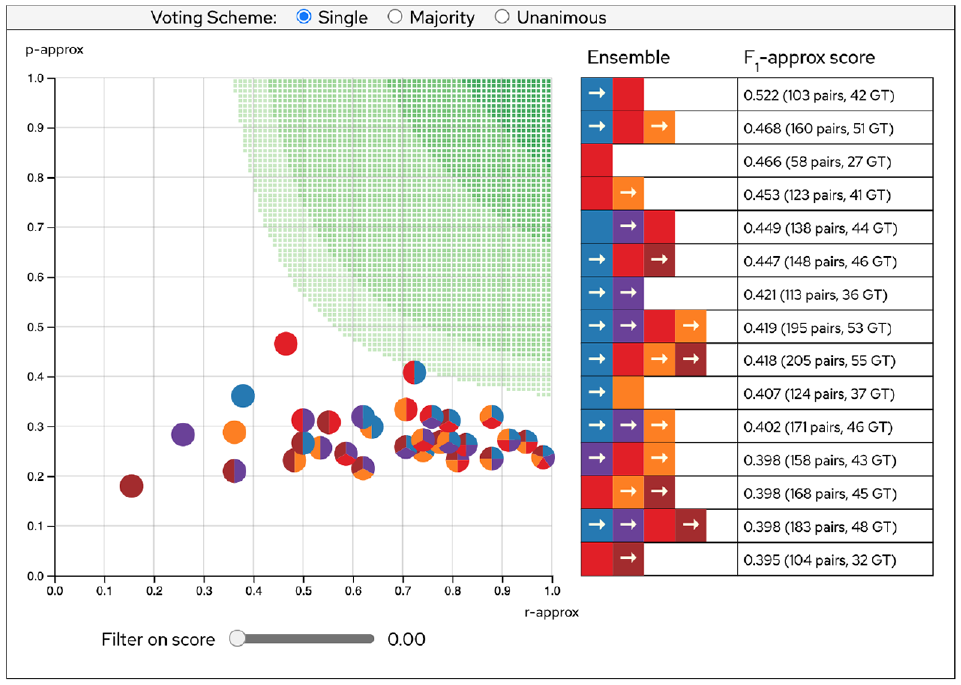
When using the voting scheme “single,” the analyst observes that setting the sliders to the thresholds optimal for each single embedding yields a score that is higher than the benchmark (i.e. the score of the red single-embedding ensemble) for two of the ensembles. Following the guidance leads to even higher scores.
However, as previously stated, since EEVO makes use of a sampled GT set, the analyst cannot fully rely on the
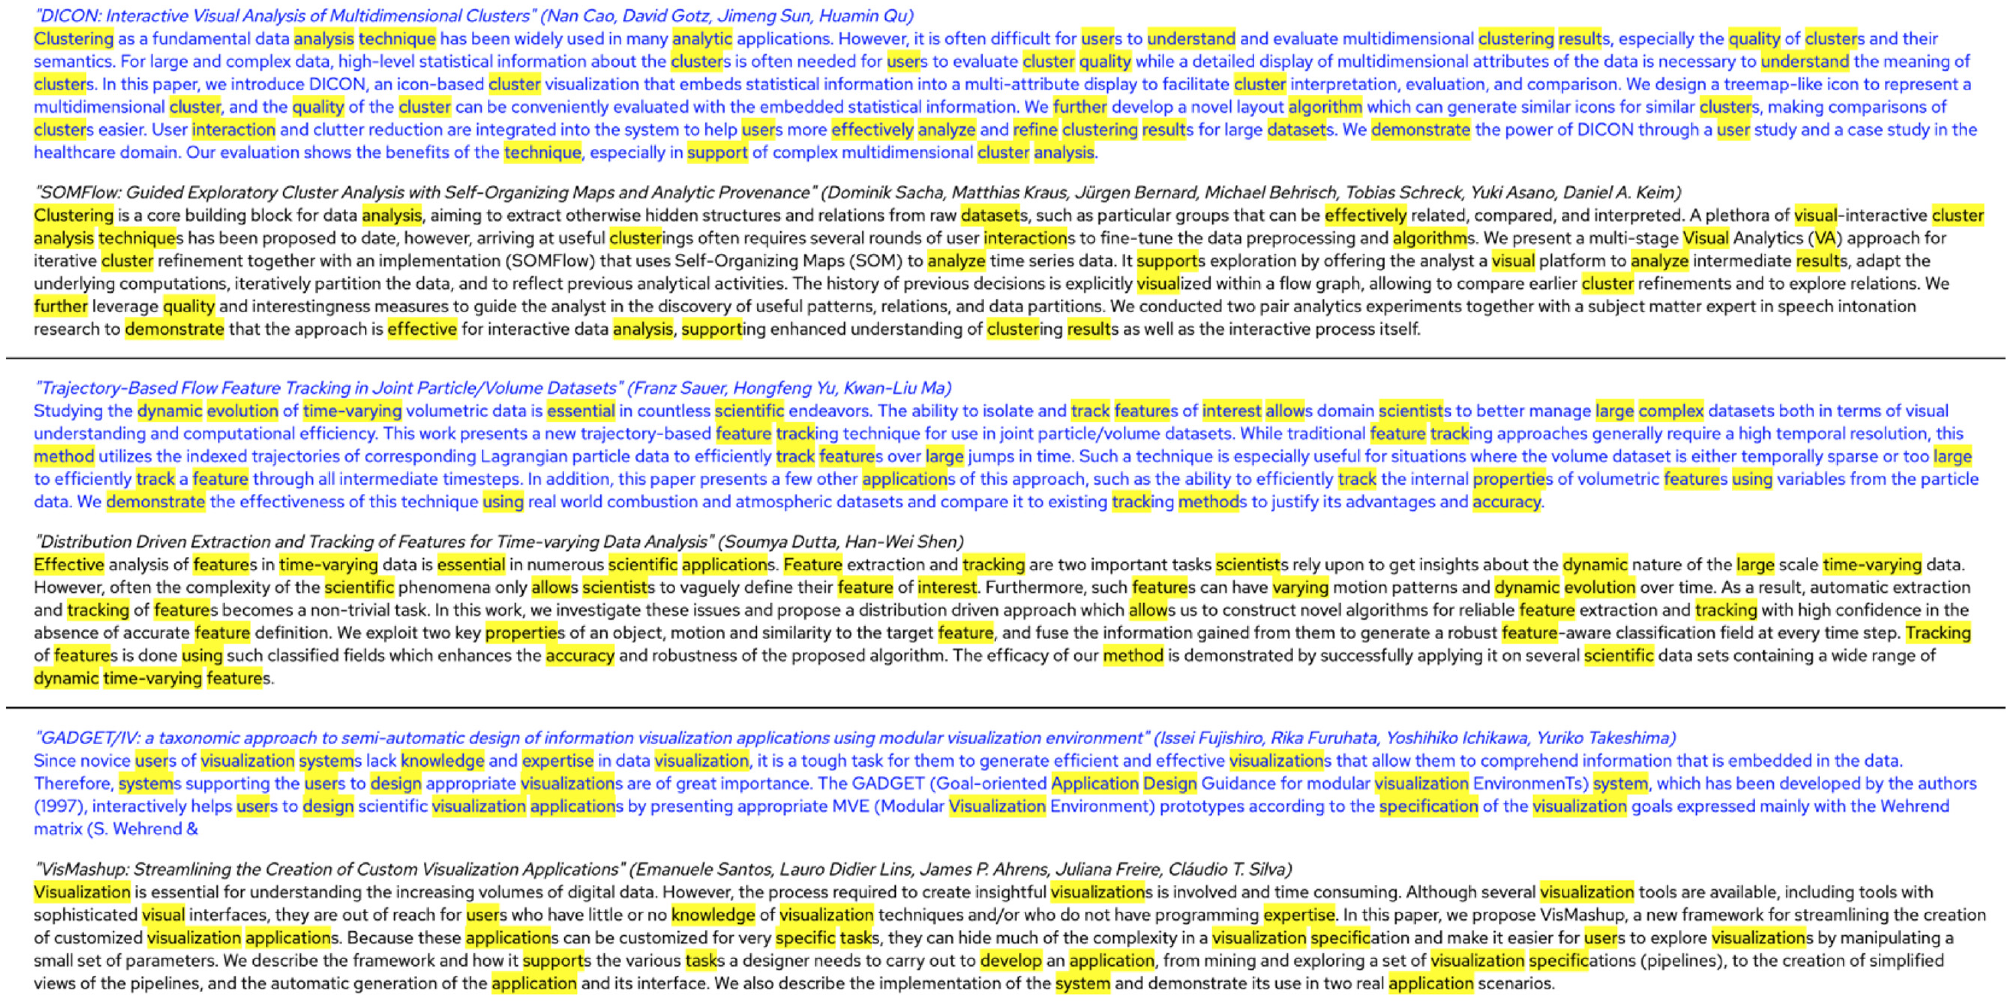
A truncated example from the Similarity Assessment View showing 3 text pairs (out of the total of 51) which were classified as similar by the best performing ensemble for our use case. These pairs do not belong to the GT set, and they were not classified as similar by the best performing single embedding. Hence, if they can be verified to be similar they provide clear examples of the benefits of using the ensemble strategy. By close reading of the first pair, the analyst can note that both articles treat the problem of interpreting and understanding the results from clustering algorithms. Although the focus of the article by Cao et al. 92 seems to lie on treemap visualizations while the article by Sacha et al. 93 focuses on self organizing maps, they still both suggest interactive visualizations for the same type of problem, so the there is high similarity of the treated topic. For the second pair, both articles treat the problem of feature tracking in large sets of time-varying data. The article by Sauer et al. 94 introduces a new method for handling object tracking over jumps in time, and the article by Dutta and Shen 95 proposes a distribution-based algorithm that targets the objects motion and its similarity to the target feature. So, also for this text pair there is an obvious level of similarity of the treated topic. For the third and final pair, there is also a high level of topic similarity since both the article by Fujishiro et al. 96 and the article by Santos et al. 97 propose solutions to the problem of helping non-expert users to construct and design effective data visualizations.
We end this section by exploring what the described quality gain corresponds to in more concrete terms and what this could imply for a real-world scenario. Recalling that the best performing single embedding gave a classification of 58 similar pairs (with 27 from the GT set) and that the best ensemble configuration gave a classification of 51 similar pairs (with 32 from the GT set), we see that the numbers are in favor of the ensemble strategy, since it provides 5 more correct classifications from the GT set as well as an “GT precision” of
Evaluation
Evaluation is an important step for determining if a new interactive visualization approach is successful or not with regard to certain criteria, for instance, usability. 98 We have opted to perform an initial user study which focused on two specific questions: (1) how well our proposed tool supports the user in finding high-performing ensembles and (2) if the design of the tool is straightforward enough to allow even users without expert knowledge of embeddings and ensembles to succeed with the search. The study had a total of 6 participants from the field of computer science with the following profiles:
Participant 1– Graduate at Master’s level, general knowledge of ML and visualization.
Participant 2– Senior lecturer, expert knowledge of ML and intermediate knowledge of visualization.
Participant 3– Master’s student, general knowledge of ML and visualization.
Participant 4– Post doc, general knowledge of ML and intermediate knowledge of visualization.
Participant 5– PhD student, expert knowledge of ML and intermediate knowledge of visualization.
Participant 6– Post doc, intermediate knowledge of ML and general knowledge of visualization.
All sessions were individual with a maximal duration of 1 h. Each participant was given an introduction to the EEVO tool and then spent approximately 20–30 min on the task of trying to find an ensemble which could outperform the best single embedding as discussed in Section Use Case. During the sessions the participants were observed by the test leader, and they were encouraged to verbalize their thoughts and questions out loud, as this enables for a more nuanced final analysis of the evaluation results. Apart from answering any questions from the participants, the test leader remained passive throughout the session and did not provide any active help in solving the task. At the end of the sessions, the participants were asked to give their overall impression of the tool and to fill out an ICE-T evaluation form. 99 (This heuristic evaluation approach focuses on self-reported estimates of visualization value aspects such as its ability to decrease the time necessary for answering questions about the data, to facilitate discovery of insights, etc.)
All of the participants were able to find an ensemble which outperformed the best single embedding. Surprisingly enough, some were even able to find the settings for the best ensemble that we have been able to locate so far during our own tries. With regard to our focus questions, the results hence suggest that our tool can be used for its intended task, and also that it can be used without prior expert knowledge within the fields of embeddings and ensembles. Furthermore, large parts of the oral feedback given at the end of the sessions was consistent and could be condensed to the following:
The tool was perceived as being user-friendly and having an appropriate design for the intended use.
The continuous guidance provided good support for solving the task and the chosen visual metaphors were straightforward and easy to interpret.
For better analysis of situations when the guidance is ambiguous or non-existent, an extended “guidance horizon” (beyond the current limit of one step left/right) would be beneficial.
Other important common comments were: (1) that the tool provided insights to the inner workings of the similarity calculations, (2) that the task could maybe be solved by direct optimization instead, and (3) that similarity is a “fuzzy” concept which adds a level of subjectivity to the calculations (as compared to normal supervised classification). For aggregating the results from the ICE-T questionnaire responses, we performed a numerical translation of the answer options to a scale from 1 to 7, with higher scores indicating better results. Figure 12 provides an overview of the scores, indicating that a majority of the participants have graded EEVO at the higher end of the scale. On the whole, our general assessment of the study setting and the obtained feedback is that the consistent and positive results provide support for the claims that the methodology is working and that our proposed application can be used for the intended task.
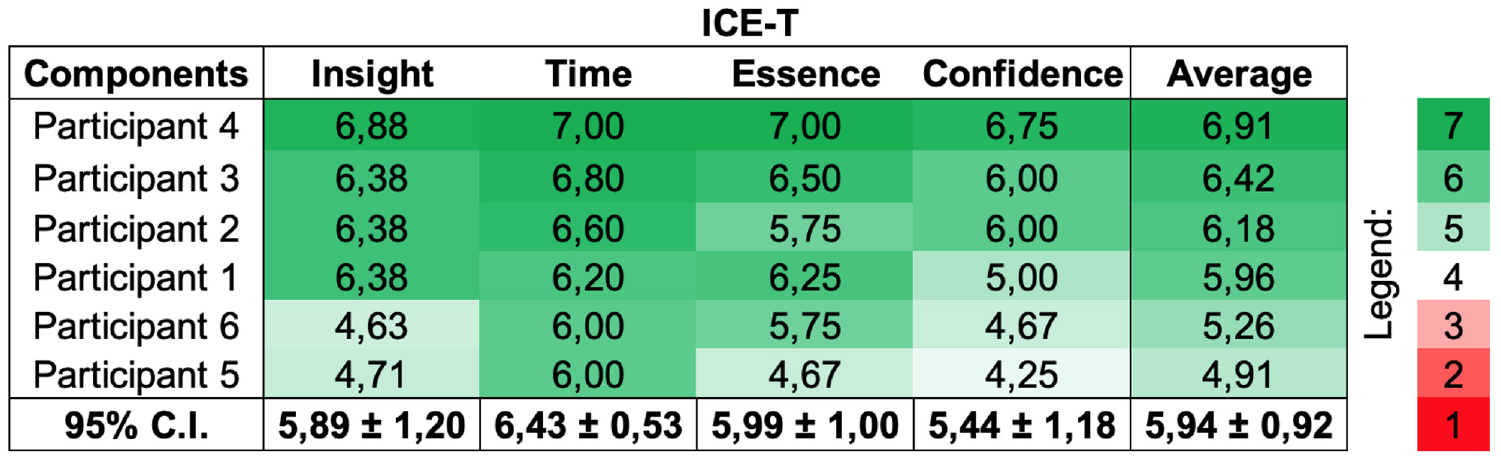
The ICE-T scores with the participants sorted on average score. The respective ICE-T categories focus on the ability of the visualization approach to discover insights, decrease time for task solving, convey essence of the data, and generate confidence about the data. 99 Green is indicating good results, as opposed to red, and white indicates the neutral value, same as the color map used in the original ICE-T study. 99
Discussion and conclusions
In this paper, we have presented a new method for augmenting the quality of text similarity calculations by using multiple embeddings and ensemble methods. Furthermore, since we believe that the elusive concept of similarity is ill-suited for a purely computational approach, we have also implemented a prototype VA tool, called EEVO, designed for human-in-the-loop visual optimization of the process of finding the best performing ensembles. By applying our methodology to a large set of scientific documents, we have outlined a step-by-step process for how high quality similarity classifications can be obtained in practice for real-world scenarios. We also discussed how this could be used for applications that seek to exploit text similarity. Moreover, we have outlined how the visual optimization process can give the analyst important insights to the inner workings of the similarity calculations and increase the understanding of complex aspects of machine learning, which in turn will hopefully lead to even better settings and a higher trust for AI applications. In more concrete terms, when facing the challenge of analyzing text similarity over a large set of documents, the method of first providing a few initial samples of “what similarity looks like” within this specific corpus, followed by an interactive training/optimization session using these samples (and with full possibility of verifying the quality of the classifications) provides an intelligible framework which puts the analyst in control of the process. As previously stated, the balance between a computational-centered approach and a more human-centered enables the analyst to acquire vital insights to the strengths and limitations of the constructed classifier and how to best use it within larger applications.
Furthermore, we note that the main ideas of our proposed method, as well as the main architecture of EEVO, generalizes to any type of similarity-preserving embedding technology since no assumption is made on the type of the underlying data. This is because the interface of the method is based on numerical vectors and cosine similarity calculations only, regardless of how the vectors were produced. Therefore, the potential use of our findings goes beyond the scope of our presented use case of textual data, and we believe that there could be benefits for other domains and applications (that involve similarity calculations with embeddings) as well. As an example, we have used the citation network of our data set and embedded the nodes with several different neighborhood-aware algorithms, which means that article nodes that have a citation link should be embedded close to each other. We have then attempted to reconstruct the citation links by applying the same methodology as in this paper (i.e. we assume that nodes that are similar/close should have a link) and tested the single-embedding strategy against the embedding strategy to see which one that would yield the most correct network reconstruction. Once again the embedding strategy proved to be the better choice even though this is a fundamentally different task on a fundamentally different data type. We intend to explore this further as part of our future work.
On the other hand, we are aware of the fact that our method and results do not fall under the category of exact optimization 29 and thus offer no strict guarantee that the results will be worth the effort for all situations. We also need to acknowledge the fact that showing that an ensemble strategy is a better choice for our data, given the embedding types that we present, does not exclude the possibility of the existence of another embedding type (or even some other approach, not involving embeddings at all) that would have been even a better choice. Another relevant limitation of our approach is the fact that text embedding technologies currently only exist for a limited set of languages, and that extrapolation of our results to non-English or multilingual 100 scenarios therefore must be made with caution. Nevertheless, we believe that our discussion puts forward strong arguments for the potential gains of using our methodology, and that it is suitable for real-world scenarios.
Regarding our EEVO tool, it is important to note that the current implementation does not scale exceptionally well when loading many different embedding types. This is mainly due to the fact that it is very expensive to calculate the guidance, and this is also the main reason for why the guidance has been limited to only one step. With an optimized implementation it would be possible (and very valuable) to extend the guidance to also look “further ahead,” as well as calculating the results of combinations of moves. Similar to Parallel Embeddings, 82 such results could even be compared over time. We also see the need for adding better functionality for comparing the yields and the quality of two different ensembles, so that a well founded decision on which one is the best performing can be made – for instance, this could include a compact overview of the compared text pairs, building upon the existing work on comparison58,101 and text alignment 102 topics in visualization. In summary, we believe that the most promising areas for further development are: (1) the ability to handle more embeddings, (2) the ability to provide more sophisticated guidance, and (3) the ability to compare the results of two different ensembles. Such improvements are a part of our future work. Furthermore, there is a scaling issue also for the scatterplot since it will be cluttered if the number of ensembles is too high, and it is for this reason that we have included the “Filter on score” slider so that the user can select to hide low performing ensembles. Other possible solutions to this problem would be to implement a user selection for the maximal number of ensembles to display, or replacing individual visual items in dense areas with aggregated/cluster representations.
As a final remark, we would once again like to emphasize that the main focus of our proposed method and tool is augmenting the quality of the text similarity calculations since this, as shown in the survey by Wang and Dong, 3 is a generic task with many important applications within several different fields. It is therefore natural that our work may be perceived as not covering a full use case from an analyst perspective. The reason for this is that our contribution is a methodology that is intended to be part of a larger application within such fields as Bibliometrics, Scientometrics, and Science Mapping among others, and as discussed above, our approach could also make use of embedding vectors not necessarily based on text data, for instance, node embeddings for a citation network, or multivariate metadata embeddings. This is also something that we intend to explore as part of our future work.