
Abstract
The sensemaking process of large sets of text documents is highly challenging for tasks such as obtaining a comprehensive overview or keeping up with the most important trends and topics. Even though several established methods for condensation and summarization of large text corpora exist, many of them lack the ability to account for difference in prevalence between identified topics, which in turn impedes quantitative analysis. In this paper, we therefore propose a novel prevalence-aware method for topic extraction, and show how it can be used to obtain important insights from two text corpora with very different content. We also implemented a prototype visual analytics tool which guides the user in the search for relevant insights and promotes trust in the yielded results. We have verified our application by a user study, as well as by a validation run on a data set with previously known topic structure. The results clearly show that our approach is suitable for text mining, that it can be used by non-experts, and that it offers features which makes it an interesting candidate for use in several different analysis scenarios.
Introduction
Within many scientific fields, the number of published documents makes it a daunting task for any scientist to follow trends and topics and to identify publications of interest. Furthermore, the time available for actual reading is often limited and must be allocated wisely to carefully chosen scientific reports. In order to meet this challenge, and to help practitioners handle large textual corpora efficiently, various techniques have been developed within the field of natural language processing (NLP). 1 For instance, automatic text summarization, 2 topic modeling, 3 and so-called distant reading functionality 4 are powerful tools for obtaining an overview of large corpora without reading all documents. While such methods work well for many different scenarios,5–9 they are usually designed for cases when the totality of the corpus is targeted without regard to the intrinsic aspect of topic prevalence. Generally speaking, the majority of existing methods are focused on detecting all existing subjects rather than focusing on the most common ones. This in turn, can impede a relative ranking of importance. An explanation to why such rankings are important comes from the trivial observation that, when facing an unknown corpus, a very natural first question is: “What are the most common topics treated by these documents?.” This question implies that: (1) we are currently not necessarily interested in all subjects but rather in a specific subset of them, and (2) uncommon subjects could potentially be discarded completely from the yielded result. Calculations of such prevalence rankings could of course be added as an extension to some of the already existing methods. However, it is still a fact that many of the traditional methods do not inherently handle the prevalence aspect within their computational approach—and here we see a research gap to be filled. Developing prevalence-aware methods for topic extraction, together with custom visualizations, could therefore be an important addition to the set of tools for providing overviews and/or condensations of large corpora. More specifically, we hope to facilitate tasks such as initial exploration of a previously unknown field, quantifying textual content for statistical analysis, or assessing the most important subject trends within a time series of documents.
In this paper, we start from the straightforward motivating question “What are the most prevalent topics within this corpus?”. Our computational approach is based on our previous work on using multiple embeddings for text similarity calculations. 10 The main idea is to use text embedding models to embed the documents of the text and use the resulting embedding vectors for the pairwise similarity calculations. The result of the calculations can then be expressed as a similarity network where two nodes are connected with a link if their texts are deemed to be semantically similar. To form the base of the extracted topics, we then harvest groups of similar articles from this network. We also propose a prototype visual analytics (VA) tool to help the analyst find relevant answers, and to provide important insights to the similarity relations between the documents. Our intended user is a scientist within any research field and with only moderate knowledge of machine learning technologies. The aim of the user is to obtain a representative summarization of a corpus by extracting the most prevalent topics (in order to, for instance, gain better understanding of the content, or to write a survey). The rationale for choosing this specific scope for our tool is that it encompasses general functionality that could be of value for many different analysis scenarios (just as with traditional topic modeling). Finally, since there is no “single objective and true” answer to our motivating question, we also need to consider the analyst’s level of trust in the results. 11 With all this in mind, we formulate four specific research questions:
Our work belongs to the field of VA and thus falls within the scope defined by the survey of Huang et al. 12 Using the classification scheme used in their survey, our contribution corresponds to the Visualization for NLP and computational linguistics subcategory. More specifically, we aim to leverage embedding technology for both our computational pipeline and as a means to boost the analyst’s trust and understanding for the application as a whole. Finally, we want to underline that we aim to provide a hopefully useful tool in the toolbox (rather than a full-fledged analysis system), and that our method complements already existing analysis methods (rather than replaces them). Our scientific contributions can be summarized as follows:
A novel approach for prevalence-aware topic extraction on large corpora, showcased on two data sets with considerably different content.
A prototype visual analytics tool, called PT-Extractor, which helps the user to identify the most prevalent topics and build trust for the yielded results.
A user study to validate the visualization approach and the design of our tool.
The rest of this manuscript is organized as follows. In section “Related work,” we discuss the relevant related work. In section “Computational approach,” we describe our computational pipeline. The specific details of our proposed VA tool are discussed in section “Visualization approach” followed by a use case in section “Use case.” The results of the validation and the user study are presented in sections “Validation” and “User study.” Finally, in section “Discussion and conclusions,” we present the outcomes and limitations of this work.
Related work
In this section, we describe existing work that is related to our proposed solution. We start by noting that our problem domain originally resides within the field of bibliometrics where mathematical and statistical methods are applied to documents, books, and other media in order to derive insights from the underlying data. 13 The concept of distant reading has been introduced to alleviate the problem of normal reading (often referred to as close reading) being very time consuming. 4 By using applications which support the navigation of large document sets and convey relevant aggregated information (but still also allow on-demand access to the underlying text for detailed examination), the reading process can become more efficient. This concept is therefore highly relevant for our work, since we position our contribution as a general methodology for corpus summarization and exploration within and beyond bibliometrics.
NLP and visualization
As previously mentioned, one main challenge within bibliometrics is how to make sense of large text corpora without necessarily reading all documents. NLP in combination with visualization has proven to be a successful combination for handling this problem. Belinkov and Glass focus their survey on the major computational progress sparked by the introduction of neural network models. 14 Kucher and Kerren 15 provide a taxonomy for classification of text visualization, and Liu et al. provide an overview of analysis tasks and techniques for visual text analysis. 16 Zhang et al. 17 survey visualization methods for scientific literature topics, and classify papers with regard to the tasks targeted by their proposed topic visualization pipeline. Overviews of approaches specifically relevant to bibliometrics and visual analyses of scientific literature are provided by Federico et al. 18 and Liu et al. 19 Some of the respective solutions, such as CiteSpace II by Chen 20 or PUREsuggest by Beck, 21 rely on the analysis of citations, which can be expected to be present in this text genre (but not necessarily available, at least in an explicit way, in other text genres such as news items or social media posts). Solutions such as Cartolabe by Caillou et al. 22 thus rely mainly on content analyses rather than citations to ensure wider generalizability, and our proposed approach follows a similar strategy, while not being based on more traditional topic modeling approaches (see below) used within Cartolabe.
The survey of Huang et al. 12 is highly relevant to our work, since it focuses on VA applications that: (1) use embedding technology within their computational pipeline, and/or (2) provide visualizations of embedding vector data or of the results of embedding-based computations. Our proposed solution fulfills both these criteria, and more specifically, it belongs to the Visualization for NLP and computational linguistics subcategory in which we can find several publications that are related to our work. The approach of El-Assady et al. 23 is relevant since it also aims to extend the concept of traditional topic modeling. Their focuses lies on incorporating the domain knowledge of the user into the process while our focus is on constructing a prevalence aware method. The ViziTex studio proposed by Raman et al. 24 acts as an inspiration, since it takes a broad focus on the general problem of making sense of a large textual corpus. Our hope is that our proposed methodology could be used as a tool within the same problem context. Finally, the work of Chen et al. 25 is related, since one of the main steps is to approximate a large textual corpus by choosing so-called representative exemplars. In this way they also obtain a condensed summarization of the content, although this step is not the main goal of their computational pipeline. In our case, documents with many similarity links could be considered as equivalents of representative exemplars, and they are highly important for our main goal—to compute a summarization of the corpus in terms of the most prevalent topics (see section “Computational approach”).
The work of Marrone and Linnenluecke 26 and Malik et al. 27 is relevant for us since they both aim to connect/align and compare topics. There are many similarities to our problem setting (with a common key challenge being to determine whether two different topics are related/similar or not), although we are using a different computational approach.
The TopicListener by Su and Boydell 28 also serves as an inspiration, albeit from the field of audio analysis, since it also focuses on the problem of extracting the most important topics. In this case, the inspiration is more on a conceptual level since there is a big difference in problem domain and computational approach. Finally the concept of “thematic topics” used in the work by Wu et al. 29 is highly related to our work since the main goal is to extract topics that are coherent and interpretable in the eyes of a human, as well as reflecting common “themes” within the corpus. We acknowledge that such characteristics of the extracted topics are vital for the usefulness of the method.
Word and text embeddings
Word embeddings are distributed numerical vector representations, and they are intended to capture the semantic similarities between words. Generally speaking, such embeddings are obtained from unsupervised training of a deep learning model on a large text corpus.30–34 By providing large amounts of training data, the model learns to predict words from a given context, or the other way around. When the training is finished, the model will have learnt the semantic similarities of word pairs, such as “happy is semantically similar to glad,” and “hard is semantically similar to difficult.” The main idea is that the model will project words with high semantic similarity to embedding vectors that lie close to each other in the embedding space. This in turn means that similarity calculations can be made with the vectors as proxies.35,36 Arguably, some of the most influential word embedding algorithms are Word2Vec, 37 introduced in 2013, and the more recent and more powerful BERT, 38 since it can account for the same word having different meanings depending on the context. For corpora containing scientific documents there is a specially fine-tuned version of BERT, called SPECTER. 39
Word embedding technologies can be extended to obtain embeddings for sentences or paragraph-sized text. 40 One straightforward method for obtaining text embeddings is to take the average of the embeddings of the words in the targeted text, but this approach is too limited and error-prone for complex analysis scenarios. Instead, more sophisticated approaches are needed to allow for exploitation of the syntactical structure of sentences. 41 This is necessary to do since the meaning of a word may be context-dependent, and also because the same set of words may be arranged into sentences of very different meanings. A popular choice for exploiting the syntactical structure is to use deep learning models, and approaches have, for instance, been developed for recursive neural networks, 42 convolutional neural networks, 43 and recurrent neural networks. 44 Some of the most prominent recent approaches for embedding paragraph-sized text include the Universal Sentence Encoder (USE) 45 and the sentence version of the previously mentioned BERT model. 46 Consequently, in our proposed tool, the user may choose the USE, BERT, or SPECTER model as base for the semantic similarity calculations. Furthermore, we discuss an example of further extensions as part of this study’s validation in the respective section below.
Topic modeling
The concept of topic modeling encompasses different statistical and deep learning techniques, with the common aim to perform unsupervised learning of hidden semantic structures of a corpus. 30 A traditional approach is to start by converting the documents into a so-called document term matrix (DTM), which is a table where rows correspond to documents and columns to words and the cells contains the count of how many times the word appears in the document. An alternative to the basic word count is applying transformations such as the TF-IDF score, which accounts for both the term frequency (TF) and the inverse document frequency (IDF) in order to increase the relative weight of more unique words. 47 Latent Semantic Analysis (LSA) 48 aims to learn topics by applying single value decomposition (SVD) to the DTM. Probabilistic Latent Semantic Analysis (pLSA) 49 was proposed as a variation using a probabilistic model instead of SVD. The Latent Dirichlet Allocation (LDA) 50 method is a very popular choice, and it improves on pLSA by adopting a Bayesian approach using Dirichlet priors to estimate the document-topic and term-topic distributions. Non-negative Matrix Factorization (NMF) 51 is a variation of LSA where specific constraints on the decomposition of the DTM (i.e., negative elements are not allowed) lead to a decomposition into a topic-document matrix and a topic-term matrix, which in turn can be used to assign topics to the documents.
More recent approaches, such as BERTopic 52 and Top2Vec, 53 seek to improve on the traditional methods by using embedding technology in combination with dimensionality reduction (DR). Text embeddings are calculated for each document, and after applying DR the result is clustered to find groups of semantically similar documents. The resulting clusters are then used as the base for topic extraction. One noteworthy difference between these newer methods and the more traditional ones is that each document is assigned to one topic only, whereas the traditional methods assume that each document contains a mixture of topics. Our proposed work is inspired by these latter additions, but we use a different mechanism (i.e., similarity networks instead of clustering) for finding groupings of similar documents. Furthermore, compared to the methods mentioned in this section, an important distinguishing feature of our method is the inherent capability of computing topic prevalence.
Computational approach
In this section, we describe the computational steps of our method.
Data sets
We use two main data sets of documents with different content. The first one contains the abstract texts from approximately 3500 scientific publications from the IEEE VIS conferences. 54 The second one contains approximately 4000 news articles collected from the CNN news site. We also use a smaller validation set containing approximately 200 scientific publications from the Visual Information Communication and Interaction (VINCI) symposium. We do not preprocess the texts in any way before we feed them into our computational pipeline.
General idea
Inspired by the same general ideas which are used in BERTopic 52 and Top2Vec 53 (see also section “Word and text embeddings”), our coarse-grained approach is to (1) embed the document texts, (2) group them by semantic similarity, and (3) extract common keywords from the document groupings. One key idea for this approach is that common keywords for a group would provide a general and condensed description of the content of the participating documents. The semantic similarity of the grouped documents is crucial for the quality of the yielded result (i.e., grouping dissimilar articles and extracting keywords will probably result in nonsense). Therefore, the grouping step is of vital importance to the whole computational scheme. For BERTopic and Top2Vec, this step is achieved by performing dimensionality reduction on the text embeddings followed by clustering of the points in the low-dimensional space. Although this is a valid approach, we see two major reasons to why it is not ideal for our purpose. The first is that many DR-methods are non-deterministic, so the yielded result would differ from one run to another. The second is that cluster algorithms often yield ambiguous results when there is no clear cluster structure present in the data, and we do not want to base our method on a-priori assumptions of the similarity patterns within the data. Inspired by our previous work, we will instead base our method on using multiple embeddings and constructing similarity networks. 10
Constructing the similarity network
As discussed in section “Word and text embeddings,” models such as USE and SentenceBERT arguably achieve state-of-the-art results for text embedding, and we therefore use them in our embedding pipeline (the specific models used could be changed in the future based on the progress in NLP). We use the embedding vectors to calculate the pairwise similarity scores for all document pairs, and (in line with common practice in the field of NLP) we use the cosine similarity as our score metric. The user then sets a threshold score for the separation of dissimilar pairs (i.e., pairs with similarity score below this threshold are regarded as dissimilar). Finding this threshold is a trade-off between false positives and false negatives. Setting a low threshold will yield many similar pairs, but the ones with the lowest scores will have high risk of being false positives. On the other hand, setting a high threshold will yield fewer similar pairs (of which most will be true positives), but the risk is high that this will lead to many false negatives.
We proceed to construct the similarity network as follows: (1) connect each document with similarity scores above the threshold and (2) set the edge weight to the value of the corresponding similarity score. In other words, each document node has edges to the documents which it is similar to, and the edge weights indicate how semantically similar they are. The rationale for constructing this type of network is that it conveys implicit prevalence information regarding the content of the corpus. Our first key observation is that a document with no/few edges must have unique content, and therefore we can assume that the probability that it belongs to a prevalent subject is low. Our second key observation is that a document with many edges shares content with many others, and therefore we can assume that the probability that it belongs to a prevalent subject is high. Hence, it makes sense to traverse the nodes of the similarity network in order of degree (highest first) to augment the chances of encountering documents belonging to prevalent subjects early in the process. Furthermore, we can safely exclude unconnected nodes from further processing, and this is a major difference compared to traditional topic extraction where all documents of a corpus are treated in a uniform way. Finally, we note that the way that the similarity network is traversed will affect the yielded result in terms of detected topics, and using the node degree is not the only viable option for guiding the traversal. For instance, the strength/quality of the links could be considered in order to promote documents with many high similarity scores, or the network could be divided into smaller units by using community detection methods (see section “Discussion and conclusions” for a more detailed discussion of alternative approaches). The rationale for choosing the node degree is that it is a straightforward and computationally simple method which still yields good results.
For each node visited, we now face the challenge of forming a coherent group of documents from which relevant keywords can be extracted. A similarity network can become very dense depending on which threshold score that has been set. It is therefore not a viable strategy to always form the group by taking all documents similar to the currently visited (since condensing a very large amount of documents into a few keywords will most likely yield a too imprecise result). Instead, if needed, we harvest a smaller group of the connected documents, and then allow for merging of groups if their extracted keywords have high semantic similarity. After experimenting with different group sizes and evaluating the yielded results, we set the maximal size for a group to 7 (see section “Discussion and conclusions” for further discussion of this choice). Furthermore, to avoid generating redundant keyword sets as much as possible, we will only allow documents to be part of at most one group. When a group has been formed, we will condense it by constructing a five-keyword long topic descriptor for it in the following way: (1) the texts are filtered for stop-words, (2) the occurrence per document for each of the remaining words is checked, and (3) the five words with the highest document occurrence are used to form the descriptor (see section “Discussion and conclusions” for further discussion of the choice of the descriptor length).
In a more condensed form, the process of going from the similarity network to the descriptors can be outlined as follows. Traverse the similarity network in order of node degree, and for each visited node execute these steps:
1. IF the node already belongs to a group, go to the next node.
2. ELSE form a group consisting of the visited node and max six connected documents. Harvest the connected documents in order of the similarity scores (highest first) and skip those who already belong to a group.
Create a five-word long topic descriptor for the group.
As a concluding remark, we would like to highlight the fact that this method will automatically detect the number of topics within the corpus.
Calculating semantic overlap
One consequence of putting an upper limit on group size is that topics spanning more articles than the limit may end up being split over several descriptors. To handle this problem, we perform a final processing step where the pairwise semantic overlaps for all descriptor pairs are calculated and then used as a base to group descriptors that have high overlap. The semantic overlap calculations are performed by: (1) calculating the embedding vectors of all generated descriptors, (2) calculating the pairwise cosine similarity scores of the descriptors, and (3) performing a linearization of the range between the current threshold score and 1. For instance, if we assume that we have set the threshold score to 0.5, then pairs that are classified as similar will have scores in the range R = [0.5, 1]. More specifically, pairs with lower degree of similarity will have scores in the lower range of R, and pairs with higher degree of similarity will have scores in the upper range of R. If a pair has a score below the threshold, we conclude that the semantic overlap is 0%, and if a pair has a score above the threshold, we measure how many percent of the total score range it lies from the threshold. In our example, this means that a similarity score of 0.7 would correspond to an overlap score of 40% (since it lies at 2/5 of the distance between 0.5 and 1). Furthermore, a similarity score of 0.9 would correspond to an overlap score of 80% (since it lies at 4/5 of the distance between 0.5 and 1). This scheme provides a straightforward way of quantifying the gray-zone between “being totally dissimilar” and “being perfectly similar,” and it is an important component for the computational analysis which is performed by our tool (see section “Use case”). Finally, we sort the descriptor groupings according to the number of connected articles (highest first), and the result is ready to be presented to the user.
Estimating quality
The understanding of what is a “correct” grouping of the documents of a corpus may very well vary from person to person. This in turn clearly implies that there is no true and objective answer to our motivating question. Consequently, it is not possible to use any absolute quality metrics for assessing the yielded result, and we therefore have to find another way of doing this. Taking a more relativistic approach, we first introduce the following three aspects: (1) coverage (i.e., how many articles were used for constructing the similarity network), (2) density (i.e., how many edges the average node in the similarity network had), and (3) diversity (i.e., the amount of word overlap between descriptors). We then note that (all other things being equal) we would prefer a solution which simultaneously has: (1) the highest possible coverage (so that many articles have participated in its creation), (2) the lowest possible density (so that we only use similarity links of reliable quality), and (3) the highest possible diversity (so that the generated descriptors are as unique as possible). This leads us to construct an indirect quality indicator (QI) which can be used when searching for the best possible settings.
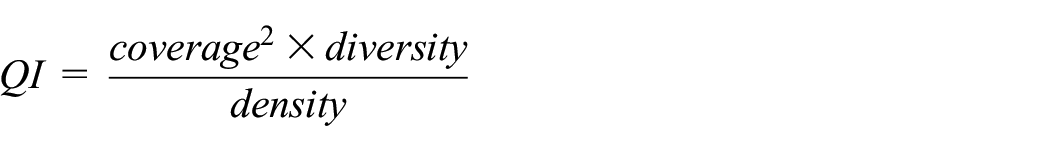
The reason for the coverage being squared in the formula is that we want to make this aspect relatively more important than the others (i.e., achieving high coverage is the most important goal). There are no guarantees that settings with maximal QI-value will yield the best possible result, but as we will see, it serves the purpose of an educated guess for where to focus the search.
Visualization approach
In this section, we describe the design of our prototype VA tool: PT-Extractor. The intended user profile for the tool is a scientist within any research field and with only moderate knowledge of machine learning technologies. We have relied on the expertise within our own research group (regarding NLP and text visualization) for the design, and it has been validated through a user study (see section “User study”). The specific design goals were specified as below, and they were inspired by the ICE-T questionnaire. 55
As can be seen in Figure 1, PT-Extractor consists of a control panel (to the left), a light blue banner for context-dependent information (top), and a main view displaying the current results. To avoid too small and/or too cluttered displays, we have chosen to utilize the main view (after clearing it from previous information) also for displaying details when drilling down into the data. For such cases, the current context is conveyed by the banner.
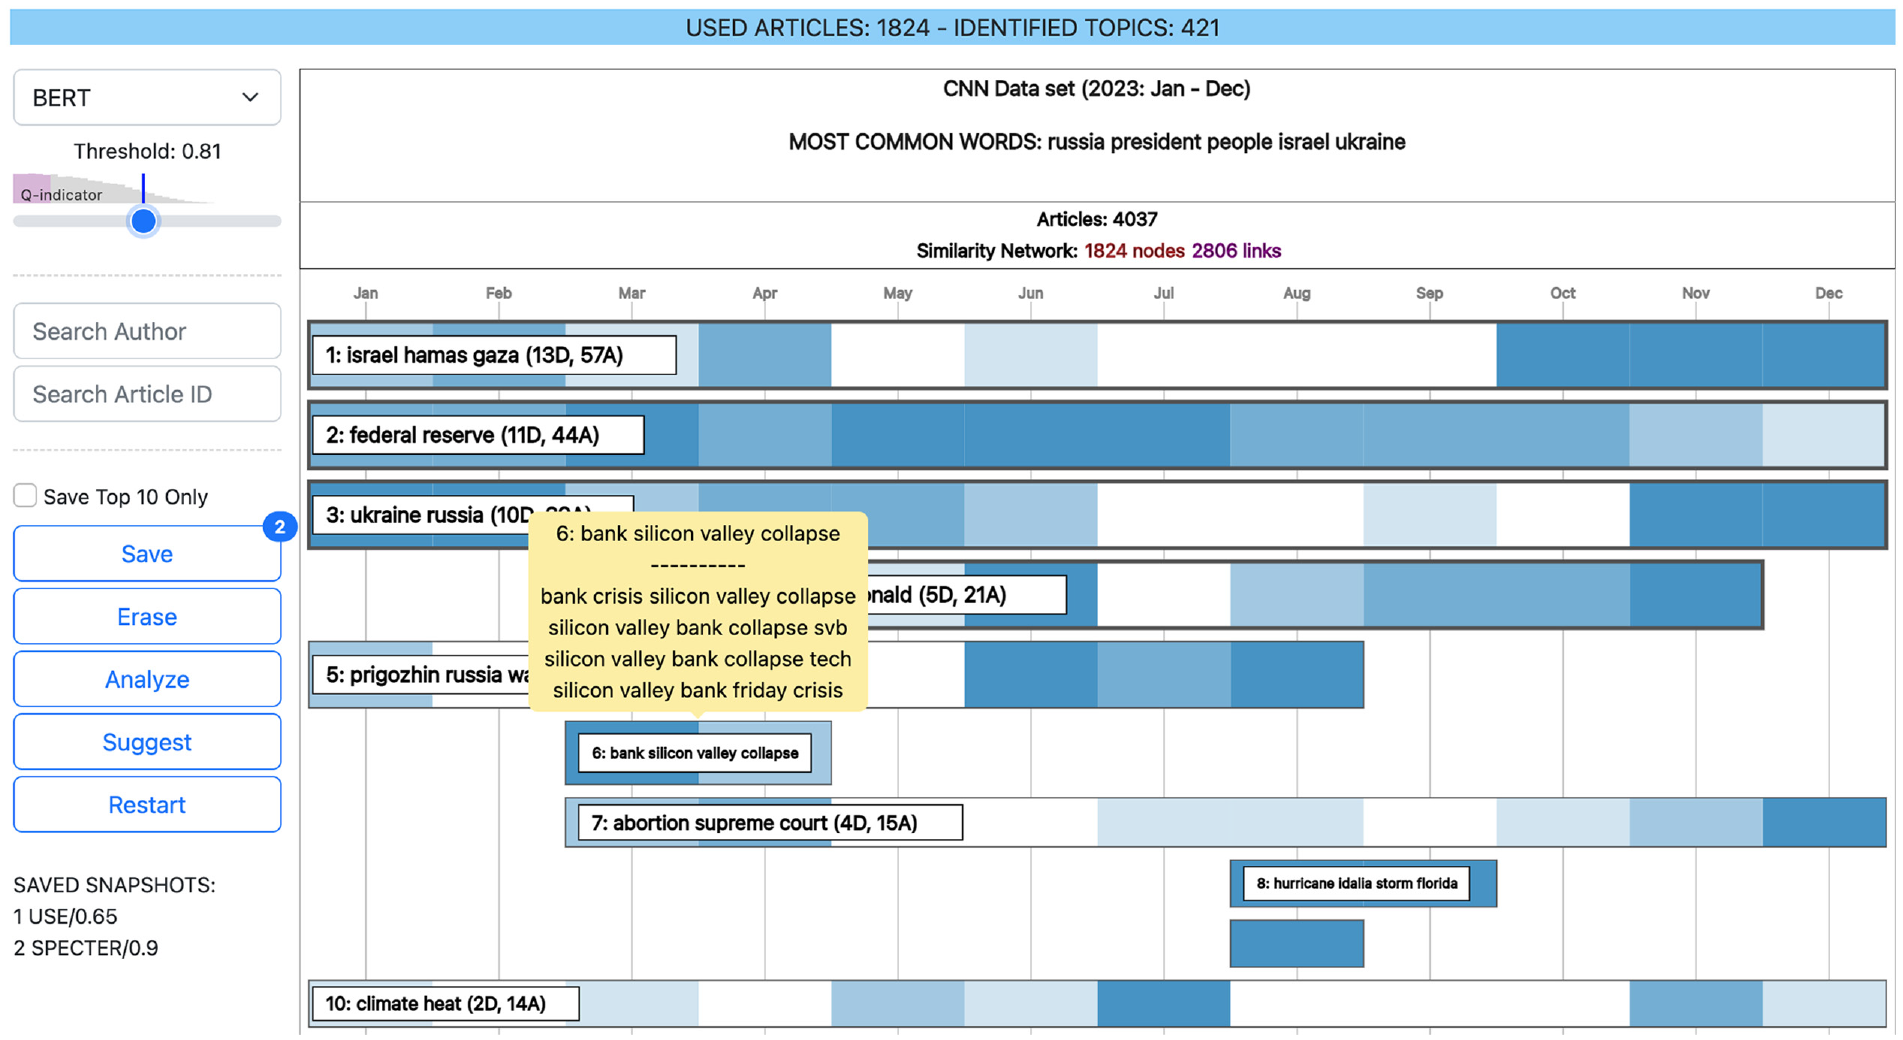
The user interface of PT-Extractor with the CNN news article data set loaded. The light blue banner on top shows context-dependent information. A control panel is located to the left, and in the main view the list of detected topics is displayed. The topics are vertically sorted by their prevalence and horizontally aligned (heatmap style) with the publication time of the contributing articles. In this example, the user is hovering topic #6 to display a tooltip with all the connected descriptors.
In the control panel, the user can choose from three different models for the embedding-based similarity calculations (USE,
45
BERT,
38
and SPECTER
39
). There is a slider for setting the similarity/dissimilarity threshold score which will be used for constructing the similarity network. Above this slider there is a plot showing the QI-distribution over the possible range of threshold score settings. To facilitate the search for best settings, both the position for the maximal QI-score and the current position are highlighted (see Figure 2). Whenever the user changes the model, the application will automatically put the slider in the position which corresponds to the maximal QI-score. There are also fields for searching and filtering the current results for a specific author or for a specific article ID. And finally, there are interaction buttons for saving snapshots of the results and comparing them to each other as explained below (see also section “Use case”). The control panel is aims to fulfill our design goal
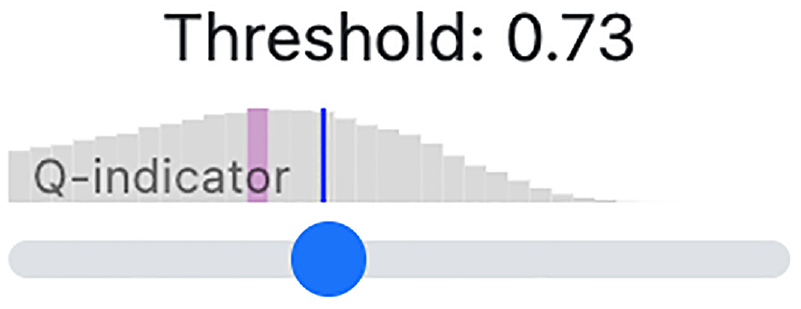
To guide the user in the search for best possible settings, the QI distribution for the current model is shown above the threshold slider. In this example, the user has positioned the slider (marked by a blue line) to the right of the score with maximal QI-score (indicated by the purple line). Whenever the user changes the model, the slider will be automatically positioned at the threshold with maximal QI-score.
Save: Enables the user to save snapshots of the yield from different settings so that they can be further analyzed and/or compared. The number of saved snapshots (if any) is shown in an indicator at the top right corner of the button, and the list of saved snapshots is shown at the bottom of the control panel (see Figure 1).
Erase: Clears the list of all saved snapshots.
Analyze: Enables the user to analyze the semantic overlap between the saved snapshots. If more than two snapshots are saved, a comparison matrix is displayed, and if exactly two snapshots are saved, a visual representation of the overlap is displayed (see section “Use case”).
Suggest: Triggers the application to suggest the snapshot which has the most semantic overlap with the others. This functionality enables the user to select the best possible settings (see section “Use case”).
Restart: Resets all settings to the initial state.
The main view allows the user to explore the current result at three different levels of detail. To begin with, an aggregated view is displayed which aims to provide an efficient assessment of the prevalence, content, and temporal distribution of the detected topics (see Figure 1). The main component of this view is a sorted list (highest prevalence first) where each topic is depicted as a rectangle. To allow for an efficient assessment of each topic’s position in time, the width and vertical positioning of the rectangle correspond to the distribution of the publishing time of the connected documents. Furthermore, the color intensity for the specific years allows for a relative comparison of the number of documents (the more documents, the higher the intensity). The height of the rectangle encodes the number of connected articles (the higher the number, the larger the height). However, to avoid disproportionate height differences, there is a maximal height for the rectangles regardless of the number of connected articles. If the height and width of the rectangle are sufficient, an annotation of the most common descriptor words, as well as information on how many descriptors and documents that have been aggregated, is shown. When hovering a subject rectangle, a tooltip containing all aggregated descriptors is shown (see Figure 1). The aggregated view aims to fulfill our design goals
The alternative design candidates for the main view were a heatmap style display 56 or a landscape metaphor. 57 In such designs, a projection of the embedding vectors to 2D-coordinates would be used to visually highlight/identify important aggregations of the projection points (i.e., groupings of descriptors that could be aggregated into a topic). However, an ordered list provides more spatial structure and hence offers a more efficient visual encoding, so we favor this design. The main reason for this is that the user does not need to scan and compare objects/groupings scattered in the plane to determine their relative order.
By clicking a rectangle, the user may proceed to explore the details of a selected topic (see Figure 3). In this view, each connected descriptor is displayed together with the titles of the documents which were used to create it. The descriptor is highlighted in blue text, and next to it the alternative majority words (if any) are displayed in black text (i.e., other words that also occur for a majority of the documents, but were not selected for this descriptor). This view allows the user to assess the overall coherence of the document groupings that were used to create the descriptors, and it aims to fulfill our design goals
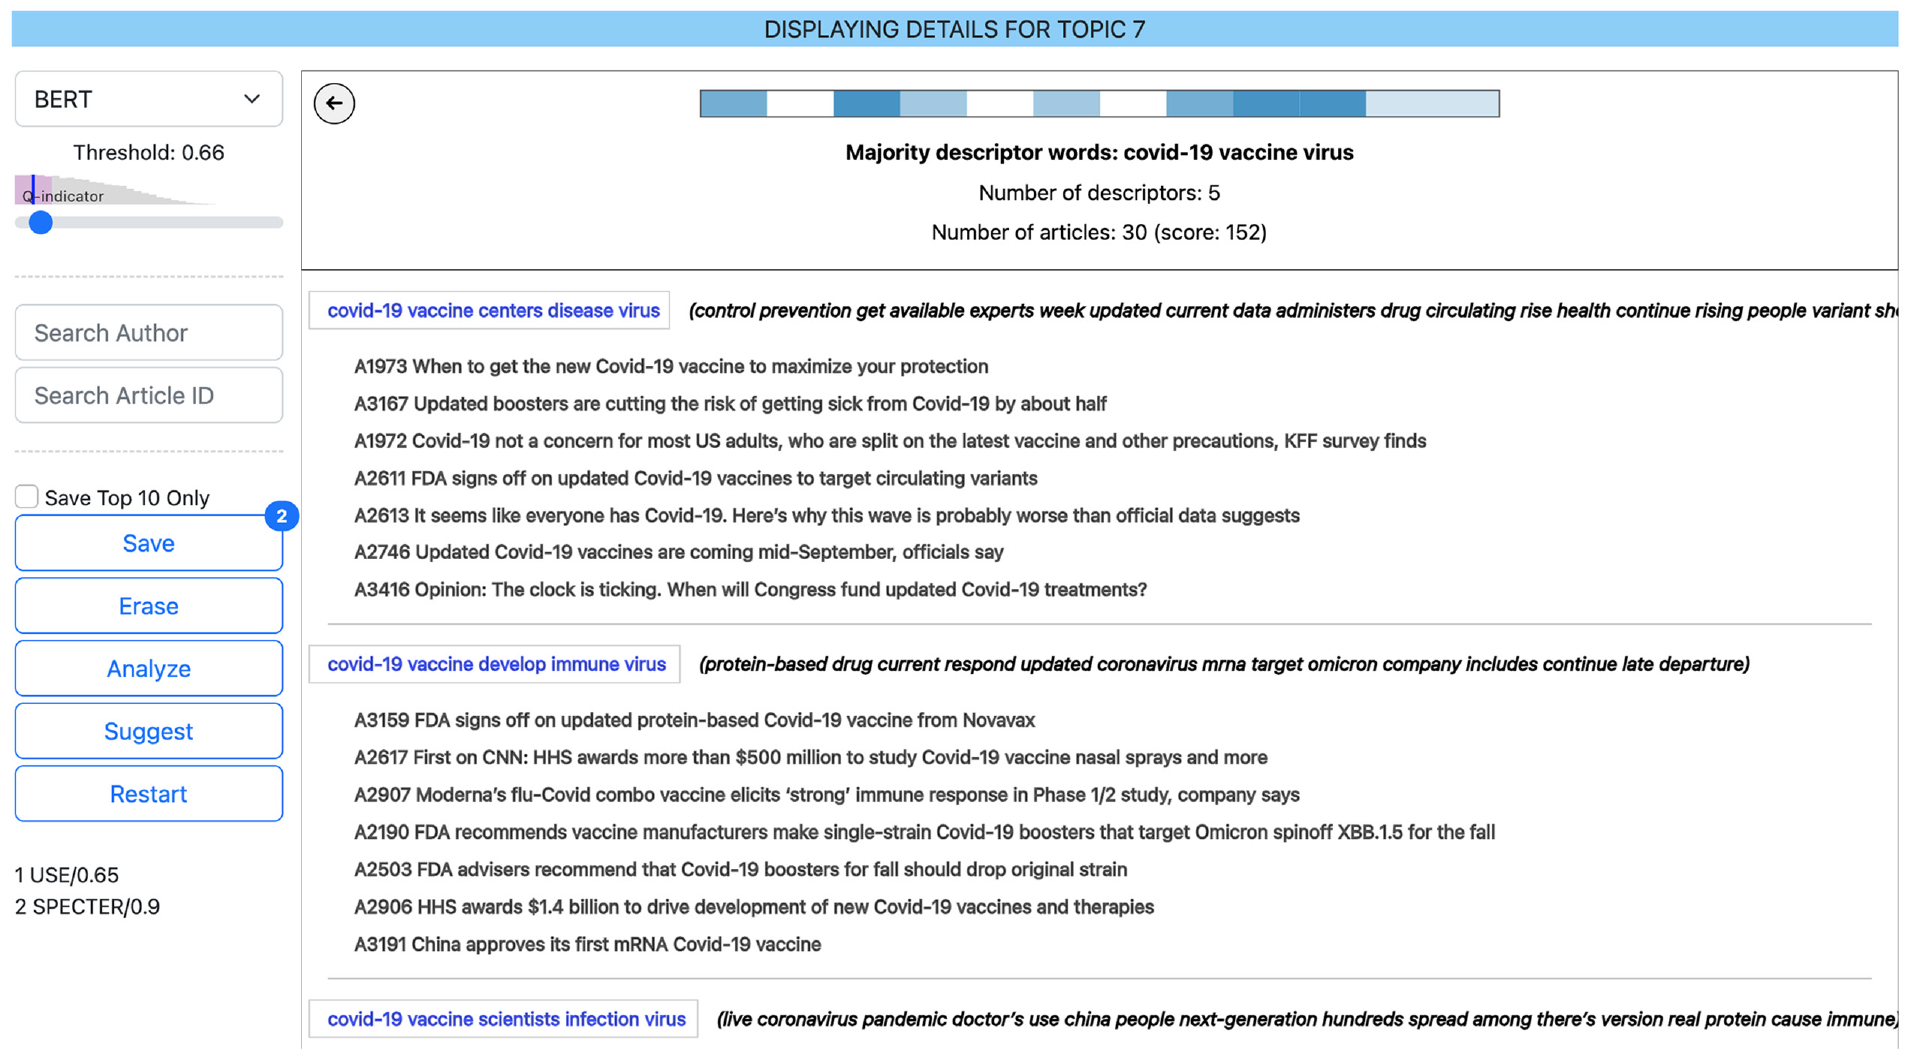
The Topic Details view displays all descriptors (in blue text) which are connected to the selected topic. Below each descriptor are the titles of the connected articles. Next to the descriptor, all other majority words (if any) are shown in black. In this case, the user has selected topic #7 in the list shown in Figure 1. The user can return to the list of topics by clicking the gray encircled back-arrow in the upper left corner.
When in the topic details view, the user can click a descriptor to display more details about how it was constructed (see Figure 4). In this view, the full texts of the contributing documents are displayed (with the descriptor words highlighted), so that the user can assess the context in which the descriptor words where harvested. Furthermore, an ordered radial ego network is displayed to give an overview of the nearest neighbors that were used to construct the article grouping. Neighboring nodes are ordered by their similarity score to the central node, highest scores first/closest. Document nodes which were used to construct the selected descriptor are highlighted, and the color intensity of the nodes encode the number of descriptor words that were found within the document (the higher the number, the higher the intensity). When hovering a network node, a tooltip containing detailed information about the similarity score and the number of word occurrences is shown. This view allows the user to evaluate the coherence of the connected articles and, in turn, assess the confidence of the generated descriptor. Furthermore, it aims to fulfill our design goals
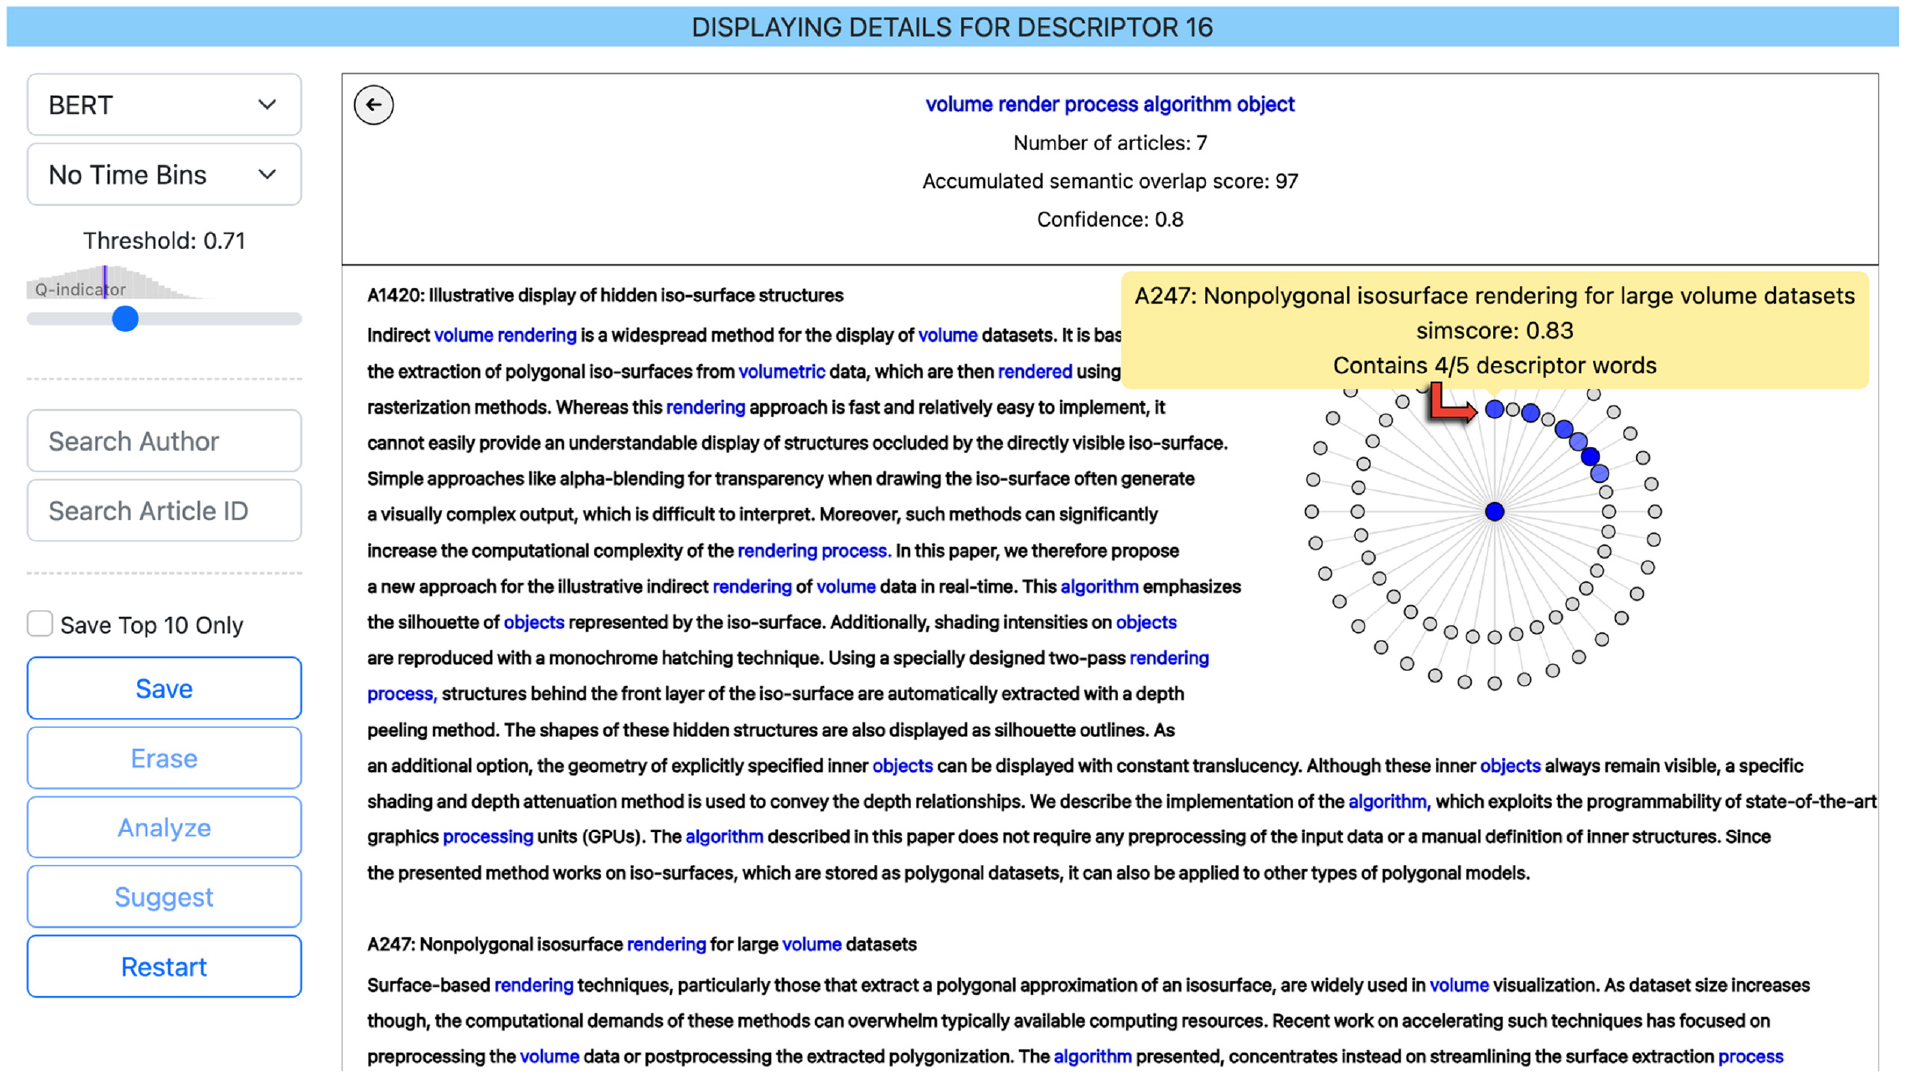
The Descriptor Details view displays the details of how the group of articles was assembled. The radial ego network shows the nearest neighbors of the central article node when it was traversed in the similarity network (highest similarity scores closest). Blue colored nodes indicate that the article was part of the group, and the color intensity indicates how many of the descriptor words are found within the article (the more words, the higher the intensity). Gray nodes indicate that the article was not part of the group which formed the descriptor (either because the similarity score was too low, or because it had already participated in forming a descriptor). Furthermore, the abstracts texts of the articles are shown with the descriptor words highlighted. This example is from the IEEE data set, and the user has clicked a descriptor in the topic details view. The node which was traversed in the similarity network is A170 (the central node of the ego network), and the user is hovering A247 (marked by the added red arrow), which was the first of the neighboring articles to be included in the group. The user can return to the Subject Details view by clicking the gray encircled back-arrow in the upper left corner.
Finally, there are specialized views for comparing the semantic overlap of different corpora which will be further described in section “Use case.”
Use case
In this section, we outline a use case scenario of a user who loads the IEEE VIS data set into PT-Extractor in order to get support for writing a survey of the content of the IEEE VIS conferences.
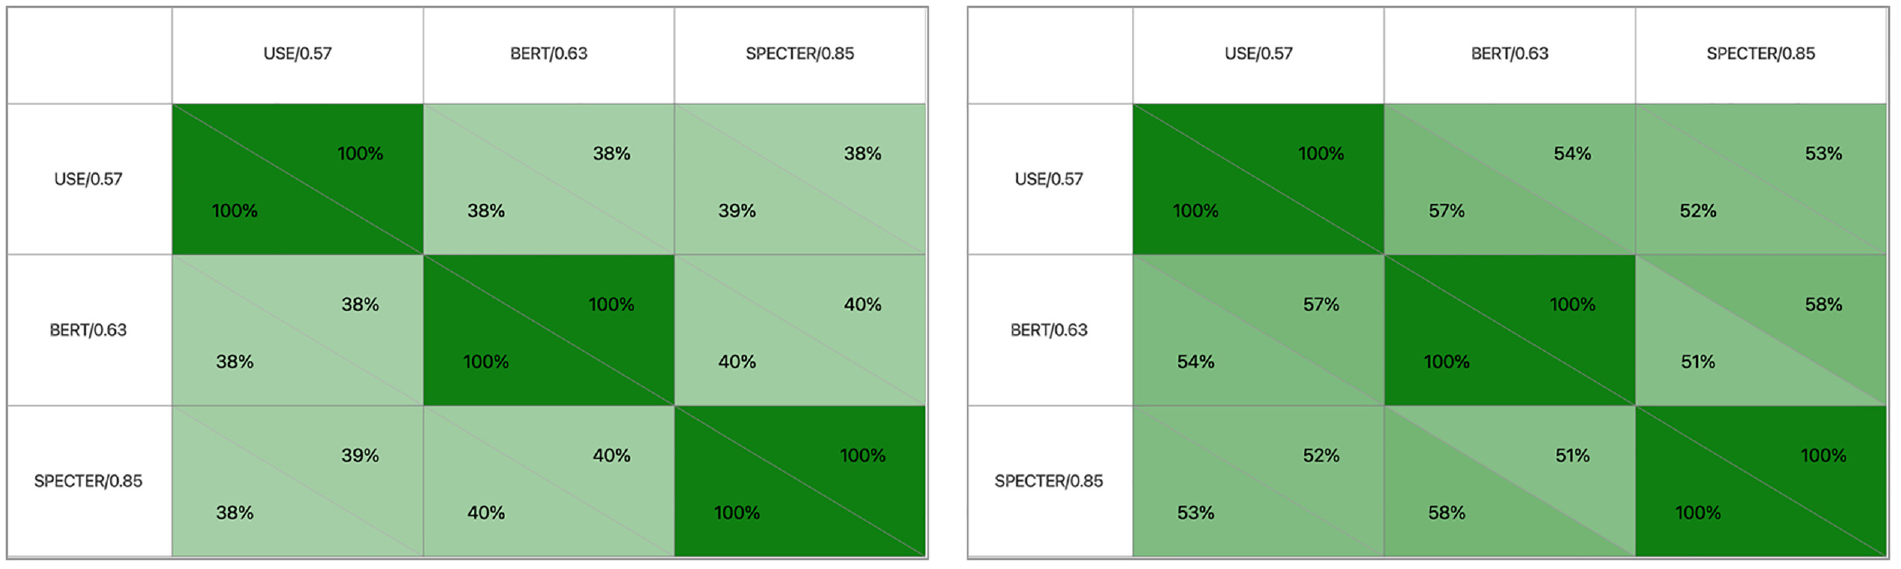
Comparing the semantic overlap of the lists of three different settings, the darker the green the higher the overlap. The overlap of the 10 most prevalent subjects (right) is higher than the total overlap (left), which indicates higher “model agreement” at the top of the prevalence list than at the bottom. As can be observed, the comparisons of overlap calculations are not necessarily symmetric (which is easily realized, given the example that we match a much smaller set to 100% into a larger set, which is in turn consequently matched to a much smaller fraction). For example, in the right matrix the BERT corpus is matched to 54% into the USE corpus, while the USE corpus is matched to 57% into the BERT corpus.
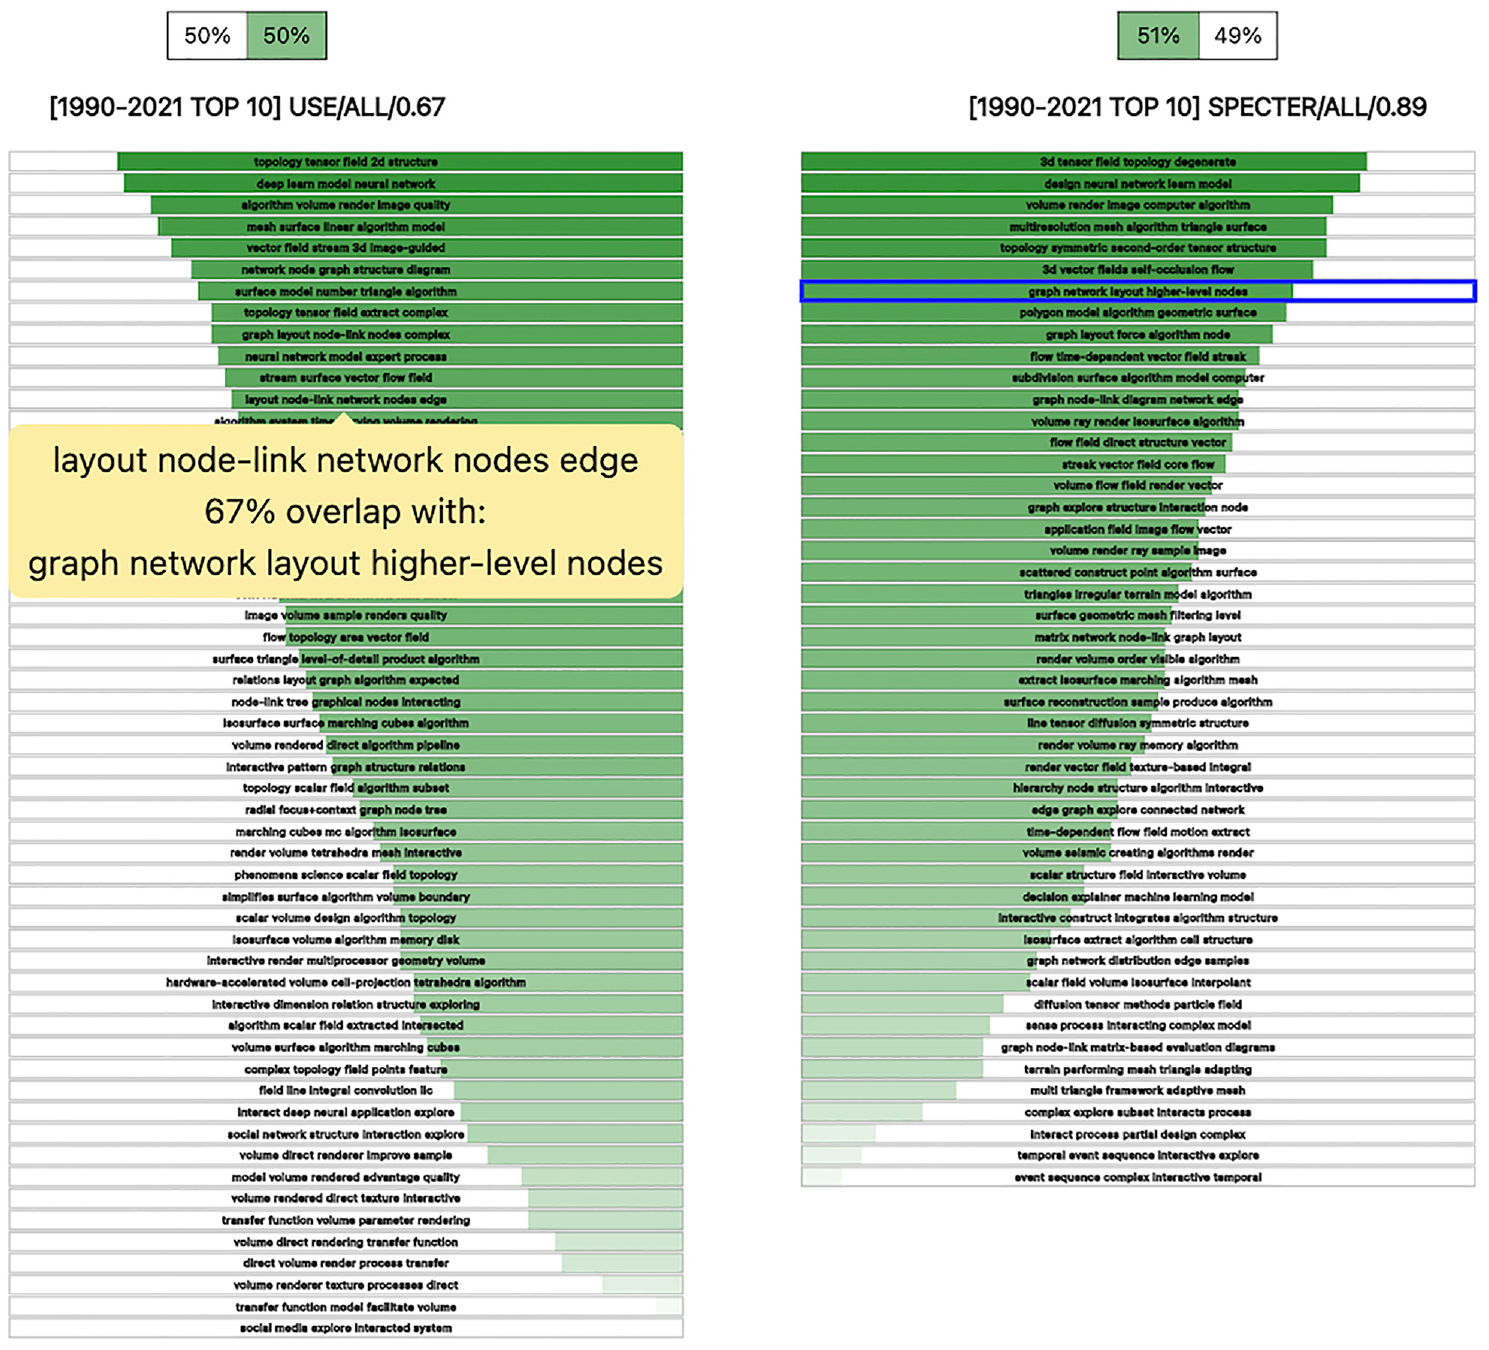
A visual representation of the semantic overlap of two specific yields. As can be seen, the overlap (double encoded by the length of the bar and the intensity of the color) differs from descriptor to descriptor. For some, a very similar descriptor can be found within the other corpus, while others are more unique and can only be matched to a small extent. In this example, the user is hovering a descriptor from the left corpus to display a tooltip with information of its best match in the right corpus (highlighted by the blue frame).
Step 4a: The user clears the saved snapshots and filters the result on article ID 2519. The user tries different settings and observes that the descriptor for this article changes (sometimes less and sometimes more) for each change. Consequently, the user wonders if it would be possible to suggest a single “most representative” candidate. The user presses the Save button to save all possible descriptors that can be generated for this specific article (which in this case amounts to 110 descriptors). The user then presses the Suggest button to trigger the semantic overlap calculations on which the suggestion is based. In these calculations, the descriptor with the maximal accumulated amount of semantic overlap, as compared to all the others, will be chosen. From the displayed view, the user can conclude that the suggestion for the “most representative” descriptor for this specific article is parallel program complex performance system. Furthermore, from the displayed MDS plot (calculated from the embedding vectors of the descriptors) the user can clearly see that the suggested descriptor is situated in the middle of the plot (see Figure 7, left). In other words, selecting the descriptor with maximal semantic overlap is closely related to selecting the “most central” point within the latent semantic space of the embedding vectors. The user agrees that, if forced to select a “most representative” descriptor out of the 110 different candidates, it makes sense to choose the most central one. Loosely speaking, this descriptor can be thought of as an approximative average of the set of all candidates.
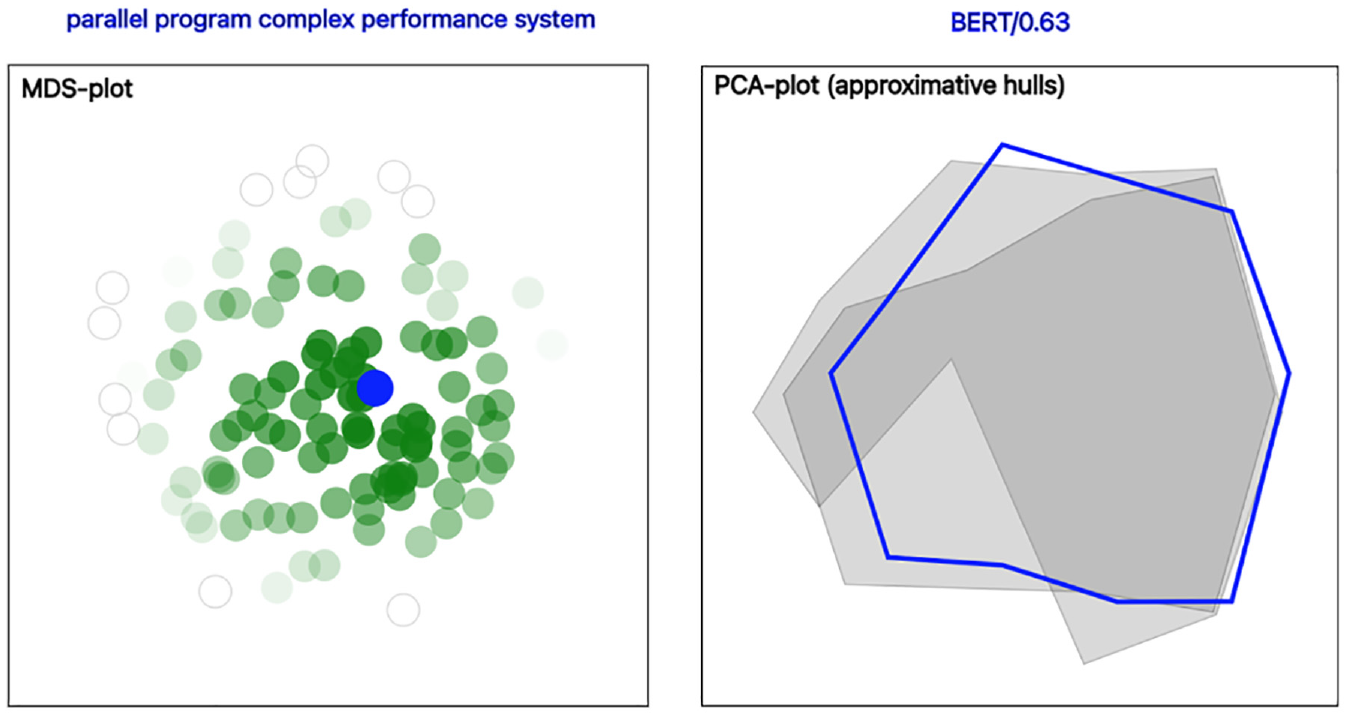
Using semantic overlap calculations to suggest the “most representative” observation from a set of candidates. To the left: the suggested descriptor (highlighted in blue text) appears in the center of the MDS plot (the blue dot), which indicates that it (loosely speaking) can be seen as an approximative average of the set (see section “Use case,” Step 4a). To the right: treating multi-descriptor corpora as “point clouds” allows us to make a suggestion (highlighted in blue text and blue hull) also for this scenario (see section “Use case,” Step 4b). The areas of the other three corpora are gray and partially transparent, so that their respective contours can be perceived when overlayed.
Step 4b: The user now realizes that the same line of reasoning can be applied to a scenario of choosing between several multi-descriptor sets. In this case, each set can be thought of as a “point cloud” within the latent semantic space (with each point representing a descriptor). Selecting the set with maximal semantic overlap once again corresponds to choosing the “most central one” (which makes sense for the same reasons as for the scenario with single-descriptor corpora). The user therefore once again saves the same three snapshots as in the second part of Step 2 and clicks the Suggest button. The application suggests the BERT model setting and displays a DR plot with approximative hulls (calculated by PCA) to visualize the distribution of the point clouds (see Figure 7, right). The user now understands how the application arrived at this conclusion, and the user feels confident that the suggested setting is a reasonable choice for the main task.
Validation
In this section, we present a validation run of our methodology on a data set with previously known topic structure. The validation data set contains 221 articles published between 2009 and 2017 at the Visual Information Communication and Interaction (VINCI) symposium. The rationale for choosing this specific corpus is twofold in that: (1) it is a relevant validation set for showcasing the generalizability of our method and (2) Kucher et al. 58 have performed an extraction of prevalent topics (using LDA) from full texts (see Table 1). The latter allows for a qualitative comparison of our method against traditional topic modeling. We specifically want to point out that no alterations or fine-tuning of the application or the computational pipeline were made to augment the performance during the validation.
Summary of the original LDA topics (five top terms as well as manually assigned titles in italics) for the VINCI 2009–2017 publications described by Kucher et al. 58
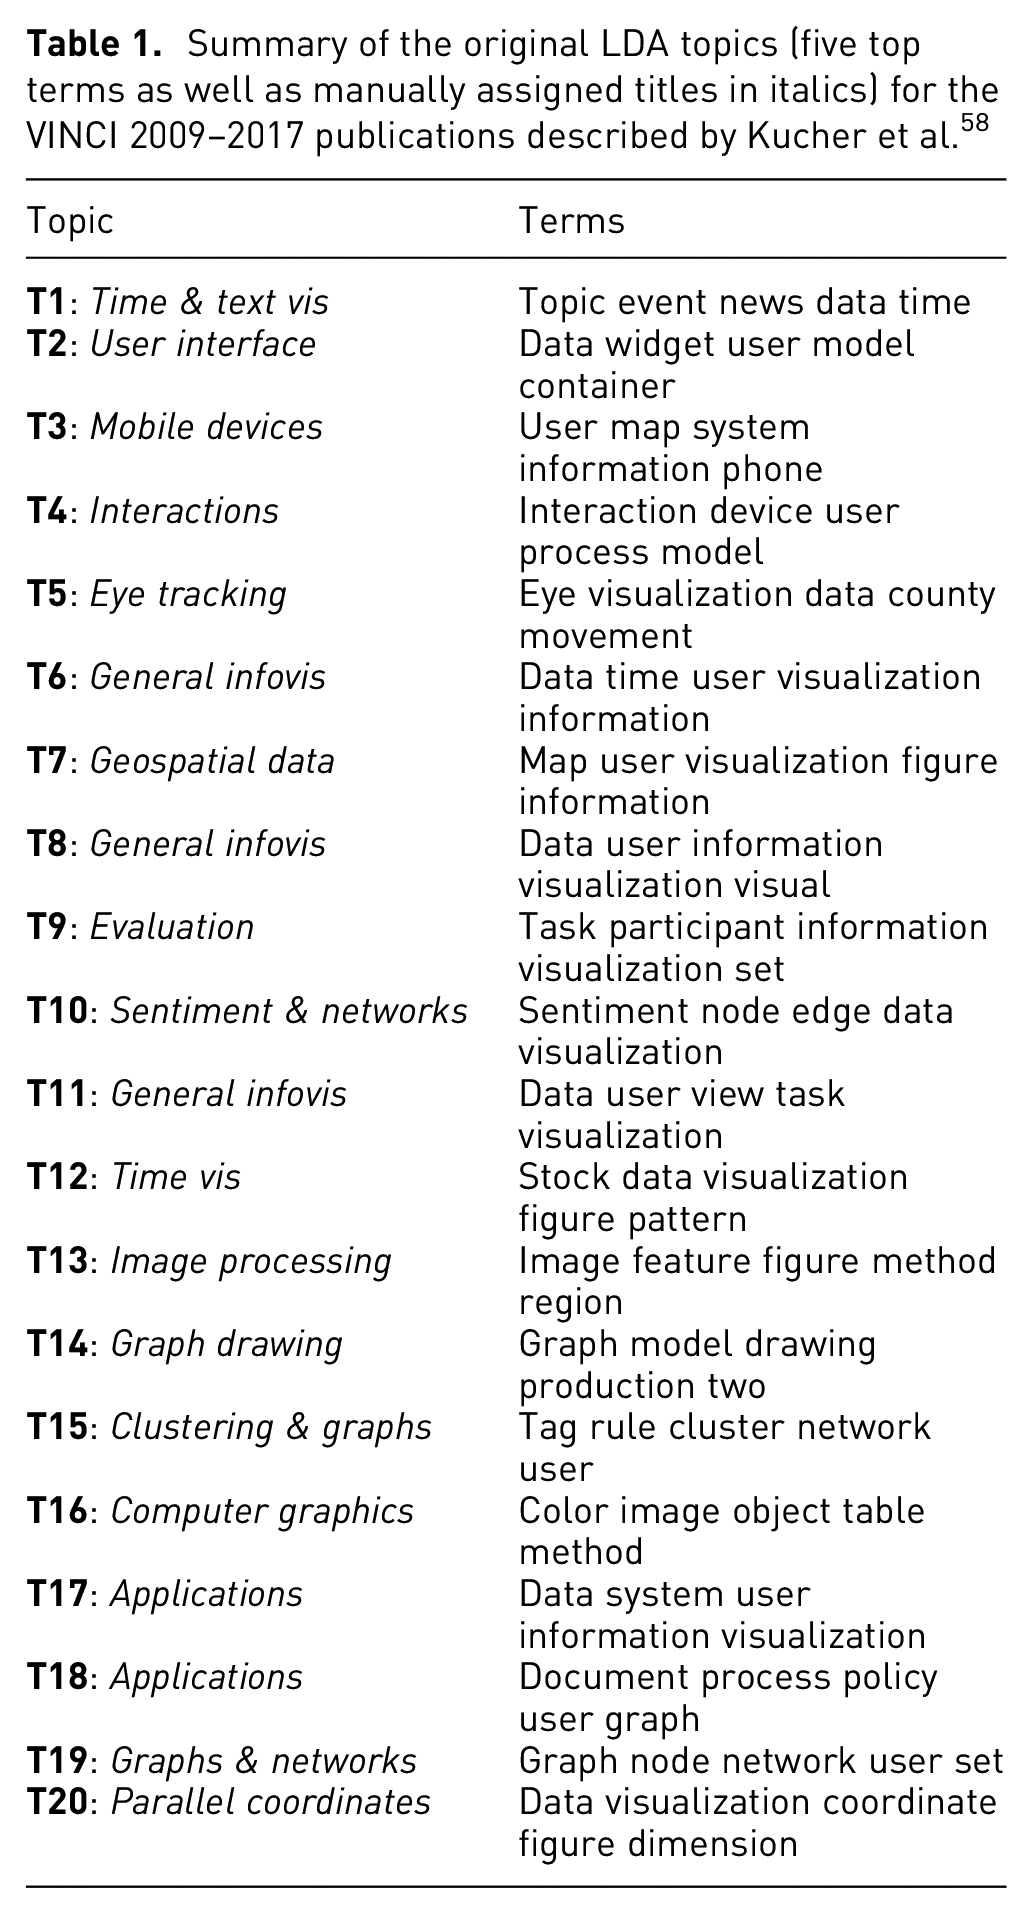
Seven of these topics are very general in their construction/labeling, which makes them challenging to rediscover unambiguously: User Interface (Topic 2), Interaction (T4), General Infovis (T6, T8 and T11), and Applications (T17 and T18). However, the other 13 topics provide more specific descriptions such as: Eye Tracking (T5), Geospatial Data (T7), Graphs & Networks (T19), and Parallel Coordinates (T20). For the validation to be successful, we would like to see several of these more specific topics appearing also in PT-Extractor. Furthermore, we would also like some additional discoveries—otherwise our proposed method does not add any value over traditional topic modeling.
After doing the same search for best settings as described in Section Use Case, we settle for the SPECTER model and the slider setting for maximal QI-score. With this setting, PT-extractor identifies a total of 47 subjects within the corpus, and for the purpose of the validation we focus our attention to the top 10 which are displayed in Table 2.
The 10 most prevalent subjects for the VINCI 2009–2017 publications from the SPECTER model.
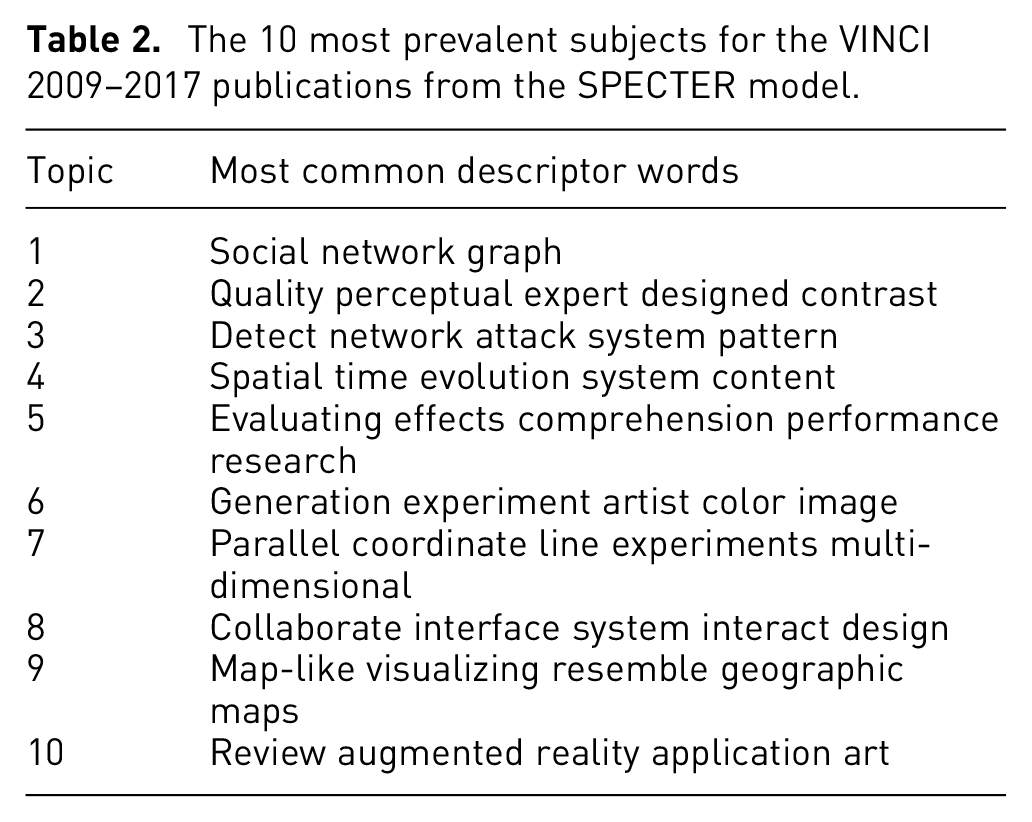
The most prevalent topic is social network graph, and a drill-down analysis confirms that it roughly corresponds to the aggregation of T14, T15, and T19. The second most prevalent topic is the quality perceptual expert designed contrast, which seems to encapsulate large parts of T5 and T9. The third most prevalent topic is the detect network attack system pattern, which has no correspondence in the topics suggested by Kucher et al., although it can be verified to be a coherent grouping of articles. The same is true for 6th placed generation experiment artist color image (on generating computer graphics), 8th placed collaborate interface system interact design (on collaborative interfaces), and 10th placed review augmented reality application ar (on augmented reality applications). On the other hand, in 4th place we have spatial time evolution system content (which corresponds to T1), in 7th place we have parallel coordinate line experiments multi-dimensional (which corresponds to T20), and in 9th place we have map-like visualizing resemble geographic maps (which corresponds to T7). Finally, from drill-down analysis we conclude that the article grouping for 5th placed evaluating effects comprehension performance research does not seem to be coherent, and that this subject therefore (although its descriptor appears to make sense) should be ignored.
From these results, we conclude that our method is able to detect several of the topics proposed by LDA, as well as several which were not proposed. The ordering by prevalence reveals which of the proposed topics are prevalent in the corpus, and thus provides deeper insights than the topic listing obtained by Kucher et al. We also argue that the subject descriptors generated by PT-Extractor are, in general, more coherent and easily understandable than the topic descriptions generated with LDA. This may be partly due to the fact that we use different lists for stop-word filtering, but the risk of groupings of unrelated topic words is a well-known weakness of LDA. All-in-all, we argue that the results presented in this section validates our proposed approach by showing that (1) is generalizable beyond our main data sets and (2) compares well to traditional topic modeling. Furthermore, our method also provides extra value such as prevalence ordering and automatic detection of the number of subjects.
To explore further options while testing the generalizability of the proposed pipeline, we have also computed document embeddings for this use case with LLM2VEC 59 and the Meta-Llama-3-8B model. 60 The top 10 topics from this model are displayed in Figure 8. Some of these topics are relatable to the results of SPECTER and/or Kucher et al., and others are not. However, when drilling down into the proposed subjects it seems like the coherence of the grouped articles in general is lower than for the other models (i.e., articles that to the human eye do not seem to be very similar have more often been grouped together).
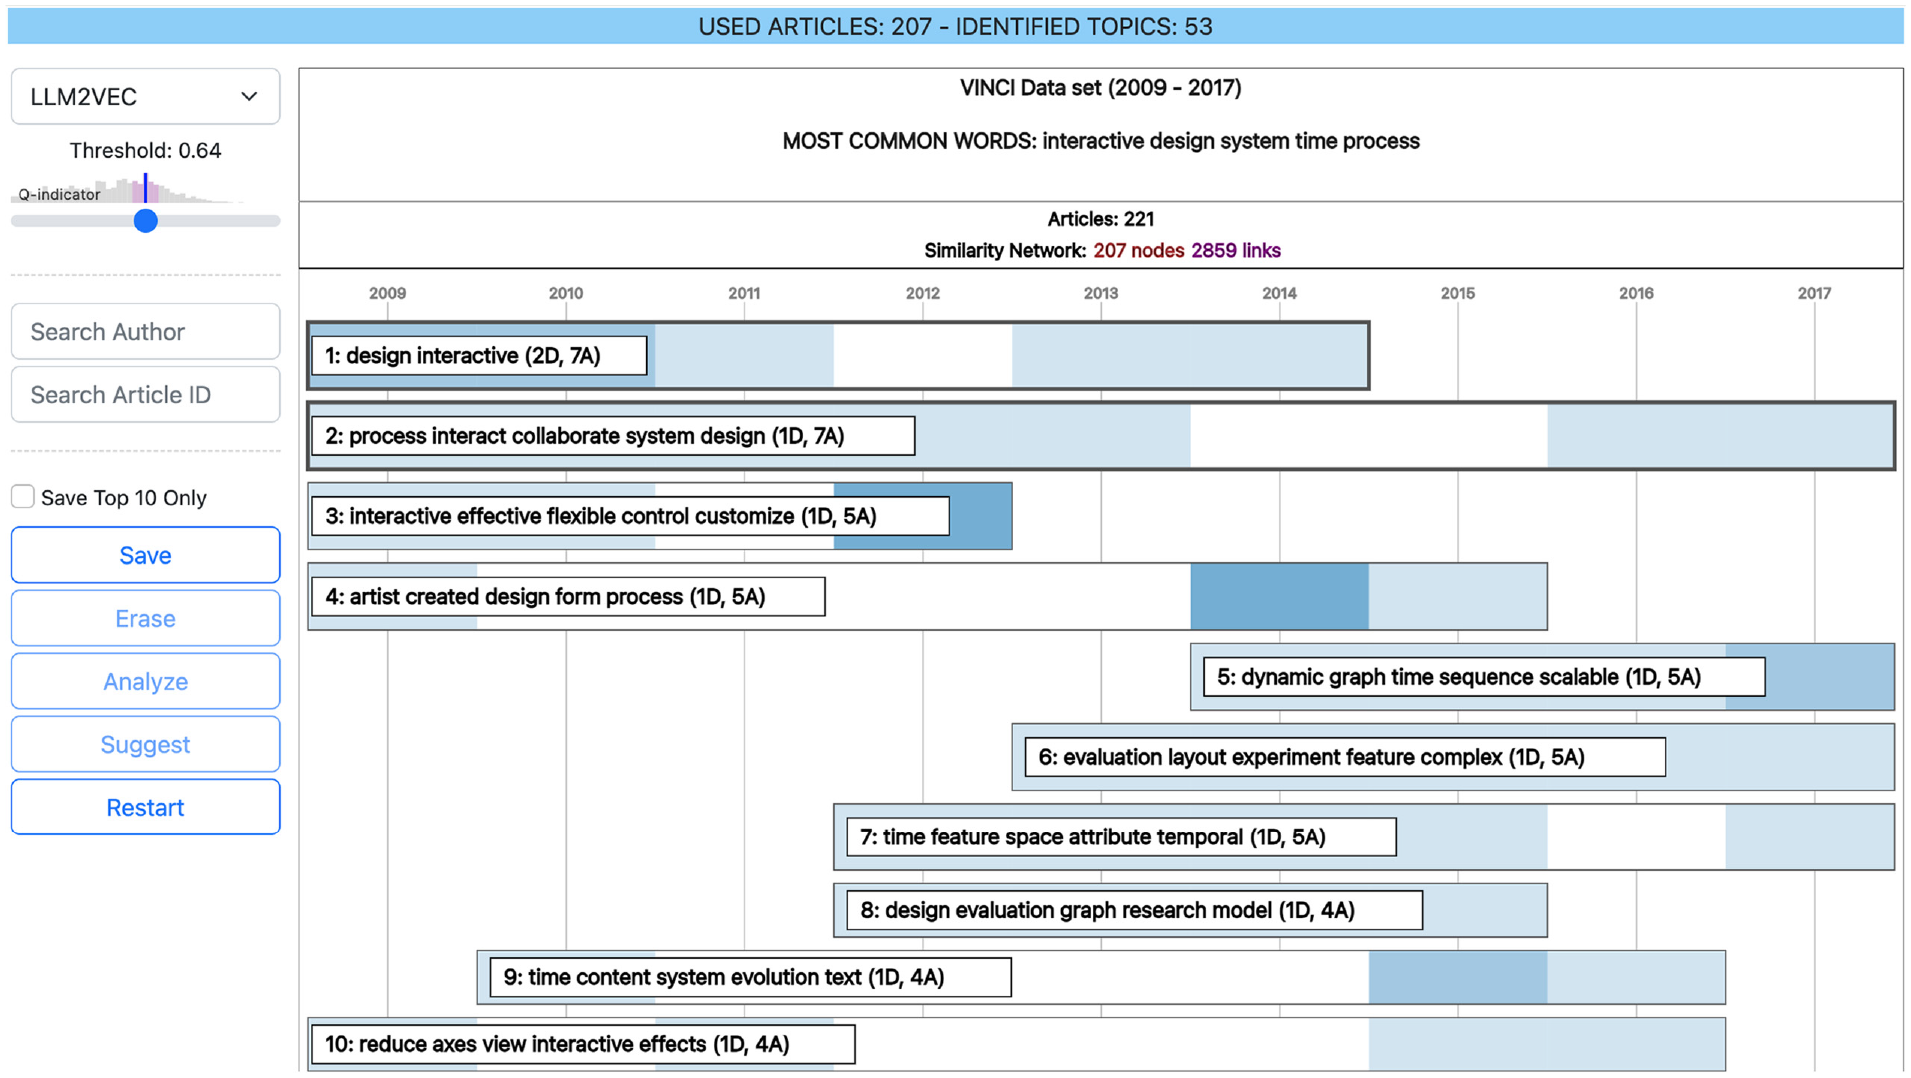
The 10 most prevalent topics for the VINCI 2009–2017 publications from using LLM2VEC (with the Meta-Llama-3-8B model) at the threshold setting for maximal QI-score. Some of the topics are relatable to the results from SPECTER and/or Kucher et al., and some are not. However, when drilling down into the topics it seems like, in general, the coherence of the grouped articles is lower than for the other models.
User study
Evaluation is an important step for determining if a new interactive visualization approach is successful or not with regard to certain criteria, such as for instance usability. 61 In this section, we present the results from our user study which focused on our intended user profile and the design goals as specified in section “Visualization approach.” Our main goal was to investigate whether users without expert knowledge could make use of our proposed methodology and tool after only a short introduction. The study had a total of six participants who all were master students in computer science with only moderate knowledge of visualization and machine learning.
All sessions were individual, held in a guided walkthrough format, and with a maximal duration of 1 h. Each participant was given an introduction to PT-Extractor and then spent approximately 15–20 min on the task of selecting a setting yielding a list of topics that they felt confident was a good representation of the true corpus content. During the sessions, the participants were observed by the test leader, and they were encouraged to verbalize their thoughts and questions out loud. Any comments or questions were directly answered by the test leader. At the end of the sessions, the participants were asked to give their overall impression of the tool and to fill out a questionnaire inspired by the ICE-T evaluation form. 55 The questions in the evaluation form were directly linked to our design goals. For aggregating the results, we performed a numerical translation of the answer options to a scale from 1 to 7, with higher scores indicating better results. Figure 9 provides an overview of the scores, indicating that a majority of the participants have graded PT-Extractor at the higher end of the scale.
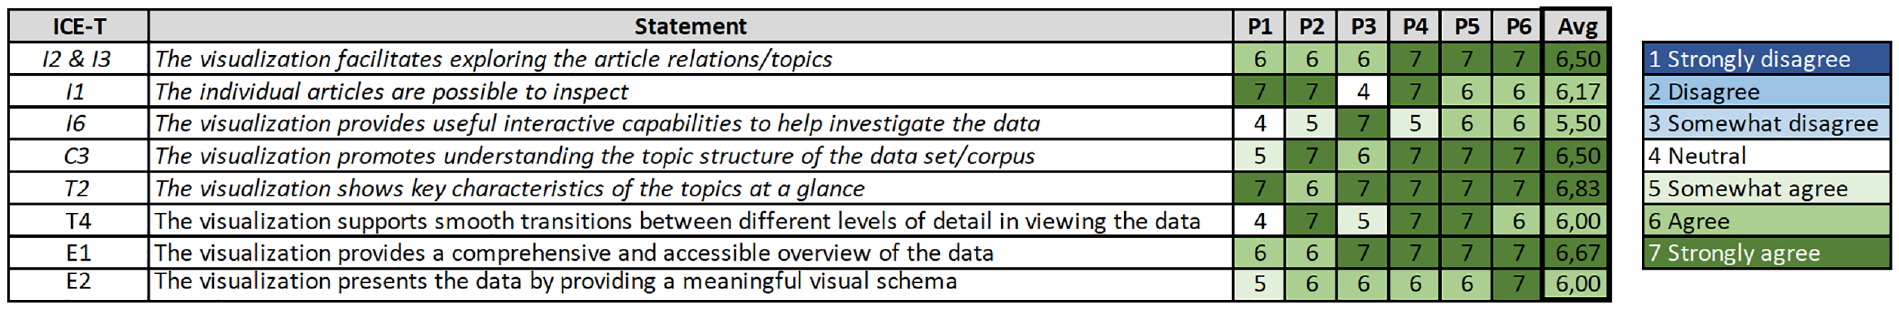
The individual and average scores of the statements in our evaluation form. The column to the left shows the relation to the corresponding ICE-T statement. The five first statements have been modified and are highlighted in italics. The final three statements are identical to the ICE-T form. The original ICE-T questionnaire focus on the ability of the visualization approach to discover insights, decrease time for task solving, convey essence of the data, and generate confidence about the data. 55 Green is indicating good results, as opposed to blue, and white indicates the neutral value.
The observations during the test sessions revealed that all but one participant initially used a strategy of trying several different setting and manually keeping track of reoccurring topics. When asked, these participants explained that seeing the same topic occurring high on the list for several different settings made them feel more confident that it indeed belonged to the “true” list of most prevalent topics. All participants valued the possibility to save and analyze several different lists and then have the tool suggest one of them. They also appreciated the graph of the distribution of the Q-indicator above the slider since it helps to narrow down the area of search. Two participants expressed the wish for functionality to align several lists to compare the rank order of the yielded topics. After the sessions, all participants were confident that the choice/suggestion that they had settled for was a good representation of the “true” list of most prevalent topics of the corpus. Our general assessment of the study setting and the obtained feedback is that the consistent and positive results provide support for the claims that the methodology is working and that the chosen design is a suitable choice for the targeted user profile.
Discussion and conclusions
Starting from the seemingly simple and straightforward motivating question “What are the most prevalent topics within this corpus?” we have developed a new general method for prevalent-aware topic extraction together with a VA solution to address this analytical challenge. By this we have affirmatively answered our first research question (
Novel computational approach
The identified shortcomings in traditional methods lead us to design and propose a novel approach for prevalent-aware topic extraction—which should be seen as a complement to traditional topic modeling. We demonstrate how to use the pairwise semantic similarity of the documents to construct different similarity networks depending on the choice of language model and setting of the threshold score. The networks are then traversed in a “prevalence-aware” way to construct article groupings and corresponding topic descriptors. As we have shown in section “Use case” and Figure 6, the answer to our second research question (
Further extensions fitting the overall design of our computational approach could benefit from the recent (and future) advances in natural language processing and specifically language models, such as the ongoing work on applying large language models60,62 for improvement of text embeddings.59,63 According to the recent study by Muennighoff et al., 64 no individual text embedding approach evaluated by the authors dominated the rest across all tasks (including semantic text similarity). These findings suggest that relying on a single embedding approach/model for all possible use case scenarios would be suboptimal, and the users can thus benefit from the flexible design of our computational pipeline—combined with the exploration and analysis capabilities provided by our interactive visual interface.
Furthermore, our computational approach could be extended with further intermediate processing of the similarity network. As discussed above, some of the modern topic modeling (or rather topic analysis) approaches such as BERTopic 52 or Top2Vec 53 apply DR and clustering for document embeddings to identify coherent groups of similar documents; while our approach currently relies on traversal of the similarity network, clustering or community detection methods could be applied to identify such groups of nodes instead, 65 while the similarity network itself can be subject to graph/network embedding methods 66 with further analyses applied. Such alternatives provide exciting opportunities for future work, although the risks related to performance and stability of the respective pipelines should also be acknowledged. Taking user input or feedback into account for adjusting the computations (e.g., similar to user-defined boost keywords in PUREsuggest by Beck 21 ) provides yet another opportunity for more personalized corpus exploration and targeted search. Such extensions can be considered part of future work.
A limiting factor of our implementation is the pairwise strategy for calculating the semantic similarity, since it scales poorly to really big corpora (i.e., the number of pairs grows with the square of the number of documents). Nevertheless, the strategy should be a viable option for corpus sizes up to 10,000 documents, which would allow for use in many real-world scenarios. Further considerations for improving the scalability of our computational—but also visual—approaches 67 can be considered part of future work.
Visualization and trust
We have implemented our proposed methodology into a prototype visual analytics tool, called PT-Extractor, which guides the user’s exploration of the data in search for the best possible answer to our motivating question. In addition to standard visualization solutions, it features a novel visualization for the detected topics (which captures both prevalence and temporal aspects) as well as a novel visualization for comparing the semantic overlap of two corpora. Once again, we want to underline that the rationale for developing the proposed visualization is that prevalence aware topic extraction could be used for providing overviews and/or condensations of large corpora. This can in turn be a vital tool for different analysis scenarios, such as exploring a previously unknown field, quantifying textual content for statistical analysis, or investigating the most important topic trends within a time series of documents.
Since similarity is a concept that is inherently subjective, one main difficulty with the task at hand is that there is no single objective true and correct answer. Therefore, the solution space presents itself as a large number of candidate suggestions, each with its strength and weaknesses, rather than a traditional optimization problem with a global optimum. The main drawback is that it is not possible to prove that one candidate is better than another—and at first glance this would seem to suggest that the motivating question is impossible to answer. However, we can clearly see that both extremities of the similarity score threshold setting yield unwanted properties. A very high setting yields a very sparse similarity network with highly reliable similarity links (which in turn gives very few detected topics, but of high reliability). A very low setting yields a very dense network with many unreliable similarity links (which in turn gives many topics, but of which many may be unreliable). It is therefore reasonable to expect that some setting in between these two would give a better-balanced yield. Hence, the focus of the application lies on helping the user to locate such “best possible” settings/yields, and at the same time build trust for the process. As verified by our user study, the answer to our third research question (
The trust building is complicated by the fact that the choice of model and threshold setting has a big impact on the yielded result. Nevertheless, the fact that, for both data sets, a fair amount of topics reoccur on the “most prevalent list” for several combinations of models and thresholds can balance this issue. As expressed by our user study participants, seeing the same candidates turn up for several different settings augments the trust since the probability of all these lists being simultaneously wrong could hopefully be regarded as relatively low. As for our fourth research question (
Validation and user study
As described in section “Validation,” we were able to successfully validate our proposed methodology and tool by applying them to a validation data set and verify the results against the results obtained by traditional topic modeling. In this process, some of the main advantages of our method (i.e., automatic detection of the number of subjects, and the prevalence ordering) were highlighted to sustain our claim of added value. However, as we do not aim to show that our contribution is “better” than traditional topic modeling (but rather that it is more suited for some specific scenarios), the main conclusion should be that the choice of method must depend on the specific conditions of the targeted analysis scenario. After all, there are scenarios where our approach would not be suitable, for instance, if all documents must be treated in a uniform way. Further validations based on computational methods, for example, including some of the relevant and applicable scenarios for text similarity and specifically semantic similarity evaluation,64,68,69 can be considered part of future work.
The results from the user study (see Figure 9) clearly indicate that the chosen design fulfills the design goals that we set out. Furthermore, since the profile of the participants matched our targeted user profile we may also conclude that PT-extractor, and the proposed methodology, can be used by non-experts. This, together with the potential for generalizability, hopefully augments the chances of our contribution becoming a useful tool for several analysis scenarios. Still, additional user studies 61 can be considered part of future work in order to collect further evidence of the performance of our proposed approach as well as user feedback for further improvements, for example, with alternative data sets as well as real-world applications.
Settings and stop words
As described in section “Computational approach,” our implementation makes use of some specific settings which deserve further discussion. The choice of using a maximum of seven documents to form a descriptor is a trade-off between obtaining very specific or very general descriptor sentences (i.e., the larger the grouping of documents, the higher the risk that only very general words occur for a majority of the documents). The ability to group the descriptors on semantic overlap (i.e., if a topic has been split over several groups) makes our method perform fairly consistent in the range [5–10] for this parameter, and after some experimenting we settled for 7. The choice of using five words in our descriptors is a trade-off between compactness and expressiveness. With this length, we are able to capture a main subject (for instance, direct volume rendering) as well as some more specific details and still manage to group related descriptors on semantic overlap. Using longer descriptors makes it harder to group them, since the variability of the details might be too great to suggest high similarity. If targeting other corpora both these magic numbers (although being reasonable choices to start from) might have to be adjusted.
The stop-word filtering would also have to be revised if another corpus was to be targeted (i.e., add/remove words from the list). For instance, for the IEEE VIS data set almost all of the publications contain words such as “visualize” or “visualization,” and consequently we filter all words from the stem “visual” to avoid such words ending up in (almost) all descriptor sentences.
Future work and improvement
Besides the points already discussed above in this section, we see two major directions for future work and improvement. First, it would be interesting to try alternative ways for traversing the similarity network. Instead of using the node degree, this could, for instance, be done by calculating the strength/quality of the links and to promote documents with many high similarity scores. Second, it would be interesting to try strategies based on rank analysis/alignment for constructing a combined result out of several different candidate lists.
Footnotes
Funding
The author(s) disclosed receipt of the following financial support for the research, authorship, and/or publication of this article: This work was partially supported through the ELLIT environment for strategic research in Sweden. The work of Ilir Jusufi was supported in part by the Knowledge Foundation, Sweden, through the project “Rekryteringar 21, Universitetslektor i spelteknik” under contract 20210077.
Supplemental material
Supplemental material for this article is available online.
References
Supplementary Material
Please find the following supplemental material available below.
For Open Access articles published under a Creative Commons License, all supplemental material carries the same license as the article it is associated with.
For non-Open Access articles published, all supplemental material carries a non-exclusive license, and permission requests for re-use of supplemental material or any part of supplemental material shall be sent directly to the copyright owner as specified in the copyright notice associated with the article.