
Abstract
Companies are increasingly using predictive modeling to manage customer churn proactively. While extant customer retention literature centers mainly on propensity models, recent research indicates merits of uplift models for targeting retention efforts toward customers. However, prior research on uplift modeling relies largely on experimental data and tailored uplift algorithms, making it difficult and costly for practitioners and researchers to apply. Thus, we investigate the applicability and competitiveness of an uplift modeling procedure for customer retention management combining propensity score matching with meta-learner approaches (standard machine learning algorithms). Using a semi-synthetic churn dataset with 1980 customers, we affirm the effectiveness of propensity score matching for reducing covariate imbalance in observational data. The empirical experiments show that meta-learner uplift models outperform tailored uplift random forest approaches regarding Qini scores and computation efficiency. Moreover, the results imply that targeting retention efforts based on a meta-learner uplift model reduces churn more effectively than using propensity models.
Introduction
Customer churn, also referred to as customer defection or attrition, is a persistent challenge for many businesses that seek to sustain profitability and long-term customer relationships (Blattberg et al., 2008; Lemmens & Gupta, 2020; Neslin et al., 2006; Pondel et al., 2021). As acquiring new customers is costly, retaining existing ones is essential for long-term success and firm value (Ascarza et al., 2016). Accurately predicting customer behavior is therefore a key element of proactive customer retention management (Ascarza, 2018).
Customer churn prediction and response models help marketing teams segment customers by estimating who is likely to churn or respond to marketing actions (Ascarza et al., 2018; Z.-Y. Chen et al., 2015; Lemmens & Gupta, 2020). These models allow firms to implement targeted retention measures designed to persuade customers to stay before they defect (Blattberg et al., 2008). However, despite their popularity and strong predictive power, traditional propensity models often lead to ineffective campaigns because they ignore the causal nature of customer responses (Ascarza, 2018; Devriendt, Berrevoets, & Verbeke, 2021). Propensity models cannot answer questions such as “Did this customer stay because of the campaign?” or “Would this customer have left without the incentive?” As a result, marketing resources may be wasted on customers who would have stayed anyway or cannot be retained through incentives (Caigny et al., 2021).
To overcome these limitations, recent studies have promoted uplift modeling as a more causal approach to customer retention management (Ascarza, 2018; Guelman et al., 2015; Provost & Fawcett, 2013). Uplift modeling estimates the incremental impact of a treatment (e.g., a retention offer) on a customer’s likelihood of staying (Hansotia & Rukstales, 2002; Li et al., 2018). By estimating the treatment effect directly, uplift models identify persuadable customers who are most likely to respond positively to a campaign, allowing firms to focus efforts where they make the greatest difference (Kane et al., 2014; Rößler et al., 2021).
Despite these advantages, uplift modeling remains difficult to apply in practice. Most approaches depend on randomized controlled trials (RCTs), which are expensive, time-consuming, and often impractical because they require random targeting that conflicts with established marketing processes (Haupt et al., 2019; Radcliffe, 2007). In addition, many uplift models rely on specialized algorithms that are complex, computationally demanding, and difficult for practitioners to interpret (Caigny et al., 2021; Zhang et al., 2022). Recent advances in heterogeneous treatment-effect estimation and information systems research make uplift modeling more accessible for practical use by building on existing implementations of modern algorithms. However, these advances have not yet been fully adopted in the uplift modeling literature or evaluated in the context of customer retention.
This study addresses these challenges by proposing an accessible and efficient uplift modeling procedure that works with observational data. Specifically, we combine propensity score matching (PSM) with meta-learner approaches to make uplift modeling more practical and transparent for customer retention management. Meta-learner approaches refer to modeling frameworks that use standard machine learning algorithms in structured combinations to estimate the causal effect of an intervention on individual outcomes. The study examines whether this approach is competitive with existing uplift modeling techniques and more effective than traditional propensity models. We focus on two key questions: (1) Do meta-learner-based uplift models perform as well as or better than specialized uplift algorithms? and (2) Does targeting based on the proposed approach improve campaign effectiveness compared to conventional churn prediction methods?
Our contribution is twofold. First, we introduce propensity score matching as a causal inference technique for uplift modeling, addressing calls by Gubela et al. (2017) to explore alternatives to randomized controlled trials. This extension enables the use of uplift models when data are not fully randomized. Second, we apply and evaluate different meta-learning approaches to demonstrate that uplift modeling can be implemented using existing machine learning tools without custom algorithms. Together, these contributions advance both theory and practice: theoretically by expanding the methodological foundation of uplift modeling through causal inference, and practically by offering marketers a feasible and interpretable approach to improve retention targeting.
Related Work
General Uplift Modeling Literature
Research on uplift modeling falls into two families. First, tailored algorithms modify standard learning methods particularly tree-based and ensemble models to estimate uplift directly. Early work formalized tree splits that account for treatment and control to maximize differential response (Radcliffe & Surry, 1999), with subsequent variants on split criteria and pruning (Rzepakowski & Jaroszewicz, 2012b) and ensemble formulations such as uplift random forests (Guelman et al., 2015; see also Sołtys et al., 2015). Recent studies integrate insights from heterogeneous treatment-effect research to stabilize splitting and improve robustness (Rößler et al., 2021). These approaches build on the general CART tradition (Breiman et al., 2017) but modify objectives to target incremental effects rather than outcomes.
Second, meta-learners, uses standard predictive models to estimate uplift by decomposing the causal problem into simpler sub-tasks (Curth & van der Schaar, 2021; Künzel et al., 2019; Nie & Wager, 2021). Single-model formulations either transform the outcome to a “treatment-consistent” label for direct classification (Gutierrez & Gérardy, 2017; Jaskowski & Jaroszewicz, 2012; Lai et al., 2006) or add a treatment indicator and interactions so that uplift is recovered from fitted responses (Lo, 2002; sometimes termed the S-learner, Künzel et al., 2019). Two-model approaches estimate separate models for treated and control groups and define uplift as their difference (T-learner; Hansotia & Rukstales, 2002; Radcliffe, 2007). More recent multi-step learners (e.g., X- and R-learners) incorporate nuisance components such as propensities or response functions to construct treatment-effect estimators (Künzel et al., 2019; Nie & Wager, 2021; Okasa, 2022). In practice, meta-learners are attractive because they retain off-the-shelf tooling while accommodating heterogeneous effects, whereas tailored trees optimize a task-specific objective and can yield interpretable segmentation. Together, these streams delineate a design space that balances model specificity (tailored trees) against implementation flexibility (meta-learners).
Uplift Modeling for Customer Retention
In customer retention management, most uplift modeling studies focus on single tailored approaches. For example, Guelman et al. (2012) applied an uplift random forest in an insurance retention case, and Ascarza (2018) demonstrated its effectiveness in field experiments for a wireless provider and a membership organization. Lemmens and Gupta (2020) extended this work by incorporating a profit-based loss function, while Caigny et al. (2021) introduced a tailored uplift logit leaf model for B2B contexts.
Only a few studies compare different modeling paradigms from both the tailored and meta-learner streams. Radcliffe (2007) contrasted an early S-learner formulation (Lo, 2002) with a decision tree uplift model in a mobile phone retention case. Devriendt et al. (2018, 2021) further benchmarked S- and T-learners against tailored uplift models and traditional churn prediction models, confirming the potential of uplift modeling for more profitable targeting.
Despite these advances, most research continues to rely on randomized controlled trials (RCTs) as the causal foundation of uplift modeling. However, RCTs are costly and logistically challenging, as random targeting often conflicts with established marketing practices (Ascarza, 2018; Haupt et al., 2019). These constraints, combined with the technical complexity of uplift algorithms, limit adoption in practice (Rößler et al., 2021). To address these challenges, our study introduces propensity score matching as a causal inference method for uplift modeling and combines it with meta-learners to enhance accessibility and applicability in observational data settings.
Methodology
Dataset Description and Preparation
For the experimental evaluation, we use a semi-synthetic churn dataset generated from covariate data of a real-world telecom dataset—a common practice in causal inference (Fredrik et al., 2016; Hill, 2011; Louizos et al., 2017). We simulate only the treatment indicator and outcomes to maintain realism while preserving the structure of actual customer data. The original CrowdAnalytix 1 churn dataset contains 3,333 observations with 19 covariates describing usage patterns (e.g., number of calls) and customer characteristics such as area of living. We remove redundant variables (e.g., state, already captured by area), drop the churn indicator, and encode categorical variables via One-Hot-Encoding. The final dataset includes 5 binary and 15 continuous covariates.
Outcomes and treatment indicators are generated using a modified version of the uplift data generation algorithm implemented in the pylift Python library (Yi & Frost, 2018). The simulation steps are as follows: 1. Standardize the real-world covariates using z-standardization, where the sample mean is subtracted from every observation and then divided by the sample’s standard deviation. 2. Generate a coefficient 3. Create an error term 4. Generate a binary treatment indicator 5. Define a vector 6. Calculate the outcome 7. Append outcomes and treatment indicator to the covariate dataset.
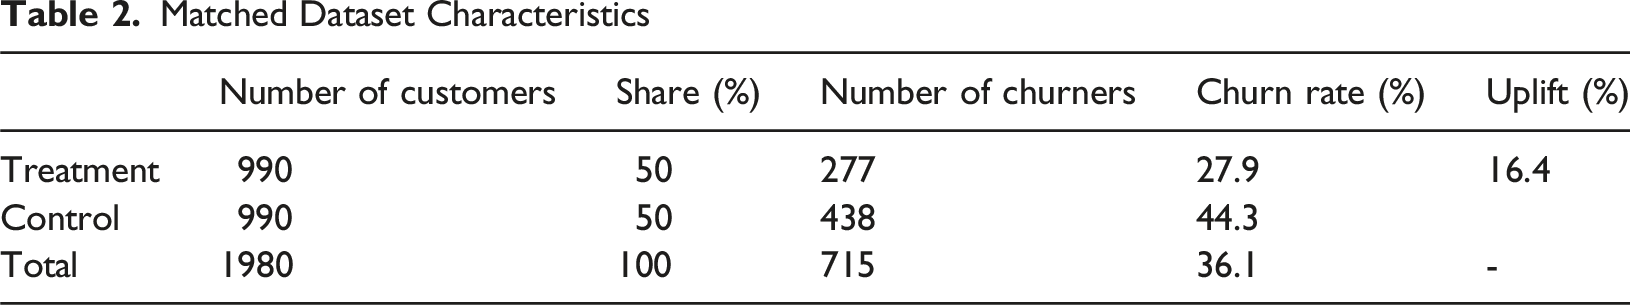
The resulting dataset initially reflects an experimental setup due to random treatment assignment. To simulate an observational setting, we introduce selection bias following Hill (2011) by discarding nonrandom portions of the treatment group. Specifically, we remove customers with zero service calls, account age under 20 days, or more than 25 voicemail messages—representing customers unlikely to receive retention offers. This yields 990 treated and 1,711 control observations, closely mirroring realistic campaign targeting scenarios.
Experimental Setup and Procedure
Our experiment comprises three parts. First, we apply propensity score matching (PSM) to observational data for uplift modeling. Second, we compare meta-learner uplift models with a widely used tailored approach. Third, we benchmark the best meta-learner uplift model against the top-performing churn prediction and customer response models. We use nested cross-validation, with an inner loop for hyperparameter tuning and an outer loop for performance assessment (Gattermann-Itschert & Thonemann, 2021). Effectiveness is measured with model-specific metrics, and the impact of alternative targeting practices is simulated under different campaign scenarios.
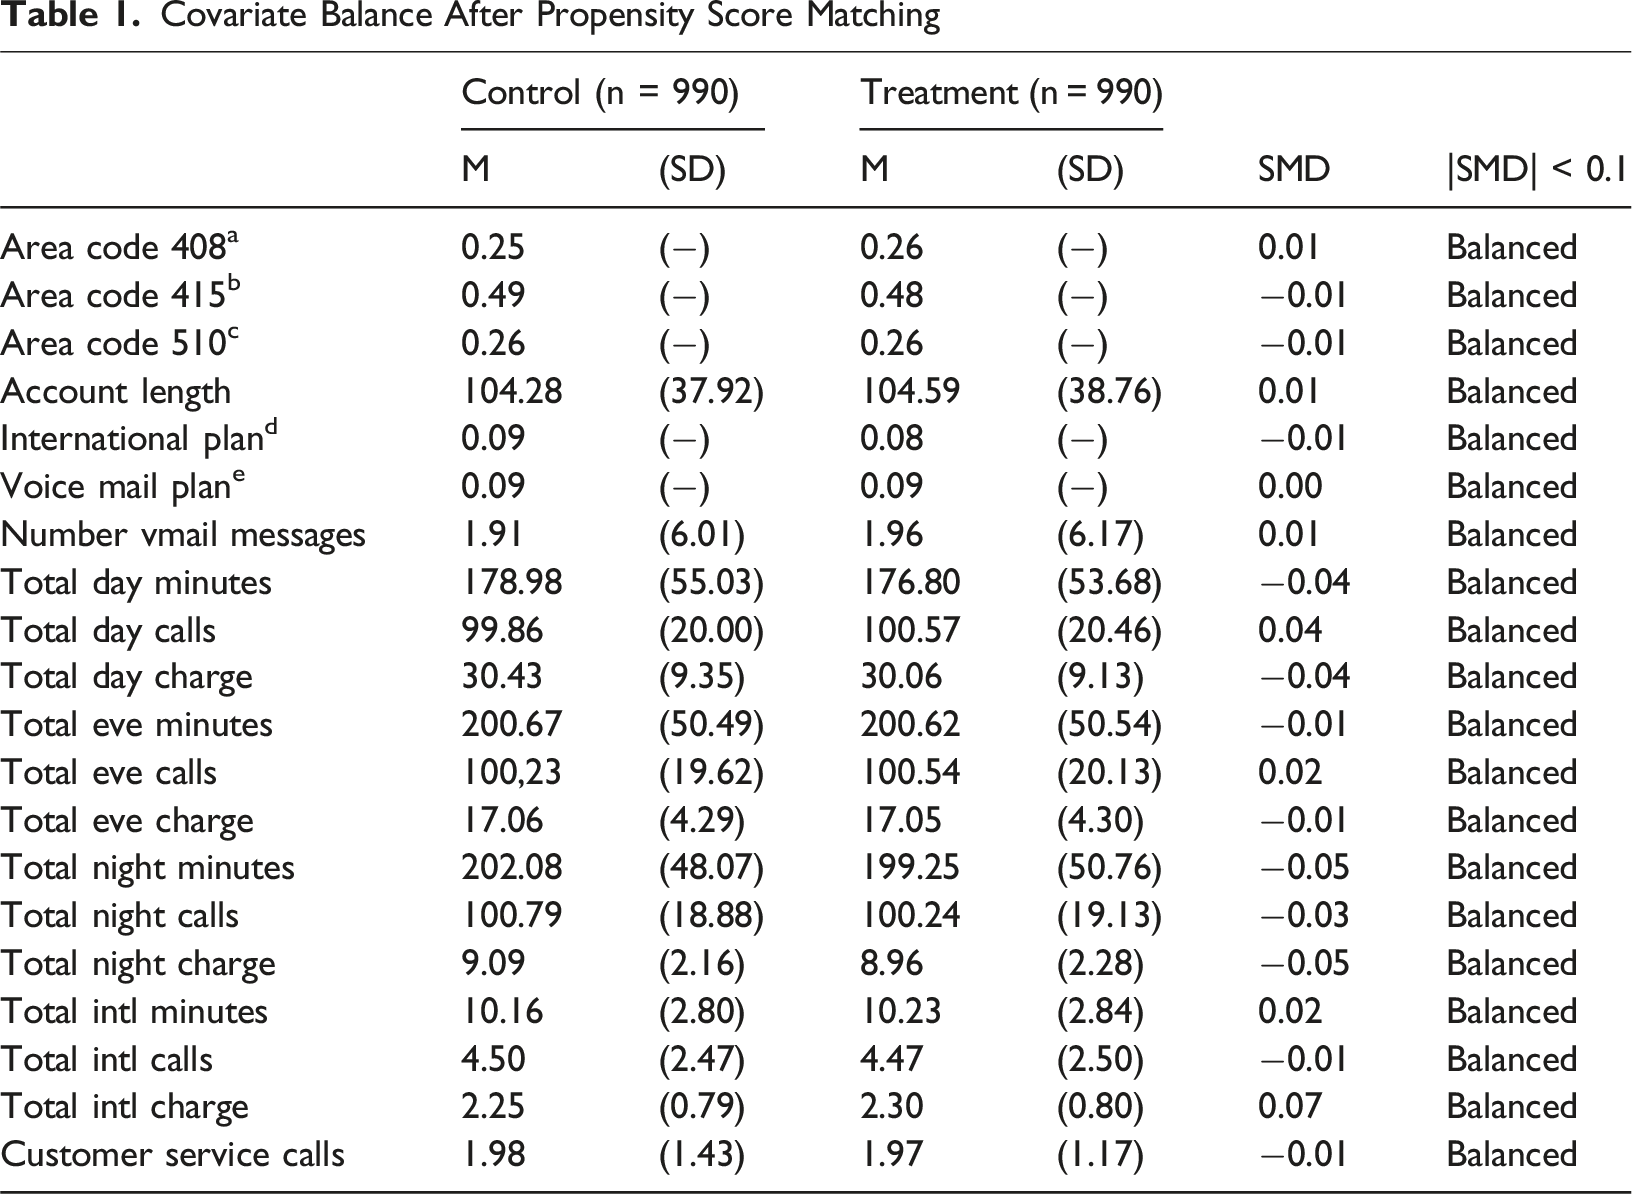
In observational data, treatment and control groups often differ in baseline characteristics, biasing treatment effect estimates (Stuart, 2010). We therefore use standardized mean differences (SMDs) to assess covariate balance (Austin, 2009; Rosenbaum & Rubin, 1985). SMDs express mean differences in pooled standard-deviation units, making balance comparable across covariates (Austin, 2011).
We employ propensity score matching to mitigate covariate imbalance in uplift estimation. Among causal inference techniques, such as inverse probability weighting or instrumental variables, PSM is widely used for observational studies (Caliendo & Kopeinig, 2008). Because it separates confounder adjustment from treatment-effect estimation, PSM integrates easily into uplift modeling. The method balances covariates by pairing treated and untreated observations with similar propensity scores, defined as the probability of treatment conditional on observed covariates P (Ti = 1|Xi) (Rosenbaum & Rubin, 1983). Matching is conducted in R (MatchIt package; Ho et al., 2011) using generalized boosted models (GBM) for propensity estimation (Lee et al., 2010; McCaffrey et al., 2004; Setoguchi et al., 2008) and one-to-one nearest-neighbor matching (Rubin, 1973; Thoemmes & Kim, 2011).
We then estimate four meta-learners (S-, T-, X-, and R-learners) and one tailored uplift random forest using logistic regression, random forest, and XGBoost as base learners. For the uplift random forest, we test the KL, ED, and CHI split criteria (Rzepakowski & Jaroszewicz, 2012a). The uplift random forest serves as a benchmark due to its strong prior performance (Ascarza, 2018; Devriendt et al., 2018; Guelman et al., 2015). All models are implemented in Python using the CausalML library (H. Chen et al., 2020), with scikit-learn (Pedregosa et al., 2011) and XGBoost (T. Chen & Guestrin, 2016) for base learners.
For model training, uplift models use both treatment and control observations, churn prediction models use control-group data only, and response models use treatment-group data reflecting standard practice (Ascarza, 2018; Devriendt, Berrevoets, & Verbeke, 2021). Hyperparameters are optimized with the Hyperopt library (Bergstra et al., 2013) using the Tree of Parzen Estimators algorithm (Bergstra et al., 2011) over 50 trials. Performance is scored via Qini coefficient (uplift models) and AUC (propensity models). We also record runtime per trial and compare efficiency using paired t-tests. Detailed hyperparameter grids and settings are available upon request.
Analysis
We conduct different analyses to evaluate the effectiveness of targeting a retention campaign based on uplift and propensity models. We start by predicting the metrics used for the targeting decision for each of the considered models. The target metric for the uplift model is the expected incremental effect of the campaign (uplift). For the customer response model, it is the response propensity, and for the churn prediction model, it is the churn propensity. We predict the metrics for each observation in the outer validation folds. The metrics are defined as follows:


where

and for the churn prediction model as follows:

where
Results
Covariate Balance
Covariate Balance After Propensity Score Matching
Matched Dataset Characteristics
Performance Comparison of Meta-Learner and Tailored Uplift Models
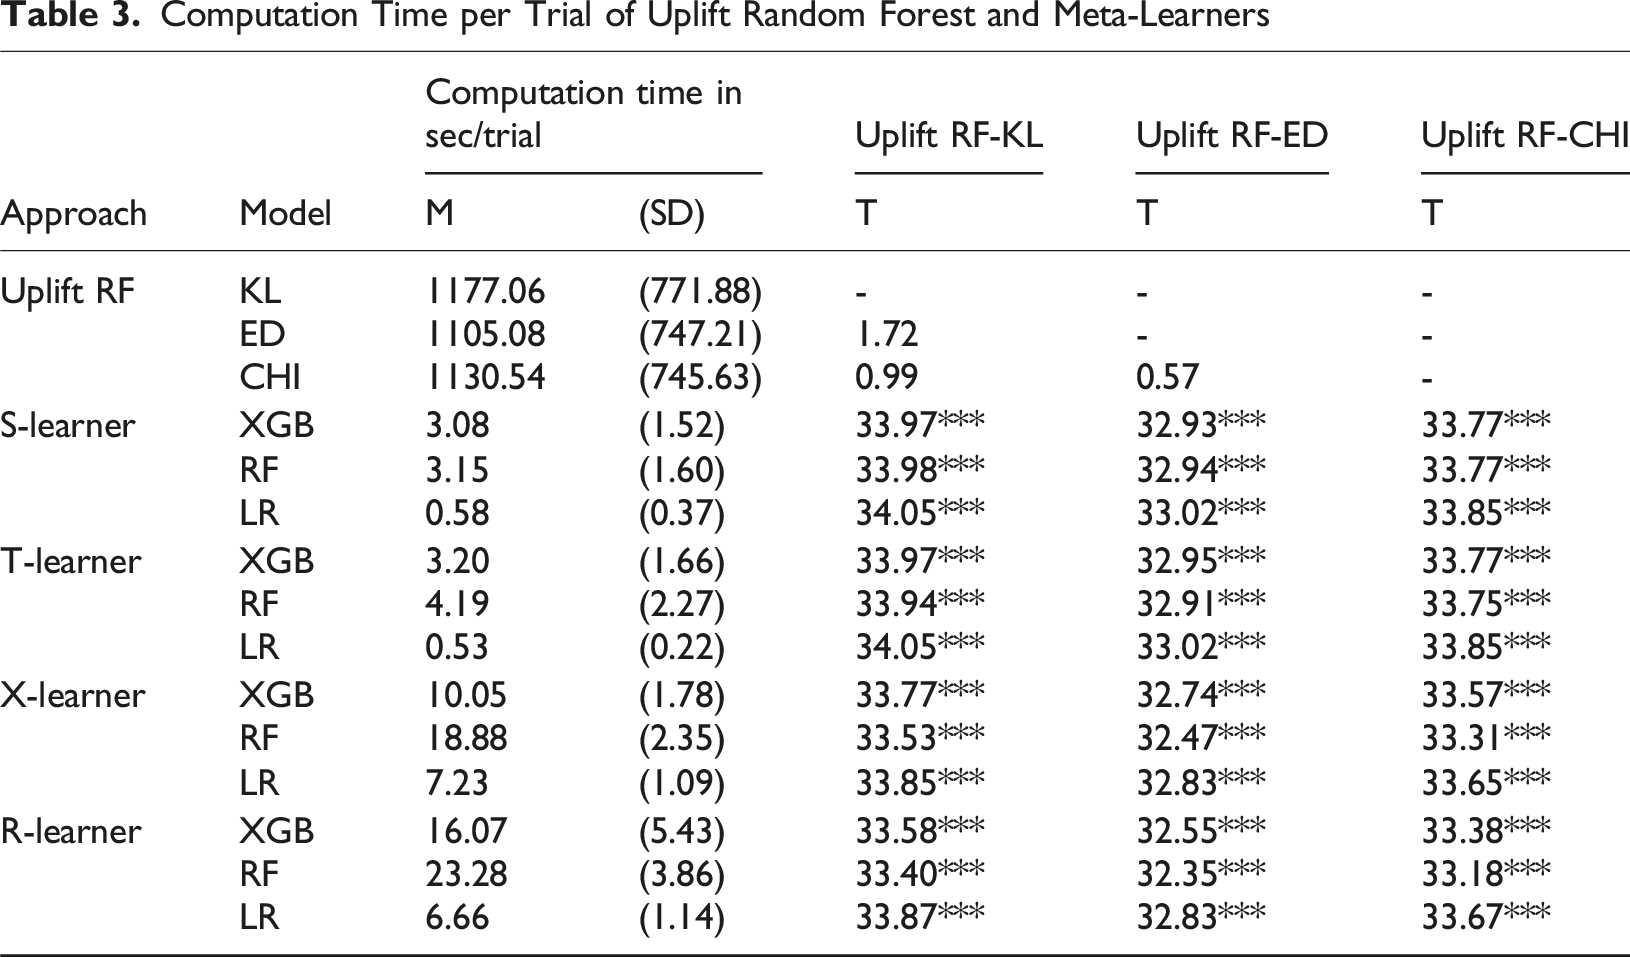
Computation Time per Trial of Uplift Random Forest and Meta-Learners
Qini Performance of Uplift Random Forest and Meta-Learners
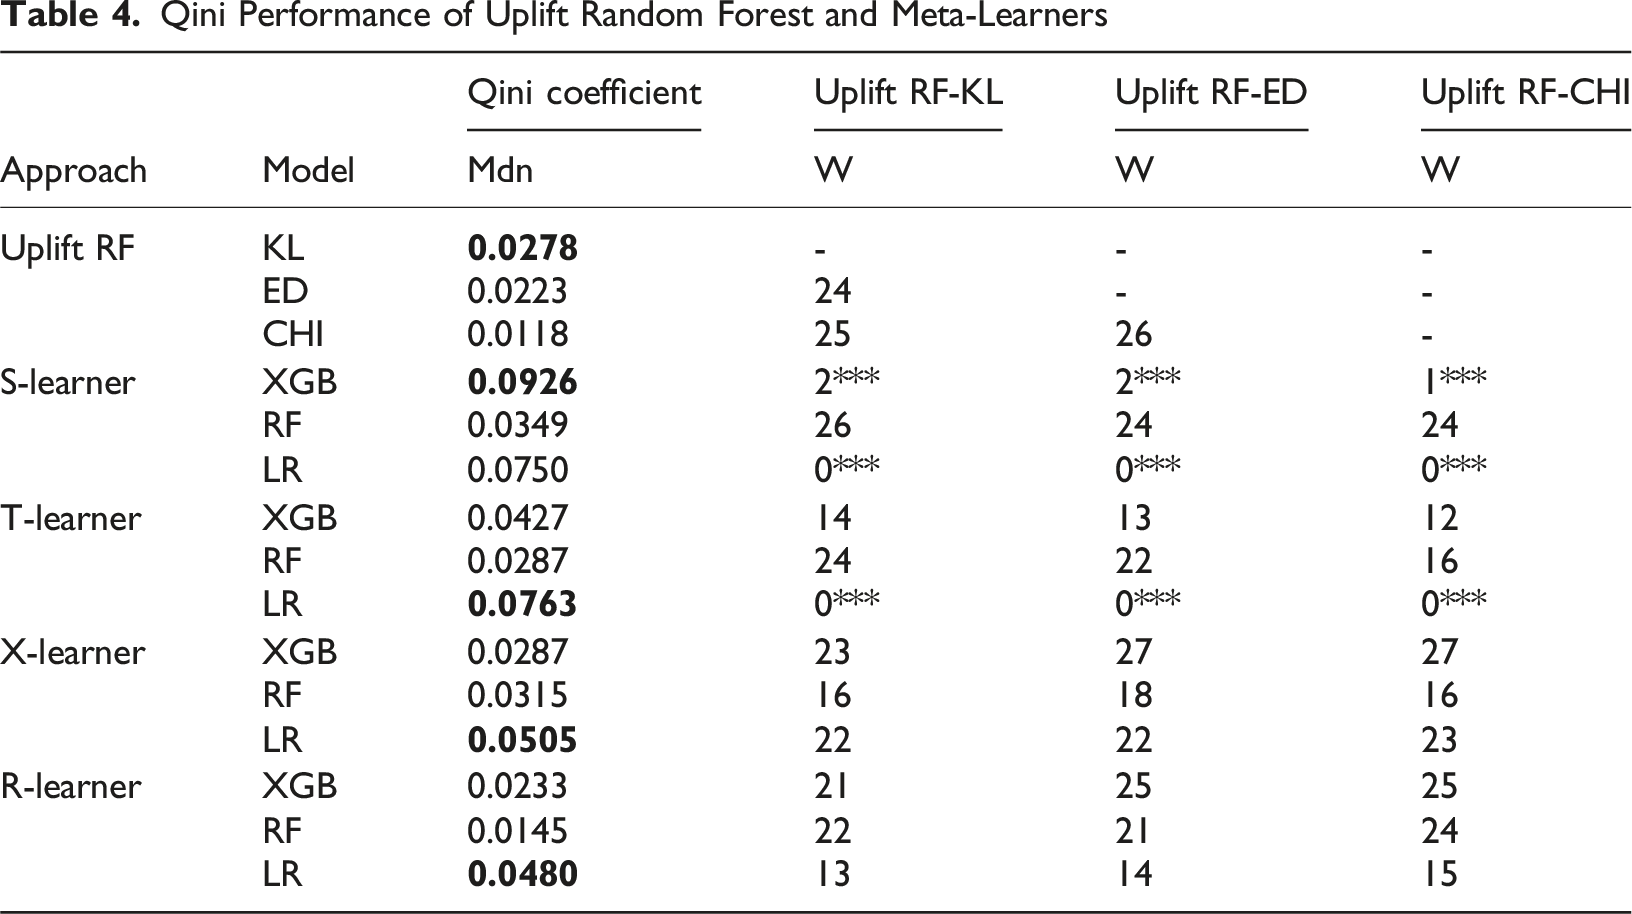
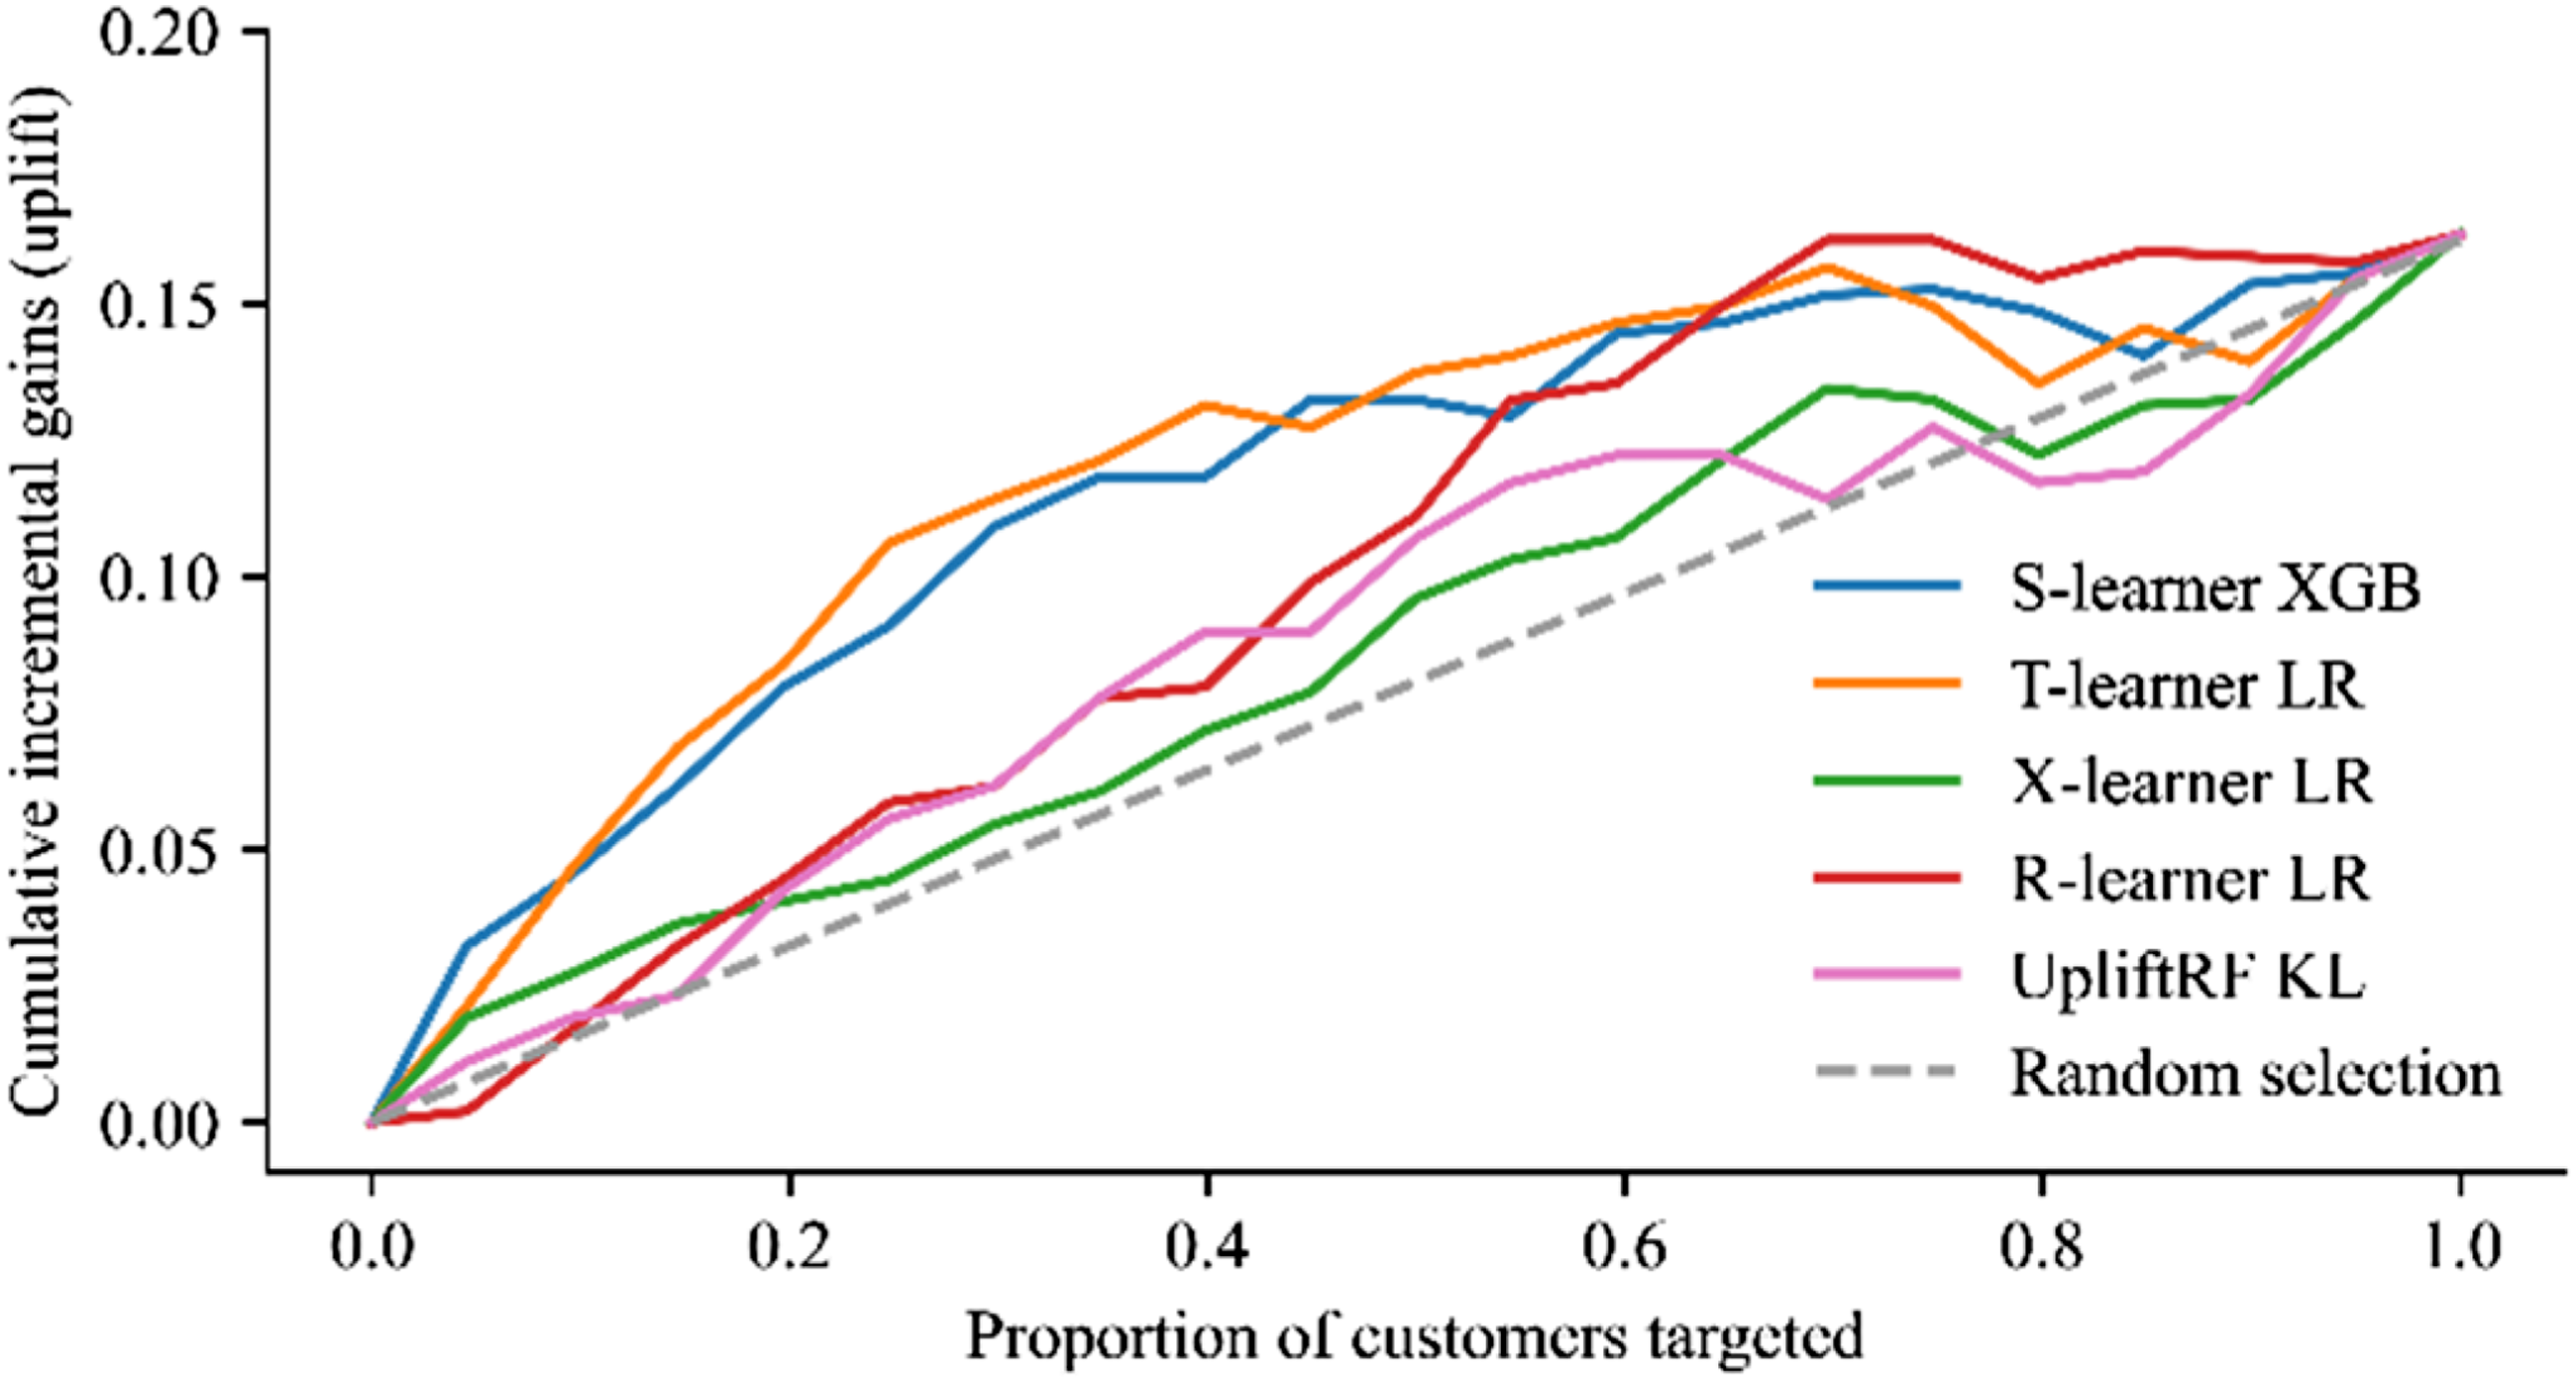
Qini curves for best performing uplift model per approach
In Figure 1, the S-learner shows the steepest ascent within the first 10% of targeted customers and performs better than the baseline for all customers targeted. The Qini curve of the T-learner ascends slightly less steep for the top 10% of customers targeted but follows a similar pattern as the curve of the S-learner. Both models achieve their optimal uplift value when targeting around 40% - 50% of all customers. However, for the last 10% of customers targeted, the T-learner shows a weaker performance than the baseline. Compared to the S- and T-learner, the uplift random forest shows a considerably shallower progression of the uplift curve. Similar to the X-learner, the uplift random forest performs better than the baseline when targeting around 70% - 80% of all customers. The R-learner performs better than the baseline, except when targeting the top 10% of total customers, which results in a negative Qini value.
AUC Performance of Churn Prediction and Response Models
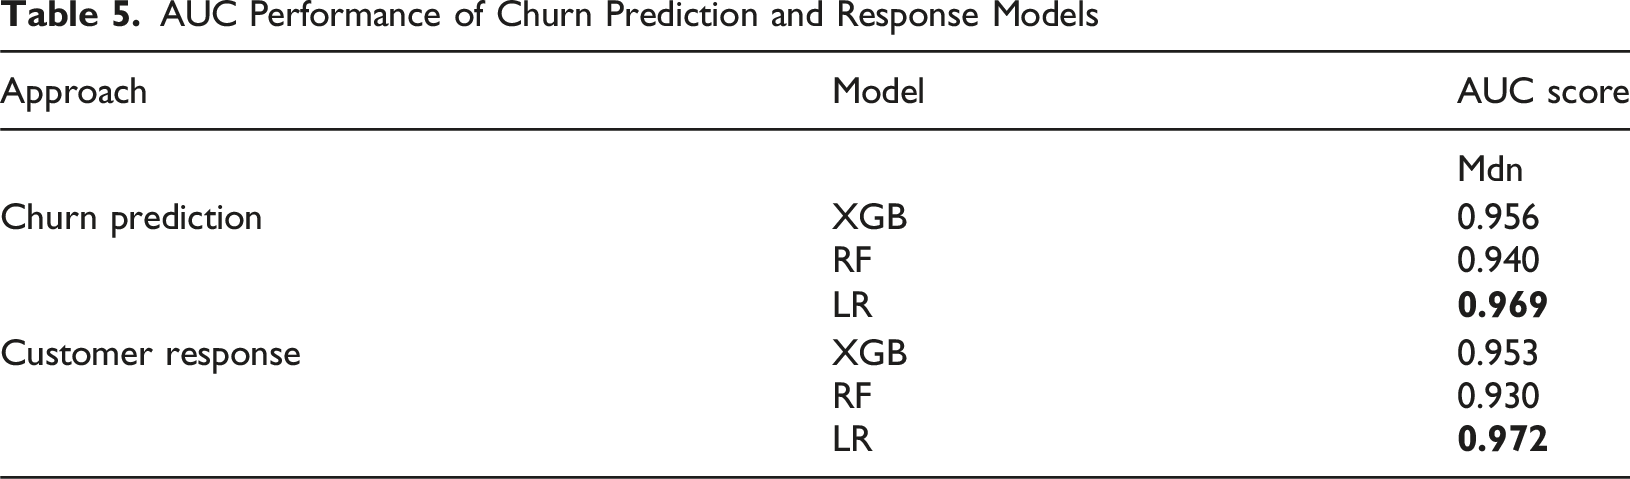
Table 3 highlights the computational efficiency of the meta-learning techniques. All meta-learners significantly outperform the three configurations of the uplift random forest in terms of the computation time within the hyperparameter optimization process. The best-performing uplift random forest configuration in terms of predictive performance (i.e., uplift random forest with KL splitting criterion) shows an average runtime of 1177.06 seconds (SD = 771.88) per trial. The meta-learner with the best predictive performance (i.e., S-learner paired with XGBoost) shows an average runtime of 3.08 seconds (SD = 1.52) per trial which is around 382 times faster. Among the meta-learners, the combination with logistic regression as base-learner shows the shortest computation time, followed by the combination with XGBoost and random forest as base-learner. On average, the less complex meta-learners (i.e., S- and T-learner) show faster computation times than the more complex meta-learners (i.e., X- and R-learner).
To identify the best-performing classifier for the propensity models (i.e., churn and response model) used for further analyses, we examine their predictive performance using the AUC score. We report the AUC score as the median value over the 10 out-of-sample validation folds. The best-performing classifier for each modeling strategy is highlighted in bold.
Table 5 reveals that all classifiers are substantially better at predicting churn or customers’ response than the baseline of a random model achieving an AUC of 0.5. For both modeling strategies, logistic regression achieves the highest absolute AUC score and ranks before the XGBoost and random forest classifiers.
Comparison of Targeting Effectiveness Using Uplift and Propensity Models
We analyze whether targeting based on uplift or propensity models leads to more effective retention campaigns. For the examination, we compare the best meta-learner uplift model – S-learner paired with XGBoost – with the best propensity models – churn prediction model and customer response model, each based on logistic regression. We evaluate the differences in the treatment effect for each modeling approach by comparing the churn rates between treatment and control groups for customers with different levels of the model-specific target metric (i.e., uplift, churn propensity, response propensity). Figure 2 illustrates the effect of the treatment for each of the targeting approaches, assuming different proportions of targeted customers. The blue circles, orange squares, and green triangles represent the accumulated average treatment effects for the corresponding approach over the 10 out-of-sample validation folds. The bars illustrate the standard deviation for each approach’s reported mean values
2
. Figure 2 reveals that targeting based on uplift results in a substantially larger accumulated treatment effect, up to a proportion of 40% of customers, than based on churn propensity or response propensity. For instance, when targeting 30% of the customers based on the response propensity, the treatment (i.e., retention campaign) has no effect in terms of reducing churn. Targeting the same proportion of customers based on their predicted churn propensity, churn can be reduced by 14.3 %. However, when the same proportion of customers is selected based on their predicted uplift, the same treatment can reduce churn by 36.9 %. Thus, the difference in churn reduction between using uplift and the response propensity as a targeting metric is 36.9 %, and between uplift and the churn propensity, 22.6 %. This difference between the three targeting approaches diminishes as the proportion of the targeted customers’ increases. Accumulated treatment effects per model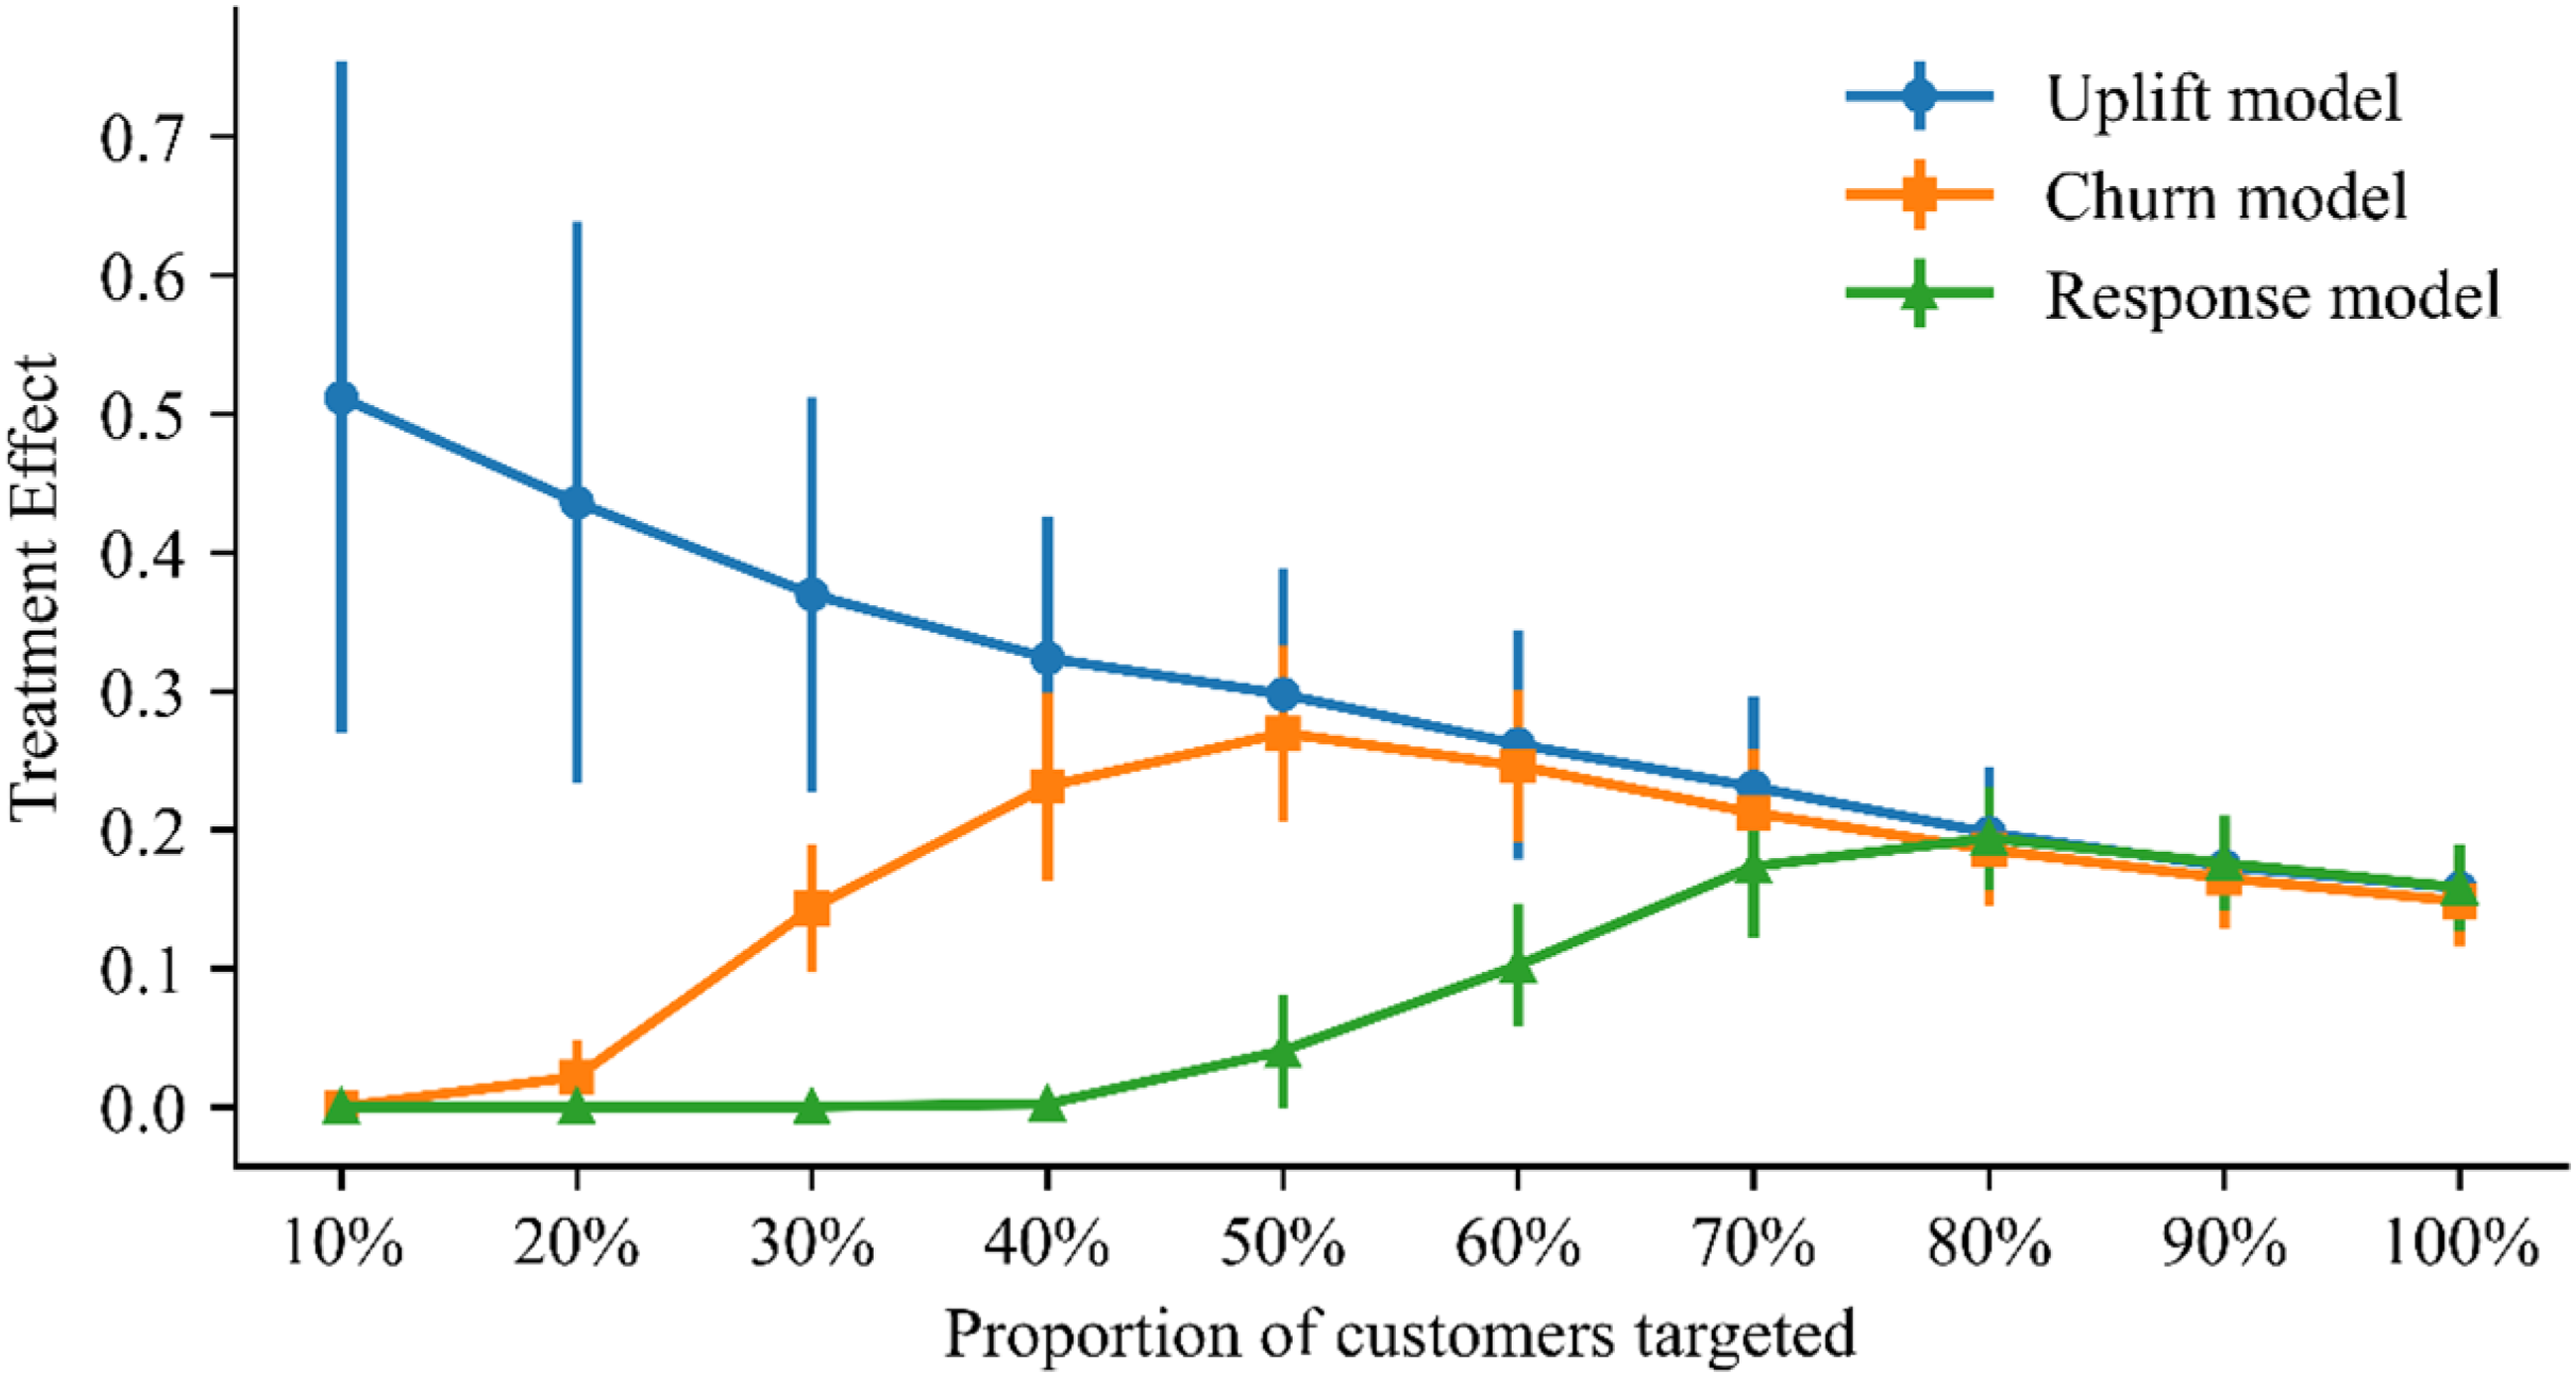
Discussion and Theoretical Implications
In recent years, predictive models have become essential tools for marketers seeking to anticipate customer behavior and improve retention decisions (Z.-Y. Chen et al., 2015; Hair & Sarstedt, 2021). Extant customer retention literature has focused primarily on propensity models such as churn prediction and response models (Caigny et al., 2018), while uplift modeling has emerged as a promising alternative that directly estimates the incremental impact of marketing actions (Ascarza, 2018; Devriendt, Berrevoets, & Verbeke, 2021). Although prior research has explored the effectiveness of uplift models, few studies have examined their actionability or applicability in practice. Our study contributes to this gap by proposing and testing an accessible uplift modeling procedure that combines propensity score matching (PSM) with meta-learners to enable causal inference from observational data.
Theoretically, our findings extend the understanding of uplift modeling in three main ways.
First, we demonstrate that propensity score matching effectively reduces covariate imbalance in observational data and can serve as a viable alternative to randomized controlled trials for uplift estimation. This finding aligns with evidence from statistics and econometrics (Imbens, 2004; Rubin, 2012) and extends these insights to marketing analytics. By validating PSM for uplift modeling, we broaden the methodological foundation of customer retention research and provide a bridge between causal inference and predictive analytics.
Second, our results show that meta-learner-based uplift models can perform as well as or better than specialized algorithms such as the uplift random forest while requiring less computational effort. This confirms recent findings by Zhao and Harinen (2019) and Zhang et al. (2022), highlighting that modern meta-learning techniques offer both accuracy and scalability. These results suggest that uplift modeling can be implemented using standard machine learning tools, making causal targeting methods more practical for marketing researchers and practitioners.
Third, our analysis reveals that the performance of meta-learners depends on the choice of base algorithm. For instance, XGBoost performs particularly well in combination with the S-learner, whereas logistic regression provides robust results across multiple learner types. This underscores that no single algorithm universally outperforms others. Instead, performance depends on data characteristics and campaign objectives. Practically, analytics teams should conduct small-scale validation experiments to identify the optimal combination of meta- and base learners for their specific datasets.
In summary, our discussion emphasizes the key theoretical implications: Uplift modeling can be effectively extended to observational data using PSM, implemented efficiently with meta-learners, and tailored flexibly to different marketing contexts. These insights advance the theoretical integration of causal inference into marketing analytics and support more evidence-based decision-making in customer retention management.
Practical Implications
In addition to our theoretical contributions, this study offers clear and actionable implications for marketing managers, data scientists, and commercial research teams responsible for customer retention and campaign optimization.
First, our results demonstrate that propensity score matching (PSM) provides a practical and cost-efficient alternative to fully randomized field experiments. Instead of running controlled trials which are often difficult, costly, or inconsistent with established targeting procedures, marketing teams can use existing customer data from CRM or loyalty systems and apply PSM to approximate the benefits of randomization. This enables firms to evaluate campaign effects more accurately and make causal inferences from everyday business data (Ascarza, 2018; Rossi & Allenby, 2003; Zhang et al., 2022). In commercial settings where access to real-time experimentation is limited, this approach can significantly reduce analytical costs while improving evidence-based decision-making.
Second, the findings highlight that meta-learner uplift models can be implemented with standard analytics tools already used in many firms, such as Python or R, thereby lowering the entry barrier for advanced causal analytics. Compared with tailored uplift algorithms, meta-learners achieve similar or superior predictive performance with far less computational and maintenance effort. This means that analytics teams can integrate uplift modeling into existing marketing automation or customer intelligence workflows without major system overhauls. The results therefore encourage organizations to expand their analytics toolbox and upskill marketing analysts in the application of causal machine learning approaches (Wedel & Kannan, 2016).
Third, from a strategic marketing perspective, our findings show that targeting retention campaigns based on uplift scores rather than churn or response propensities substantially improves campaign efficiency and ROI. For example, in our analysis, targeting only 30% of customers based on uplift scores reduced churn by 22–37 percentage points more than using conventional models. This implies that marketing budgets can achieve higher impact with fewer contacts, directly addressing the long-standing challenge of maximizing the return on marketing investment (Ascarza, 2018; Rust et al., 2004). Managerially, this means firms should prioritize “persuadable” customers (those whose churn likelihood decreases when targeted) rather than “sure things” and “lost causes,” who either would not churn or cannot be retained despite intervention. By adopting uplift modeling as the decision criterion for campaign selection, managers can allocate resources more effectively, improve customer lifetime value, and minimize unnecessary retention spending. Especially when budgets are limited or campaigns must comply with data protection and contact frequency restrictions, uplift-based targeting provides a data-driven framework for precision retention marketing.
Overall, our results underscore that uplift modeling is not only a methodological innovation but a commercially viable instrument for improving customer retention management. We recommend that firms integrate uplift modeling into their marketing analytics pipelines, test it alongside traditional scoring models, and monitor the incremental financial gains in pilot campaigns.
Limitations and Avenues for Future Research
As with other research, our study is not free of limitations. First, the analysis is based on a semi-synthetic churn dataset with 1,980 customers, where real-world covariates were combined with simulated outcomes. While this approach allows for controlled experimentation and causal benchmarking, the use of simulated outcomes may introduce biases that do not fully reflect real-world behavioral dynamics, such as unobserved heterogeneity or non-linear responses to marketing interventions. Ideally, the results should be validated with a real-world dataset. However, obtaining access to actual customer data is challenging, as firms are often reluctant to share such strategically sensitive information (Caigny et al., 2021). Our simulation procedure mitigates some of these issues by grounding the data in realistic covariates from an existing telecom dataset, ensuring structural similarity to real retention contexts. Nevertheless, future research should replicate the results using proprietary or field data to strengthen external validity.
Second, we employ cross-sectional data in this study. However, real-world retention campaigns often consist of multiple actions performed over a longer time horizon accompanied by changes in treatment exposure (Ascarza, 2018). Extending the framework to a longitudinal setting could reveal how repeated campaigns affect customer responsiveness and model stability over time.
Third, our study focuses on a mobile operator case with a churn rate of 36%. We acknowledge that the advantage of implementing our proposed procedure could be less pronounced in industries with lower churn rates. Hence, future work could examine settings such as subscription-based or B2B markets to assess generalizability across contexts.
Beyond these limitations, several research avenues remain. Future studies could explore the interaction between meta-learner types and base algorithms in greater depth, as our results suggest that their performance is context-dependent. Moreover, we used one-to-one propensity score matching to enable the use of observational data for uplift modeling, which may discard unmatched cases and reduce statistical power. Future research could therefore evaluate alternative balancing methods, such as full matching (Rosenbaum, 1991; Stuart & Green, 2008) or inverse probability of treatment weighting (Lunceford & Davidian, 2004; Robins et al., 2000), which use all available data.
Footnotes
Funding
The authors received no financial support for the research, authorship, and/or publication of this article.
Declaration of conflicting interests
The authors declared no potential conflicts of interest with respect to the research, authorship, and/or publication of this article.