
Abstract
The Net Promoter Score (NPS) is used by many service organizations as a key customer loyalty metric and driver of growth. Yet, despite its widespread adoption and consequent benchmarking benefits, the methodological soundness and usefulness of NPS has been questioned. Compounding these problems, few guidelines on NPS enhancement strategies exist, since research on antecedents to NPS remains elusive. The combination of (a) questionable research underpinning the original proposal for NPS, and (b) an under-researched nomological net, creates an unfortunate paradox, whereby service organizations strive to raise a score that may or may not lead to organizational success, with little evidence-based knowledge on how to raise this score strategically. To address this, we utilize a guiding framework to interrogate NPS though a services marketing lens. We use this framework to underpin a critical review of NPS as it applies to service organizations, and through the review, identify and discuss ten NPS interrogations. We then propose recommendations that address each of these to enhance further knowledge development and improve ongoing practice of NPS by service organizations.
Introduction
Since its introduction by Reichheld in 2003, organizations have swooped around the Net Promoter Score (NPS) (Lewis & Mehmet, 2020). NPS is based on a question reflecting customers’ self-reported likelihood-to-recommend an organization to others: “On a 0-10 scale, how likely is it that you would recommend [company X] to a friend or colleague?” Respondents scoring 0-6 are considered “detractors”, 7-8 scorers are “passives”, while 9-10 scorers represent “promoters”. NPS is calculated by subtracting an organization’s percentage of detractors from promoters. This figure is supposedly the ‘one number’ organizations need: when NPS increases, revenue growth purportedly improves (Reichheld, 2003).
NPS is used in both goods and service industries, but is especially pertinent to service organizations (i.e., servitizing organizations and those found in traditional service sectors). Service industries “generate more than two-thirds of economic output, attract over two-thirds of foreign direct investment, and provide almost two-thirds of jobs in developing countries and four-fifths in developed ones” (World Trade Organization, 2019, p. 14). Meanwhile, the number of servitizing organizations is growing (Mastrogiacomo et al., 2019), as goods organizations look to services to meet modern-day needs. Servitization can be achieved through, for example, building loyal customer relationships, which aligns with NPS (Reichheld, 2003). Against this backdrop, an estimated 45%-67% of Fortune 1000 servitizing and traditional service organizations, 1 and 70% of customer experience (CX) practitioners, use NPS as a key metric (Qualtrics, 2023). This is noteworthy because CX management is a strategic priority for service organizations, suggesting NPS plays a key role in this process. Indeed, NPS allows quick monitoring and assessment of CXs at various touchpoints, helping organizations find competitive advantages across the customer service journey (Følstad & Kvale, 2018). These NPS datapoints represent transactional NPS, which corresponds to data collected immediately after customer-organization interactions. Such data were recently found to benefit service organizations’ resource allocation efficiencies, relative to objective data alone (see Cho et al., 2023). NPS can also lead to direct comparability and benchmarking against rival firms, ultimately educating organizations on where they reside in the competitive marketplace. In turn, this suggests that, while NPS is already widely adopted across service contexts (e.g., Baehre et al., 2022a; Mecredy et al., 2018), it will likely play an increasingly important role in service organizations moving forward.
That said, a debate on the conceptual and statistical soundness of NPS has evolved over the last 20 years, and despite its widespread use, when examined through services marketing prisms (e.g., Moeller, 2010), questions intensify. For example, is NPS universally appropriate or subject to service contextualization? NPS is almost universally embraced as a ‘standard’, context-free measure, yet the relevance and usefulness of NPS may be context-specific (Morgan et al., 2004). Indeed, service contexts are well-known to differentially impact customer satisfactions and loyalties (e.g., Lee et al., 2001; Meire et al., 2019) so it is likely NPS-utilizers should account for service contexts too. However, surprisingly, NPS has yet to be explicitly interrogated via services marketing lenses.
Our aim is therefore to widen our understanding of NPS’ usefulness across service organizations by interrogating NPS via a services marketing lens. In so doing, we utilize a services marketing guiding framework, that is subsequently used to underpin a critical review of both peer-assessed and gray literature (Adams et al., 2017) on NPS (providing an integrative picture of the state of the art in NPS academic thinking and popular industry perceptions). We also incorporate wider services knowledge to build a conceptual bridge with the mainstream services literature. Indeed, we contend NPS can only be satisfactorily interrogated in service contexts if it is considered in conjunction with the service-related cornerstone concepts that underpin service industry research (e.g., word-of-mouth, customer satisfaction, loyalty, and servitization). Collectively, this work leads to ten NPS interrogations, from which we advance NPS knowledge within service contexts, by proposing recommendations to move NPS forwards with services marketing in mind.
We contribute to the field of NPS in two main ways. First, with widespread adoption of NPS by service professionals, it is timely to help build an informed view of NPS’ value for service sectors. Second, our review draws on cornerstone concepts of services, in order to identify service-oriented parameters that NPS theory and practice should consider when utilizing NPS in service industries.
Background
Interrogating NPS through a services marketing lens
The eclectic and evolving nature of services has led to multiple academic conceptualizations, frameworks, and typologies (e.g., Baines et al., 2020; Moeller, 2010) that reflect the “revolutions that have transformed the way services are created and delivered” (Furrer et al., 2020, p. 299). Their proliferation suggests service organizations are best-served by context-informed strategies, and service-related research may benefit from interrogations through a services marketing lens.
While advances have been made in the last few years to identify and address the shortcomings of NPS (e.g., Bendle et al., 2019), the idiosyncrasies of service contexts, coupled with the multi-faceted nature of service evaluations, require a services marketing lens be applied to NPS. This allows us to explore service-specific considerations of NPS that are not currently explicit (cf., Lovelock & Gummesson, 2004).
Services marketing guiding framework
In order to make sense of NPS theory and practice through a services marketing lens, a guiding framework was utilized (see Figure 1). The framework serves as a platform for the critical review, and the development of service-informed recommendations for moving forward in NPS research and practice. Guiding framework for services marketing lens.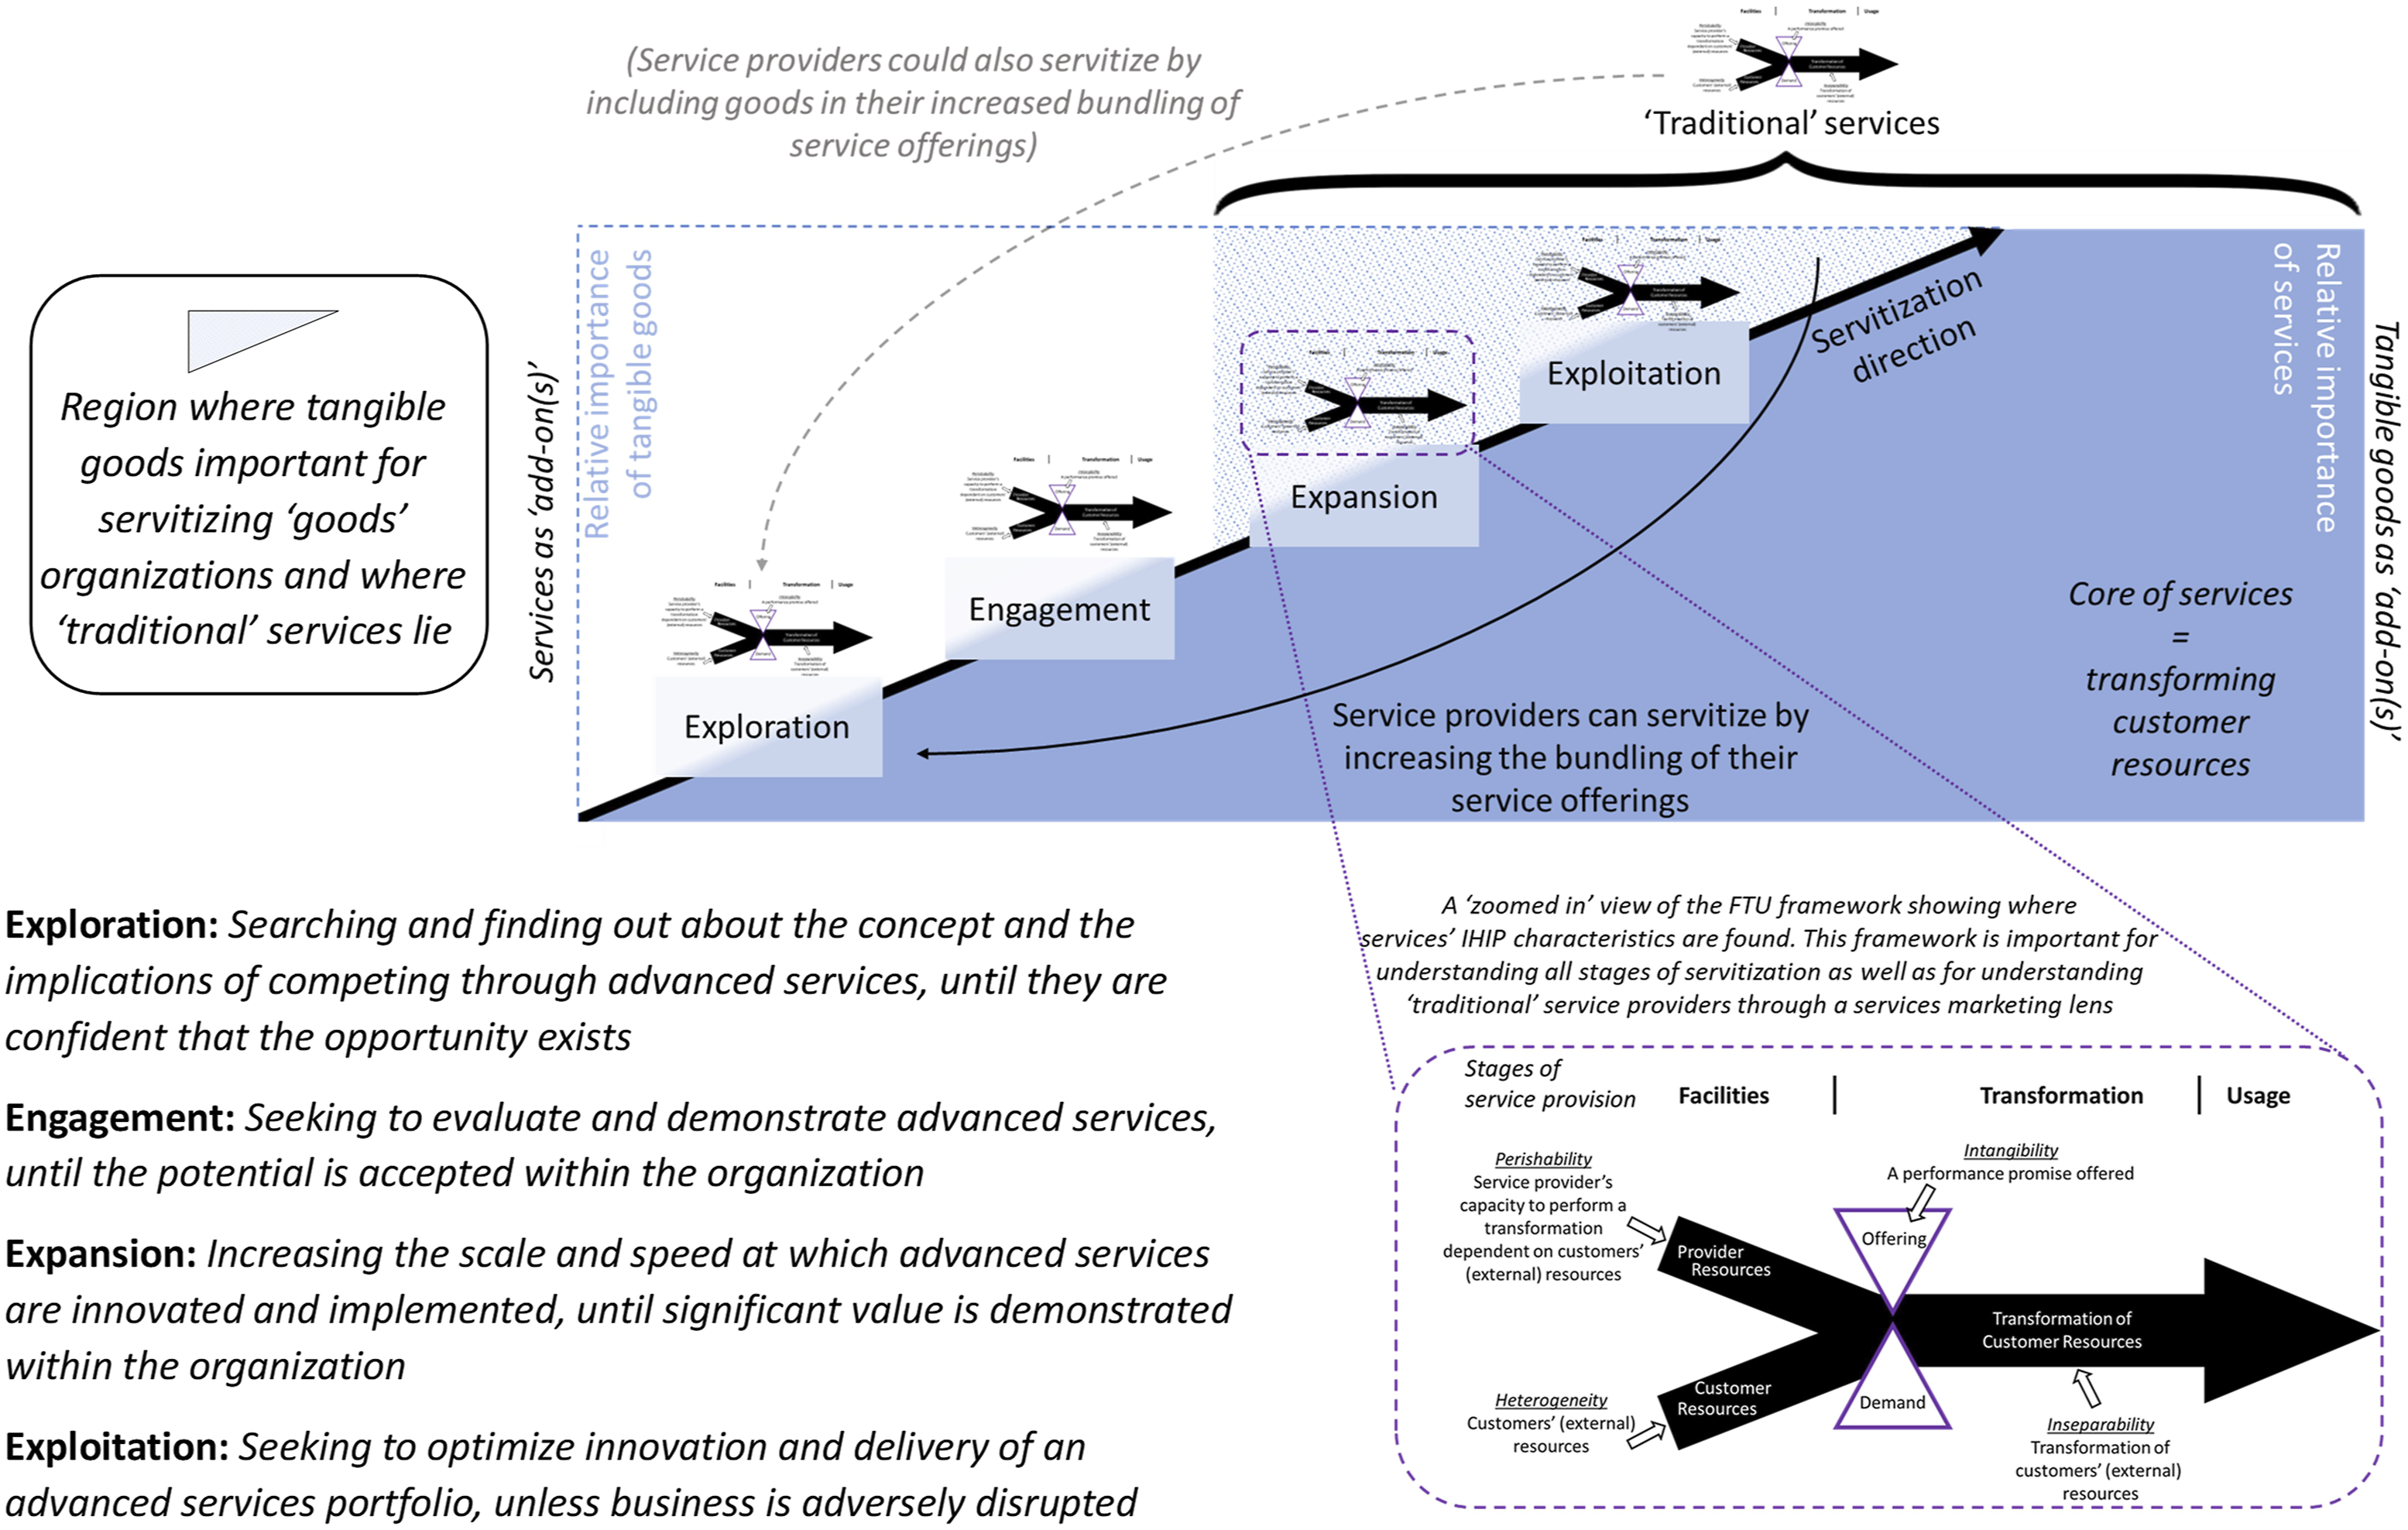
The framework adapts and merges Moeller’s (2010) FTU framework with Baines et al.’s (2020) and Oliva and Kallenberg’s (2003) work on servitization (see Supplemental Material 1 for a more-detailed overview). FTU (Facilities - organizational resources; Transformation - commercialization and co-creation; Usage - value creation) accounts for the criticisms of the IHIP (Intangibility, Heterogeneity, Inseparability, Perishability) characterization of services (Moeller, 2010). Concurrently, the strategic decisions that accompany IHIP characteristics across the FTU framework differ at different servitization stages (cf., Baines et al., 2020), including: (a) Exploration (researching and confirming service opportunities); (b) Engagement (gaining organizational acceptance); (c) Expansion (increasing scale and speed of service innovation and implementation); and (d) Exploitation (optimizing service innovation and implementation). As organizations move along the servitization stages, the relative importance of services increases (Oliva & Kallenberg, 2003). Pertinently, the FTU framework finds relevance at each of these servitization stages. Furthermore, while Baines et al.’s (2020) focus is on complex advanced services, their framework is applicable to traditional services (which arguably reside at the expansion and exploitation stages of their framework). 2 Finally, as traditional services can themselves servitize (e.g., Baines et al., 2020), we also include arrows which circle back to the exploration stage of the servitization framework.
The combination of the FTU and servitization frameworks informs our critical review, enabling us to interrogate NPS through a services marketing lens and build a conceptual bridge with the mainstream services literature.
Methodology
Since Reichheld introduced NPS in 2003, our critical review begins with NPS articles from 2003 to December 2022. Sources include EBSCO’s Business Source Complete and Elsevier’s Science Direct databases, with “net promoter score” as the primary search term in the title, abstract, and author-supplied keywords, within articles in the English language. We also enhance our review through gray literature (i.e., “the diverse and heterogeneous body of material that is made public outside, and not subject to, traditional academic peer review processes” (Adams et al., 2017, p. 432), often constituted by popular and/or trade press), to balance business practice and academic thinking. We uncovered just under 200 outputs. Presented in Supplemental Material 2, we split these into three categories, including (a) peer reviewed journal articles, (b) academic chapters, books and proceedings, and (c) gray literature. Finally, further academic insights (e.g., contemporary NPS literature published after our review was completed, and services marketing knowledge) help critique the NPS literature identified through the review.
Critical review
The critical review reveals ten key interrogations. We discuss each of these in turn below, and follow each with recommendations for moving forward, guided by the framework presented above. A table summarizing recommendations can be found in Supplemental Material 3.
Is NPS the only metric service organizations need?
While Reichheld (2003) claims NPS is the only customer performance metric needed, single-item measures mask the complex nature of service evaluations. The IHIP categorization of services, with characteristics varying from service industry to industry, means customers typically evaluate service organizations in a multi-faceted manner best captured through multi-dimensional measures (Parasuraman et al., 1988). Customers’ expectations are also dynamic and change depending upon their prior experiences with organizations. In this context, using multi-dimensional measures can help organizations tease out what they are doing well and where they can improve. For organizations increasing or changing their servitizing activities, understanding which service facets are important for customers is paramount, and research corroborates there is no single “silver bullet metric” of customer mindsets for service organizations (Anselmsson & Bondesson, 2015, p. 58). For example, Pingitore et al.’s (2007) study of service organizations finds that NPS is not the only net customer feedback that correlates with (financial) performance. They conclude that businesses should include varied and different questions and measurements to assess customer loyalty rather than NPS in isolation. Teixeira and Mendes (2019, p. 3) caution that “conflating all of the customer’s experiences into one summary judgment leads to lost opportunities”. In the healthcare sector in particular, an examination of the use of NPS for patient data reveals it to be insufficient as a standalone metric (Adams et al., 2022).
Reichheld (2003, p. 53) suggests “follow-up questions can help unearth the reasons for customers’ feelings and point to profitable remedies”. These “expatiate questions” (Chant & Potter, 2019, p. 339) are now seen as essential for understanding which actions firms should take (Bain & Company, nd). However, follow-up questions contradict the notion that NPS is the only metric needed (Grisaffe, 2007). Reichheld (2003) concedes we may need to know more than the ‘one number’ if we are to tailor business decisions to detractors, passives or promoters. In this context, recent findings suggest these expatiate, open-ended, questions should be accompanied by closed-ended questions (Bettencourt & Houston, 2023).
Recommendation
The Net Promoter Score is appealing by its simplicity, and may provide high-level snapshots of service organizations’ general health. Therefore, in service contexts, where IHIP characteristics are prevalent, the ‘one summary judgment’ has its place. However, it regularly needs supplementing with other questions, in order to sense-make the scores obtained, and produce insights into potential organization interventions. This is particularly relevant as organizations advance through servitization stages, which require different organizational inputs. Here, additional, open-ended, qualitative insights may provide useful knowledge (Følstad & Kvale, 2018) at different times, but this approach also has limitations (Bettencourt & Houston, 2023). Hence, service organizations should use multi-dimensional service-evaluation measures, at least periodically, to triangulate knowledge.
Does NPS capture service customer loyalty?
The Net Promoter Score supposedly reflects loyalty, yet evidence drawn from service industries undermines this (Keiningham et al., 2007). In 2003, Reichheld proposed customer loyalty is best captured by ‘likelihood-to-recommend’. Loyalty was defined as a willingness to make a personal sacrifice to strengthen the relationship, which “may have little to do with repeat purchases” (p. 48). This statement contradicts Reichheld’s (1996) previous position that financial benefits of loyalty emanate from repeat purchases. Loyalty is often considered attitudinal and behavioral (e.g., Lee et al., 2001). Hence, it is not comprehensively captured by NPS, which (at best) materially focuses on one facet.
Reichheld also fails to explain whether NPS is an antecedent, consequence, or indicator of loyalty (Grisaffe, 2007). Yet, this distinction is critical because it impacts organizations’ actions. If NPS is an antecedent, organizations should strive to increase NPS (as loyalty should follow), but if it is a consequence, organizations might strive to increase loyalty first; through a services marketing lens, this might mean raising service-specific trust, confidence, social, and ‘special treatment’ benefits (e.g., Shukla & Pattnaik, 2020). The impact of such drivers is itself a function of the integration-levels of customers’ (heterogeneous) resources (cf., Moeller, 2010). For instance, if healthcare recipients are treated ‘in person’ versus ‘online’, different connotations of trust and relationship-quality may be evoked (e.g., van Rooij et al., 2023), and this can filter through to service evaluations and recommendations (i.e., NPS).
Recommendation
Service organizations should avoid treating NPS as a customer loyalty metric, and consider it instead as customers’ self-reported likelihoods-to-recommend. As a ubiquitous reflection of positive word-of-mouth, NPS can serve the purpose of benchmarking service organizations and industries against each other, despite the inherent differences found across service contexts. In these contexts, where service quality is challenging to measure, this is a useful tool. However, its potential as an indicator of customer loyalty should be treated with caution. In turn, NPS-utilizers (and in particular, academics) may consider assessing the extent to which likelihood-to-recommend drives loyalty, or is an outcome of loyalty in different service contexts, via longitudinal analyses.
Can NPS (most) appropriately predict growth in service contexts?
The Net Promoter Score is predicated on the belief that self-stated likelihoods-to-recommend cause growth, yet this is largely unconfirmed across service organizations (Lewis & Mehmet, 2020). One reason may be that NPS data can be collected immediately after customer-organizations interactions (transactional NPS; data often pertains to specific service encounters, as opposed to organizations as a whole) or at a later point in time (relational NPS; data often pertains to customers’ overall experiences of the organization). Collecting NPS at different time periods likely results in a shifting of the importance of NPS-related drivers (cf., Pizzi et al., 2015). Relatedly, relational NPS involves retrospective feedback and this might differ from real-time feedback of the same service organization or service interaction. In turn, investigating the link between NPS and growth becomes especially muddy.
Baehre et al. (2022a) find that, in the servitized sportswear industry (see e.g., Adidas, 2023), NPS is related only to short-term growth, predicts only a fraction of future growth, and is best used in sectors with short interpurchase cycles and high emotional involvement. Interestingly, Reichheld (2003, p. 51) also cautions that NPS “wasn’t the best predictor of growth in every case” and notes a number of service industries (e.g., local phone, computer systems and cable TV) where the question did not perform well. Interrogated through a services marketing lens, NPS may be inappropriate for service contexts that have high switching opportunities and costs.
Despite his caveat, Reichheld’s (2003) overarching claim that NPS better-predicts growth than customer satisfaction is far-reaching within service industries. When NPS is compared to satisfaction measures within service contexts, results appear mixed: Keiningham et al.’s (2007) study finds NPS and the American Customer Satisfaction Index (ACSI) perform equivalently well in predicting growth; Van Doorn et al. (2013) confirm the same in a cross-section of service firms in the Netherlands with ‘top-box’ (i.e., examining the highest scores of a scale) and multi-dimensional satisfaction measures. However, Kristensen and Eskildsen (2014), comparing NPS with ACSI and the European Performance Satisfaction Index (EPSI) within the Danish insurance industry, reveal that the reliability of NPS is low compared with the other two measures. Finally, using the United Kingdom Customer Satisfaction Index (UKCSI), Ganapathy (2018, p. 8) “highlighted that the insurance sector in the UK has enjoyed an increase in overall customer satisfaction over the past year. But there is a drop in Net Promoter Score”, implying customer satisfaction and NPS might even work against one another.
A services marketing lens may shed light on these uncertain findings. For example, customers’ idiosyncratic (heterogeneous) resources could increase their own satisfaction-levels, independent of organization-focused NPS evaluations. Conversely, servitizing organizations may interact with dissatisfied customers so they can learn about unmet needs. Subsequently, those same customers may recommend the organizations because they feel they are being listened to, despite their current dissatisfaction. Similar arguments exist for CX and NPS, although no standardized approach to measuring customer experience exists, meaning direct comparisons with (a) NPS and (b) across organizations, are difficult. Indeed, some researchers and practitioners consider customer experiences as captured through NPS (see Følstad & Kvale, 2018), further complicating comparisons.
Finally, NPS is intentions-based. Intention questions, such as purchase intentions, are typically imperfect proxies for behaviors, which are more-closely linked to proximal performance (e.g., Pauwels & Van Ewijk, 2020). Capturing behavior may therefore be more productive, particularly in short interpurchase-cycle contexts (e.g., sportswear; Baehre et al., 2022a). That said, intentions questions are useful in their own right. For instance, they can provide a good indication of respondents’ beliefs at that specific moment in time, which may be acted on in the shorter- or longer-term. This can make intentions measures useful predictors of future sales (cf., Pauwels & Van Ewijk, 2020) and thus, growth. The NPS question pertains to a recommendation intention, which opens up two future-oriented behavioral possibilities. First, recommenders may (re)purchase from the organization. Within this context, Pollack and Alexandrov (2013) found the greater the level of Net Promoter, the greater the re-purchase intention. Second, recipients of the recommendation may also (re)purchase from the recommended organization. Against this backdrop, and outside of NPS contexts, Garbarino and Strahilevitz (2004) found a friend’s recommendation of an online shopping site increased women’s willingness to purchase online relative to purchasing from a store. However, there were no significant differences found among men, who were instead influenced by two (general) friends. Interestingly, the authors’ explanations for these findings orient around customers’ resources (i.e., are considered through service marketing lenses). Nowadays, trust in online purchasing has dramatically increased, and recommendations are found online, including on social network sites. Nevertheless, relationship-closeness – among other customer-related attributes – is still seen as positively impacting a person’s intention to act on a recommendation (Matook et al., 2015). Even so, more investigations into links between NPS and growth are needed, especially if intentions-to-behavior relationships are service-context-specific (e.g., influenced by customers’ own resources).
Recommendation
In their use of NPS, service organizations should consider the causal mechanisms that exist in their respective service ecosystems between (a) making a recommendation and (re)purchasing from the organization, and (b) receiving a recommendation and (re)purchasing from the organization. For example, service organizations should account for the social network and characteristics (resources) of the recommender and the recipient(s) of the recommendation when NPS data are collected and analyzed. Service organizations should also investigate the extent to which time changes the shifting of importance of customers’ NPS-related drivers, and the extent to which using transactional or relational NPS is most appropriate (i.e., valid). This is especially important given NPS itself only provides an overall summary judgment. Moreover, organizations should (periodically) ask service-related questions (e.g., customer satisfaction, experience, loyalty) that characterize their service context, as appropriate mindset metrics provide additional assurances when predicting growth.
Can NPS inform service organizations’ resource allocations?
Any measure in itself, whether it be NPS or customer satisfaction, for example, provides little information on the resource deployment needed to enhance the construct it captures. Unlike customer satisfaction, however, for which plethora of studies examine antecedents in service organizations, the premise of NPS lies in it being the only customer mindset metric organizations need. Customer satisfaction antecedents identify controllable factors that enhance or inhibit customer satisfaction in service contexts (e.g., service quality, perceived value). Conversely, and possibly because NPS is marketed as the only metric needed, little empirical evidence exists on antecedents that may help with maximizing the score (i.e., information on where to allocate and deploy resources) (Keiningham et al., 2007).
Industry anecdotes suggest NPS (a) catalyzes organizations to think about improving customer loyalty, and (b) is raised when frontline employees are empowered. When considered through a services marketing lens, this suggests efforts should be placed on maximizing staff engagement to enhance employee-customer interactions. Here, front-line employee behaviors (at the Facilities stage) may impact customer evaluations (at Transformation, and even Usage, stages). Importantly, front-line employees’ direct access to customers allows them to capture first-hand knowledge of customer needs. In turn, this can feed into resource deployment conversations within organizations (e.g., Ye et al., 2017). Conversely, service organizations with limited customer contact (e.g., automated service provision) may need to rely on information technology and Artificial Intelligence, which also facilitates transactional NPS data collection. If these data are fed into resource deployment decisions, service organizations’ resource allocation effectiveness and efficiencies can be enhanced (Cho et al., 2023).
We also have little understanding of, for example, the lagged effects of changes in marketing mix decisions on NPS. Hoof et al.’s (2012) study of cellphone service providers aims to address this by analyzing marketing actions as drivers of NPS over time. Their results suggest price has a negative impact on NPS, but advertising expenditure has a positive weak effect. Similarly, in their time-lagged study, Baehre et al. (2022a) find that leading sportswear firms should increase the number of sports categories they operate in, which likely means increasing firms’ servitized offerings (see e.g., Adidas, 2023). However, Baehre et al. (2022a) also guard against generalizing from their findings (alluding to the possibility of a service-specific context).
Finally, and noteworthily, Reichheld and colleagues expanded the original concept of NPS from a ‘score’ to a ‘system’ (Reichheld et al., 2021) and encouraged a ‘closed-loop’ process for accessing customer feedback (Markey et al., 2009). Organizations such as software company Autodesk (Bradner, 2013) now capture customer sentiment measures alongside NPS (Klaus & Maklan, 2013), allowing them to identify “the experience attributes that inspire customers to promote our product actively” (p. 239) and thus develop insights for company interventions. Nevertheless, (academic) efforts to empirically examine determinants to NPS have been comparatively slow.
Recommendation
Where practice is concerned, any resource allocation decisions aimed at raising NPS (and growth) should be determined by empirical evidence of the effects of specific interventions. More empirical research is therefore needed in this area, accounting for different service contexts (e.g., employee-customer interaction levels), audiences, and causal-based methodologies. Meanwhile, the guiding framework (Figure 1) can underpin future NPS-oriented resource allocation research specific to the different stages of servitization. For instance, servitizing organizations likely require different ‘Facilities’, depending on their immediate developmental objectives. As examples, NPS knowledge could suggest organizations pool resources into market sensing and marketing research at the exploration stage. Then, as NPS (presumably) increases, NPS knowledge may identify market-oriented or market-driving activities to capture a newer loyal customer segment (see Jaworski et al., 2000) at the exploitation stage.
Is the NPS categorization of customers appropriate?
The three NPS categories represent distinct segments. From a practitioner’s standpoint, it is easier to understand distinct segments than nuances between abstract consumer types. However, Grisaffe (2007) claims there is little information on whether the break-points between each NPS segment (detractors, passives, and promoters) are context-specific, arbitrary, based on conceptual logic, or empirically derived. Reichheld and Markey (2011, p. 5) refute this, stating “customers typically fall into three well-defined groups [with each group exhibiting] a distinct pattern of behavior”. For example, detractors are perceived to actively engage in negative word-of-mouth (Reichheld, 2006). However, detractor scores (i.e., 0-6) are not necessarily indicative of detraction (Schulman & Sargeant, 2013); in service organizations, detractors can engage in behavior typical of promoters (Zaki et al., 2016). Authors such as Grisaffe (2007) also question why a score of ‘6’ returns a detractor category when it is above the midpoint on the scale. Reichheld (2003, p. 51) originally considered 5 as “neutral” but subsequently used contextual data to cluster detractors as rating up to 6. This recalibration echoes recent service research; Lexutt (2020) recalibrated the value ‘3.9’ on a 5-point scale to reflect a qualitative comparative analysis cross-over point. Values below 3.9 reflected financial service unsuccess, making ‘unsuccess’ akin to NPS detractors. Hence, classifying respondents who score on or above the NPS scale’s midpoint as detractors is not necessarily misaligned with service research categorization techniques.
Meanwhile, Fisher and Kordupleski (2019, p. 140) state that “the NPS concept of “passive customers” is completely erroneous. These customers may be passive about speaking favorably or unfavorably, but they are very willing to shop for better value” (p. 140). However, there is also evidence passive respondents engage in behavior typical of promoters rather than being ‘neutral’ (Lewis & Mehmet, 2020).
Finally, both Baehre et al. (2022b) and De Haan et al. (2015) compared NPS with ‘Top Box’ approaches, which involves examining the highest scores of a scale. Baehre et al. (2022b) find that a “Top 2” box approach (i.e., 9 and 10 scores) outperforms NPS as a predictor of sales growth. This suggests promoter behavior may be relatively stable, at least within the servitized sportswear industry.
It is possible that NPS boundaries differ across service contexts. For instance, the same ratings may have different meanings as organizations progress through their servitization journeys; organizations at early stages of servitization (e.g., exploration) with an uncertain market base might find customers indicating an NPS value of 8 provide valuable, recommendation-oriented information, and this could also help further resource deployment decisions. Conversely, traditional service organizations at the exploitation (servitization) or usage (FTU) stages may read a value of 8 as disappointing. In both cases, the respondents’ feedback could be ignored if NPS’ processes are rigidly applied.
Recommendation
The extent to which the NPS classifications and their boundary-values hold within different service contexts requires further research. This would ensure the (in)stability of NPS’ categorizations are better-understood, and opportunities are not missed by ignoring potentially valuable information that could inform context-specific strategies. At the very least, finding further evidence the promoter, passive, and detractor boundaries are relatively service-context-free would give organizations more confidence they are efficiently directing resources, irrespective of IHIP differences across sectors.
Are NPS and its nomological net universal across customer demographics?
While the above section focuses on a top-down approach of NPS as it relates to the three segments, it is also important to consider a bottom-up approach regarding standard customer segmentation attributes. Here, and paralleling findings pertaining to other customer sentiment measures (e.g., on ACSI), NPS can be affected by demographic contexts such as gender (Eskildsen & Kristensen, 2011). However, importantly, other sentiment ratings generally report all respondents’ aggregated ratings (e.g., via means and standard deviations), so future investigations can still examine the impact of demographics such as gender at a later point in time. Conversely, NPS data are trimmed as (a) passive NPS respondents are removed for NPS’ calculation, and/or (b) predetermined customer categorizations are implemented. Thus, examining demographic differences is not usually possible across all NPS respondents, at least not without using the typically overlooked untransformed scores (i.e., ratings on the NPS question, rather than subtraction of percentages; Schlosser, 2023). The inability to interrogate demographics and all NPS untransformed scores should be particularly concerning to service organizations, as gender, for example, plays a significant role in informing service customer evaluations (Olya et al., 2022). In turn, NPS’ boundary conditions may differ across gender in different service contexts.
There may also be culture-bound factors impacting NPS. While Deshmukh and Karandikar’s (2007) NPS studies in Mexico and India suggest researchers treat NPS as being culturally-invariant, other work suggests invariance needs to be confirmed. For instance, within an industrial business-to-business service sector, Lee et al. (2019) found NPS to be indirectly impacted by uncertainty avoidance and individualism. Thus, caution should be applied when using service-oriented instruments that have yet to be formally tested cross-culturally.
Recommendation
Service organizations may consider the invariance of NPS (and its nomological net) across different consumer demographic groups. As a single item scale, it is usually exempt from traditional multi-group measurement invariance testing. However, service organizations could explore techniques such as Differential Item Functioning (DIF) (Liu et al., 2023). This might be particularly useful for multinational service organizations, which employ NPS in different markets.
Is NPS data compression warranted?
The NPS calculation first involves turning the untransformed score (Schlosser, 2023) from (reasonably-assumed) interval data into ordinal data (Schulman & Sargeant, 2013). Next, NPS’ transformed score is obtained via subtracting the percentage of detractors from promoters (Schlosser, 2023). While NPS’ transformed score is supposedly useful for benchmarking purposes, an identical transformed score can be obtained based on entirely different proportions of promoters and detractors, with each scenario requiring entirely different remedial actions (Hanson, 2011). For example, if Company A has 5% promoters, 90% passives and 5% detractors, NPS is 0 (5% minus 5%); if Company B has 50% promoters, 0% passives and 50% detractors, NPS is also 0 (50% minus 50%) (Grisaffe, 2007). The latter may occur in service encounters involving rival customers, particularly if one set of customers has a more positive/negative experience (e.g., sporting contexts where opposing fans are asked to complete a matchday experience survey, initiated by the winning home team’s marketing department) (cf., Meire et al., 2019).
Relatedly, obtaining the same NPS value of zero with widely different passive respondent percentages demonstrates why service organizations should investigate their own passive respondents. In this context, a services marketing lens suggests respondents in different service sectors may exhibit different behaviors to their expected classifications. For example, customers can be satisfied with a service provider yet disloyal (Lee et al., 2001) as they look for better value, or dissatisfied but loyal due to high switching costs. Passives may not even exhibit as stable behaviors as other categories might (Baehre et al., 2022b). Omitting a subset of NPS-based data therefore suppresses valuable information that could aid NPS knowledge across disparate service sectors (Lewis & Mehmet, 2020).
Taking the above into account, it would appear sensible to report detractor, passive, and promoter percentages alongside NPS’ untransformed and transformed scores, at least for internal reporting purposes. Utilizing follow-up questions across the three categories of respondents may also help reveal reasons for service-context-specific effects.
Recommendation
It appears judicious to adopt a dual version of NPS: the transformed score for public relations and benchmarking, and the untransformed score specific to the organization, its service sector, and its stage on the servitization journey. Using the untransformed score (and other associated data) for internal purposes would allow data that would otherwise be trimmed to inform strategic marketing decisions specific to the ‘Facilities’ and ‘Transformation’ aspects of FTU, and the respective servitization stage the organization has reached. Importantly, as untransformed NPS data would be used for internal purposes, it enhances the chances service organizations (a) find strategic advantages, and (b) these advantages are more sustainable given competitors are unaware of any insights gleaned from such data until they are exploited. In this sense, NPS’ opaque ‘summary judgment’ can be a competitive lever for service organizations.
How are NPS, likelihood-to-recommend, and word-of-mouth connected?
The Net Promoter Score captures self-reported likelihood-to-recommend to others. Recent figures suggest 2% of surveyed CX managers use a likelihood-to-recommend metric as a core CX metric, but do not consider this to be NPS (Qualtrics, 2023). Conceptually, likelihood-to-recommend captures likelihood of sharing positive word-of-mouth (WOM). In services marketing contexts, where a company’s offering is at least somewhat intangible (and therefore tricky to evaluate), customers often rely on WOM when making purchasing decisions. Reichheld (2006) takes the view that those who are unlikely to give positive WOM (PWOM) will give negative WOM (NWOM), stating detractors are responsible for 80%-90% of a company’s NWOM. However, not sharing PWOM is different to NWOM, which NPS fails to measure. East et al. (2011) find that detractors express very little negativity and can be responsible for more PWOM than NWOM. While high scores on a likelihood-to-recommend NPS question unarguably capture stated PWOM intention, its link to the equally informative NWOM is elusive. East et al. (2011) therefore recommend both PWOM and NWOM be measured.
Raassens and Haans (2017) conducted a study on NPS and electronic WOM (eWOM) behavior in the servitized automotive and telecommunications industries. As expected, customers who provided a higher promoter score posted more positive eWOM messages, while detractors were responsible for most negative eWOM. However, passives, who generated most (but not all) neutral messages also accounted for 27% of negative eWOM messages, suggesting WOM and eWOM in NPS contexts might operate differently (i.e., the link between NPS and positive/negative word-of-mouth may not hold in the increasingly important digital space).
Our knowledge of the importance of (e)PWOM and (e)NWOM in NPS service contexts is hindered because studies predominantly focus on WOM behavioral consequences rather than identification of customers who are likely to share PWOM or NWOM (Viswanathan et al., 2013). Viswanathan and colleagues suggest organizations should be more proactive in identifying promoters and detractors. They advise observing recommendation behavior pertaining to different service categories, since recommendation behavior may be a stable characteristic (through a services marketing lens, possibly a homogeneous customer resource, relatively-speaking). This would allow organizations to better-isolate NPS ratings from general likelihood-to-recommend, which is particularly pertinent in service contexts where social network recommendations (WOM) play a major role. Additionally, NPS is historically restricted to existing customers, with ex-customers and never-customers, usually neglected (Baehre et al., 2022a). East et al. (2011) suggest this wider respondent pool will generically engage in more NWOM, and this may influence NPS. WOM can snowball (Sjödin, 2008) and occur beyond the set of existing customers. In this context, polling only existing customers may inadvertently bias NPS-utilizers’ inferences of NPS’ impact on other outcomes.
Recommendation
Given the reliance of WOM in service contexts, we recommend periodically supplementing NPS with NWOM (e.g., “On a 0-10 scale, how likely are you to caution a friend or colleague against [company X]?”). PWOM and NWOM are not two opposite sides of the same continuum, since an unlikelihood-to-recommend does not equate to a likelihood-to-caution. Also, organizations may benefit from disentangling the likelihood-to-recommend question according to the vehicle by which the recommendation is made (e.g., recommending ‘[company X] to the general public on online review platforms’ via eWOM may yield different results to recommending ‘[company X] to a friend or colleague in person’ (WOM)). Finally, the scope of WOM snowballing can be substantial, especially when customers engage in eWOM via social media or review platforms. In services contexts in particular, attitudes towards organizations by people outside the customer base likely play a role in organizations’ reputations and performances. Expanding the scope of NPS polling to former- and never-customers may present a more holistic view of the service organization’s general health, which is particularly useful for earlier stages of servitization (e.g., exploration and engagement) when would-be customers’ perceptions and attitudes matter in the development and continuance of new services.
Is the 11-point NPS scale appropriate?
The Net Promoter Score is based on an 11-point question, ranging from 0-10, and many people are accustomed to scoring ‘out of 10’ (Dawes, 2008). That said, if questions are administered verbally, which (a) still represents an important communication medium for service organizations; (b) is often undertaken via call centers; and (c) is a medium used by more than 65% of customers when attempting to resolve company-related issues (e.g., Saboo, 2022), it may lead to inaccurate scores, “as the gradations of agreement become too fine to easily express in words” (Dawes, 2008, p. 62). In this context, biases such as extreme response styles could be introduced (Weijters et al., 2010), and NPS’ untransformed and transformed scores impacted. NPS is not alone here; customer satisfaction measures could be similarly affected.
One substantive distinction between 10-point customer satisfaction measures and the 11-point NPS scale derives from the latter having a scale mid-point, which allows for ‘neutral’ scoring (on the scale at least). That said, when even-numbered scale formats are used, “truly neutral respondents will randomly shift between positive and negative response options” (Weijters et al., 2010, p. 238). Subsequently, any statistically significant aggregated scores above/below the (unobserved) midpoint on an even-numbered scale should alleviate Reichheld’s (2003, p. 51) concern that “a molecule north of neutral is considered “satisfied””.
Recommendation
The key issue here is the potential bias arising when the NPS question is asked verbally. According to Relently (2023), there are five alternative ways for organizations to administer NPS, including by email, in-app surveys, text messaging (SMS), chatbots, and kiosks. These have a visual (i.e., tangiblizing) component (to varying extents), which should help mitigate biases arising from administering the 11-point scale. While customers are generally more tech-savvy than ever, service organizations should consider the abilities of all customers to access such platforms.
How can NPS-related data connect to Big Data and marketing analytics?
Rust (2007, p. 26) argues that “most sophisticated companies may start out with a metric such as Net Promoter that gets top management thinking about loyalty, but eventually they will move on to methods and metrics with more powerful capabilities”. ‘Sophisticated companies’ are associated with marketing decision support systems (MDSS) (Wierenga & Ophuis, 1997) and Artificial Intelligence (Wehrle et al., 2022). While “[s]imple data can inspire passionate and honest conversations” (Welbourne, 2014, p. 183), Big Data and multiple sources of customer data are increasingly important to better understand the causal factors of loyalty (Zaki et al., 2016), and Big Data analytics capabilities are becoming key drivers of sustainable competitive advantages in service organizations (Behl et al., 2022). For example, incorporating the ‘voice of the customer’ via a linguistic-based text-mining approach that combines both qualitative data from CX touchpoints and quantitative company data sources can help complement NPS insights (Zaki et al., 2016). Other promising algorithms include those designed to (a) analyze customers’ qualitative NPS comments (Chant & Potter, 2019), (b) map comments to NPS classifications (Vanderheyden et al., 2019), and (c) cluster firms’ user bases and plan customer demand at a granular level (Rivera-Castro et al., 2019). However, at present, evidence of enhanced productivity (for example) resulting from a link between NPS and Big Data analytics, remains scarce.
Recommendation
While Big Data analytics are not always accessible to all service organizations, investments in Big Data technologies can serve two functions: (a) understanding customers better (e.g., through pattern spotting), and (b) serving them better (e.g., via real-time responsiveness) (De Luca et al., 2021). Indeed, the infrastructure needed to exploit Big Data is likely compatible with that needed to exploit servitization of advanced services. The dual purpose that Big Data technologies can serve in such service organizations may therefore render the investment more appealing. Big Data technologies and marketing analytics may, in turn, help implement some of the recommendations put forward above, perhaps as part of a wider Net Promoter system (Reichheld et al., 2021). For example, resource allocation decisions may be assisted by capturing customer sentiment expressed in social media and review platforms (Big Data) at different stages of the servitization journey, while triangulation of NPS with sentiment analysis can encourage ‘closed-loop’ processes (Markey et al., 2009). Greater confidence in resource allocation decisions could then ensue.
Concluding Remarks
To conclude, it is particularly apposite to interrogate NPS and put forward recommendations to enhance its use, at a point when service organizations have embraced it so emphatically. Indeed, we are also increasingly seeing NPS applied outside the realm of surveying customers and beyond that of the commercial services sector. For example, the healthcare sector is applying NPS to patient surveys (Adams et al., 2022), organizations are using NPS to gauge employee engagement (Stanbery et al., 2023), and businesses are linking internal reward structures to NPS responses (Byrne, 2015). Thus, applications of NPS are proliferating outside the context for which it was created. Given this wider-ranging scope, appropriately deploying NPS in decision-making may have far greater implications than anticipated.
Interestingly, while NPS is vulnerable to interrogation as demonstrated in this manuscript, it offers ease of data collection (Klaus & Maklan, 2013), and remains a ubiquitous and thus legitimized tool for organizations (e.g., in their benchmarking efforts).
Balancing various stakeholders’ NPS voices, we offer simple ideas on how service organizations can leverage NPS. First, service organizations should consider periodic use of supplementary close-ended questions at different servitization stages to generate fine-grained insights and guide company interventions through their servitization journey. Second, service organizations can usefully deploy NPS as an indicator of likelihood-to-recommend, but should be cautious about equating NPS with loyalty. NPS-utilizers may also undertake more longitudinal studies to determine the causal order between NPS and loyalty. Third, social networks in service ecosystems should be considered, including links between making a recommendation and (re)purchasing, and receiving a recommendation and (re)purchasing; in addition, confident growth predictions may be enhanced by capturing complementary drivers of growth alongside NPS, such as customer satisfaction, CX, and loyalty. Fourth, empirical evidence of causal effects between company interventions and NPS data needs developing, and the guiding framework can act as a platform for specific suggestions at different stages of servitization; levels and types of customer (heterogeneous) resources may also determine resource allocation, with use of AI taking the fore in low-interaction settings (where affordable). Fifth, we recommend service organizations investigate whether the service context they operate in influences the boundary values of NPS categorizations. In turn, this should ensure strategically advantageous service opportunities are less likely to be overlooked. Sixth, and relatedly, NPS’ performance should be assessed against different customer characteristics (e.g., demographics, across cultures). Differential Item Functioning (DIF), for example, can help interrogate the appropriateness of NPS across contexts, and would be particularly relevant for international service organizations. Seventh, service organizations should calculate a standard ‘public relations’ NPS using the transformed score for benchmarking, and a differential ‘internal use’ NPS using the untransformed score to inform company decisions at different stages of the servitization journey, to create sustainable strategic advantages. Eighth, a NWOM question should (periodically) be posed alongside NPS. The NPS question itself should also account for the question vehicle (e.g., online platforms vs. in person), and former-, never-, and current-customers (intermittently) polled. Ninth, visual means for collecting NPS data should be employed, including email, in-app surveys, text messaging (SMS), chatbots, and kiosks. And finally, service organizations may consider investment in Big Data technologies to capture and analyze sentiments expressed on social media platforms at different stages of the servitization journey, and triangulate these with NPS for more confident resource allocation decisions.
Supplemental Material
The Net Promoter Score interrogated through a services marketing lens: Review and recommendations for service organizations
Supplemental Material for The net promoter score interrogated through a services marketing lens: Review and recommendations for service organizations by Hazel Lacohee, Anne Souchon, Peter Dickenson, Louise Krug and Fabrice Saffre in International Journal of Market Research
Supplemental Material
Supplemental Material - The net promoter score interrogated through a services marketing lens: Review and recommendations for service organizations
Supplemental Material for The net promoter score interrogated through a services marketing lens: Review and recommendations for service organizations by Hazel Lacohee, Anne Souchon, Peter Dickenson, Louise Krug and Fabrice Saffre in International Journal of Market Research
Footnotes
Declaration of conflicting interests
The author(s) declared no potential conflicts of interest with respect to the research, authorship, and/or publication of this article.
Funding
The author(s) disclosed receipt of the following financial support for the research, authorship, and/or publication of this article: This work was supported by a British Academy research grant [ref: SRG1819\191302].
Supplemental Material
Supplemental material for this article is available online.
Notes
References
Supplementary Material
Please find the following supplemental material available below.
For Open Access articles published under a Creative Commons License, all supplemental material carries the same license as the article it is associated with.
For non-Open Access articles published, all supplemental material carries a non-exclusive license, and permission requests for re-use of supplemental material or any part of supplemental material shall be sent directly to the copyright owner as specified in the copyright notice associated with the article.