
Abstract
In times of declining response rates and over-surveying, improving our understanding of why people participate in surveys is more important than ever. Previous research showed that online panel participants have intrinsic (e.g., topic interest, altruism) and extrinsic (e.g., incentives) participation reasons. Our study expands this research by implementing an experiment using two common forms of survey measurement: ranking and rating. The experiment was fielded in a professional respondents’ sample from a German online panel (n = 407) and in an address-based sample (mail and online) of German non-professional respondents (n = 1,137). Besides extrinsic and intrinsic motivations, the experiment included various study design features (i.e., mode, length, data security) and the mood during the time of contact as possible reasons for participation. The results confirm previous findings regarding the motivations of online panelists but also show important differences between professional and non-professional respondents. Specifically, the main participation reasons of professionals are topic interest (intrinsic) and incentives (extrinsic), while non-professionals are primarily motivated by intrinsic reasons (topic interest and purpose of study). This notion is also supported by the Latent Class Analyses, which showed that three of the four classes for professional respondents had a high probability of naming incentives as one of their main reasons for survey participation, whereas none of the four non-professional clusters rated incentives highly. The differences between the two samples highlight that professional panel members have different motivation structures than participants in general population surveys. This may undermine generalizability, but it also provides opportunities for targeted recruitment.
Introduction
Even though new data collection methods are on the rise, social and economic research heavily relies on survey results to get insights into consumers’ and citizens’ views (Conrad et al., 2021). One of the reasons for the enduring popularity of surveys is the fast turnaround of online surveys, as well as their relatively low costs and ease of implementation (Callegaro et al., 2015). Moreover, many professional online panels exist in which panel members self-register to take surveys regularly for incentives as their compensation.
One goal of survey research is to draw conclusions about the general population. Many large-scale surveys rely on probability-based samples of the general population to do so. However, alternative approaches exist that are based on non-probability online panels (Baker et al., 2010; Cornesse et al., 2020). For example, researchers can use an online panel to draw a quota sample of the target population or combine it with a probability-based survey. One important question when comparing or combining probability surveys with non-probability panels is whether there are motivational differences between professional respondents (online panel members) and participants in probability surveys (non-professional respondents).
There are many reasons why people participate in surveys. For example, Groves and Couper (1995) divided participation reasons into four main categories: social environment, individual, survey design, and interviewer. Keusch (2015) listed five categories: societal-level factors, sample person characteristics, survey design attributes, incentives, and questionnaire design. Brüggen et al. (2011) and Zhang et al. (2020) investigated motivations to participate in online panels by showing that panel members have both intrinsic (e.g., giving an opinion and helping) as well as extrinsic (e.g., incentives) reasons to participate in surveys.
Our study is the first that uses identical experimental measurements to assess participation motivation for professional and non-professional respondents. The measurement builds on two common measurement instruments that are frequently applied in survey research: rating and ranking. The experiment includes eight reasons to participate in a survey that are grounded in previous literature. The reasons are based on extrinsic and intrinsic motivations, the survey design, and the affective state at the time of the interview.
Motivations to participate in surveys
Building on previous concepts of survey participation (e.g., Brüggen et al., 2011; Groves and Couper, 1995; Keusch, 2015; Zhang et al., 2020), we identified four different types of reasons why people participate in surveys. First, people can be driven by intrinsic reasons, such as giving an opinion or interest in the research topic (Brüggen et al., 2011; Zhang et al., 2020). Second, people can be driven by extrinsic reasons such as incentives or feeling obliged to participate (Brüggen et al., 2011; Keusch, 2015; Zhang et al., 2020). Third, study design characteristics such as the survey mode and the length of the survey can affect response burden and, by that, the likelihood of survey participation (Groves and Couper, 1995; Keusch, 2015). Finally, the affective state during the time of the interview can influence survey participation (Groves and Couper, 1995).
Research on intrinsic reasons has found that topic interest, survey enjoyment, and curiosity are important reasons for survey participation (e.g., Cape, 2008; Sheehan and McMillan, 1999; Van Kenhove et al., 2002; Walker et al., 2009). Other intrinsic reasons for survey participation are to voice their own opinion and to help others (e.g., Dillman, 2011; Evangelista et al., 1999; Groves et al., 1992; Porst and von Briel, 1995; Zhang et al., 2020). For example, Evangelista et al. (1999) showed that 17% of Australian professional respondents were motivated by the belief that their opinion counts. Similarly, Porst and von Briel (1995) showed that 15% of German non-professional respondents indicated interest and curiosity as their main motives for participation.
Research on extrinsic motivation has found that incentives, recognition, and obligations are important for survey participation (e.g., Albaum et al., 1998; Bosnjak et al., 2005; Dillman, 2011; Göritz, 2006; Krosnick, 1999; Singer, 2018; Zhang et al., 2020). For example, in a meta-analysis of web survey experiments Göritz (2006) showed that monetary incentives motivate people to start a web survey and complete it. Dillman (2011) argued that recognition from others can be one of the drivers of survey participation, and Krosnick (1999) suggested that some people may feel a social responsibility to participate.
Research on study design characteristics found that survey mode, prenotifications, timing and message of invitations, as well as the design and length of the questionnaire, impact survey participation (e.g., Bandilla et al., 2012; Daikeler et al., 2020; Dykema et al., 2013; Galesic & Bosnjak, 2009; Göritz, 2014; Keusch, 2015; Manfreda et al., 2008; Messer & Dillman, 2011). For example, a meta-analysis of 97 studies by Daikeler et al. (2020) showed that prenotifications can significantly increase the probability of participation. Similarly, Messer and Dillman (2011) showed in their experimental study that offering a $5 cash incentive increased the response rate from 25.7% to 46.3%. Finally, another aspect of the survey design that can influence survey participation is the implementation of privacy regulations (e.g., Couper et al., 2008; Singer et al., 1993; 2003). For example, Keusch et al. (2019) showed that participation in mobile data collection depends on respondents’ privacy and security concerns.
Research also showed that the affective state during the time of the interview request influences survey participation (e.g., Groves and Couper, 1995; Kämpfer and Mutz, 2013; Schwarz and Clore, 1983; Stoop, 2012). For example, Stoop (2012) suggested that respondents are easier to recruit for a survey interview if they are in a better mood. Additionally, researchers found that weather during the time of an interview influenced survey results (Kämpfer and Mutz, 2013; Schwarz and Clore, 1983).
In sum, our study aims to answer the following two research questions: RQ1: What are the main reasons for professional and non-professional respondents to participate in surveys? RQ2: Is there a difference between professional and non-professional respondents with respect to extrinsic and intrinsic survey participation motives?
Methods
Data
Data used comes from two surveys with German professional and non-professional respondents. The sample of professional respondents is based on a web survey fielded in November 2021 using a commercial online access panel as a sampling pool. The survey was a follow-up study to a previous survey. A total of 452 members participated. The participation rate was 44.8%, and the completion rate was 87.4%. The analytic sample, which included only respondents who answered all questions of our experiment and on key demographics, encompassed 407 respondents. The experiment on reasons for survey participation was allocated toward the end of the questionnaire. Respondents received a small incentive of 1.50 Euros for their participation. With respect to the demographic characteristics, respondents had an average age of 44 years, 45.5% were female, 25.3% had low, 35.6% medium, and 39.1% high education levels. Compared to the demographic composition of the online panel, respondents were more likely to be male, had lower levels of education, and were slightly older (see Supplementary Table SA1).
The sample of non-professional respondents is based on a mixed-mode (mail and web) survey in the city of Mannheim, which was fielded between November 2019 and March 2020. A total of 1,343 respondents completed the survey, out of which 809 answered by mail and 534 on the Internet. The response rate (AAPOR RR2) was 24.3% (AAPOR, 2016). The analytic sample with valid values on all experimental items and key demographics encompassed 1,173 respondents. Half of the gross sample was allocated to a sequential/web-push design and only received the paper questionnaire if they did not respond to the initial request (i.e., in the reminder) (Dillman, 2017). Independent of mode sequence, 75% of the sample were also assigned to groups with a small prepaid incentive (a 1- or 2-Euro), either provided with the first or second contact. 1 The experiment on reasons for survey participation was allocated in the middle of the questionnaire. With respect to the demographic characteristics, respondents had an average age of 54 years, 42.4% were female, 19.2% had low, 23.1% medium, and 57.7% high education levels.
Experiment on reasons for survey participation
Based on the previous literature on motivations to participate in surveys (e.g., Brüggen et al., 2011; Groves and Couper, 1995; Keusch, 2015), we selected eight reasons that were related to intrinsic and extrinsic motivation, survey design characteristics, and the affective state during the interview (see Figure 1). To investigate the best ways to capture respondent motivation, we developed an experiment that provided two different response scales for the eight topics: rating and ranking. These two response scales are widely used in survey research and have specific advantages and disadvantages (Alwin and Krosnick, 1985; Klein and Arzheimer, 1999). Most importantly, whereas rating allows the measuring of individual orientations and results in an evaluation of every item, ranking is used to measure relative priorities. To utilize the advantages of both measurement approaches, a random half of the respondents in both samples received the rating scale, in which they were asked to rate each participation reason on a seven-point response scale from “not important at all” to “very important” (see Figure 1 for the English and Supplementary Figure SA1 for the German version). The other respondents received the questions in the ranking format, in which they could select the most important reasons (one, two, or three) on which they base their decision to participate in a survey (see Figure 1 and Supplementary Figure SA1). Experimental versions of the motivation to participate question: Ranking (Panel a ‘top') and rating (Panel b ‘botton').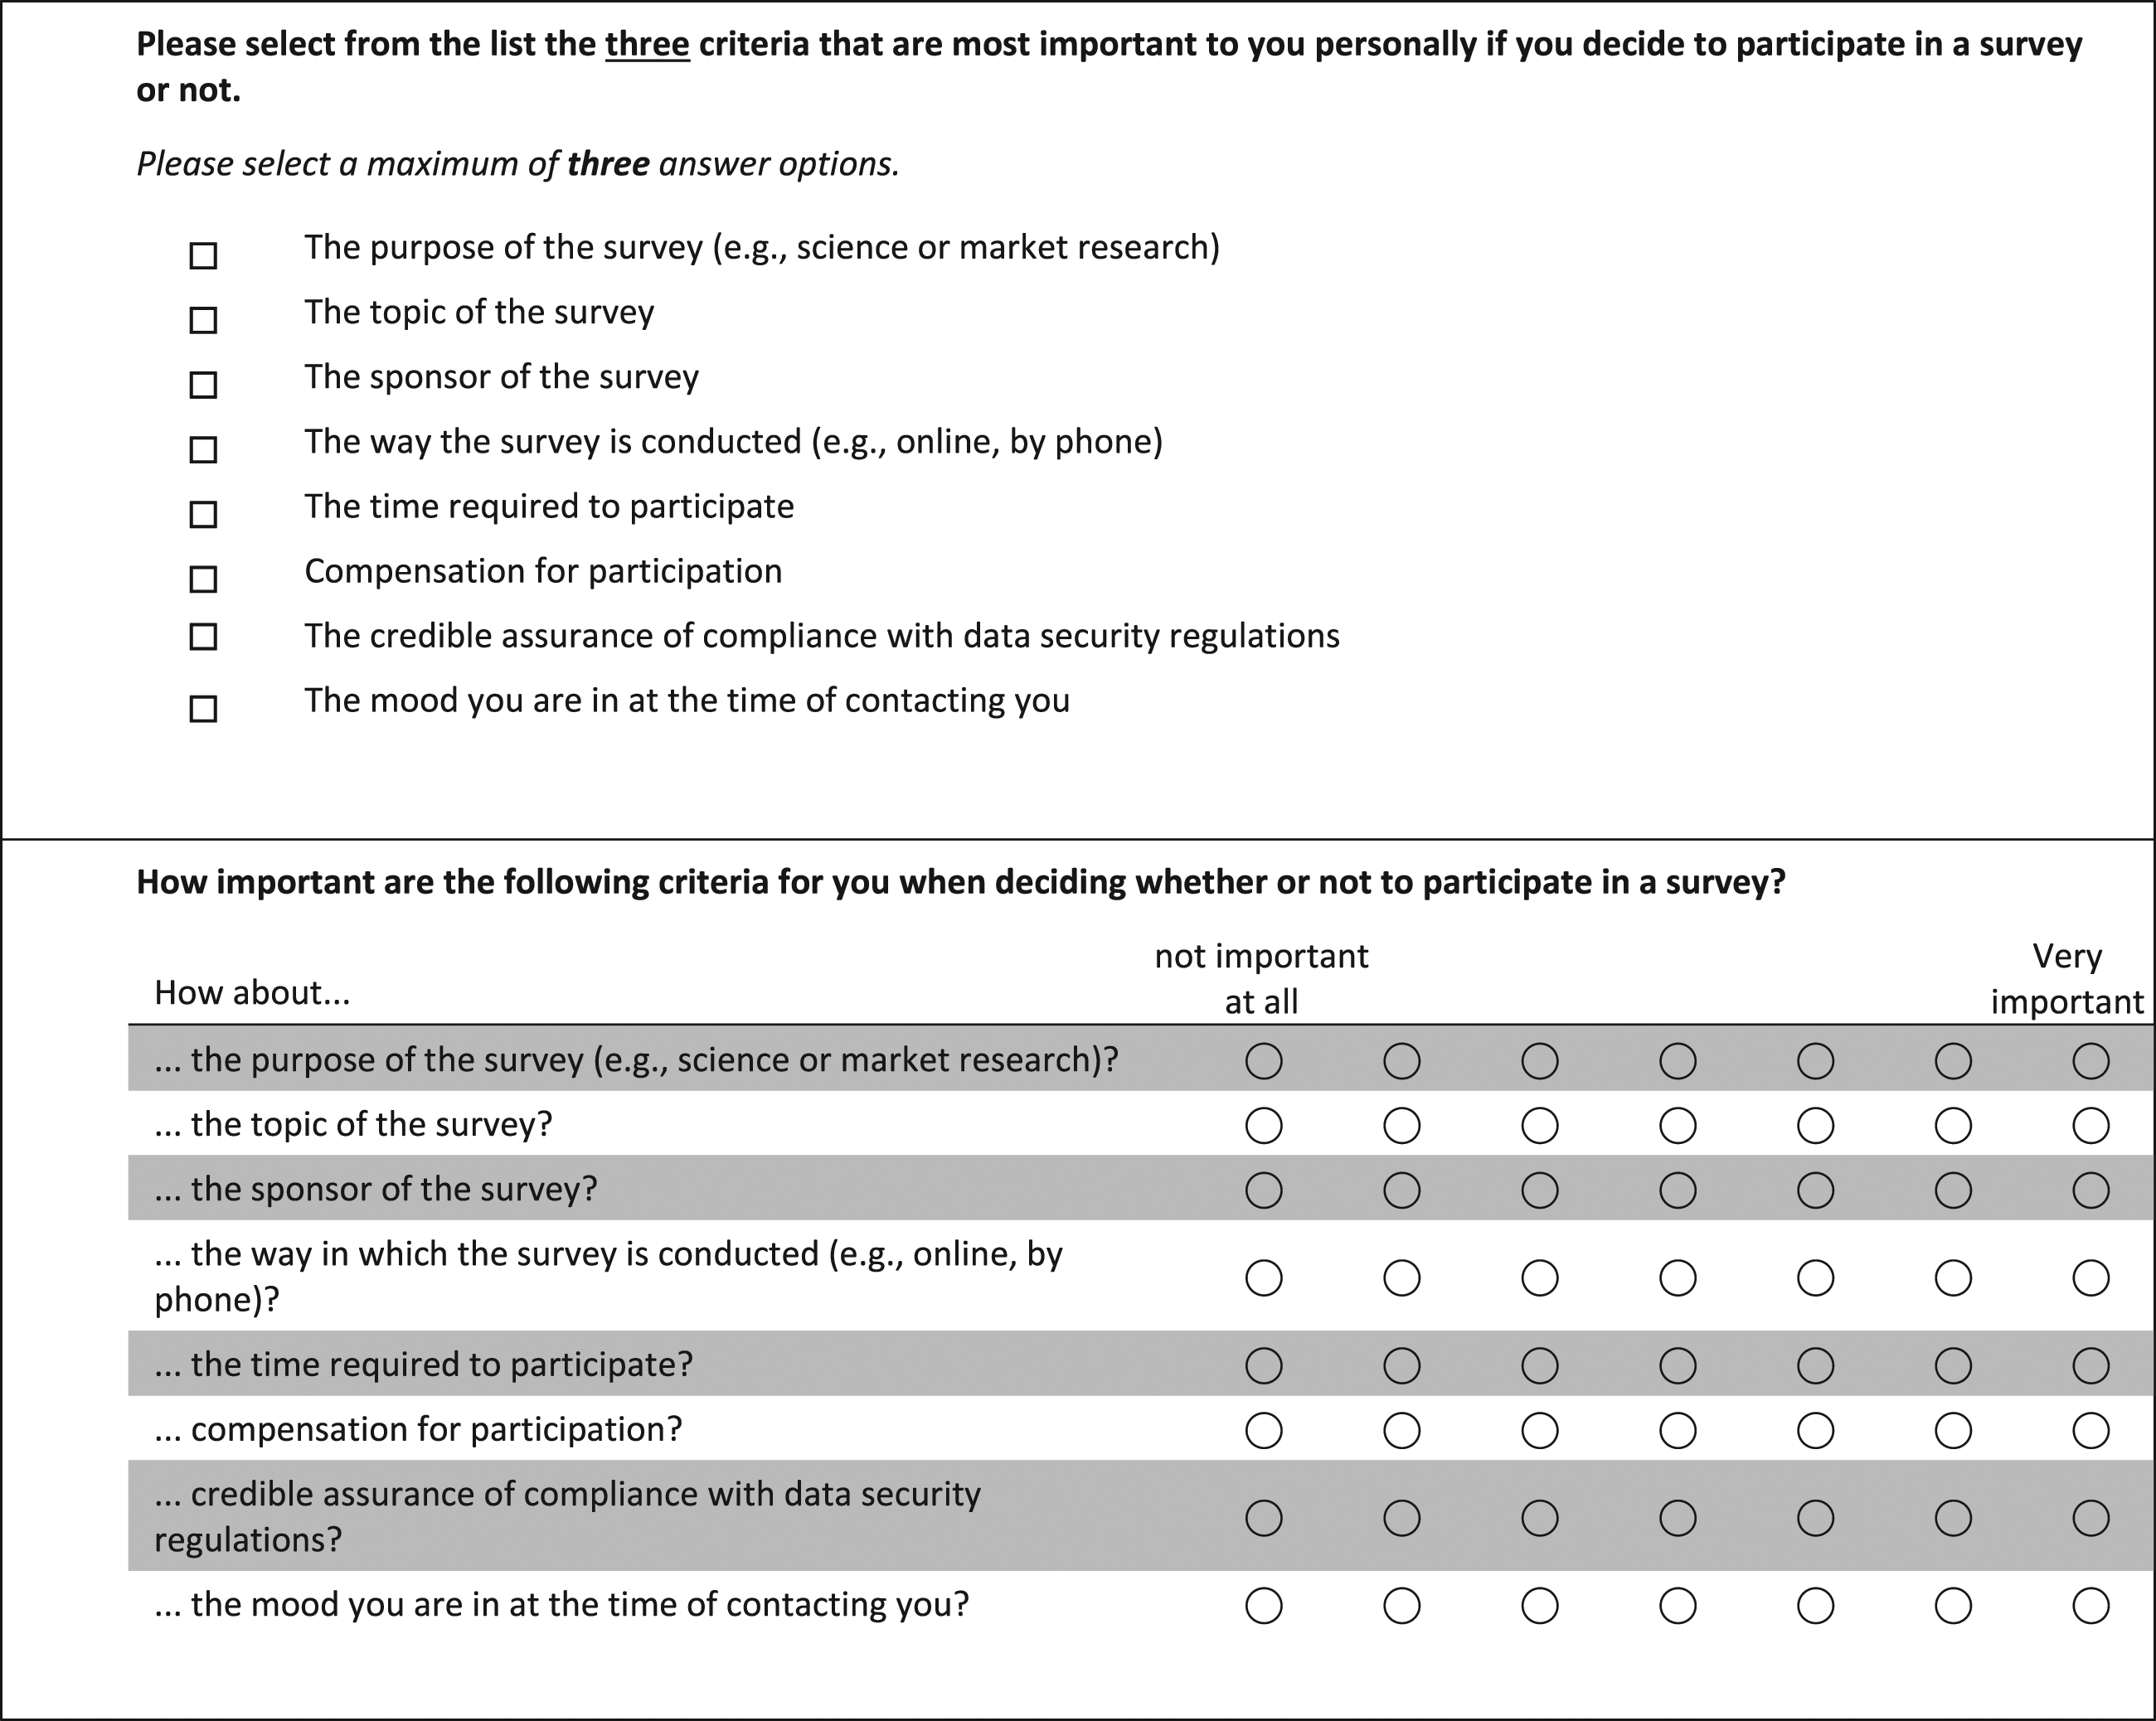
Analysis
As a first step, we used mean differences, standard deviation differences, and correlation analyses to compare the two samples and the two measurement methods. Means were used because the rating items were not measured in percentages. To make rating and ranking comparable, both scales were recoded so that 0 is the lowest value and 1 is the highest. Mean differences were used to compare the various motives within each measurement method (rating and ranking) and across measurement methods. Standard deviation differences were only used for the ratings. Correlations were used to compare the two measurement methods with another. A correlation of 1 would suggest that the two methods arrive at the exact same conclusion, whereas a correlation of −1 would suggest that they show completely opposite results. A correlation of 0 would suggest that there is no relationship between the results of the two measurement methods.
To better understand how different reasons for participation can influence the professional and non-professional survey takers, we estimated a series of Latent Class Analyses (LCA). LCA is used to identify different classes of respondents based on their underlying motivations (Collins and Lanza, 2010; Hagenaars and McCutcheon, 2009). By running the models separately for the two types of respondents, we can better understand how individuals group based on their reasons for participation. Based on the initial results, we decided to present the results only for the ranking data (see Online Appendix Supplementary Table SA2 for the LCA based on the rating data). However, using ranking would not have changed substantive results (see also Supplementary Figure SA2).
To account for demographic differences between the two samples and differences in the survey design, we conducted four robustness checks. First, we constructed a weight to adjust the demographic composition of both samples. Specifically, this weight was constructed by harmonizing the share of respondents for a total of 30 combinations of sex (2 categories), education (3 categories), and age group (5 categories). Second, to account for differences in sex between the first wave and the follow-up study of the sample of professional respondents (see Supplementary Table SA1), we compared the full sample to the sample of only female respondents. Third, to control for the impact of an incentive experiment within the sample of non-professional respondents, we compared the full sample to the sample that included only respondents who received an incentive. Fourth, to account for mode differences within the sample of non-professional respondents, we compared the full sample to the sample of online participants only.
Results
When comparing the rating and ranking approach for both samples, we see that while for the rating method, most reasons for participation are rated relatively high (low differentiation), the ranking approach reveals stronger differences between the motives (high differentiation, see Figure 2). When looking only at the professional respondents, we find that they tend to be motivated by study design characteristics such as data security (avg = .76) and survey mode (avg = .76) when using the rating scale (see Panel a in Figure 2). In contrast, the ranking scale suggested participation is based on extrinsic (i.e., incentives, avg = .56) and intrinsic (i.e., topic interest = .53) motivation (see Panel b in Figure 2). For non-professional respondents, the rating showed study design (i.e., data security, avg = .84) and intrinsic motivation (i.e., purpose (avg = .81) and topic interest (avg = .80)) as essential, whereas the ranking suggested that non-professionals are primarily motivated by intrinsic reasons, such as purpose of the study (avg = .71) and topic interest (avg = .62). The large difference between professional and non-professional respondents can also be illustrated by correlating the order and spacing of the eight reasons for each measurement method with each other, which revealed basically no correlation (rranking = .08, rrating = −.04). This means that there was no association between the relative order irrespective of the measurement method across the two samples. Motivations of professional (Panel a) and non-professional (Panel b) respondents to participate in surveys.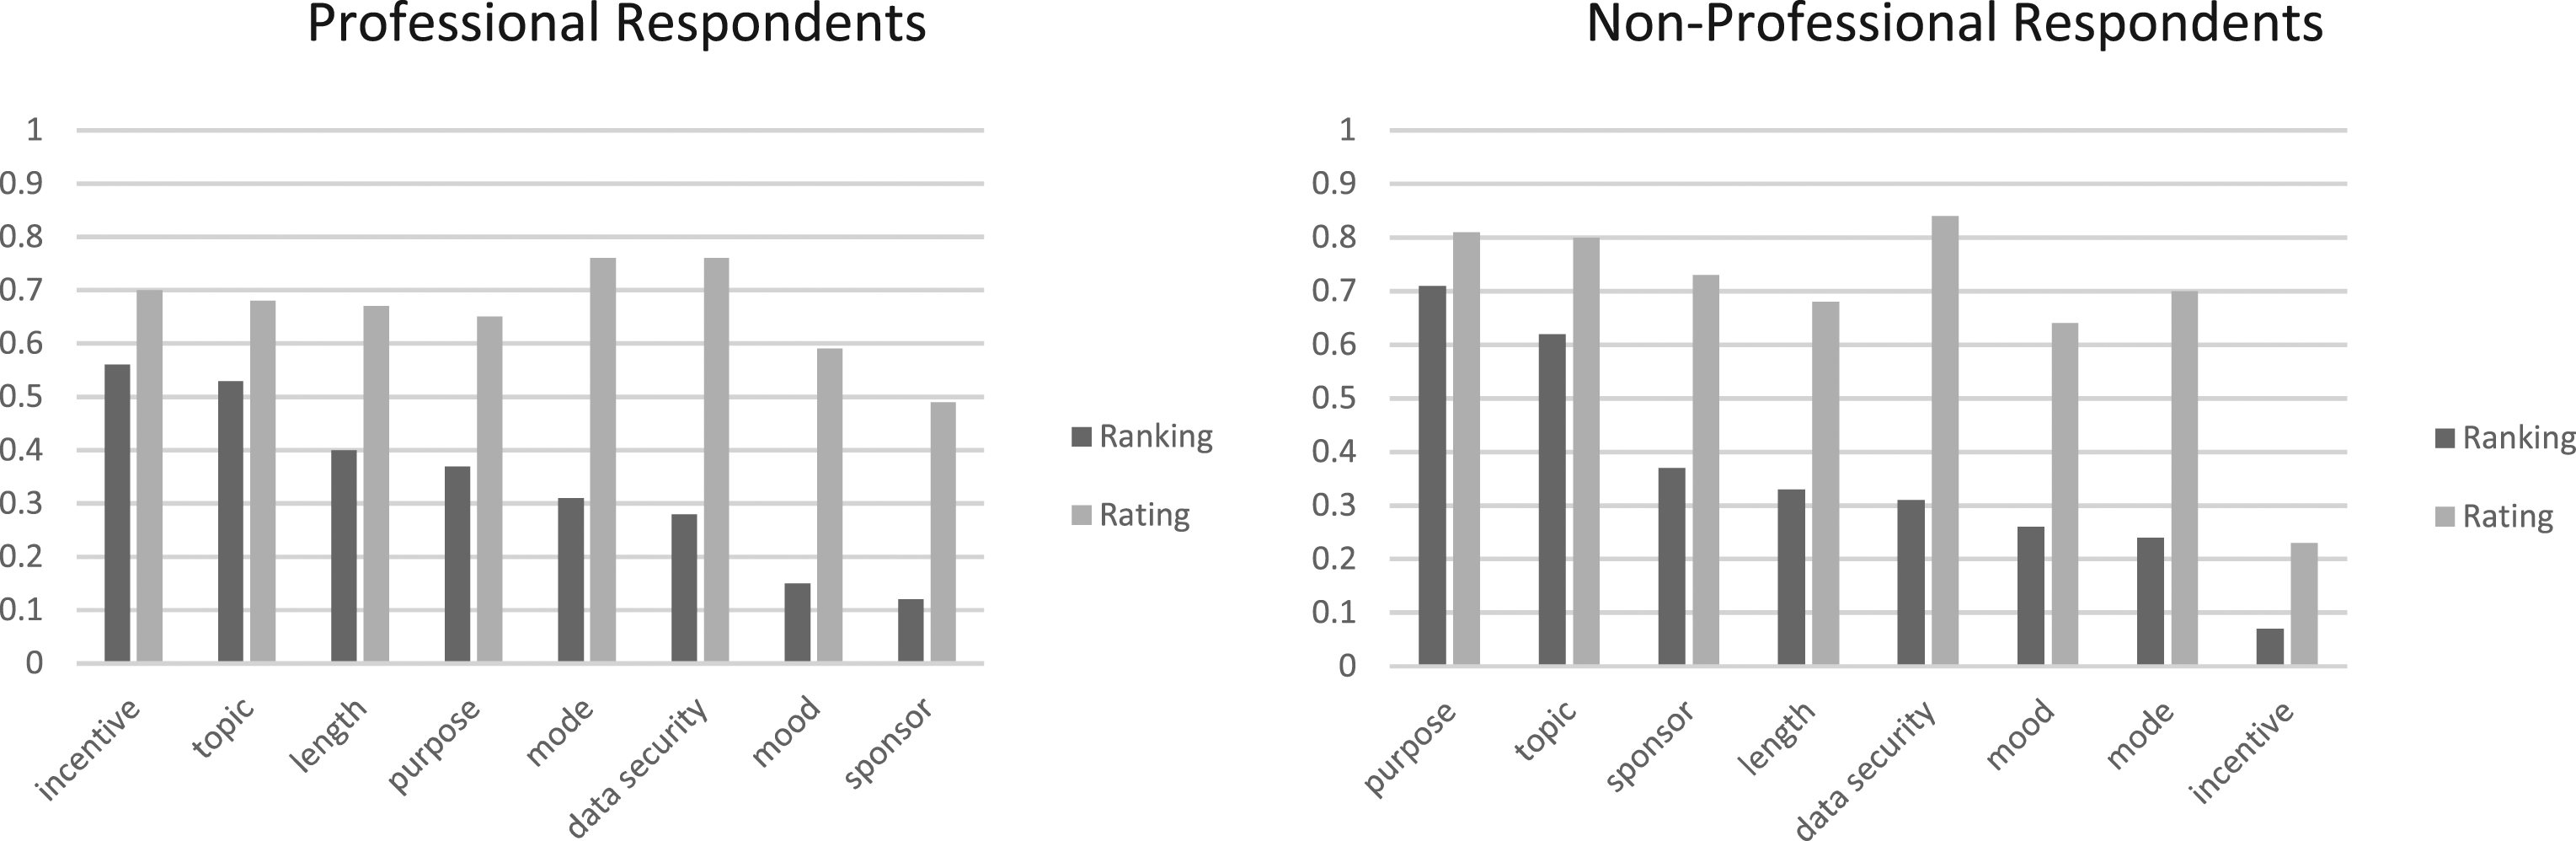
In addition to means, we also investigated whether the two samples differed in the standard deviations for the rating. Supplementary Table SA3 shows that out of the eight standard deviation pairs, two showed statistically different results between the professional and non-professional respondents. Specifically, the reasons survey purpose and mode showed differences in the standard deviations. However, the results did not show a systematic pattern of lower or higher standard deviations for either of those samples.
Figure 3 shows the differences in participation motivation for professional and non-professional respondents separately for the two measurement methods. Notably, the differences are very similar regardless of the response scale. This is illustrated by a correlation of .95 regarding the ranking and spacing of the differences with respect to the eight reasons. The correlation is close to the maximum of 1, which suggests that both measurement methods show almost the same group differences. In the ranking, the largest difference was observed for the incentive (diff = −.49), which was higher ranked by professional respondents. In contrast, non-professionals ranked purpose (diff = .34) and study sponsor (diff = .25) higher than their non-professional counterparts. In the rating, again, the largest difference was observed for the incentive (diff = −.47), which was favored by professional respondents. Non-professional respondents were more likely to favor the study sponsor (diff = .24) and the purpose of the study (diff = .16) than professional panel members. Differences between non-professional and professional respondents (Panel b - Panel a of Figure 2) for ranking (Panel a) and rating (Panel b).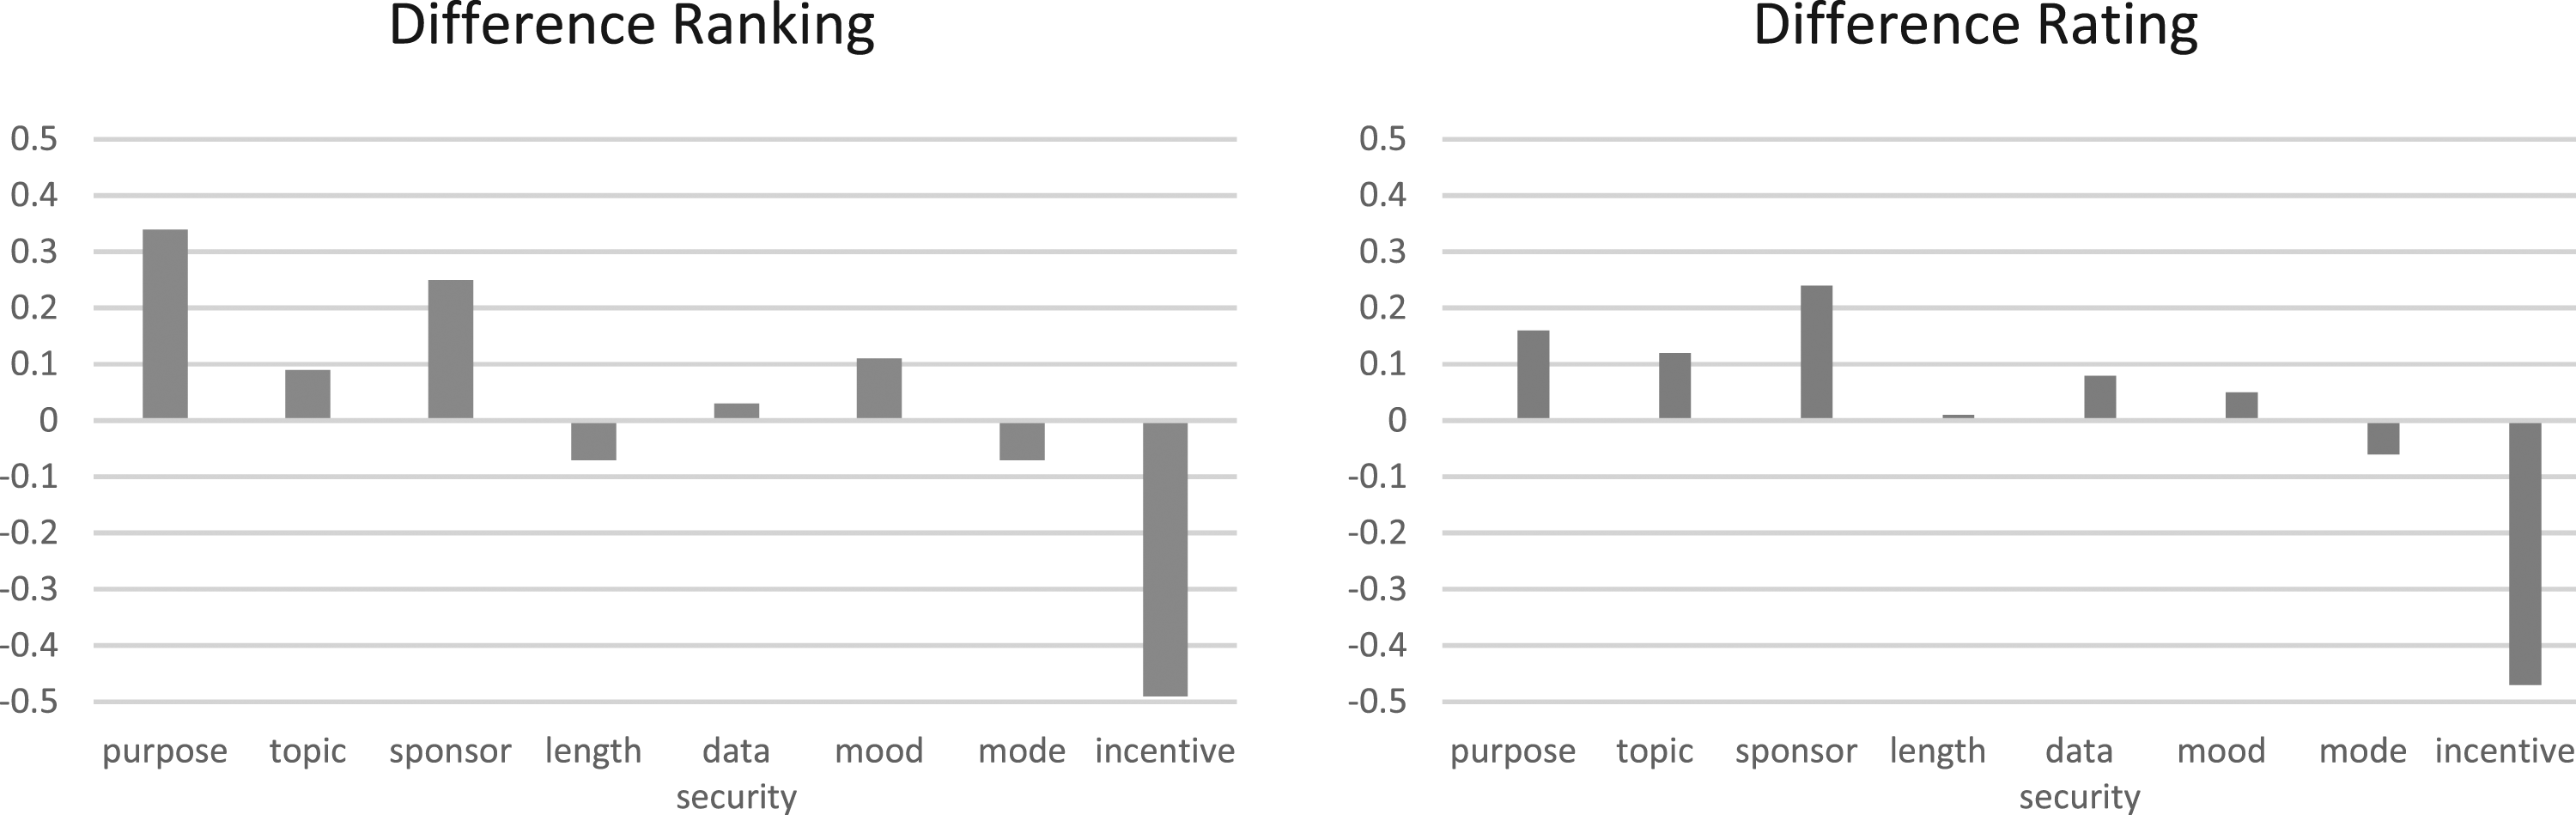
Fit indices comparison for latent class models for ranking responses for professional and non-professional respondents.
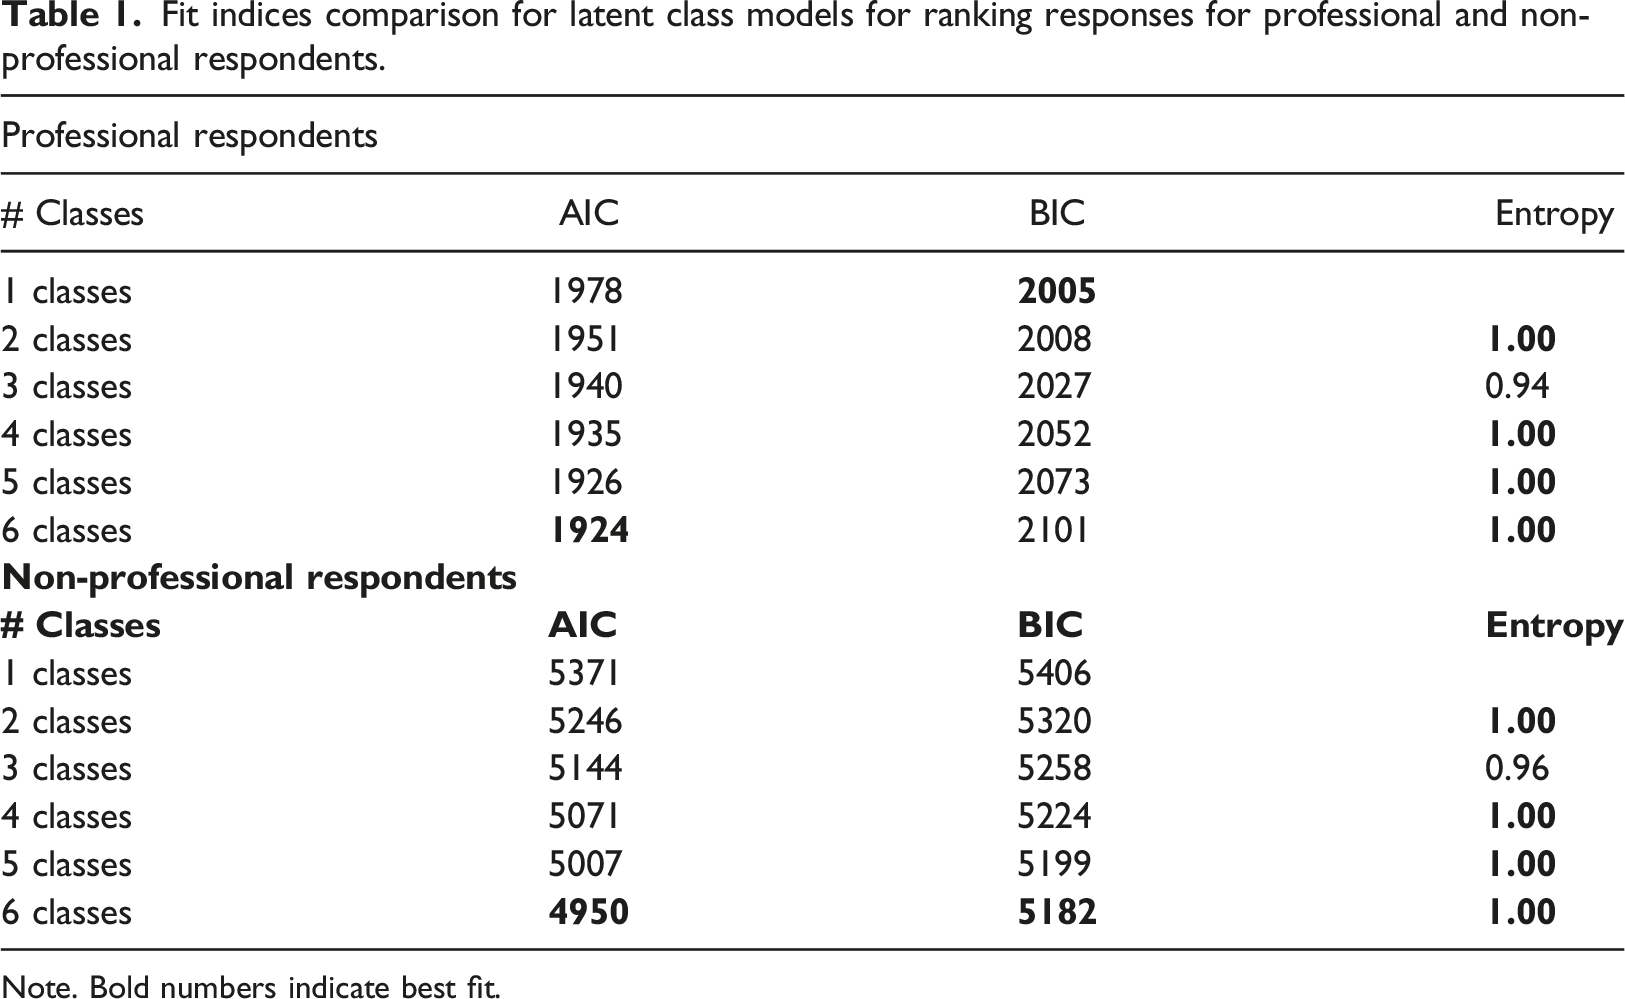
Note. Bold numbers indicate best fit.
The four class solution shows distinct class patterns for the professional and non-professional survey participants (see Figure 4). This highlights our prior results and shows that the underlying motivations for being part of the survey are very different for the two groups. For professional respondents, three of the four classes (C1, C3, C4) had a high probability of naming incentives as one of the motives to participate in surveys. These groups amount to 55.8% of the sample. Other motives with a partially high probability for professional respondents were survey length (C4: 9.1%) and survey topic (C3 and C4: 27.4%). None of the four classes for the non-professional respondents rated incentives as one of the key factors for their participation in surveys. However, three of the four classes rated the purpose of the survey as an important motive (C2, C3, and C4: 71.4%). Other important reasons were survey sponsor (C3: 14.3%) and survey topic (C3 and C4: 41.0%). When looking at the rating scale results, we found a very similar pattern (see Supplementary Figure SA2), as none of the four classes of non-professional respondents had a high likelihood of rating incentives high, while for all four classes of professional respondents, incentives were rated as an important motive for participation. Four class solution for ranking response scale separately for professional and non-professional respondents.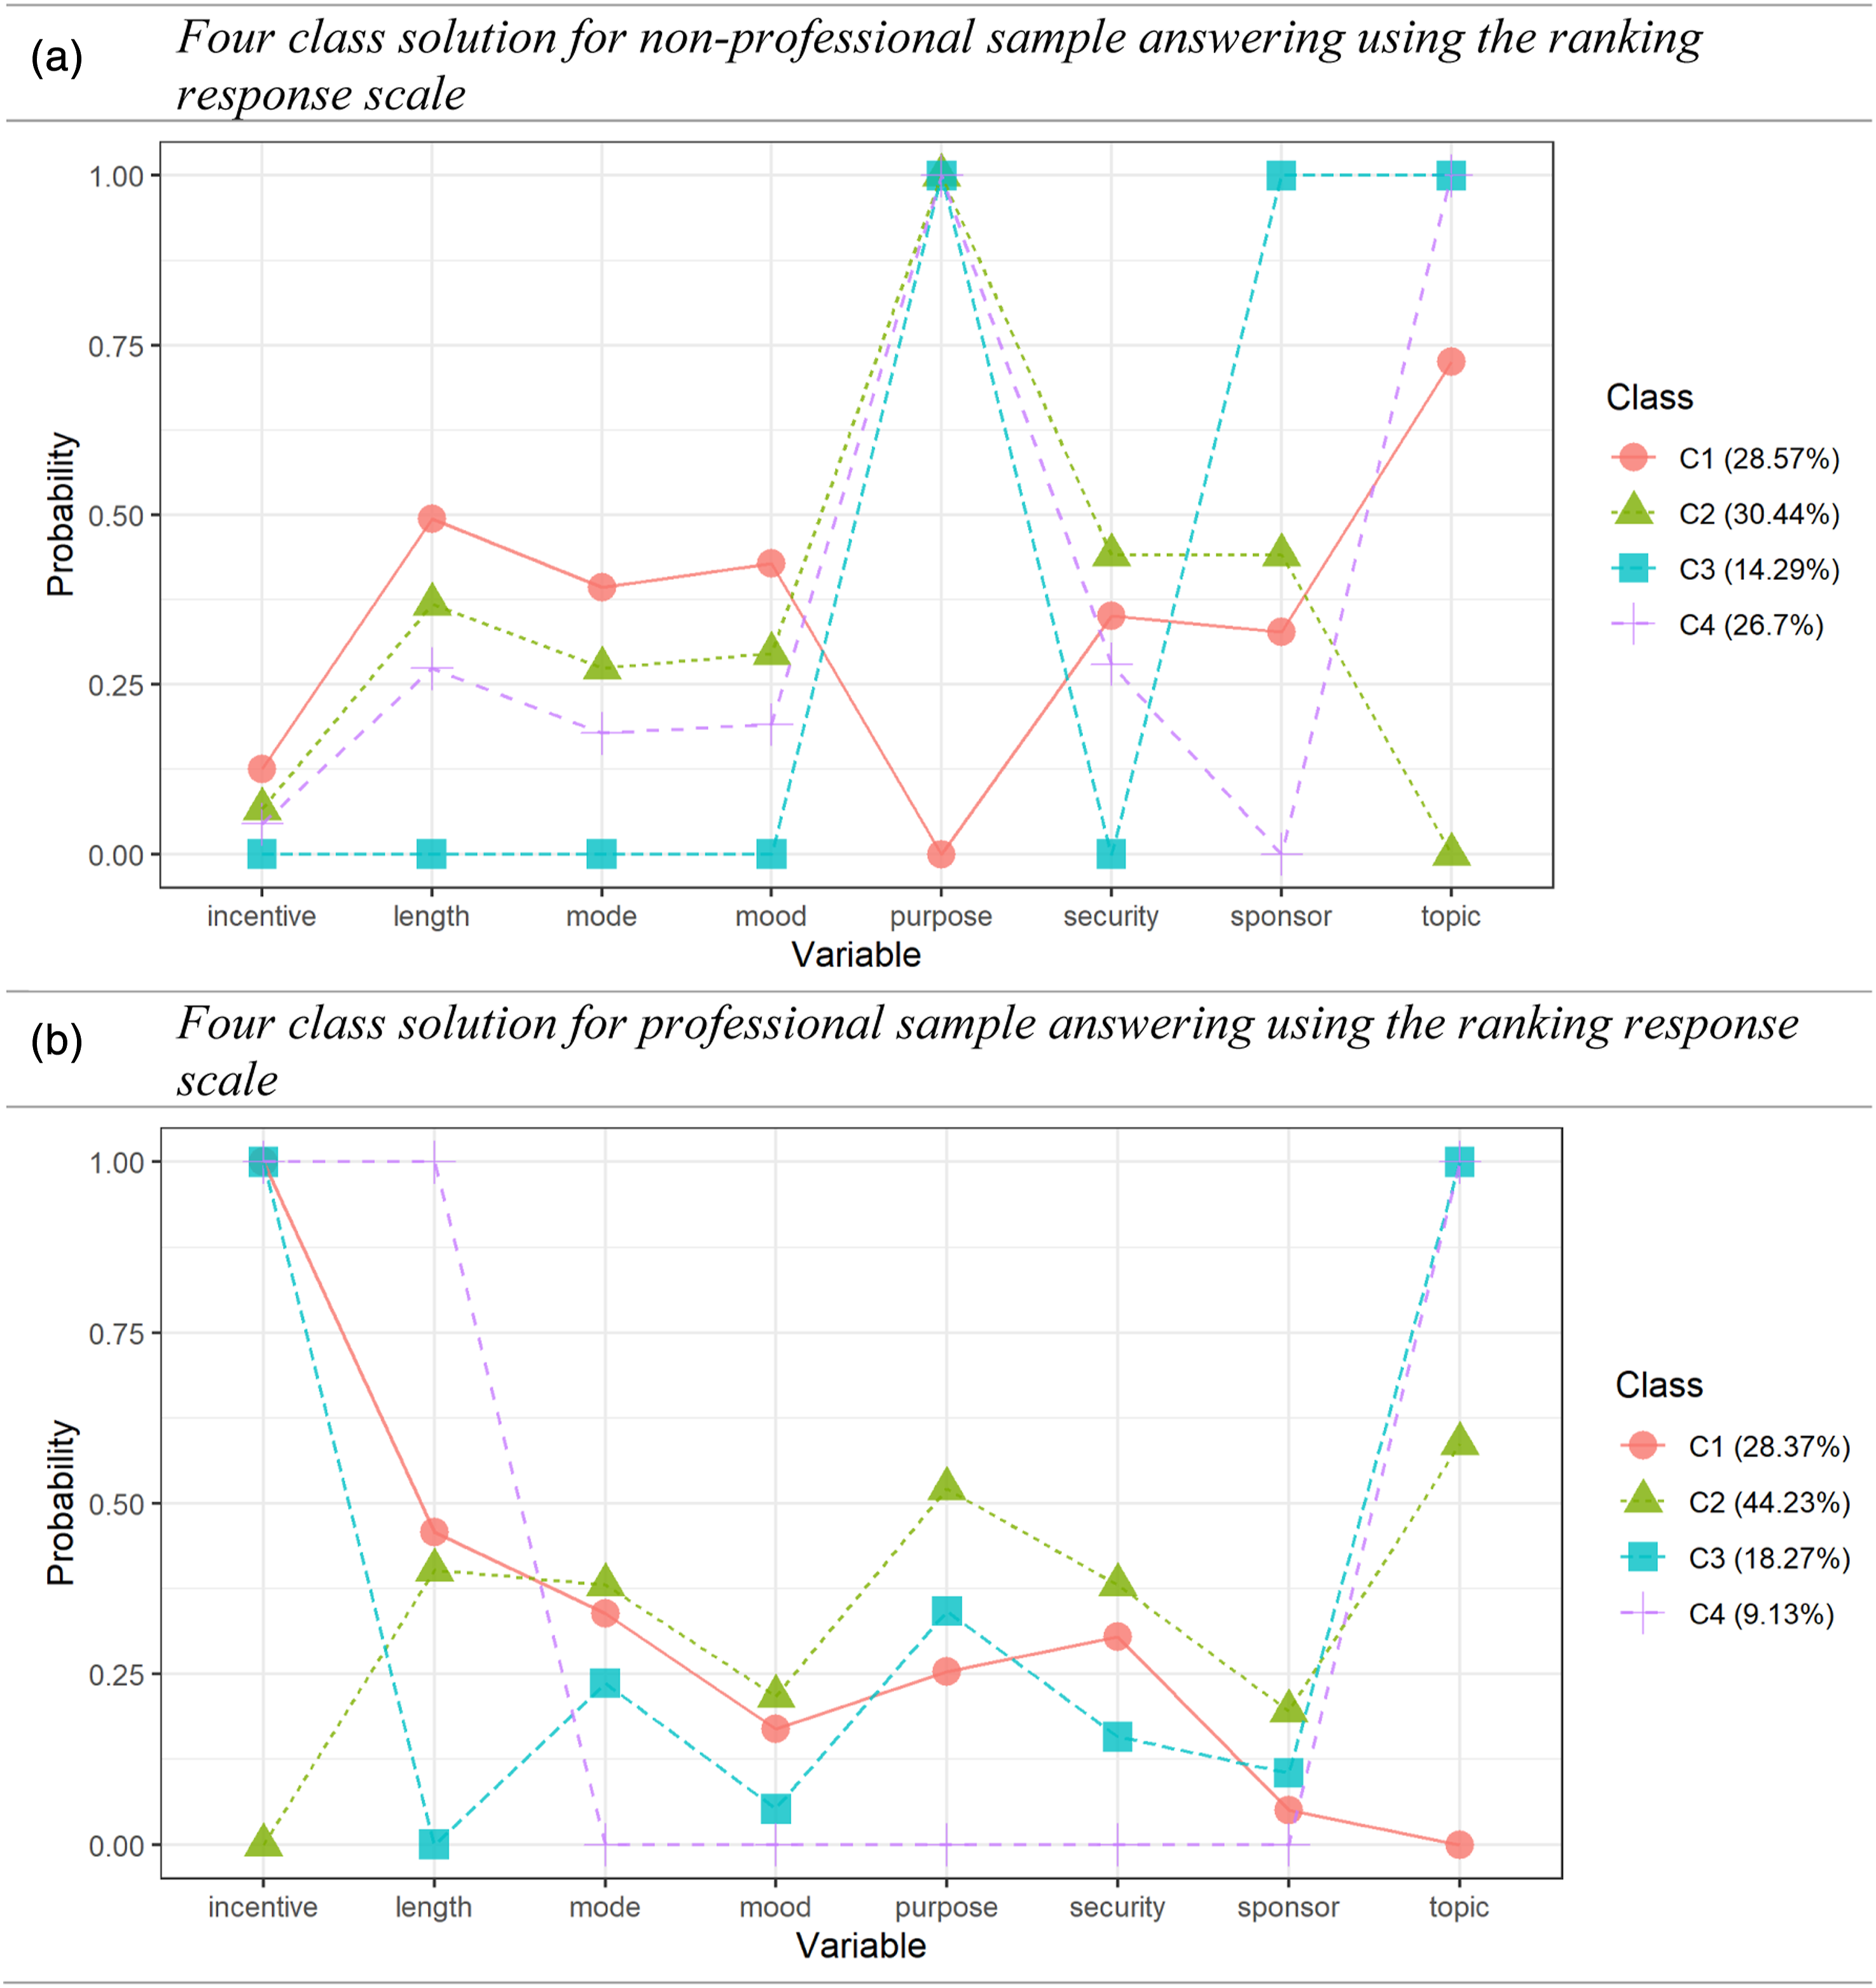
The results of the four robustness checks confirmed that none of the demographic or design differences accounted for the substantial findings reported above regarding the differences and similarities between professional and non-professional respondents (see Supplementary Table SA4). Specifically, the correlations between the motives of the first robustness check comparing the full and the adjusted samples in terms of demographics were 0.98 (ranking) and 1.00 (rating). The correlations for the second robustness check comparing the full sample and a female-only sample of professional respondents were 0.99 (ranking) and 0.99 (rating). The correlations for the third robustness check comparing the full sample and the incentivized sample of non-professional respondents were 1.00 for both ranking and rating. Finally, the correlations for the fourth robustness check comparing the full and the online-only samples of non-professional respondents were 0.98 (ranking) and 0.99 (rating).
Discussion
In answering Research Question 1, the study revealed important differences in the participation motivations of professional and non-professional respondents. These were consistent across the two different response scales used. As to Research Question 2, professional respondents were driven by both intrinsic and extrinsic reasons, such as topic interest and incentives. In contrast, non-professional respondents were primarily driven by intrinsic reasons, such as topic interest and study purpose. These findings reiterate the results presented by Brüggen et al. (2011) and Zhang et al. (2020), whose studies were limited to professional respondents.
We also found important differences between the two measurement methods. While the rating scale tends to lead to high scores for almost all motives, the ranking showed more nuanced differences. Most notably was the difference regarding data security, which was rated as the most important reason by professional (avg = .76) and non-professional respondents (avg = .84), but in the ranking, it was only ranked as the sixth by professionals (avg = .28) and fifth reason by non-professionals (avg = .31). This may suggest that privacy concerns are relevant in theory, but when deciding whether to take part in a survey, other reasons may be more important. Yet, the truth may lie between these two results so that data security might be a precondition for participation but insufficient to convince a person to participate.
Incentives appear to be especially important for professional respondents (55.2% of the sample based on the LCA), which seems logical since they are registered in a commercial panel and take part in surveys regularly. However, similar to data security, incentives seem to function for professionals as a precondition but are not sufficient for their participation. They are also more likely to participate if they have an interest in the topic and if the survey is well designed (e.g., not too long).
This study is not without limitations and opportunities for future research. First, the experiment on motives of survey participation is hypothetical. However, several studies suggest that hypothetical behavior is often closely linked to actual behavior (Ajzen and Fishbein, 2000; Hainmueller et al., 2015), so it appears reasonable that our findings are highly correlated with the motives of actual survey participation. Second, the ranking experiment did not include a full ranking of all motives but only asked for a ranking of the top three choices. This was due to the paper questionnaire, which makes a full ranking more effortful for respondents. Future studies could investigate whether our results replicate in other samples with different measurement methods.
With respect to survey practice, it seems important to understand the reasons for participation in order to increase participation rates, but it is also essential to consider what survey population is invited. The personal relevance of the topic as well as the identification with the purpose of the survey appears important for both professional and non-professional respondents. As a result, researchers should highlight the relevance of their study and develop an interesting and engaging questionnaire. Similarly, study characteristics (e.g., survey length) are important to both respondent groups. Incentives are especially important for professional respondents. This highlights the need to consider the incentive amount separately for potential professional and non-professional survey participants.
Another important finding is that surveys, in general, seem to have a bias toward people who are interested in the topic and see the relevance of the survey purpose. This finding is true for both professional and non-professional respondents. One of the major advantages of using professional participants from online panels is the ease of access and high participation rates. However, a key finding of the present research is that the differences in the motivational structures between professional and non-professional respondents may undermine the generalizability of samples drawn from such panels. Whether targeted incentives can be used to reduce this bias is an area for further research.
Supplemental Material
Supplemental Material - Comparing participation motives of professional and non-professional respondents
Supplemental Material for Comparing participation motives of professional and non-professional respondents by Henning Silber, Sven Stadtmüller and Alexandru Cerna in International Journal of Market Research
Footnotes
Declaration of Conflicting Interests
The author(s) declared no potential conflicts of interest with respect to the research, authorship, and/or publication of this article.
Funding
The author(s) received no financial support for the research, authorship, and/or publication of this article.
Supplemental Material
Supplemental material for this article is available online.
Note
References
Supplementary Material
Please find the following supplemental material available below.
For Open Access articles published under a Creative Commons License, all supplemental material carries the same license as the article it is associated with.
For non-Open Access articles published, all supplemental material carries a non-exclusive license, and permission requests for re-use of supplemental material or any part of supplemental material shall be sent directly to the copyright owner as specified in the copyright notice associated with the article.