
Abstract
Online panel research based on nonprobability sampling and recruitment methods constitutes the vast majority of global survey research. However, a deeper understanding of the factors motivating individuals to join such panels and participate consistently in surveys, as well as the barriers and inhibitors leading to attrition, is sorely needed. This is especially true because past knowledge on these aspects is almost entirely based on probability-based panels. Therefore, we used data from a nonprobability online panel that was managed by a regional academic institution, with no monetary incentives offered for questionnaire completion. Our research, focusing on panel attrition, strives to identify the prevailing motivations and barriers, while also examining the interplay between them, and is guided by established theories of survey participation such as Leverage-Salience Theory (LST), Cost-Benefit Theory (CBT), and Social Exchange Theory (SET). Using a mixed-methods design, we demonstrate that the most common motivations in this type of online panel are primarily related to panel engagement and are associated with a desire to contribute, such as assisting survey research. In contrast, several of the most important barriers, as reported by active panelists, are primarily related to questionnaire completion and largely involve criticism of questionnaires, such as suggestions for improving response options. Furthermore, our study reveals a relatively weak yet noteworthy association between specific groups of motivations and barriers, such as contribution-focused motivations and lack-of-understanding barriers. This suggests that addressing barriers could potentially lead to increased motivation to cooperate, a perspective not widely explored within the frameworks of CBT, SET, and LST. Additionally, we demonstrate how panelists can be effectively categorized into various motivations-barriers groups, each with somewhat different socio-demographic characteristics. The classification of panelists, which was successfully linked to questionnaire completion, opens opportunities for targeted interventions to mitigate panel attrition and potential representation biases within a panel context.
Keywords
Introduction
Nonprobability online panels, where the predominant mode of data collection is computer-assisted web interviewing (CAWI), account for the vast majority of worldwide survey research that is carried out today (ESOMAR, 2023), particularly in specific research domains such as commercial market research and social research. Such online panels or platforms, with Amazon Mechanical Turk, Prolific, Qualtrics, and Dynata as examples, are now being used more broadly, including by academic and other researchers (Peer et al., 2021). Nonprobability samples that collect survey data with CAWI questionnaires, including nonprobability online panels, offer two main advantages over most cross-sectional probability-based surveys and panels: cost- and time-efficiency. After the initial recruitment to a nonprobability panel, panelists are routinely and repeatedly invited to complete questionnaires, primarily via email (cf. Callegaro et al., 2014). However, panels recruited using probability methods have consistently been found to represent their intended target population more accurately than those recruited using nonprobability methods (e.g., Lavrakas et al., 2022; MacInnis et al., 2018; Szolnoki & Hoffmann, 2013; Yeager et al., 2011). This stems from nonprobability panels’ limitations in their external validity (generalizability) to their target population, as well as issues such as measurement issues, bot participants, and professional or bogus respondents (Baker et al., 2010; Kennedy et al., 2020).
Additionally, like essentially all forms of cross-sectional surveys today, online panels face challenges with extremely low cooperation rates (cf. Callegaro & DiSogra, 2008; Kocar & Kaczmirek, 2023) and differential nonresponse at the time participants are recruited, which can seriously impact cost, representation, and data quality (Baker et al., 2010). Additionally, all online panels experience panel attrition (cf. Lugtig, 2014). This manifests itself as an increase in cumulative unit nonresponse over time, in a particular panel wave/questionnaire or voluntary attrition when panelists opt-out and leave the panel entirely (Callegaro & DiSogra, 2008). These issues become even more problematic for panel survey accuracy when voluntary attrition is differential, meaning that panelists who are more likely to drop out differ nonrandomly from those who keep providing data on the topics being measured. 1 Furthermore, among those panelists who stay in the panel, there often are very different rates at which they complete the within-panel questionnaires to which they are invited (Lugtig, 2014). The combined differential attrition and questionnaire non-completion most often decreases a panel’s representativeness and accuracy over time.
Yet, there is a dearth of scholarly research on panel attrition in nonprobability online panels. Most of what is known about response in online panels comes from research on probability-based panels, and there are only a few studies that have explored attrition in nonprobability online panels. More specifically, little is known about the differences in motivations and barriers to completing within-panel questionnaires for different types of existing panel members, and how these differences can lead to (differential) nonresponse and permanent voluntary attrition. This study, which uses mixed-method data collected from a university-managed nonprobability online panel 2 , sheds light on these issues.
Past literature, knowledge gaps, and our research questions
The literature suggests that the most widely adopted theoretical frameworks to explain survey participation behaviour include social exchange theory (SET), cost-benefit theory (CBT), leverage-salience theory (LST), self-perception theory, cognitive dissonance theory, economic exchange theory, compliance heuristics, and the theory of planned behavior/reasoned action approach (Albaum & Smith, 2012; Keusch, 2015). These theories have been more commonly applied to explain survey participation in cross-sectional surveys, but less commonly panel attrition in probability-based online panels (e.g., Kocar & Lavrakas, 2023) and especially nonprobability online panels (e.g., Brosnan et al., 2021). Similarly, panel research literature that specifically focuses on motivations for and barriers against participation in online panels is much more limited compared to the body of work on cross-sectional surveys, especially for nonprobability panels. While studies such as those from Brosnan et al. (2021) and Brüggen et al. (2011) primarily focused on motivations to participate in nonprobability online panels, we believe in the importance and value of concurrently studying the motivations and barriers/ inhibitors of prospective and active panelists, specifically exploring the relationship between these factors as they operate within those panels. This is consistent with the main tenets of CBT (see Singer, 2011), which is one of the frameworks we hope to contribute to through our research. We provide further details on the knowledge gaps and the research rationale of our study in the subsequent sections.
Key theories of survey participation and associated knowledge gaps
The theories providing arguably the best foundations for explaining the relationship between motivations and barriers, and how they affect survey completion, are SET (Homans, 1961), LST (Groves et al., 2000), and CBT (Singer, 2011). The selected three frameworks are grounded on the premise that decision-making, including deciding to voluntarily complete a survey questionnaire, is based on at least a “quasi-rational” process that reaches a person-centred balance between negative aspects and positive aspects of an activity or interaction. The balance between motivations and barriers, compared to the optimal equilibrium between positive and negative attributes as outlined by LST, or even costs versus benefits as outlined by CBT and SET, should be regarded as crucial to the panel participation decision-making process. We provide more detail about the selected frameworks below
3
: • SET, as a framework that can clarify the decision-making process in various types of social interactions, is often used to explain the decision whether to participate in surveys (Goyder & Boyer, 2008). It explains the decision-making process with perceived costs and benefits, as well as the value of the rewards of activity or interaction (Homans, 1961). While costs can be represented as barriers, such as ‘time-consuming questionnaire completion’, benefits can be represented as motivations, such as ‘completing a questionnaire to have my voice heard’. Importantly, previous experience with participation in an activity, including the reaping of the rewards of the activity, can explain future activity or interaction (Homans, 1961), which can be an important aspect in case of longitudinal/panel survey data collection.
4
• LST recognizes the significant impact of various survey attributes on response/nonresponse decisions. The LST posits that each survey design attribute, such as the mode of contact, number of contacts, survey topic, sponsor, length of questionnaire, and use of incentives, holds a unique “weight” (of importance) related to a given individual’s decision to participate (or not) in a survey or a panel (Groves et al., 1992, 2000). The level of activation of this weight and its leverage on one’s decision depends on whether the attribute is held with a positive or a negative disposition and whether it becomes salient to the potential respondent at the decision-making time. In LST, survey attributes (such as monetary incentives/being motivated by getting paid) act as weights on a scale, delicately tipping the balance towards either an ultimate response or nonresponse decision (Groves et al., 2000).
5
• CBT resembles both SET and LST, while being predominantly focused on the argument that the benefits of survey participation should outweigh the perceived costs of participation for a potential respondent, which should be the objective of a data collector to achieve a positive outcome (i.e., participation in a survey). Rather than focusing on benefits or costs alone, CBT is rooted in rational choice models and argues that researchers should focus on the cost-benefit balance for a particular target group. Singer (2011) explained that compared to SET in a survey participation context, CBT places more emphasis on the costs of response for the respondent, and compared to LST, it focuses more on the need to make the benefits of panel membership questionnaire completion more salient to the respondent for a favourable cost-benefit balance, rather than attempting to change the perception of the costs and benefits.
While these theoretical frameworks provide a solid foundation for understanding survey participation in general, also by considering the balance between negative aspects and positive aspects of questionnaire completion, literature on such phenomena in online panels is sparse. Examples of such studies are those by Haensch et al. (2022) and Lavrakas and Kocar (2023), both of whom used open-ended questions and verbatims from panel members to generate quantitative data about why panelists joined and participated in their respective probability-based online panels, with the aim of identifying the most common motivational factors. Similarly, exploratory mixed-method approaches have been employed to classify members of nonprobability online panel samples into distinct motivational groups (see Brosnan et al., 2021; Brüggen et al., 2011). Additionally, Kocar and Lavrakas (2023) used qualitative methods to collect data on motivations and barriers from members of a probability-based online panel, with the investigation supported by social-psychological theories.
Our research on panel attrition builds upon the main findings of these studies, which also showed that motivations and barriers in a panel differ to some extent from those observed in cross-sectional surveys (also see Silber et al., 2023), and we aim to address the notable limitations of past research. Specifically, we seek to overcome the limited generalizability resulting from small qualitative samples and expand beyond motivations as the sole dimension studied in the participation-decision-making process (cf. Brüggen et al., 2011; Haensch et al., 2022; Kocar & Lavrakas, 2023).
Research rationale and research questions
Summary of motivations and barriers described in the existing literature.
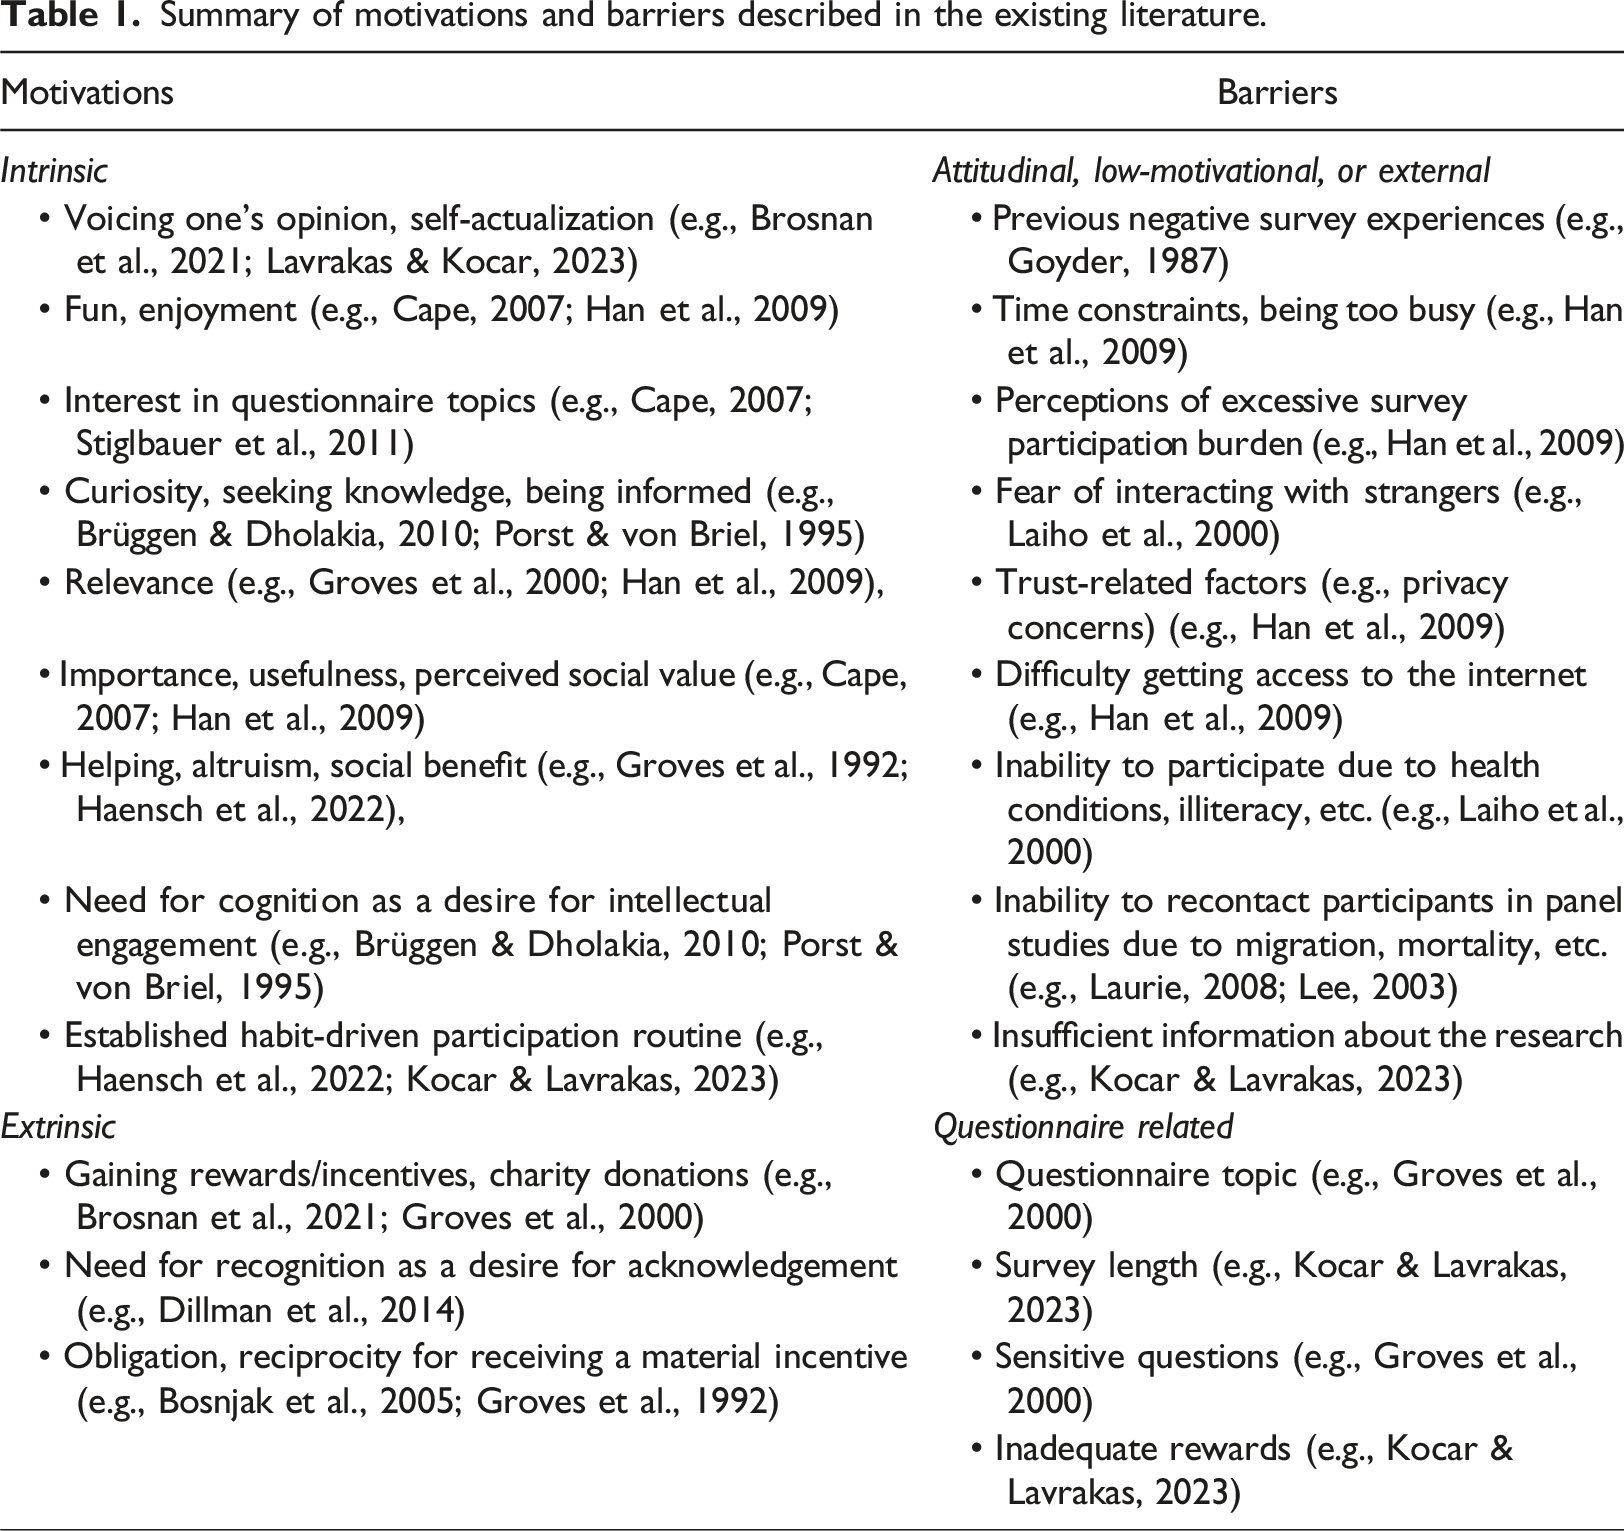
Moreover, previous research suggests that motivations can be classified into broader homogeneous groups. The most traditional distinction is between intrinsic versus extrinsic motivations 7 (Ryan & Deci, 2000). In contrast, Couper et al. (2008) and Singer (2011) introduced a distinct classification, which includes motivations associated with the characteristics of the survey (e.g., an interesting topic being studied), altruistic motivations (e.g., a desire to be helpful), and egoistic motivations (e.g., enjoying completing the questionnaire). This latter classification scheme resembles the classification of motivations to participate in an online panel used by Haensch et al. (2022), namely extrinsic, intrinsic, survey-related, and other motivations. In turn, Kocar and Lavrakas (2023) provided a more nuanced classification that centred on the primary aspect of panel participation motivation: contribution-focused (e.g., helping a project), survey-focused (e.g., enjoying surveys), self-expression-focused (e.g., self-actualisation by expressing one’s views), incentives-focused motivation (e.g., receiving rewards), and identification focused motivation (e.g., representing other people like themselves).
Having this background in mind, including that certain differences exist between cross-sectional and (nonprobability) panel respondents (Silber et al., 2023), we will address the following research question:
Research Question 1a (RQ1a). What are the key motivating factors encouraging questionnaire completion in a nonprobability online panel?
As an opposing force to motivations, barriers function as obstacles, inhibitors, or impediments that discourage or hinder individuals from participating in a survey (Groves et al., 2000). They can be specific to the nature of repeated data collection using the same sample of survey participants, as in the case of a panel. For example, moving away from one’s residence emerges as the predominant reason for unit nonresponse in longitudinal/birth cohort panels, alongside refusals and mortality (Laurie, 2008; Lee, 2003). In many online panels, which often collect data at least monthly, there are additional barriers. Kocar and Lavrakas (2023) identified a new range of probability-based panel-specific barriers not previously reported in the literature that may reduce participation at midterm stages or later stages in the panel lifecycle, including ‘insufficient information provided about the panel and its nature’ and ‘unwillingness to commit to panel participation’, as well as ‘major life changes’. They also proposed a new classification of barriers, encompassing attitudinal, external, questionnaire-related, low-motivational, and lack-of-knowledge. 8 Notably, these differences between barriers in cross-sectional surveys and panel surveys are substantial enough to warrant further investigation. Therefore, we will address the following research question:
Research Question 1b (RQ1b). What are the key inhibiting factors discouraging questionnaire completion in a nonprobability online panel?
Additionally, it is not only the balance but also the interplay between motivations and barriers that may be pivotal in mitigating panel attrition among active panelists, including those in nonprobability online panels. Several theories, including CBT, SET, and LST, touch on these factors as drivers of survey participation decision-making, without considering their interrelationship in detail. Therefore, to determine the interplay between motivations and barriers as indicators of positive and negative aspects of questionnaire completion (and panel attrition), we will address the following research question:
Research Question 2 (RQ2). What is the interrelationship between the main motivations and main barriers for/to nonprobability online panel survey completion?
Lastly, past research that was similarly based on survey participation theories has gathered self-reported motivations to classify participants into distinct groups. Brüggen et al. (2011) identified intrinsics, voicing assistants, and reward seekers, while Brosnan et al. (2021) identified mercenary respondents, decliners, and regular responders as similar profiles of online panelists. Unlike these studies, we will focus more on distinct self-reported barriers, in addition to motivations, when we provide evidence to address our final research question:
Research Question 3 (RQ3). What are the distinct psychographic profiles of nonprobability panel participants associated with both their motivations and barriers?
Addressing this research question is crucial, as such typologies could also offer insights into future within-panel questionnaire completion of active panelists. Additionally, certain socio-demographic differences, which can potentially be a source of differential attrition, might exist between the distinct typologies (see Brosnan et al., 2021).
Importantly, the evidence on the interrelationship between the main motivations and main barriers (RQ2), as well as on the psychographic profiles of active panelists and their response patterns (RQ3), will be presented with the aim to extend the existing theories of survey participation to the context of attrition in online panels.
Methods
Closed-ended and open-ended data
The data analyzed in this manuscript were obtained from The Tasmania Project (TTP) surveys, which involved collecting data from a university-based nonprobability self-admitted online panel. The TTP panel, managed by the Institute for Social Change (ISC) at the University of Tasmania (UTAS), was used to collect cross-sectional survey data 9 from a gradually recruited sample of adult Tasmanians. It was initially established in April 2020 to investigate the impacts of COVID-19 on various aspects of individual Tasmanians’ lives. By October 2023, there were 18 surveys conducted with the panel that also covered a wide range of other topics such as food security and diet, work and employment, housing, cost of living, migration, and community health (Institute for Social Change, 2021; 2022a).
The panel was built using nonprobability sampling methods starting in April 2020, with about 80% of panelists being recruited by the end of 2020. The recruitment methods employed a combination of approaches, primarily relying on self-selection, such as reacting to social media invitations and newspaper advertisements about joining. Additionally, convenience sampling was utilized by reaching out to mailing lists of UTAS staff and students, as well as clients from partner organizations. The techniques also included targeted Facebook ads aimed at specific Tasmanian demographic groups (purposive sampling) to raise the demographic heterogeneity of the panel and word-of-mouth snowball sampling (Institute for Social Change, 2021; 2022a). 10
TTP questionnaires including questions to investigate motivations and barriers.
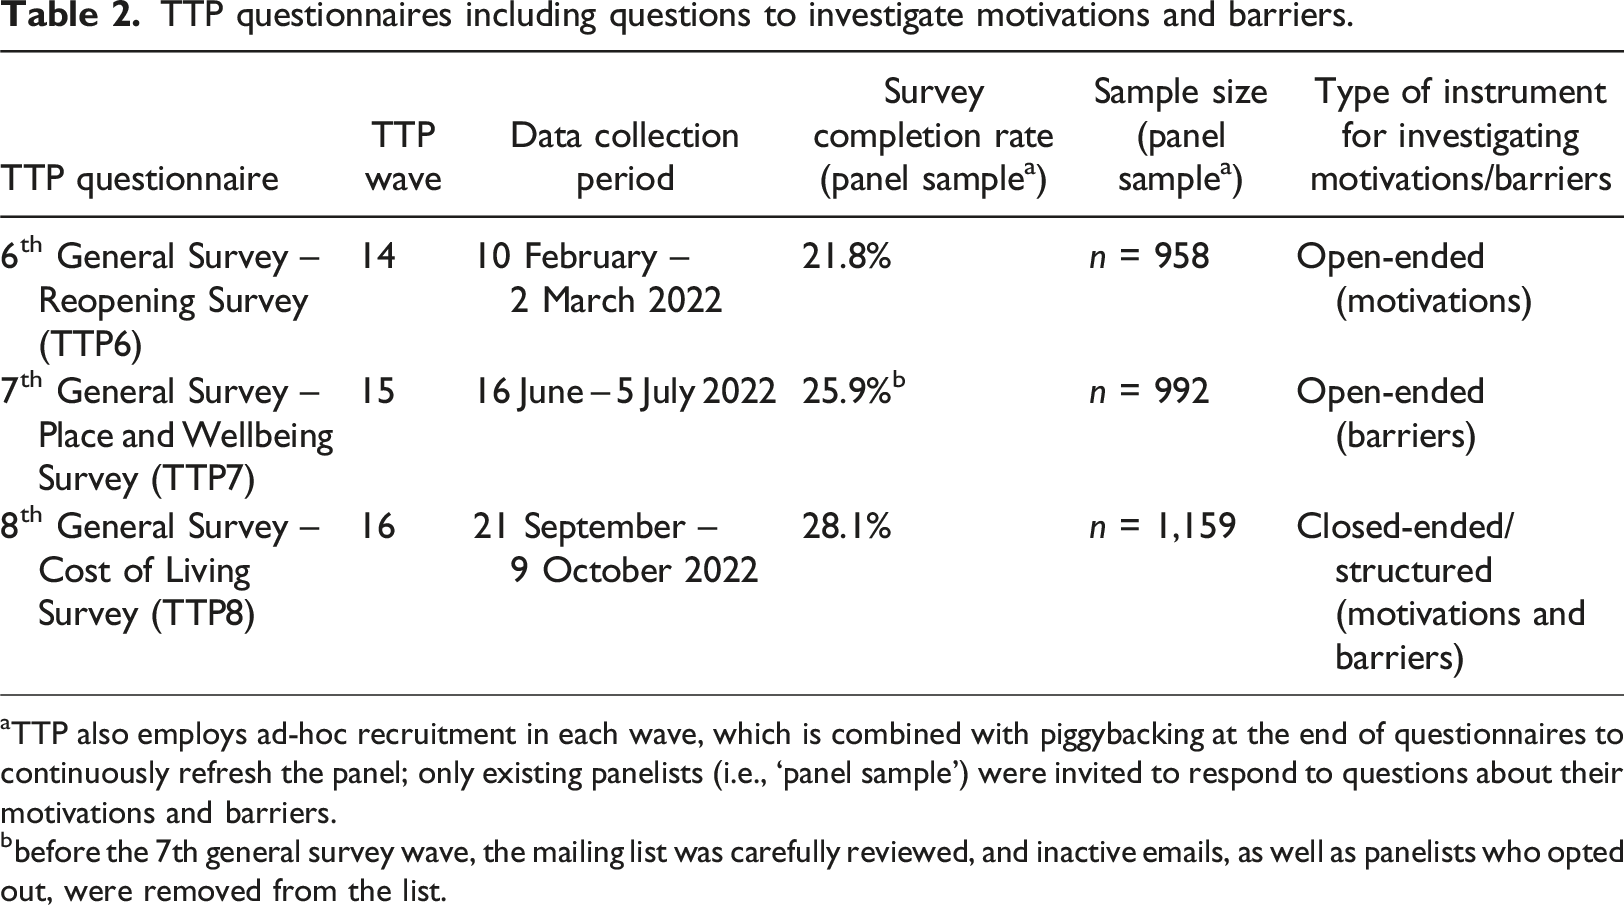
aTTP also employs ad-hoc recruitment in each wave, which is combined with piggybacking at the end of questionnaires to continuously refresh the panel; only existing panelists (i.e., ‘panel sample’) were invited to respond to questions about their motivations and barriers.
bbefore the 7th general survey wave, the mailing list was carefully reviewed, and inactive emails, as well as panelists who opted out, were removed from the list.
Additionally, we used panel participation history data from TTP wave 15 and two subsequent waves from 2023, namely TTP wave 17 (March-May 2023, ‘Wellbeing Consultation Survey’) and TTP wave 18 (August-September 2023, ‘Environment and Wellbeing Survey’). These questionnaire completion data were analyzed to investigate the association between the distinct profiles of panelists, identified using their self-reported motivations and barriers from wave 16 (TTP8), and their questionnaire completion around the time their psychographic profiles were created. 12
Development of structured instrument and analytic approaches
Open-ended survey questions
Characteristics of the collection of open-ended data.
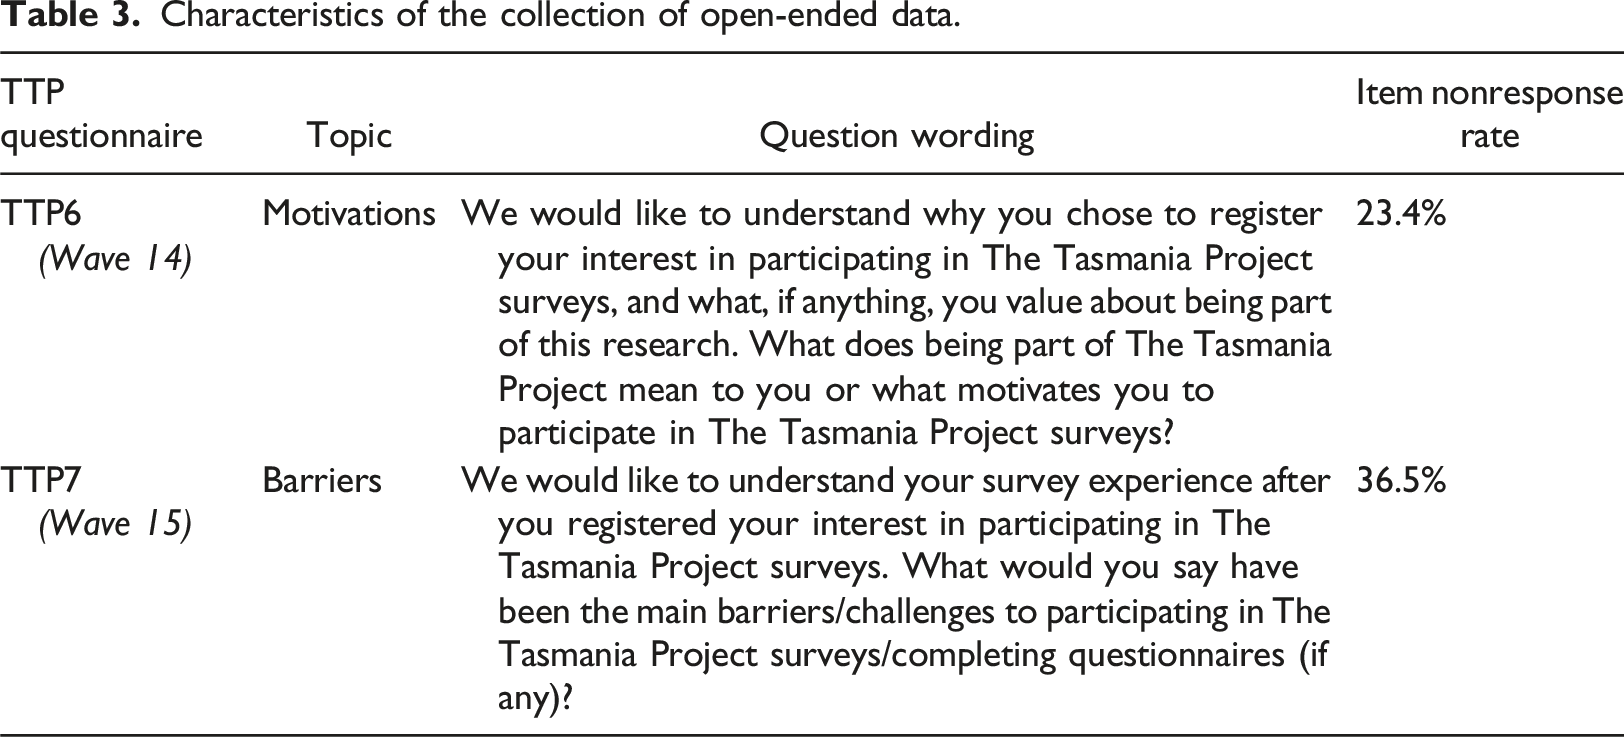
In the next stage, prior to TTP8 questionnaire and question design, the answers to the open-ended questions (also known as “verbatims”) were thematically coded. The first author of this manuscript coded all verbatims and as many as three codes were assigned to each verbatim to identify the most common motivations and the most common barriers reported by the entire sample. The second author coded a sizable random portion of all verbatims as a quality control check. The inter-rater reliability analysis showed that the agreement between the two coders was substantial for barriers (Cohen’s Kappa = 0.708) and moderate for motivations (Cohen’s Kappa = 0.534) (see Landis & Koch, 1977). Importantly, the differences in coding between the coders did not lead to identification of distinct items for the subsequent quantitative data collection and analysis. 14
The most frequently reported motivations included (i) sharing views/opinions to make a difference/influence change, (ii) self-actualization/allows my voice to be heard, and (iii) contributing to the survey/study/research/science. 15 A large proportion of TTP7 participants provided a valid answer but reported no barriers (more than 1/3 of respondents). Among those who mentioned one or more barrier, the largest proportion listed: (i) being busy/lack of time, (ii) issues with survey question - wording, and (iii) issues with survey question - design. Finally, we utilized the codes to prepare a structured closed-ended question sequence used in TTP8 by focusing on the motivational factors and barriers that were mentioned by the largest proportions of respondents.
Structured closed-ended instrument
To quantitatively investigate motivations for and barriers against questionnaire completion in online panels in TTP8, we developed a structured instrument consisting of clear and concise statements that were carefully constructed to strike a balance between parsimony and capturing the complexity of codes. Participants were asked to rate these statements on a 11-point end-anchored scale ranging from 0 (“strongly disagree”) to 10 (“strongly agree”). To prevent unnecessary lengthening of the already extensive TTP8 questionnaire, which covered other topics such as cost of living, wellbeing, food security, and diet, we limited the total number of statements to 20; 10 about possible motivations and 10 about possible barriers/inhibitors. Randomization of the order of items was employed within these grid items to minimize the impact of question-order effects.
The 10 statements that were about motivations to join and stay active were derived from the list of the most common motivational factors identified in TTP6. For instance, to address the self-actualization aspect and the desire for one’s voice to be heard, we formulated the following statement: “I participate in The Tasmania Project surveys for my voice to be heard”. Besides, the statements that were about barriers/inhibitors to not participate were derived based on the evidence from TTP7. For example, to tackle the self-reported concerns about limited response choices, we created the following statement: “Questions from The Tasmania Project surveys would benefit from a wider range of answer options”. In addition to the nine most common barriers identified in TTP7, we included a statement on incentives/rewards.
16
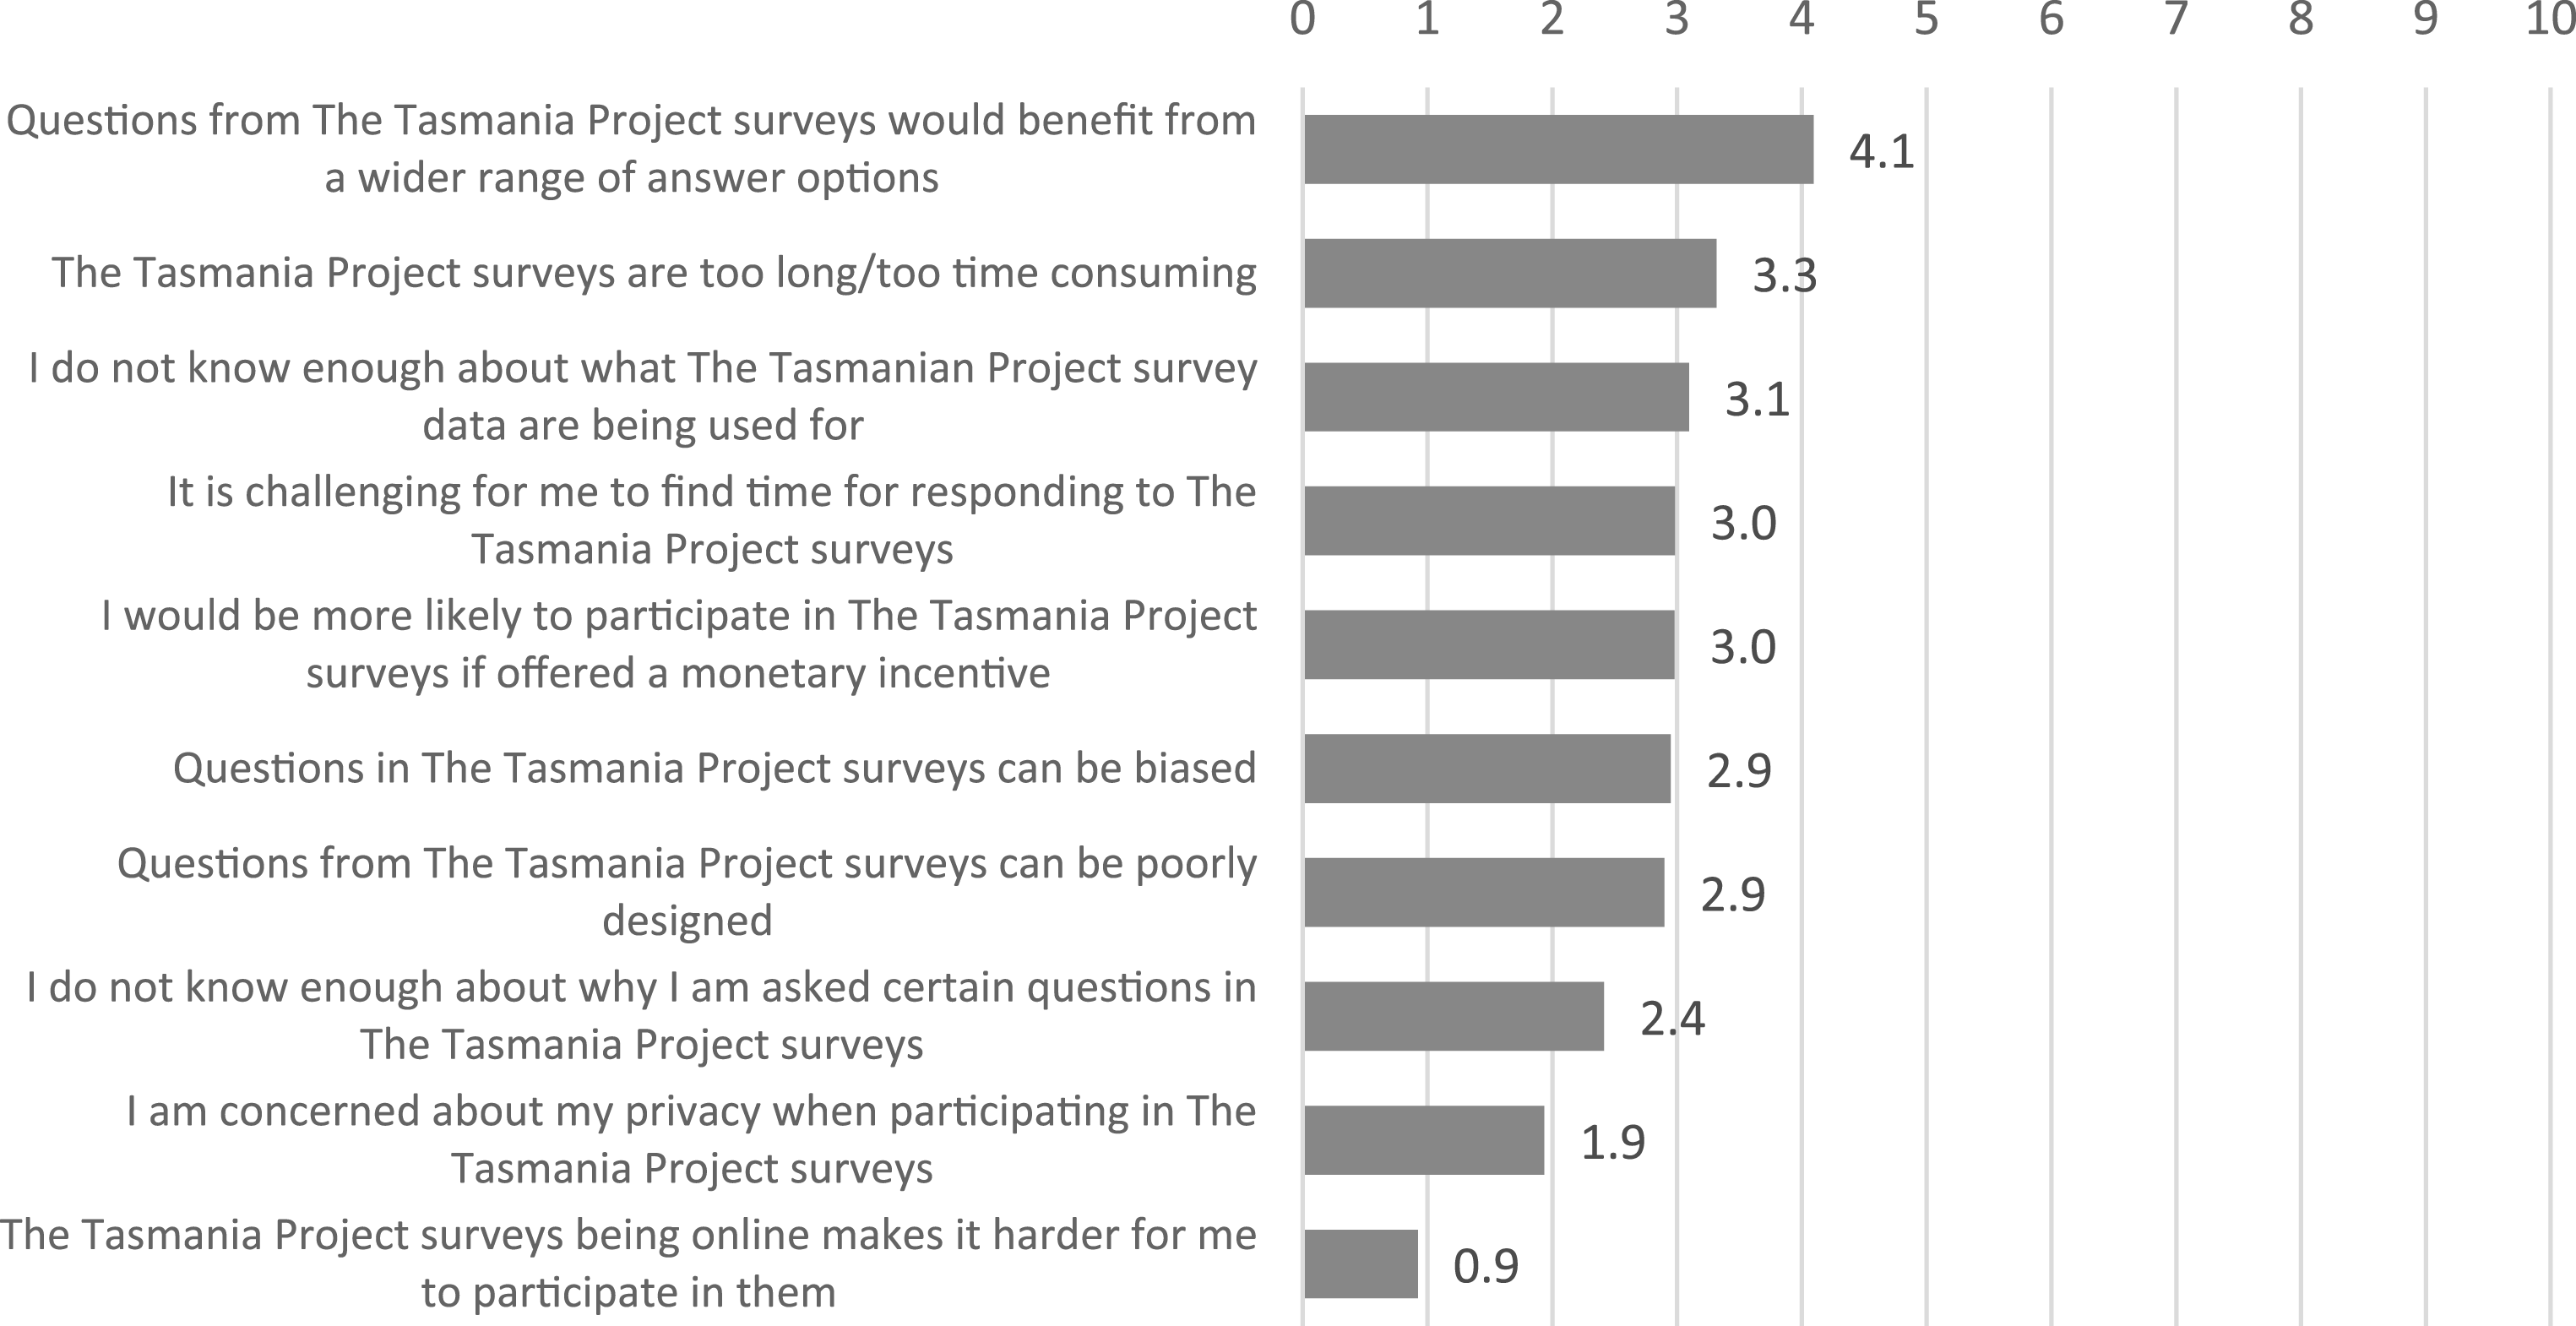
The wordings of the 20 Likert items are shown in Figures 1 and 2, as well as in Appendix A. Motivational factors, TTP8 (n = 1,101), mean scores on an 11-point scale (ranging from 0 = “strongly disagree” and 10 = “strongly agree”) for why a panelist participates in the TTP panel. Barriers/inhibitors, TTP8 (n = 1,085), mean scores on an 11-point scale (ranging from 0 = “strongly disagree” and 10 = “strongly agree”) for why a panelist reportedly might not participate in the TTP.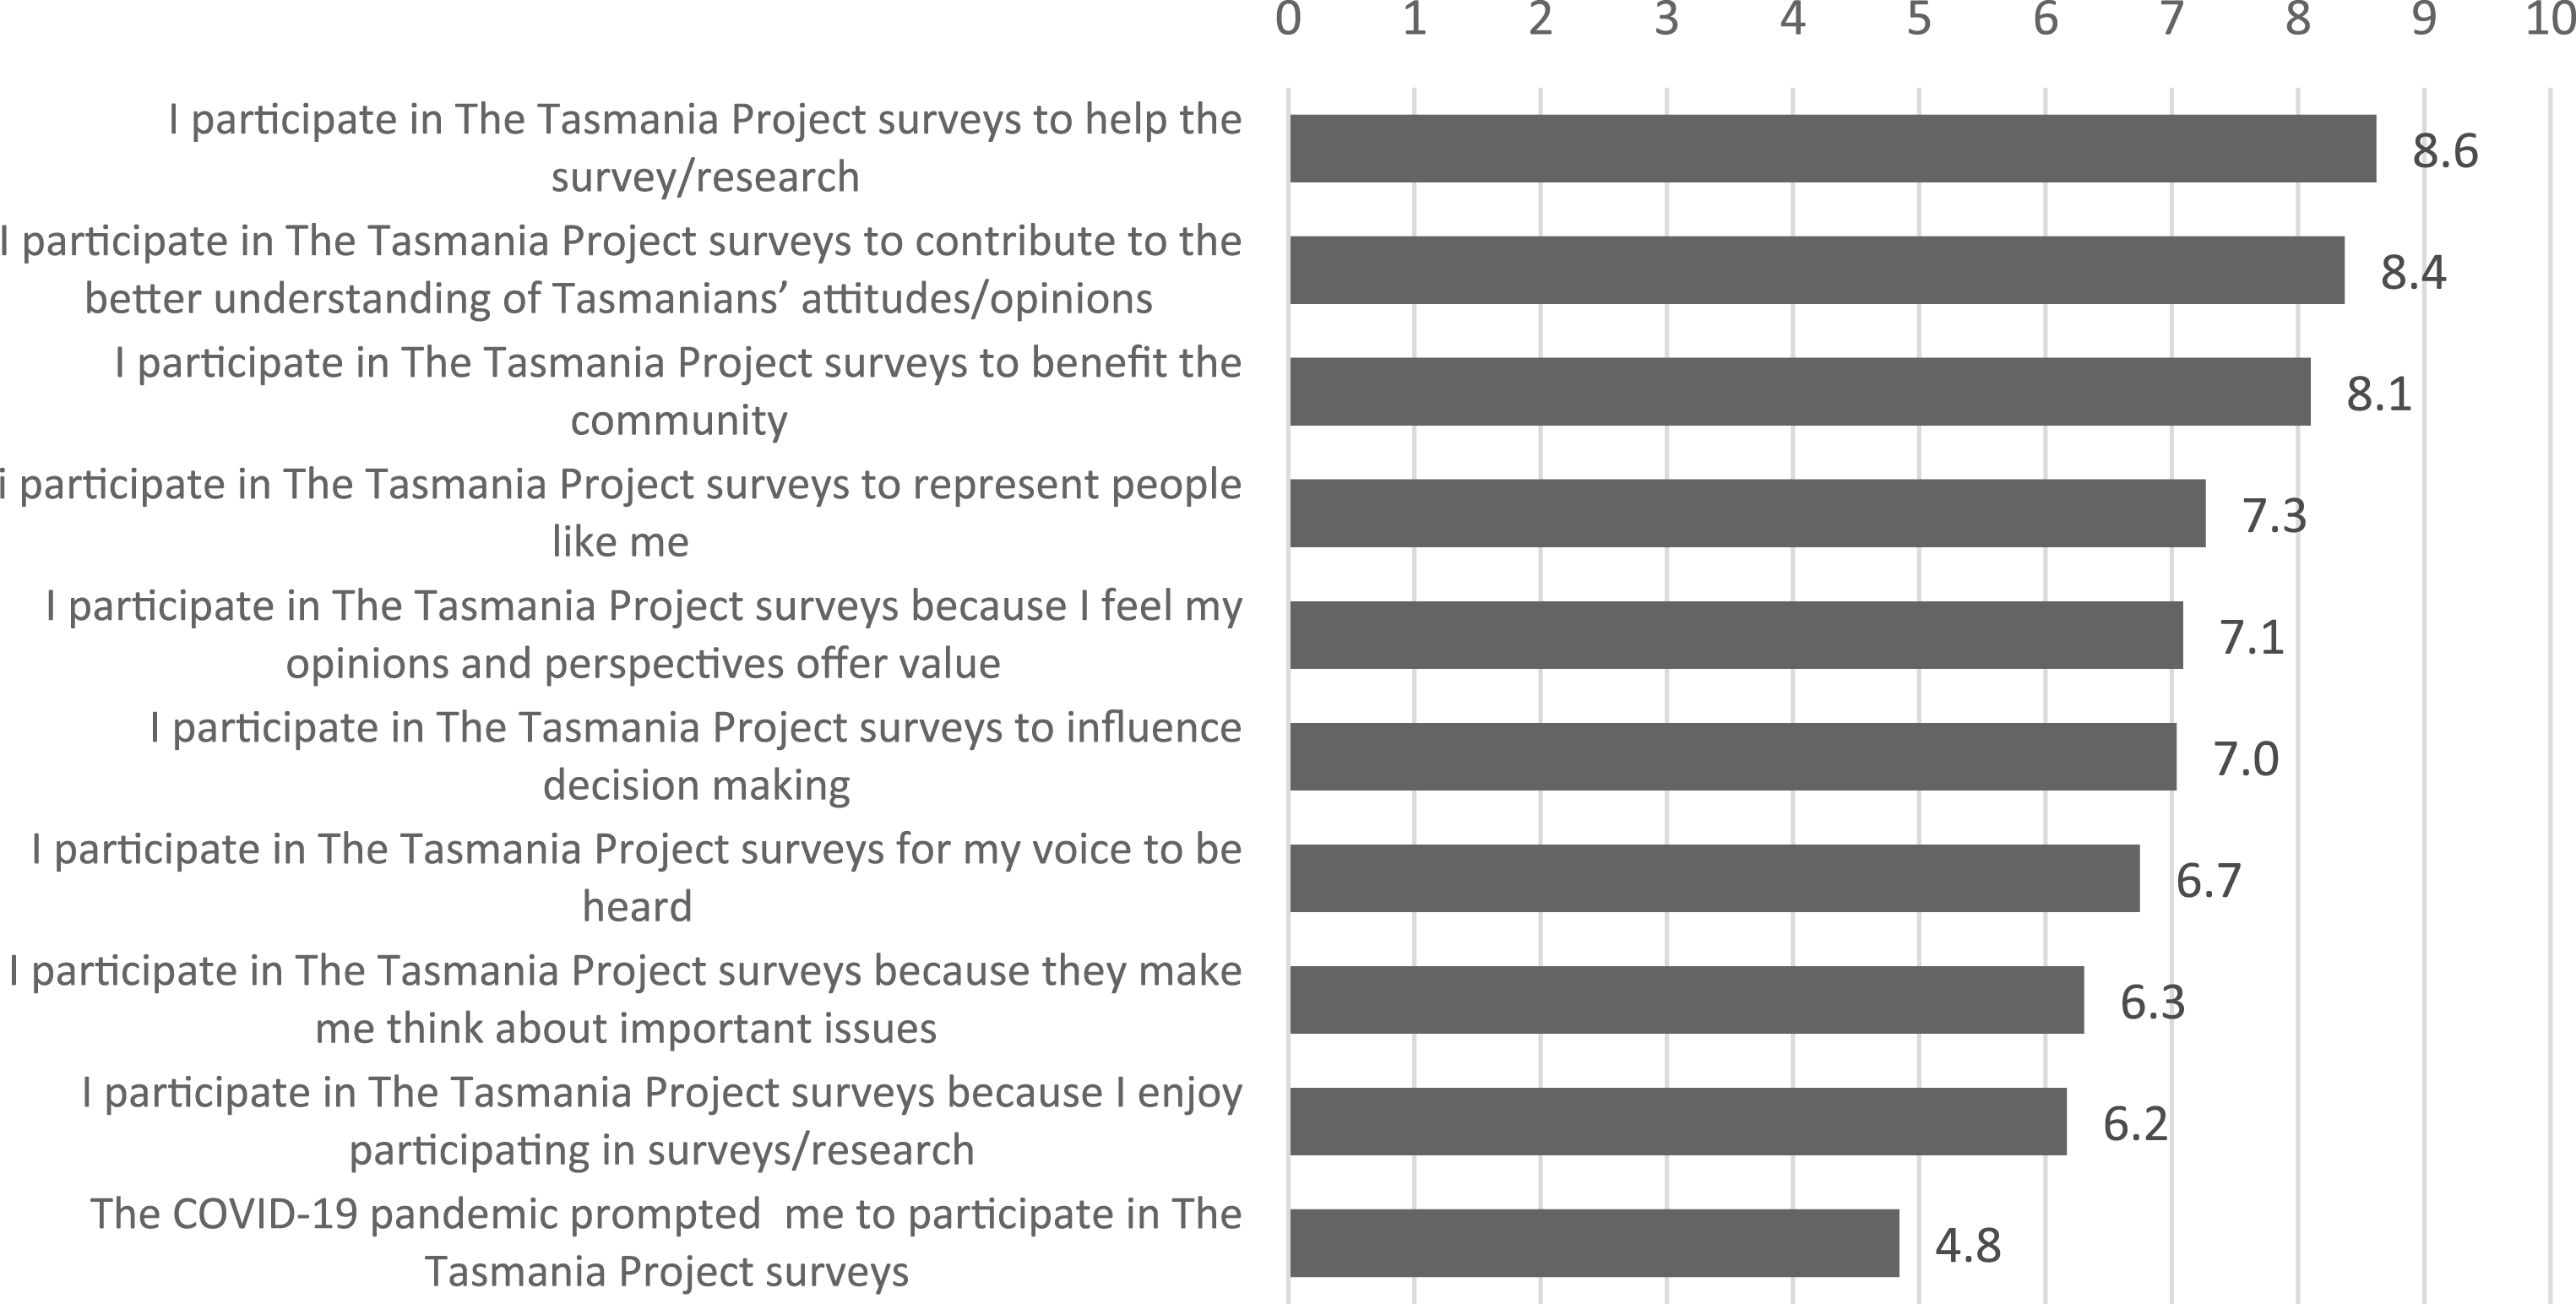
Statistical analysis
Using a structured instrument in the TTP8 questionnaire provided us with opportunities to employ a range of statistical methods and techniques for deriving insights from the closed-ended survey data. All statistical analyses were carried out with SPSS 29.0 software package. In addition to presenting descriptive statistics for the most common motivational factors and barriers (to address RQ1a and RQ1b), we carried out exploratory factor analysis (EFA) to create internally homogenous factors as linear combinations of individual items measuring motivations/barriers, as well as conducted correlational analysis (Spearman’s rank correlation coefficient, rho 17 ) to assess the association between broad motivations and barriers (to address RQ2).
We employed the Maximum Likelihood method with Varimax rotation with Kaiser Normalization to extract factors. To determine the ideal number of factors for motivations and barriers (i.e., two separate factor models), we assessed the following criteria: eigenvalues, scree plot, the proportion of variance explained by factors, and alignment with the underlying theory. We removed from the analysis the units for which we identified non-differentiation/straightlining as a form of satisficing (see Krosnick, 1991). In other words, those respondents who provided the same answer to all 10 items in a matrix/grid for either motivations (n = 48) or barriers (n = 84), were excluded from all further analysis. Importantly, the results were more consistent with the underlying theory after the data from “straightliners” were eliminated. 18
Furthermore, we utilized cluster analysis to identify distinct profiles of panelists based on their broad motivations and barriers as factors (to address RQ3). Notably, we employed k-means cluster analysis and compared the motivational-barrier characteristics of between two and eight panelist profiles. To identify the optimal number of clusters, we examined silhouette coefficients and within cluster sums of squares (WSS) as measures for evaluating the quality and distinctiveness of the identified groups. To identify any composition differences between the identified profiles of panelists, we conducted logistic regression analysis with cluster membership as the outcome variable and a range of socio-demographic 19 variables as predictors. We used the Wald tests for statistical testing of differences. The questionnaire completion analysis to identify any differences between the identified groups consisted of ANOVA and Chi-Square testing.
Results
In this section, our investigation using TTP8 closed-ended data focuses on addressing the research questions related to motivations and barriers/inhibitors related to survey wave completion in a nonprobability online panel.
Motivations and barriers
Motivations
The results presented in Figure 1, with the motivations ordered by importance, address RQ1a by showing that the most prevalent reasons for participating in TTP surveys are intrinsic and contribution-focused. Specifically, participants are motivated to help the survey/research, contribute to a better understanding of attitudes and opinions, and benefit the community. These are followed by self-expression-focused motivations, which are also intrinsic in nature, such as representing people like them, feeling that their opinions and perspectives offer value, and having their voice heard. Survey-focused motivations, including because surveys make them think and because they enjoy participating in surveys/research, held slightly lower importance.
Barriers
In contrast, the results presented in Figure 2 (addressing RQ1b), with the barriers/inhibitors ordered by importance (i.e., mean scores), show that the most prevalent barriers tend to be questionnaire-related. These include the perception that questions would benefit from a wider range of answer options, and that they can be biased or poorly designed. Other notable barriers are associated with respondent burden (e.g., surveys being too long or time-consuming) and a lack of information provided (e.g., not knowing what the data are being used for). While the absence of monetary incentives is also identified as a moderate barrier, privacy concerns and online data collection were not identified as notable barriers.
Upon comparing the mean scores for motivations with those for barriers/inhibitors, it becomes evident that TTP8 survey participants, on average, reported significantly higher levels of agreement regarding their motivations compared to the levels of agreement towards the barriers. This finding on the unbalanced equilibrium aligns with the theories of survey participation, which posit that the benefits of participating should outweigh the costs for panelists to complete a questionnaire.
Association between motivations and barriers
To address RQ2 about the relationship between motivations and barries in the TTP panel, we conducted correlational analysis. Notably, the univariate findings presented earlier suggest that specific sets of motivations and barriers, such as contribution-focused motivations, may be closely interconnected due to their comparable significance for panelists. For that reason, as well as for the ease of presenting and interpreting bivariate results, we conducted factor analysis to identify broader groups of motivations (cf. Brüggen et al., 2011; Haensch et al., 2022) and broader groups of barriers (c.f. Kocar & Lavrakas, 2023). The factor analysis results are presented in Table A1 (motivations) and Table A2 (barriers/inhibitors) in Appendix A.
The data identified the following factors from two EFA models which were largely aligned with theoretical expectations: • Motivations: ⁃ Self-expression-focused motivations (or intrinsic-self) ⁃ Contribution-focused motivations (or intrinsic-others) ⁃ Survey-focused motivations (or intrinsic-self) • Barriers/inhibitors: ⁃ Questionnaire-related barriers ⁃ Lack-of-understanding barriers ⁃ Time-burden-related barriers
20
The naming of the factors was predominantly based on the range of individual motivations and barries with larger factor loadings (>0.6), while considering existing classifications (Brüggen et al., 2011; Kocar & Lavrakas, 2023). It is worth noting that the least important motivational factor, i.e., COVID-19-related motivation, and the least important barriers, i.e., privacy concerns and online participation, had small factor loadings (<0.4), which are not displayed in Tables A1 and A2.
The results show that, for motivations, the most variability is accounted by self-expression-focused motivations (21.94%), while the three extracted barrier factors explain similar proportions of variance after Varimax rotation with Kaiser Normalisation. In the next step, we extracted the three broad motivational factors and the three broad barriers factors, and created new factor scores for the six measures, to use them in bivariate correlational analysis to determine how these motivations and barriers are associated in practice.
Associations between broad motivations and broad barriers, Spearman’s rho (n = 964 22 ).
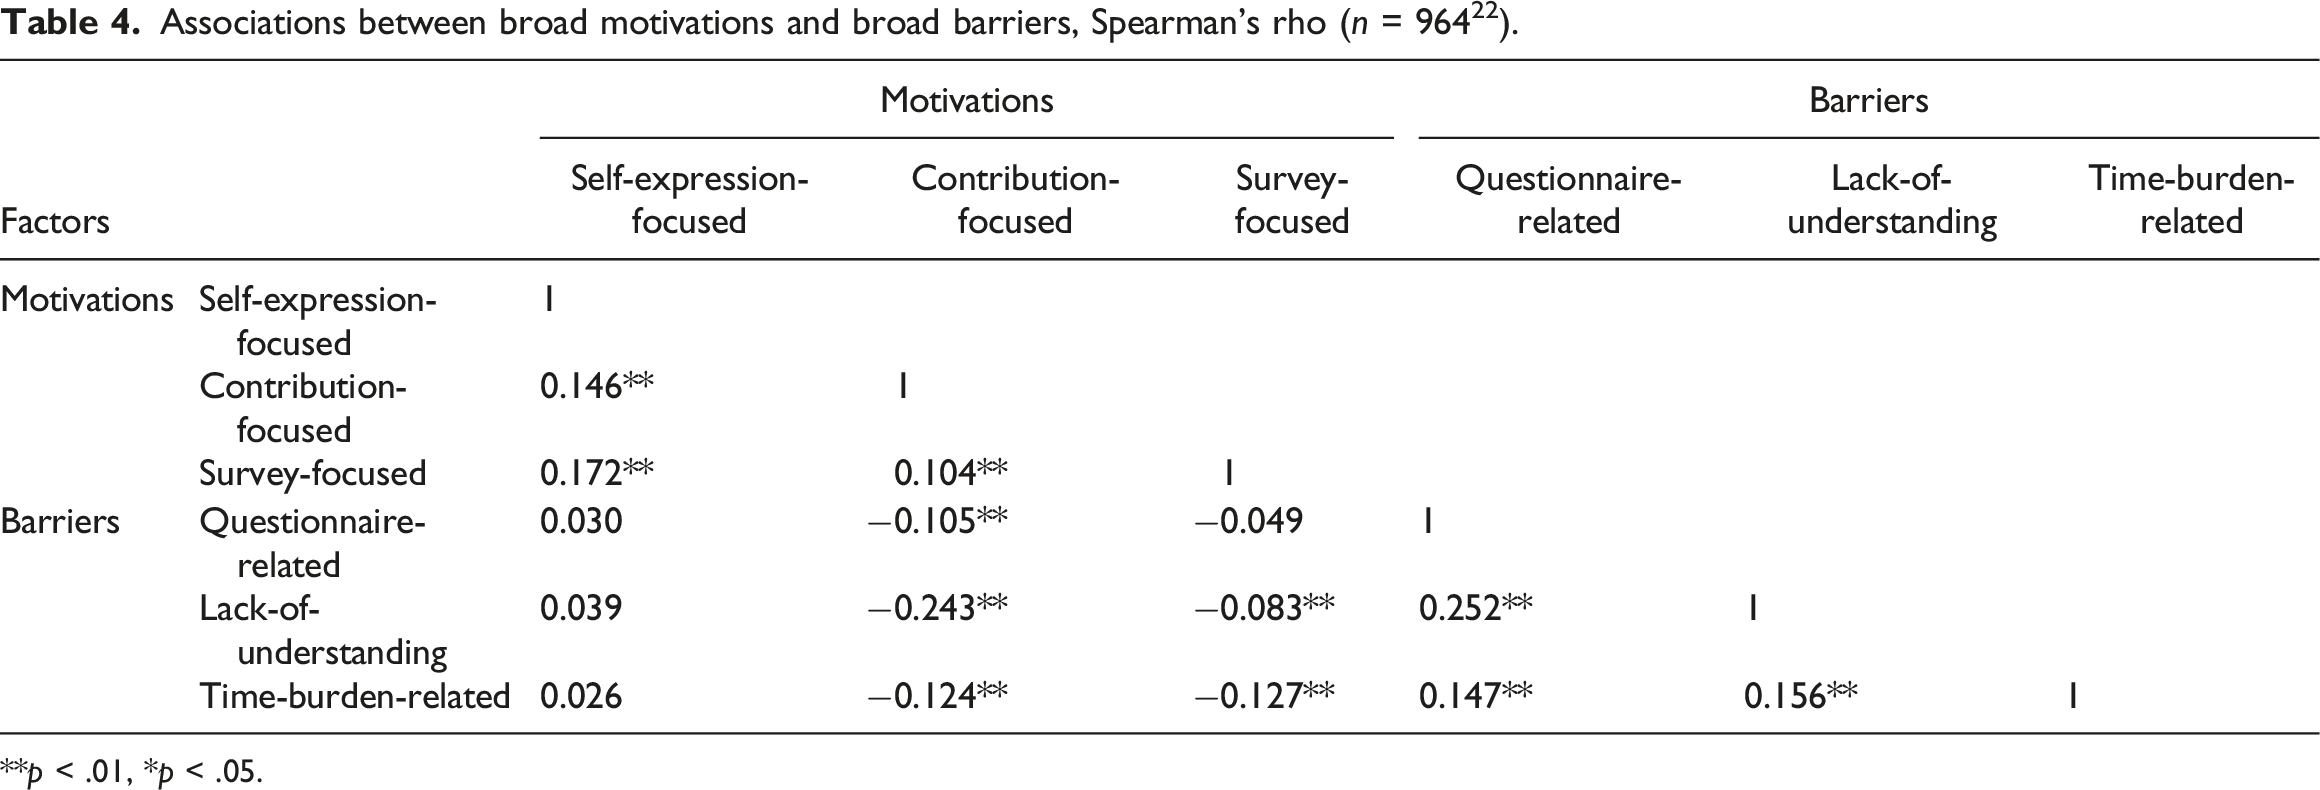
**p < .01, *p < .05.
Secondly, the results reveal no significant associations between specific motivations and barriers, while indicating weak negative associations between others. Self-expression-focused motivations are not associated with any of the broad barriers, nor are survey-focused motivations and questionnaire-related barriers. However, contribution-focused motivations (or intrinsic-others if using the classification from Brüggen et al., 2011) are negatively associated with all three broad barriers. The strongest association, though still relatively weak, is a negative association between contribution-focused motivations and lack-of-understanding barriers (rho = −0.243). This indicates that respondents with a better understanding of the survey’s purpose and questions are more likely to report being motivated by the opportunity to contribute, and vice versa. The other statistically significant negative associations are between time-burden-related barriers and contribution-focused motivations (rho = −0.124) and survey-focused motivations (rho = −0.127). These results suggest that respondents who are more likely to report being motivated by surveys, and/or contributing to a good cause, are less likely to report the time burden as a barrier. In summary, the results indicate that while certain relationships between motivations and barriers exist, they are, at best, weak.
Profiles of panelists based on their motivations and barriers
To address RQ3 about the distinct profiles of nonprobability online panel participants, we present the results of the cluster analysis. Importantly, the broad motivational factors and the broad barriers were entered into the cluster model as standardized (i.e., z-score normalized) variables with a mean of 0 and a standard deviation of 1. Thus, a group with a cluster centroid at the value of 1 is, on average, at one standard deviation from the mean for a variable (see Figure 3, as well as Table B2 in Appendix B). Radar chart of clusters by broad motivations/barriers (centroids).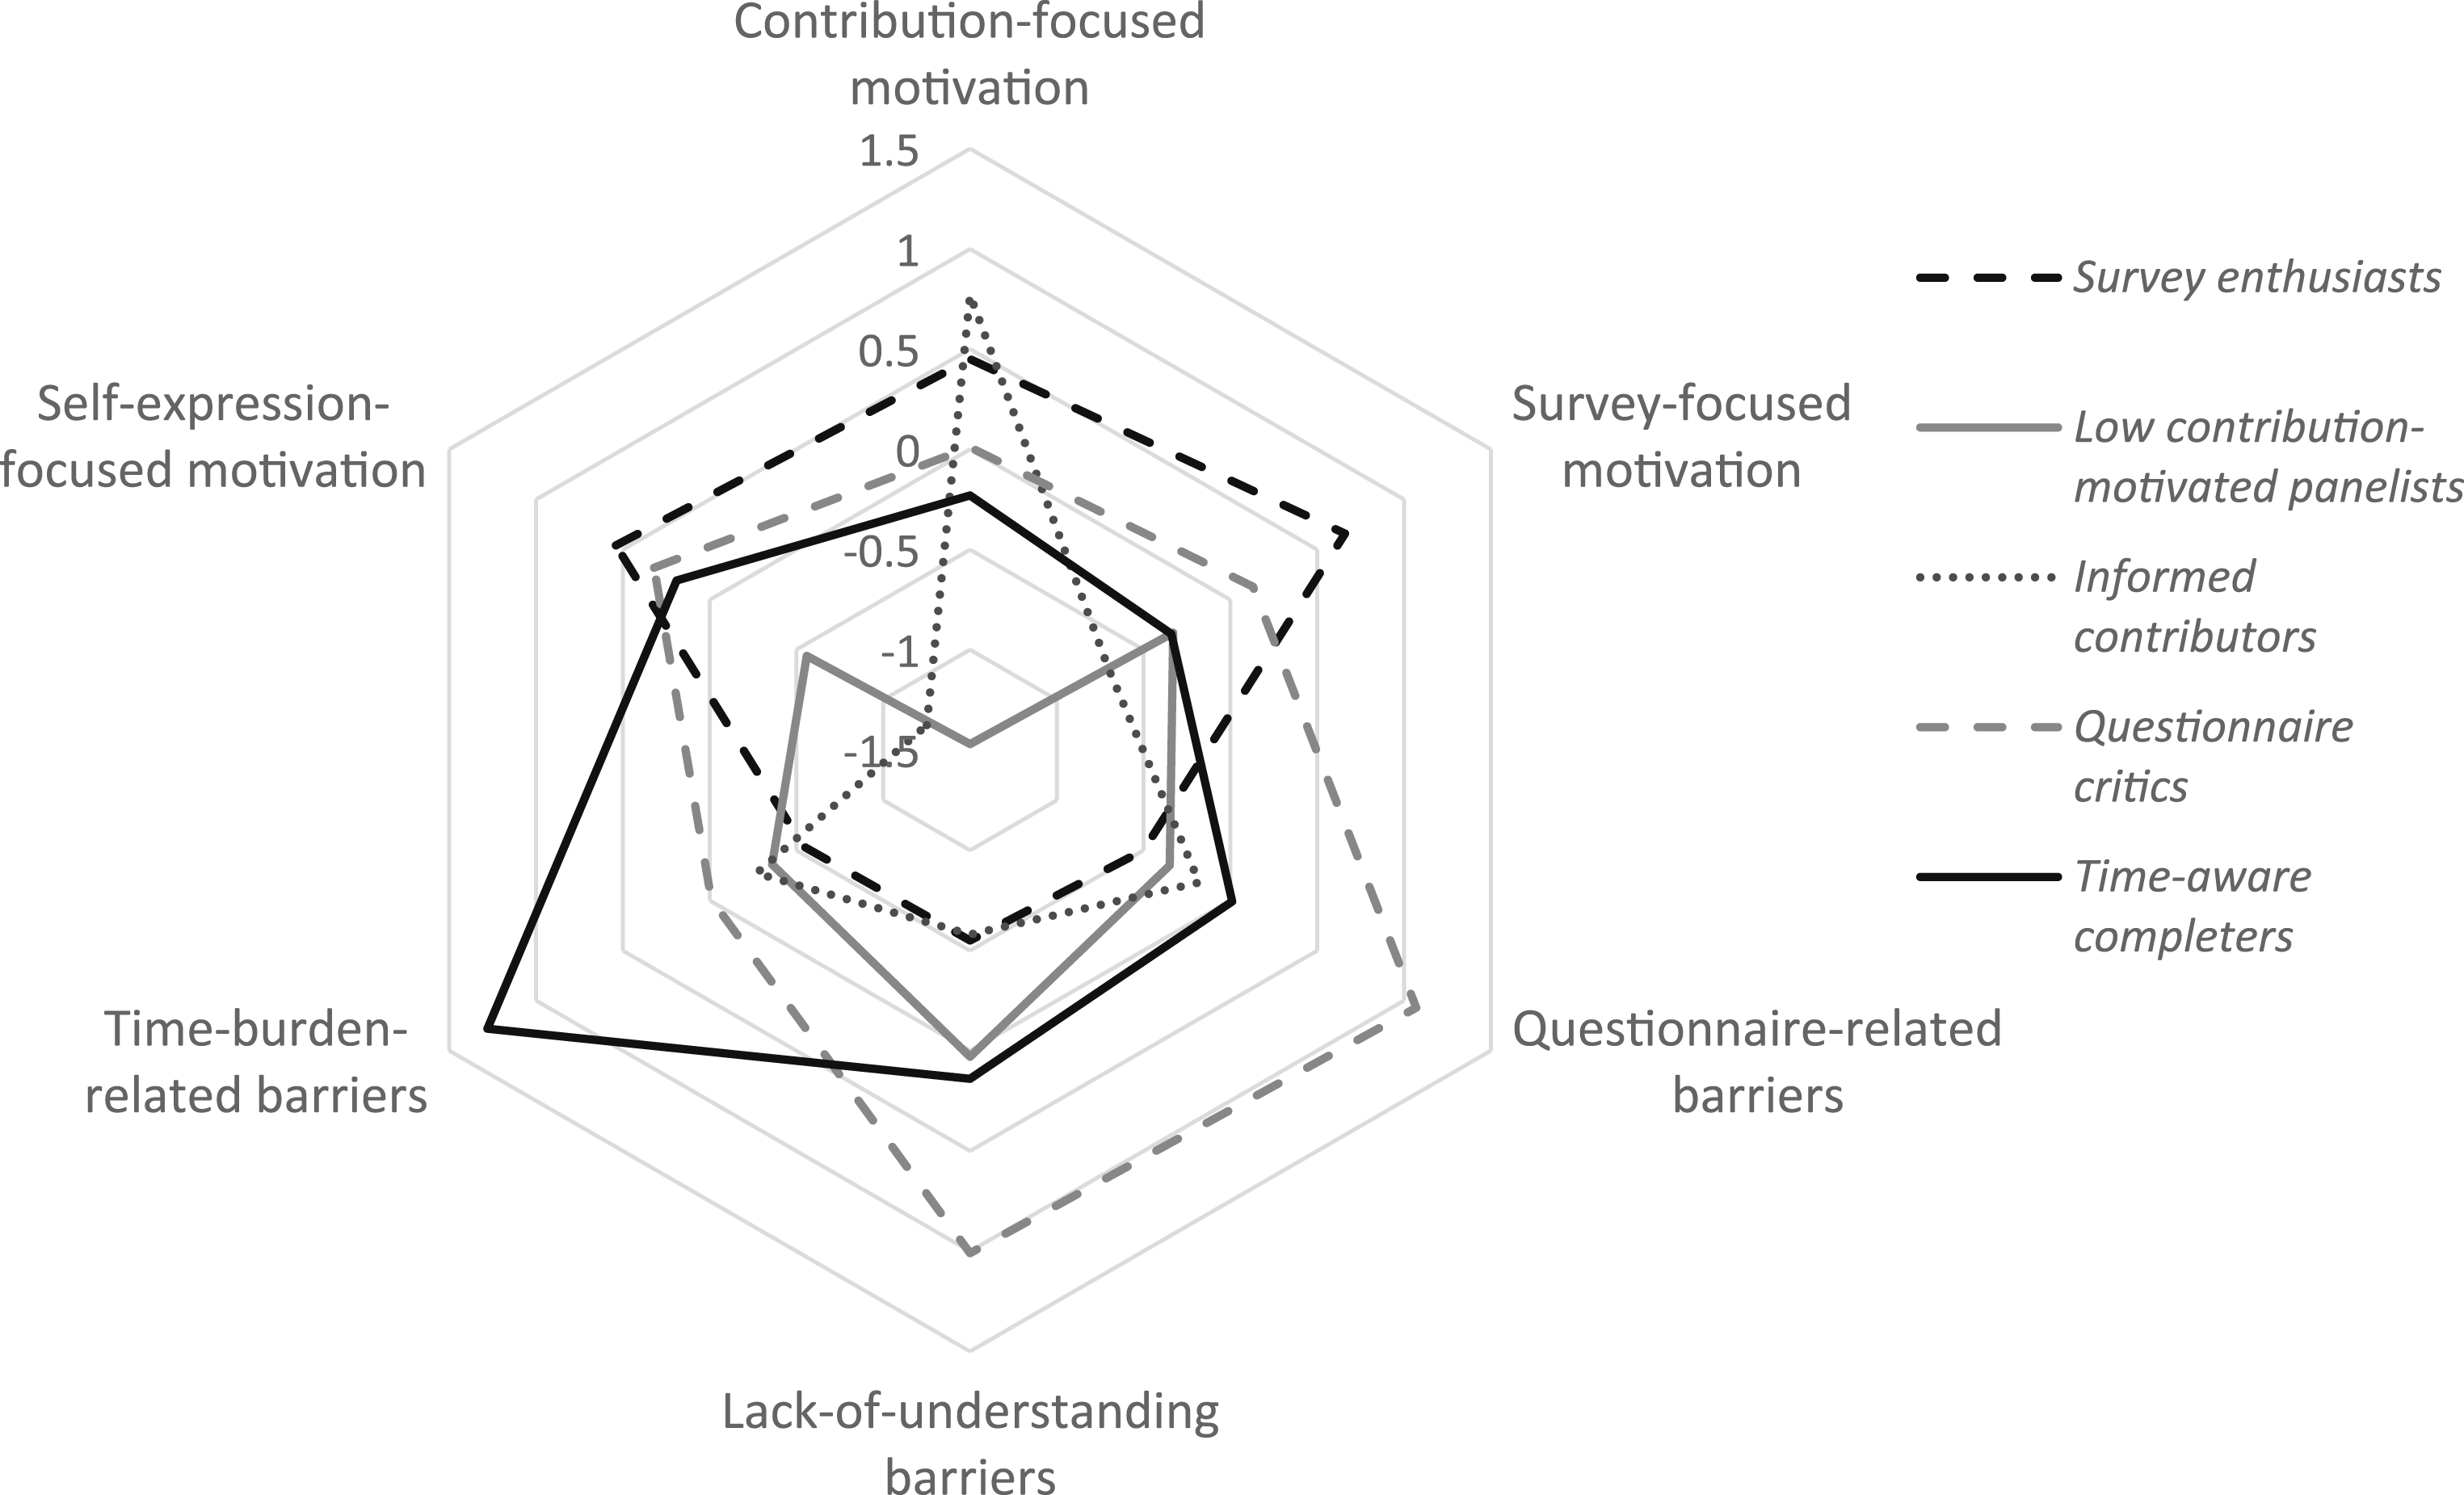
Results of cluster analysis
To determine the optimal number of clusters, we applied the “elbow method” (Thorndike, 1953) utilizing the within-cluster sum of squares (WSS), along with silhouette coefficients computed at the sample level across various k-means cluster solutions. As demonstrated in Figure B1 in Appendix B, the search for the ideal number of clusters does not yield a clear-cut solution, and the silhouette coefficients show that inter-group differentiation remains modest across the considered solutions. Importantly, the reduction in WSS gains a more gradual pace when moving from four to five clusters, while mean silhouette coefficients exhibit considerable consistency among solutions with three, four, and five clusters before showing a marginal decline. Following ANOVA analysis with Games-Howell post hoc tests (Games & Howell, 1976) to assess the statistical significance of differences in motivations and barriers between the clusters, we ultimately opted for a five-cluster solution. Notably, this classification of panelists also aligns well with existing categorizations of motivations 23 and barriers, as well as with LST, CBT and SET.
Profiles of panelists
The final five groups of TTP panelists, ranked by their homogeneity level, as measured with mean group silhouette coefficients, are presented below (in Appendices, see Table B2 for ANOVA testing and Table D1 in Appendix D for socio-demographic differences): (1) Survey enthusiasts (28.1% of the sample): this group has the largest average centroid values for motivations and the smallest average cluster centroid values for barriers (see Figure 3), and it is the most homogeneous group of all five. Additional logistic regression analysis, which included 11 socio-demographic predictors (see footnote 19), revealed that survey enthusiasts are less likely to be male, from Southeastern Tasmania
24
, and those living in less traditional household types, including multi-generational family households and non-related adults sharing house. (2) Low contribution-motivated panelists (15.0%): this group is quite average in terms of the barriers, but it has the smallest average centroid values for motivations. It specifically stands out as the group with by far the smallest contribution-focused motivations centroid value. Low contribution-motivated panelists are more likely to be persons living alone, and less likely to be widowed or respondents who reported having disability, but not other socio-demographic differences were observed. (3) Informed contributors (15.1%): this group appears to be the opposite of low contribution-motivated panelists. It has the highest centroid value for contribution-focused motivations of all groups and the smallest centroid value for lack-of-understanding barriers. We previously demonstrated the negative correlation between these two variables. Informed contributors appear to be entirely focused on contributing to a good cause, but compared to the other groups, they are much less motivated by the opportunity for self-expression and the survey. The group consist of a higher proportion of individuals with the highest level of education (university degree or more), with no further differences. (4) Questionnaire critics (21.4%): this group of panelists reported relatively average levels for motivations and above-average levels of barriers. Specifically, they stand out as the group with the largest centroid values for questionnaire-related barriers and lack-of-understanding barriers. In contrast to survey enthusiasts, this group is more likely to be from the Southeastern Tasmania and to reside in less traditional household types. (5) Time-aware completers (20.3%): this group, which appears to be the least homogeneous, is average for five out of the six variables in the model. In a four-cluster solution, time-aware completers largely belong to the same group as questionnaire critics. However, in contrast to the other high-barrier group, they reported high levels of time-burden-related barriers. This group is more likely to consist of males and employed individuals (compared to retirees).
The radar chart in Figure 3 displays the centroids for each of the six key variables used to cluster respondents. The values on each axis represent standard deviation values, indicating that a group centroid at a value of 1.5 is one and a half standard deviations higher than the mean for a variable, while a group centroid at a value of −1.5 is one and a half standard deviations lower than the mean for a variable. The centroids for each group are connected with lines to distinguish among them. We observe that Survey enthusiasts have the highest centroid values for self-expression motivation (approximately 0.5 standard deviations higher than the mean) and survey-focused motivation (about 0.7 standard deviations higher than the mean). In contrast, we can confirm the earlier observation that Questionnaire critics have the highest values for lack of understanding and questionnaire-related barriers (slightly above 1 standard deviation higher than the mean). Additionally, the lowest value for all groups and variables is observed for contribution-focused motivation for Low contribution-motivated panelists (approximately −1.5 standard deviations compared to the mean). For more details, refer to Table B2 in Appendix B.
Panel participation patterns of identified psychographic profiles
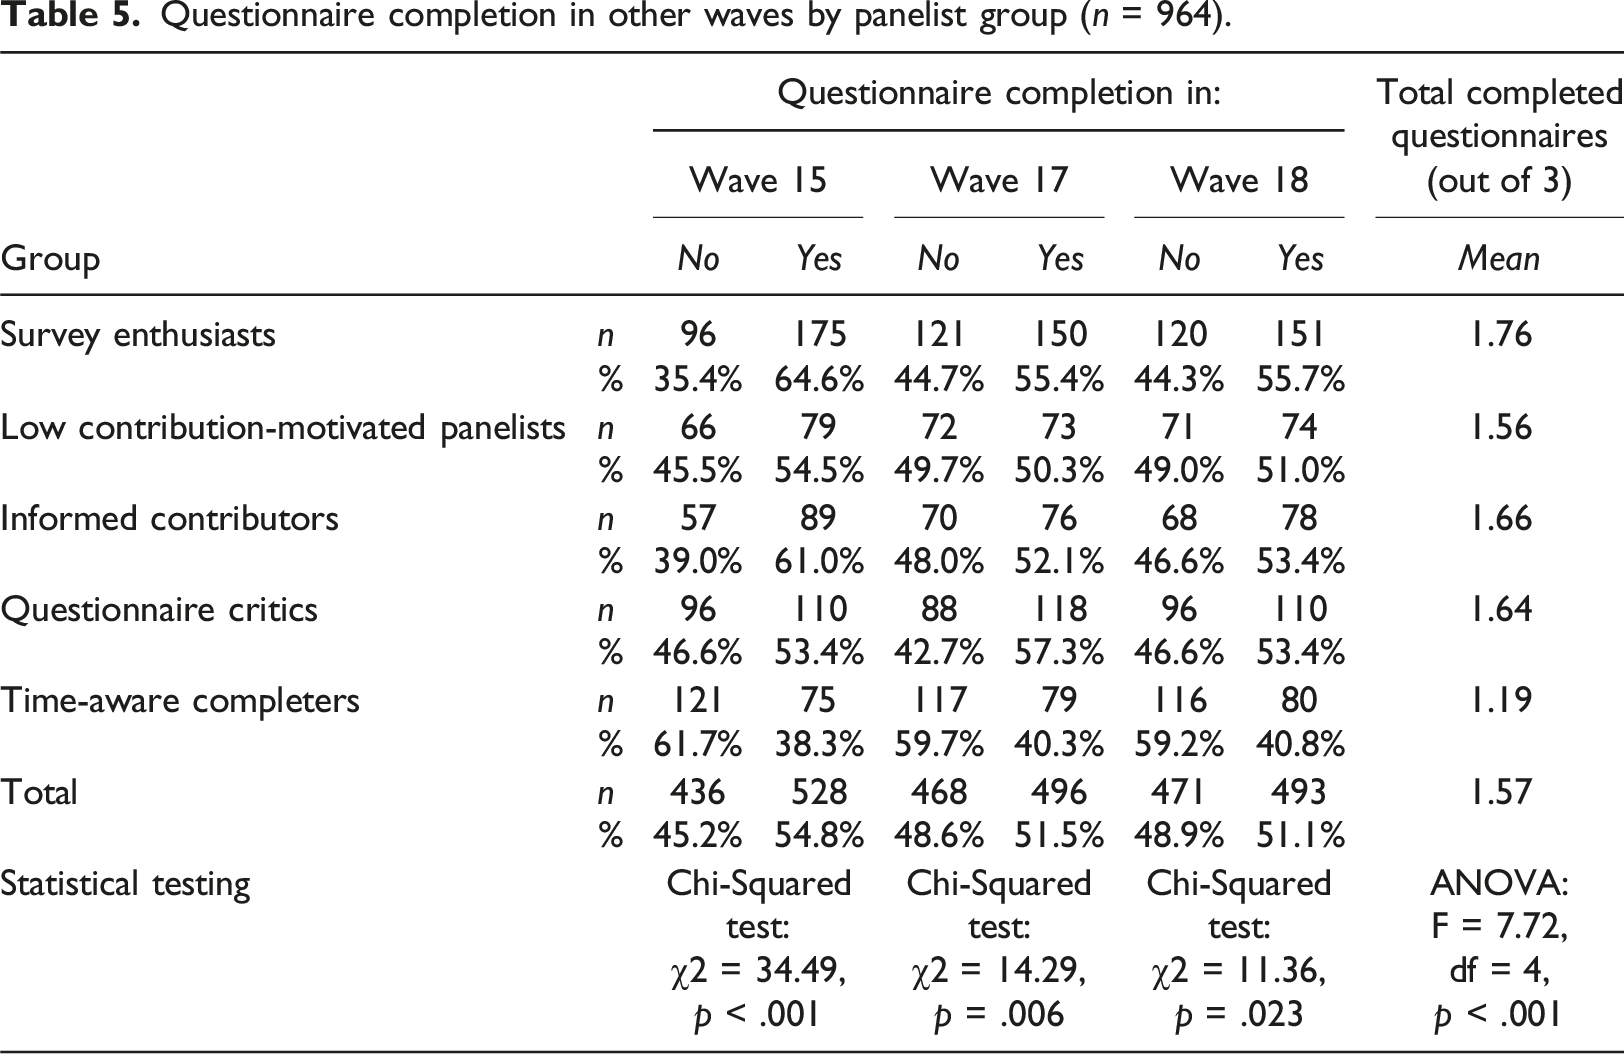
Questionnaire completion in other waves by panelist group (n = 964).
Discussion
The aim of this study was to extend and deepen our understanding of the decision-making process of active panelists regarding their questionnaire completion (or non-completion) in a nonprobability online panel. Specifically, we investigated the relationship between motivations to participate and barriers or inhibitors that lead to panel attrition. Our study also includes an investigation of the applicability of three theories of survey participation (LST, CBT, SET), and as such it addresses an important knowledge gap and presents significant implications for market and social researchers using nonprobability panels. It is predicated on the premise that previous quantitative research in this area has primarily concentrated on motivations to participate (Brüggen et al., 2011; Haensch et al., 2022; Lavrakas & Kocar, 2023) with little attention given to the relationship between motivations and barriers/inhibitors. We initially argued, and the evidence from this study supports, that both motivations and barriers should be considered when organizations managing online panels make decisions on how to address panel attrition and representational aspects within a nonprobability online panel context. Additionally, the evidence from our study supports previously proposed classifications of motivations and barriers into broader groups. Building upon those categorizations, our work introduces new profiles of panelists, which illustrates how they could potentially serve as a basis for developing tailored panel recruitment and panel maintenance solutions in other panels.
Our investigation firstly showed that the most common motivations to complete questionnaires in an academic-organization-managed nonprobability online panel are largely related to panel engagement. These motivations are associated with a desire to contribute, such as to help the survey/research, or to help understand people’s attitudes/opinions. This finding differs to some extent from the findings for some probability-online panels, including those presented by Haensch et al. (2022), who identified ‘importance in general’, ‘interest’, and ‘incentives’ as the most important reasons to participate. The differences in the incentives-related motivations (or associated barriers) between the studies could be explained, at least in part, by the fact that the TTP panelists were never offered monetary rewards for joining the panel or completing the questionnaires, which is an important specific of the studied panel. Moreover, our investigation also revealed that several of the most common barriers or inhibitors reported by the TTP panel participants are associated with the content of questionnaires and questions 25 , such as the potential for improving answer/response choices. This is likely related to the responses of regularly participating panelists who completed the TTP8 questionnaire, whereas nonrespondents and voluntary attritors did not participate in this research to assist in highlighting other non-questionnaire-related barriers. 26 This limitation is discussed in greater depth in the concluding section of the Discussion.
Another key finding is associated with the sample composition bias – significantly higher levels of agreement regarding motivations were observed compared to those towards barriers, which is a prerequisite for questionnaire completion, as explained by theories such as CBT, SET and LST. We assume this balance would be reversed for panel profiles such as backouts, dozers, or fast attritors (see Lavrakas et al., 2018; Lugtig, 2014). Moreover, for the responding part of the panel, we empirically identified three groups of motivations, which closely resembled a conceptual motivation framework proposed by Brüggen et al. (2011). There was also a substantial correspondence between our empirical classifications of motivations and barriers and those proposed by Kocar and Lavrakas (2023), with certain differences that can be explained by not collecting data from those who opted-out and backouts.
The evidence from our study also contributes to advancing the field’s understanding of the applicability of the selected theories of survey participation in a panel context, particularly the findings on the higher panel attrition rates of specific psychographic profiles. Those with a more balanced equilibrium between motivations and barriers in a particular wave, such as time-aware completers, or conditionally low contribution-motivated panelists and questionnaire critics, had lower average completion rates (or higher attrition rates). This is consistent with theories grounded on the premise that people decide to participate in surveys by (sub)consciously weighing the costs and benefits (LST, CBT, and SET). We argue that, according to the evidence obtained in this study, CBT (and somewhat similarly SET) provides arguably the best foundation to explain panel attrition over time. More specifically, panelists with more substantial barriers (especially time-burden-related ones) were more likely to have their barriers or costs outweigh motivations or benefits, leading to a higher probability of panel attrition in other waves. Our evidence suggests that this balance between motivations and barriers is not stable over time and can notably change in future waves, even for profiles that reported motivations substantially outweighing barriers at one point in time (like survey enthusiasts). Additionally, there might be other unobservable external factors (see Keusch, 2015) that affect all groups. Some of these factors could be specific to the recruitment mode, such as not noticing survey invitations in their email inbox. LST, on the other hand, is based on similar principles, but we did not test the unique aspects of LST. A future experiment focused on making motivations/attributes with high positive leverage more salient to certain psychographic profiles (e.g., by highlighting them in recruitment materials) could positively impact questionnaire completion rates within those groups, providing further evidence for the contribution of LST in a panel context. However, we readily acknowledge that the specific methodological characteristics of the studied panel may have led to the identification of different groups and their distributions among active panelists compared to those in other online panels.
Additionally, we presented the associations between the empirically identified broad motivations and broad barriers and revealed interesting and relevant findings. While neither of the investigated theories place much consideration on the association between costs/negative attributes and benefits/positive attributes, our study provides a theoretical contribution by demonstrating that a relationship may exist for certain motivations and barriers. The most notable one found in our study was the negative association between contribution-focused motivations and lack-of-understanding barriers – a better understanding of the importance of the survey or questions could result in increased contribution-focused motivation. This finding aligns with the assessment by Kocar and Lavrakas (2023), who found that more comprehensive communication of panel-related information could lead to lower attrition rates, and both highlighting motivations (cf. Lavrakas & Kocar, 2023) and targeting barriers can be a part of the panel recruitment and maintenance strategies.
In addition, the grouping of responding panelists into relatively homogeneous subsets based on their motivations and barriers offers additional opportunities for panel management. It enables both the targeted interventions mentioned above, as well as identification of panelists who are more likely to attrit if not treated. Our supplementary questionnaire completion analysis showed that, without panel maintenance interventions, all groups are somewhat prone to panel attrition over time. This especially applies to time-aware completers with a 1.5-fold decrease in the average questionnaire completion rate compared to survey enthusiasts. Thus, our proposed grouping contributes to the existing literature on explaining future completion of panel questionnaires, which highlighted panel participation history and socio-demographic information as predictors of panel attrition (e.g., Kruse et al., 2009; Lugtig & Blom, 2018). Nevertheless, we acknowledge that the profiling appeared to explain panel attrition better around the time the motivations and barriers data were collected, rather than nearly one year after.
Furthermore, we identified particular socio-demographic differences between the identified psychographic profiles, which were previously reported by Brosnan et al. (2021), Brüggen et al. (2011), and Lavrakas and Kocar (2023). The same conclusion can be drawn for barriers. Second, since the proposed grouping explains future panel attrition, it is possible to proactively identify socio-demographic groups that might participate less frequently over a longer period of time, or even voluntarily leave the panel. Not only could we treat certain groups of panelists to increase the overall questionnaire completion rate, but we could also target certain socio-demographic profiles within those groups with an aim of mitigating potential nonresponse bias as a result of differential attrition in a panel context. This could result in better socio-demographic representation over time, which is another aspect that needs to be tested empirically.
Finally, it is important to acknowledge and further discuss specific limitations of our study. Like many prior studies examining motivations for participation in online panels (e.g., Brosnan et al., 2021; Brüggen et al., 2011), we exclusively collected data from participating panelists. This design excluded panel profiles such as original refusers to join the panel, voluntary attritors, backouts, and those panelists who broke-off before the last two questions of the TTP8 questionnaire. This exclusion could potentially have a more significant impact on our findings related to barriers or inhibitors, as demonstrated by Kocar and Lavrakas (2023), who highlighted differences in barriers among attritors and backouts compared to frequently participating panelists. Consequently, our findings should not readily be generalized to the entire TTP panel. Due to the specific methodological characteristics of the panel analyzed, namely that it was non-commercial, managed by a regional university, and did not offer monetary incentives, our findings have limited generalizability to other contexts. They cannot be generalized to the broader adult population recruited for nonprobability online panel surveys elsewhere in the world. In practice, this means that our findings on motivations and barriers, as well as the distribution of psychographic profiles, cannot be extended to probability-based online panels or commercial nonprobability panels, especially those that offer monetary rewards for questionnaire completion. Nevertheless, we are confident that, despite these limitations, the approaches and methods from our case study are likely to be applicable to other types of online panels globally, including both nonprobability and probability-based ones. We argue that replicating our approach, which combines mixed-methods data collection with subsequent cluster analysis, could yield valuable insights and offer new opportunities for improving panel management across various online panel types.
Thus, to address these limitations and better understand nonprobability panel participation, there is a need for additional efforts to collect data on motivations and barriers from non-responding segments of panels or the broader population, which applies to other national contexts as well. Additionally, since we showed that identifying panelists who may be less inclined to participate in future panel waves is feasible with our approach, more research is needed on how to use such empirical results for panel maintenance. More specifically, it should be investigated how to utilize panelists’ self-reported motivations and barriers/inhibitors to develop tailored panel maintenance strategies to effectively address attrition. The effect of such targeted solutions, such as the use of between-wave communication, on overall completion rates and representation in nonprobability panels should be further explored. Nevertheless, we believe that our methodological approach represents an important first step in enhancing panel maintenance strategies in other contexts.
Footnotes
Acknowledgements
We would like to thank the Tasmanian panelists who joined The Tasmania Project and participated in the online panel questionnaires that provided data for this study.
Author contributions
Dr Sebastian Kocar: conceptualization, writing – original draft (lead), writing – review and editing (equal), methodology (lead), formal analysis. Dr. Paul J. Lavrakas: writing – original draft (supporting), writing – review and editing (equal), methodology (supporting)
Declaration of conflicting interests
The author(s) declared no potential conflicts of interest with respect to the research, authorship, and/or publication of this article.
Funding
The author(s) received no financial support for the research, authorship, and/or publication of this article.
Ethical approval
The Tasmania Project, including all its surveys/panel questionnaires, was approved by University of Tasmania Human Research Ethics Committee (Project ID 20587).
Consent to participate
At the beginning of the online questionnaires programmed in Qualtrics, all participants were asked to review and confirm that they had read and understood the participation information sheet. To start responding to questions on the subsequent questionnaire page, they had to consent to participate.
Data Availability Statement
The data obtained through closed-ended questions can be made available for replication purposes.
Notes
Appendix A
Exploratory factor analysis results, motivations (n = 1,047).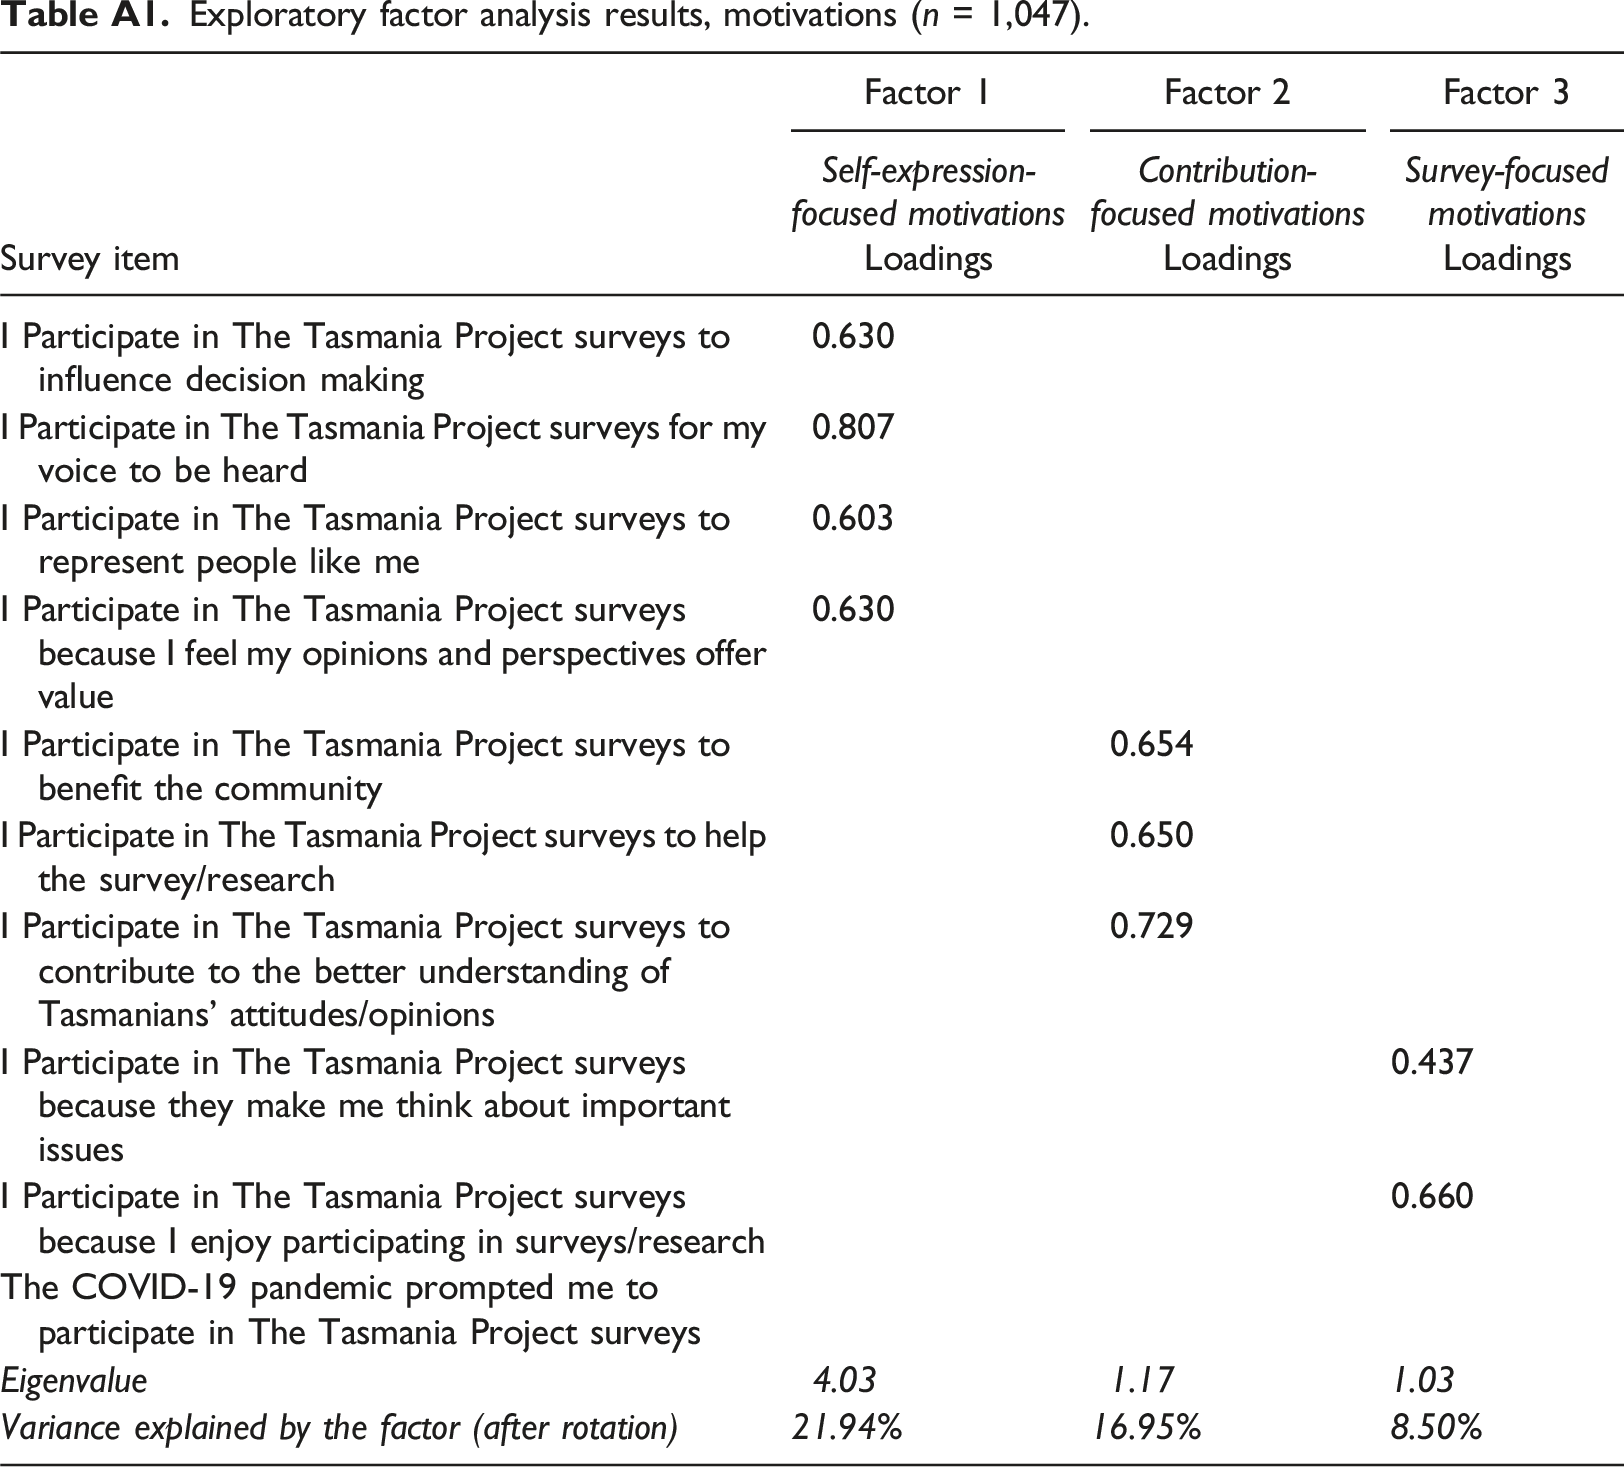
Survey item
Factor 1
Factor 2
Factor 3
Self-expression-focused motivationsLoadings
Contribution-focused motivationsLoadings
Survey-focused motivationsLoadings
I Participate in The Tasmania Project surveys to influence decision making
0.630
I Participate in The Tasmania Project surveys for my voice to be heard
0.807
I Participate in The Tasmania Project surveys to represent people like me
0.603
I Participate in The Tasmania Project surveys because I feel my opinions and perspectives offer value
0.630
I Participate in The Tasmania Project surveys to benefit the community
0.654
I Participate in The Tasmania Project surveys to help the survey/research
0.650
I Participate in The Tasmania Project surveys to contribute to the better understanding of Tasmanians’ attitudes/opinions
0.729
I Participate in The Tasmania Project surveys because they make me think about important issues
0.437
I Participate in The Tasmania Project surveys because I enjoy participating in surveys/research
0.660
The COVID-19 pandemic prompted me to participate in The Tasmania Project surveys
Eigenvalue
4.03
1.17
1.03
Variance explained by the factor (after rotation)
21.94%
16.95%
8.50%
Exploratory factor analysis results, barriers/inhibitors (n = 996).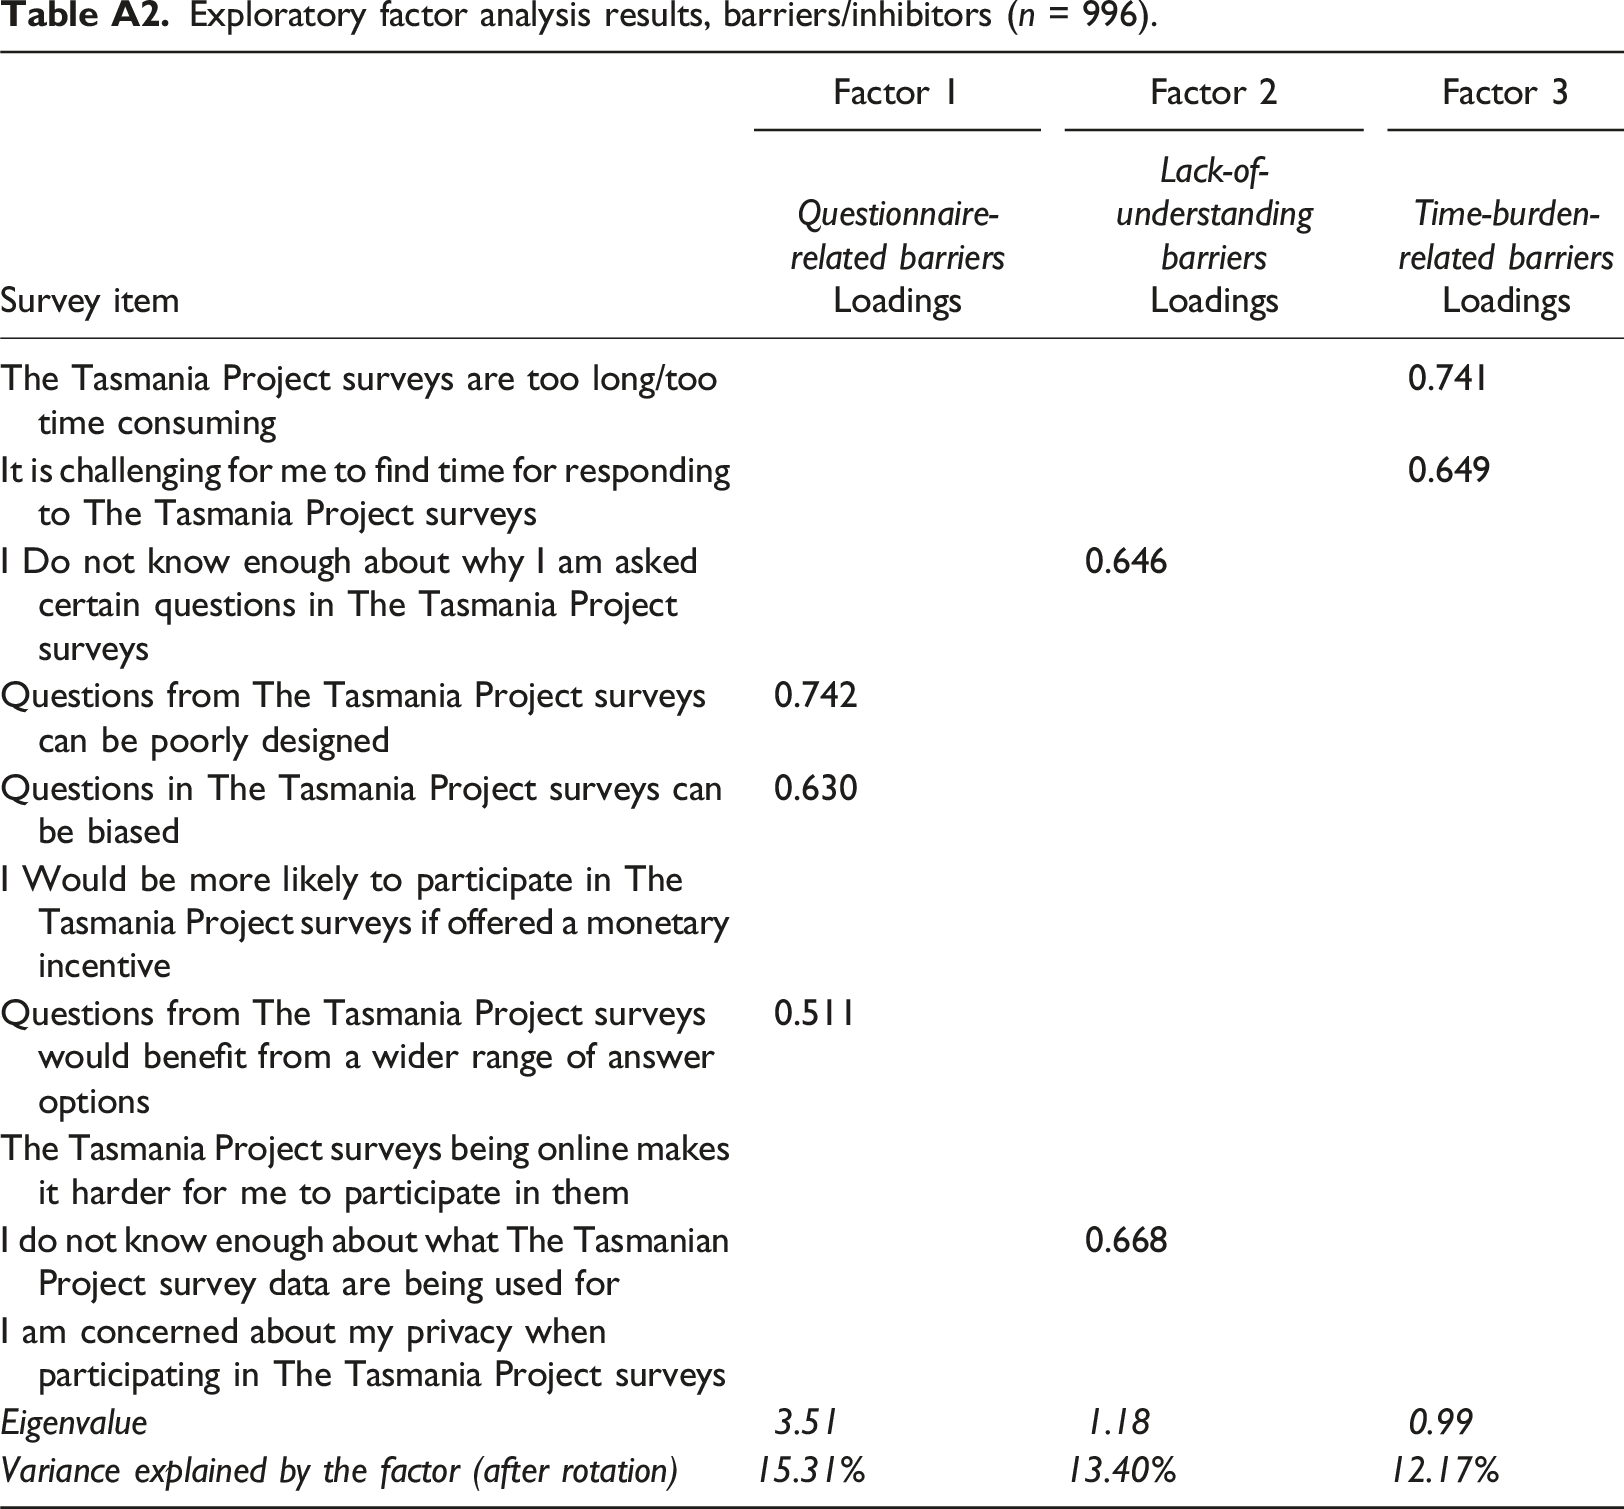
Survey item
Factor 1
Factor 2
Factor 3
Questionnaire-related barriersLoadings
Lack-of- understanding barriersLoadings
Time-burden-related barriersLoadings
The Tasmania Project surveys are too long/too time consuming
0.741
It is challenging for me to find time for responding to The Tasmania Project surveys
0.649
I Do not know enough about why I am asked certain questions in The Tasmania Project surveys
0.646
Questions from The Tasmania Project surveys can be poorly designed
0.742
Questions in The Tasmania Project surveys can be biased
0.630
I Would be more likely to participate in The Tasmania Project surveys if offered a monetary incentive
Questions from The Tasmania Project surveys would benefit from a wider range of answer options
0.511
The Tasmania Project surveys being online makes it harder for me to participate in them
I do not know enough about what The Tasmanian Project survey data are being used for
0.668
I am concerned about my privacy when participating in The Tasmania Project surveys
Eigenvalue
3.51
1.18
0.99
Variance explained by the factor (after rotation)
15.31%
13.40%
12.17%
Appendix B
Cluster evaluation metrics.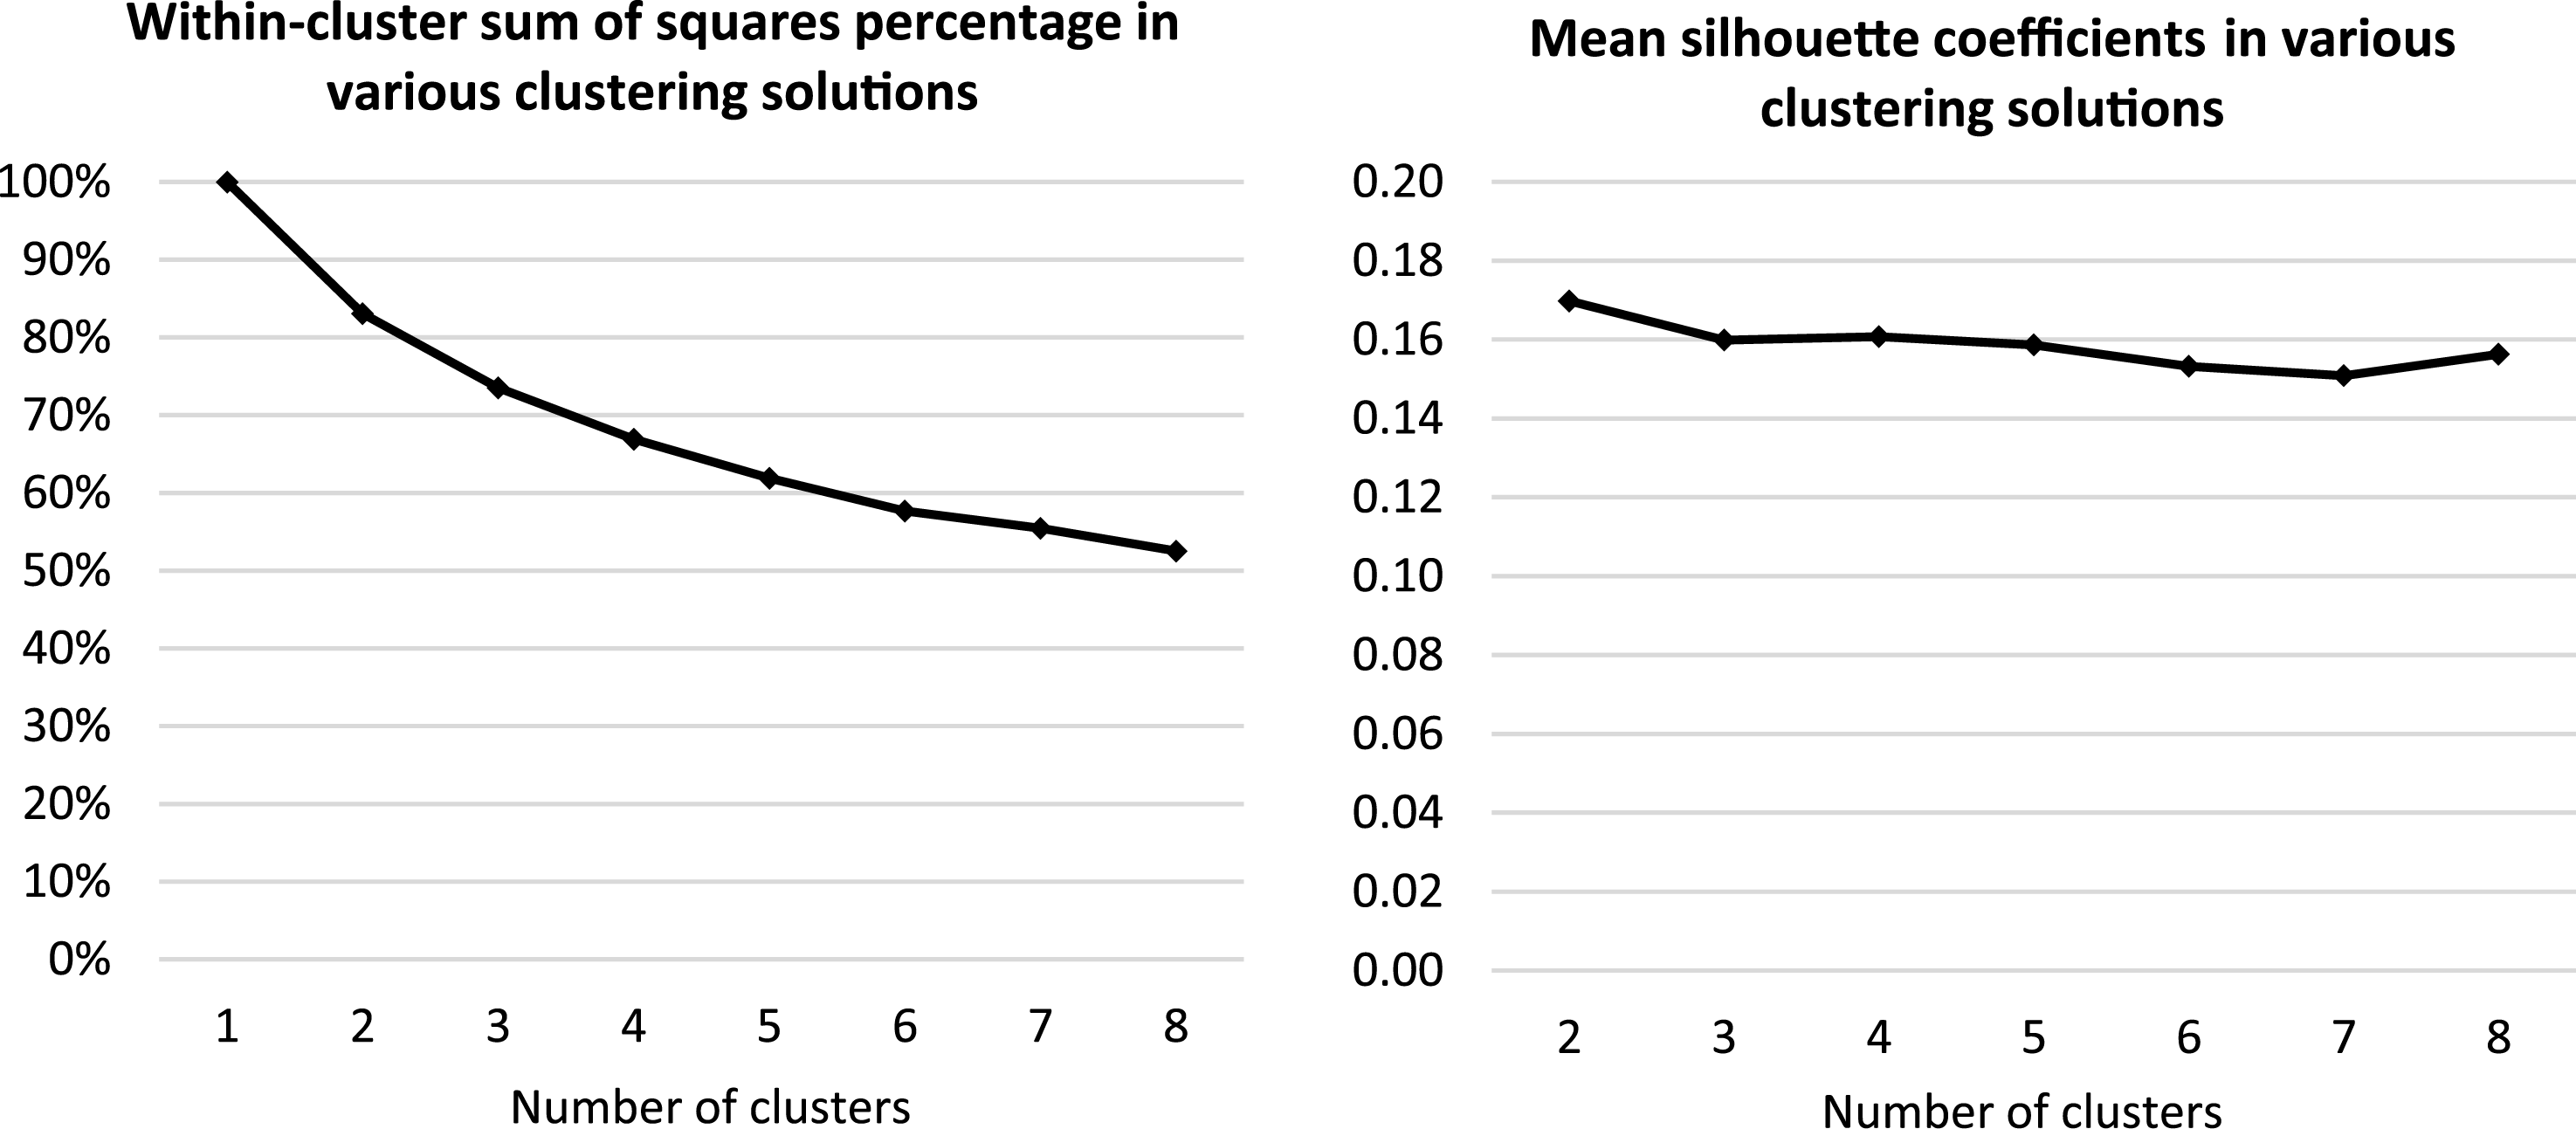
Cluster centroids and ANOVA testing
*
(n = 964). The ANOVA results were statistically significant for all six variables; Games-Howell post hoc tests indicated statistically significant differences between the clusters for the majority of pairs, with a few exceptions: self-expression-focused motivation (clusters 4 and 5), survey-focused-motivation (clusters 2 and 5), questionnaire-related barriers (clusters 1 and 2, 2 and 3), lack-of-understanding barriers (clusters 2 and 5), and time-burden-related barriers (clusters 1 and 2, 2 and 3).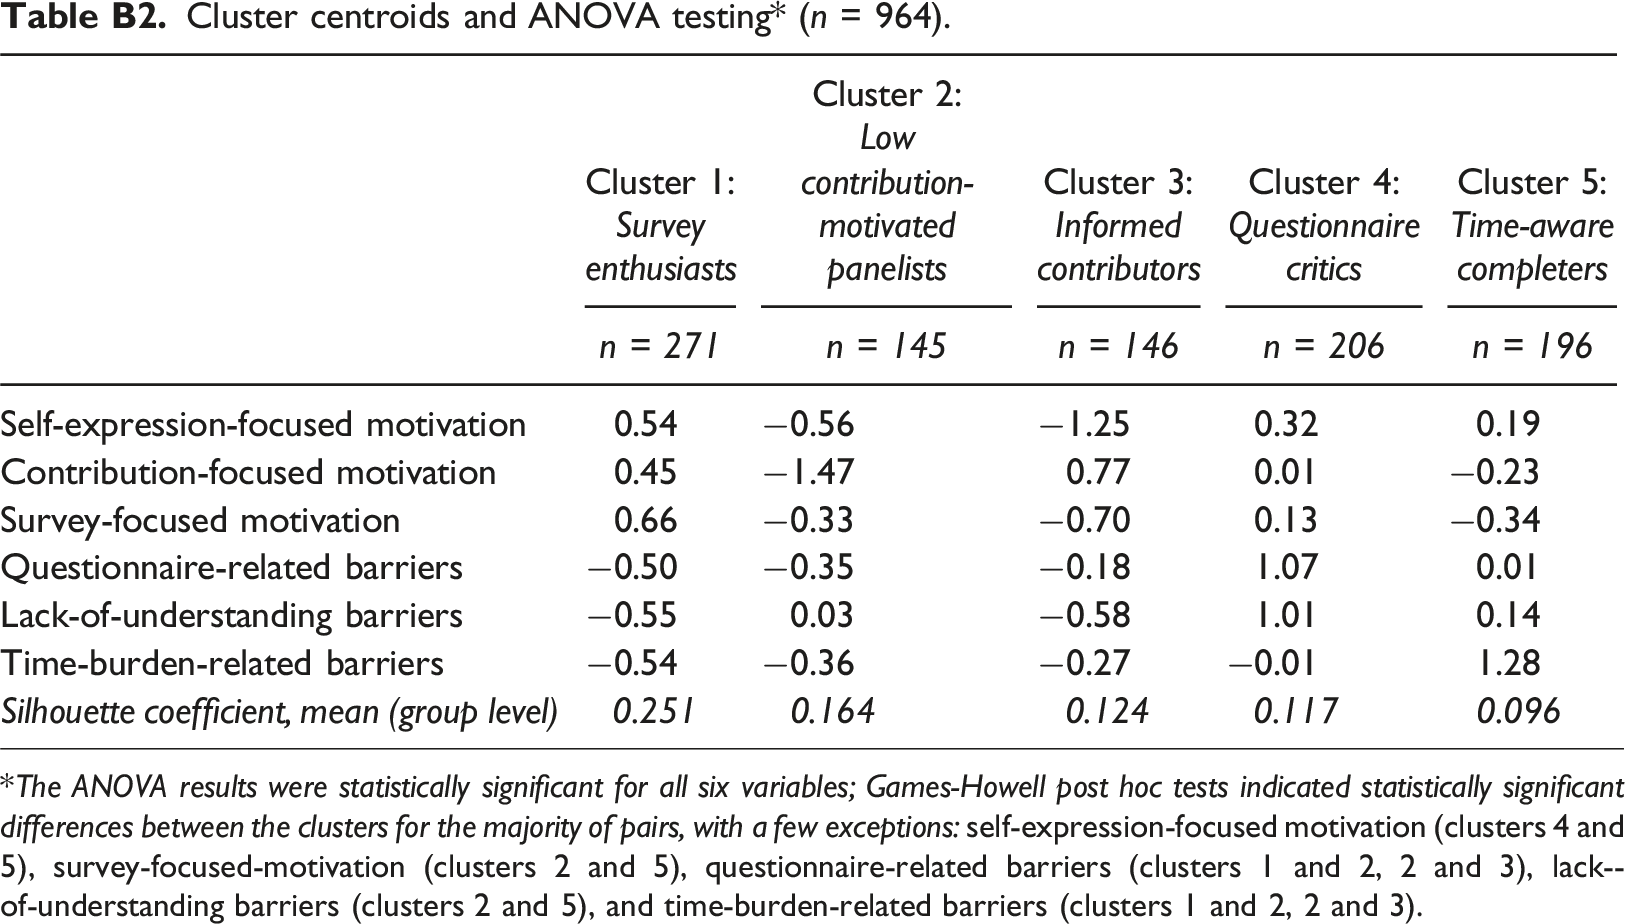
Cluster 1: Survey enthusiasts
Cluster 2: Low contribution-motivated panelists
Cluster 3: Informed contributors
Cluster 4: Questionnaire critics
Cluster 5: Time-aware completers
n = 271
n = 145
n = 146
n = 206
n = 196
Self-expression-focused motivation
0.54
−0.56
−1.25
0.32
0.19
Contribution-focused motivation
0.45
−1.47
0.77
0.01
−0.23
Survey-focused motivation
0.66
−0.33
−0.70
0.13
−0.34
Questionnaire-related barriers
−0.50
−0.35
−0.18
1.07
0.01
Lack-of-understanding barriers
−0.55
0.03
−0.58
1.01
0.14
Time-burden-related barriers
−0.54
−0.36
−0.27
−0.01
1.28
Silhouette coefficient, mean (group level)
0.251
0.164
0.124
0.117
0.096
Appendix C
Appendix D
Psychographic profiles and socio-demographic composition (binary logistic regression analysis) Reference categories: Male, 45–64 years, University degree, Greater Hobart, Born abroad, Couple living with children, Employed (full-time or part-time), Married, Not living at current address 5 years ago, Did not do unpaid voluntary work in previous 12 months, No health condition or disability limiting my activity; **p < .01, *p < .05.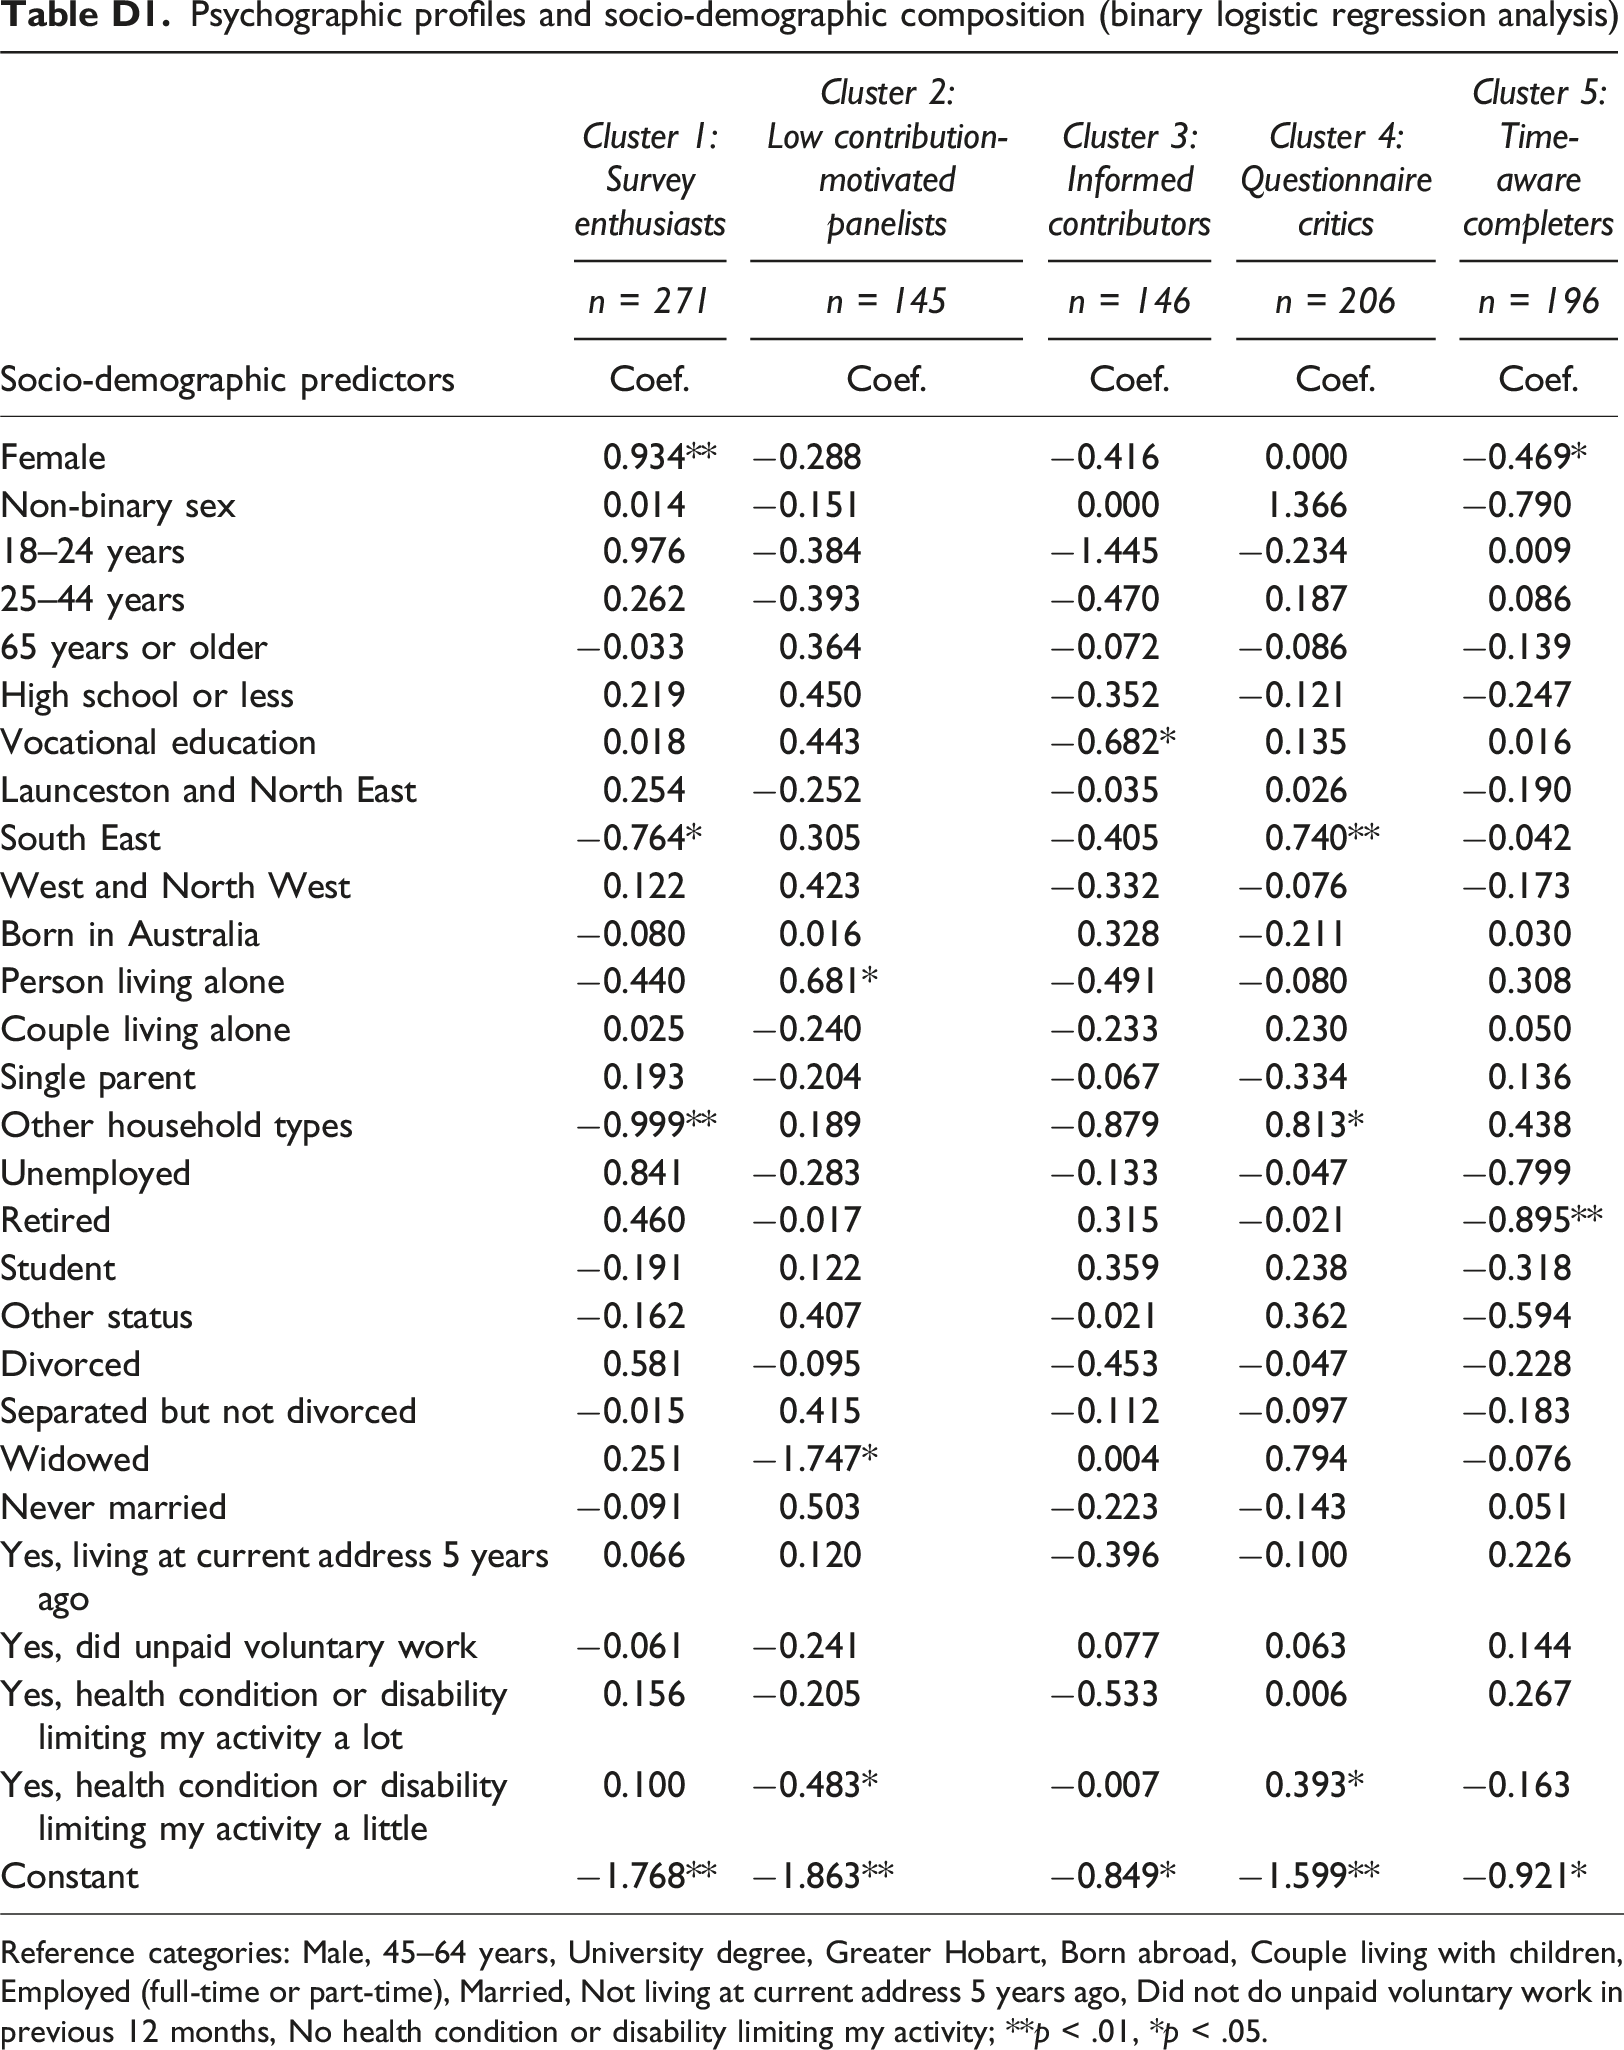
Socio-demographic predictors
Cluster 1: Survey enthusiasts
Cluster 2: Low contribution-motivated panelists
Cluster 3: Informed contributors
Cluster 4: Questionnaire critics
Cluster 5: Time-aware completers
n = 271
n = 145
n = 146
n = 206
n = 196
Coef.
Coef.
Coef.
Coef.
Coef.
Female
0.934**
−0.288
−0.416
0.000
−0.469*
Non-binary sex
0.014
−0.151
0.000
1.366
−0.790
18–24 years
0.976
−0.384
−1.445
−0.234
0.009
25–44 years
0.262
−0.393
−0.470
0.187
0.086
65 years or older
−0.033
0.364
−0.072
−0.086
−0.139
High school or less
0.219
0.450
−0.352
−0.121
−0.247
Vocational education
0.018
0.443
−0.682*
0.135
0.016
Launceston and North East
0.254
−0.252
−0.035
0.026
−0.190
South East
−0.764*
0.305
−0.405
0.740**
−0.042
West and North West
0.122
0.423
−0.332
−0.076
−0.173
Born in Australia
−0.080
0.016
0.328
−0.211
0.030
Person living alone
−0.440
0.681*
−0.491
−0.080
0.308
Couple living alone
0.025
−0.240
−0.233
0.230
0.050
Single parent
0.193
−0.204
−0.067
−0.334
0.136
Other household types
−0.999**
0.189
−0.879
0.813*
0.438
Unemployed
0.841
−0.283
−0.133
−0.047
−0.799
Retired
0.460
−0.017
0.315
−0.021
−0.895**
Student
−0.191
0.122
0.359
0.238
−0.318
Other status
−0.162
0.407
−0.021
0.362
−0.594
Divorced
0.581
−0.095
−0.453
−0.047
−0.228
Separated but not divorced
−0.015
0.415
−0.112
−0.097
−0.183
Widowed
0.251
−1.747*
0.004
0.794
−0.076
Never married
−0.091
0.503
−0.223
−0.143
0.051
Yes, living at current address 5 years ago
0.066
0.120
−0.396
−0.100
0.226
Yes, did unpaid voluntary work
−0.061
−0.241
0.077
0.063
0.144
Yes, health condition or disability limiting my activity a lot
0.156
−0.205
−0.533
0.006
0.267
Yes, health condition or disability limiting my activity a little
0.100
−0.483*
−0.007
0.393*
−0.163
Constant
−1.768**
−1.863**
−0.849*
−1.599**
−0.921*