
Abstract
Nonprobability online panels are commonly used in the social sciences as a fast and inexpensive way of collecting data in contrast to more expensive probability-based panels. Given their ubiquitous use in social science research, a great deal of research is being undertaken to assess the properties of nonprobability panels relative to probability ones. Much of this research focuses on selection bias, however, there is considerably less research assessing the comparability (or equivalence) of measurements collected from respondents in nonprobability and probability panels. This article contributes to addressing this research gap by testing whether measurement equivalence holds between multiple probability and nonprobability online panels in Australia and Germany. Using equivalence testing in the Confirmatory Factor Analysis framework, we assessed measurement equivalence in six multi-item scales (three in each country). We found significant measurement differences between probability and nonprobability panels and within them, even after weighting by demographic variables. These results suggest that combining or comparing multi-item scale data from different sources should be done with caution. We conclude with a discussion of the possible causes of these findings, their implications for survey research, and some guidance for data users.
Introduction
For over a decade, there has been a prominent rise in the use of nonprobability online panels for survey data collection (Callegaro, Baker et al., 2014). In contrast to traditional probability-based surveys, where units are directly sampled at random from the target population with a known (or knowable) probability of selection, nonprobability online panels are often characterized by an additional layer of pre-selection. The pre-selection step occurs when persons are recruited, usually through mass advertising (e.g., via websites, pop-up ads, and sponsored search results), offering the chance to participate in periodic web surveys, often in exchange for small gifts or monetary rewards. The selection process is therefore dependent on people reacting to passive advertising and self-selecting into the panel. This setup allows panel providers to build massive pools of pre-selected panelists, from which large samples of ready and willing respondents can be drawn and surveyed at short notice, usually at a fraction of the cost of drawing and recruiting traditional probability samples (Callegaro, Villar et al., 2014). Such panels are commonly used in the commercial sector, and increasingly also in the non-profit and academic sectors, to study attitudes, preferences, and behaviors with a growing body of this work making its way into the peer-reviewed literature (e.g., Hitchman et al., 2015; Powell et al., 2011; Skitka & Sargis, 2006; Taichman, 2020).
Despite their widespread use, nonprobability online panels have been criticized on the basis that they—and the samples drawn from them—do not accurately represent the general population or even the population of Internet users (Callegaro, Villar et al., 2014; Cornesse et al., 2020; Lehdonvirta et al., 2020). Indeed, most comparison studies find that samples drawn from nonprobability web panels are less accurate with respect to population benchmarks than probability online and offline samples, even when quota sampling or post-survey adjustments are used (Cornesse et al., 2020; Loosveldt & Sonck, 2008; Pasek, 2016), though the extent of inaccuracies tends to vary across panel providers (Blom, Ackermann-Piek et al., 2017; Kennedy et al., 2016).
These discrepancies are usually attributed to selection bias due to the non-random recruitment of panel members (Cornesse et al., 2020). However, what is largely missing from the literature are studies that investigate differences in survey measurements collected between probability and nonprobability online panels. The concern is that nonprobability respondents who join such panels may take less care in answering the survey items, as their motivation for participating in the survey may differ from those who participate in probability-based surveys (Cornesse & Blom, 2020). Although panels can discourage undesirable response behaviors (e.g., straight-lining) by employing different controlling procedures, the extent of controlling may vary from panel to panel. Such behavior raises the question of whether responses to multi-item scales, and the latent (or “hidden”) constructs they aim to measure, are measured in the same way between probability and nonprobability samples, as well as across different nonprobability sample providers.
To address these open issues, we carried out an investigation of measurement equivalence in several multi-item attitudinal scales administered in parallel probability and nonprobability online panel surveys. Measurement equivalence is a necessary assumption to make valid comparisons between different groups of respondents on multi-item scale measurements and latent constructs. If measurement equivalence holds, then the means of latent variables and relationships between them can be validly compared across different groups (Baumgartner & Steenkamp, 2006; Meredith, 1993)
Previous research
Several studies have explored differences and similarities between probability and nonprobability sample surveys. These studies have typically focused on assessing how accurately the surveys represent the general population by comparing the survey estimates to “gold standard” external benchmark data (Cornesse et al., 2020). The key finding from this literature is that probability surveys tend to produce more accurate population estimates than nonprobability surveys, even after applying weighting adjustments (e.g., Blom, Ackermann-Piek et al., 2017; Dutwin & Buskirk, 2017; Macinnis et al., 2018; Sturgis et al., 2018).
Some researchers have suggested that differences between probability and nonprobability surveys occur because probability surveys are more likely to conduct interviews offline (e.g., via face-to-face or telephone interviewing) and cover a broader portion of the general population than nonprobability sample surveys, which are mostly conducted online and restricted to the population of Internet users (Ansolabehere & Schaffner, 2014; Berrens et al., 2003). However, studies aiming to disentangle mode effects and sampling designs have found that both offline and online probability surveys are more accurate than nonprobability surveys (Blom, Ackermann-Piek et al., 2017; Brüggen et al., 2016; Chang & Krosnick, 2009; Macinnis et al., 2018; Scherpenzeel & Bethlehem, 2011; Yeager et al., 2011).
While several studies have examined differences in sample accuracy between probability and nonprobability surveys, little research has focused on other aspects, such as measurement differences, which may contribute to the observed discrepancies. Findings from the sparse literature on measurement differences are mixed. Concerning single items and multi-item scales, Chang and Krosnick (2009) identified a range of measurement differences when comparing a random-digit dial (RDD) telephone survey to a probability online panel survey and a nonprobability online panel survey. These included random measurement error (the nonprobability sample produced more reliable estimates of candidate preferences than the probability online panel survey, which in turn was less reliable than the RDD survey), satisficing (the nonprobability online survey produced considerably lower rates of midpoint selections, followed by the probability online survey, while the RDD survey produced the highest rates), and social desirability bias (the nonprobability online survey produced fewer socially undesirable answers than the probability online survey, which provided fewer socially undesirable answers than the RDD survey). The authors concluded that nonprobability online surveys produce higher measurement quality than RDD surveys, but at the cost of lower representativeness, while probability online surveys produce the optimal combination of measurement quality and representativeness. Cornesse and Blom (2020) found that three probability online surveys consistently produced less straight-lining in grid questions than seven nonprobability online surveys. Although two other undesirable survey behaviors, item nonresponse and midpoint selection, were not significantly different across the surveys. Furthermore, Greszki et al. (2014) found that a probability online survey performed better in terms of minimizing “speeding” (i.e., answering survey questions faster than normal) compared to a nonprobability online survey.
Despite the limited number of studies on measurement differences between probability and nonprobability surveys, it is reasonable to expect that measurement differences between the samples, and not just differential selection bias, influence their overall accuracy. Unlike probability surveys, which rely on a range of established and theoretically proven sampling procedures (Kish, 1965; Lohr, 2019), nonprobability surveys usually recruit their participants from a pool of volunteers on the Internet using online advertisements, pop-up questionnaires on websites, or open invitations via email lists that generally promise monetary incentives to anyone who voluntarily registers to join the panel (see Callegaro, Villar et al., 2014 for an overview of nonprobability online panel recruitment procedures). These findings illustrate the risks of incentive-driven survey recruitment which may affect response behavior by motivating undesirable response styles, such as speeding through the questionnaire.
Research on online access panels indicates that the promised monetary incentive is the most important motivator for people to join the panel and the strongest predictor of subsequent survey participation (Keusch et al., 2014; Sparrow, 2006). This is supported by Sparrow (2006), who showed that 52% of respondents to the ICM online panel primarily joined because “they felt it would be an enjoyable way to earn money or enter prize draws.” Similar results were reported by Zhang et al. (2019), who found that “professional respondents”, defined as those who were registered in at least seven panels, were more likely to report “for money” as their main reason for joining the panel, compared to less-experienced respondents. Interestingly, the authors found that the professional respondents produced higher-quality responses than their more novice counterparts, suggesting that they may take the survey response task more seriously. Furthermore, repeated survey participation by professional respondents may produce panel conditioning, where the respondent’s response behavior changes as they become more familiar with the survey and questionnaire
Given that respondents likely differ in their motivations for participating in probability and nonprobability online surveys as well as the associated risk of more undesirable response behaviors (e.g., straight-lining) in the latter, it is conceivable that multi-item scales and latent constructs may not be measured in the same way in nonprobability and probability surveys. Furthermore, given the multitude of nonprobability panel providers using different recruitment protocols, incentives, and methodologies, it is plausible that the measurement structure of latent variables may vary across different online panel providers. Currently, no research has been published on this issue. Of course, differences in the measurement structure might be attributed to the composition of the respondents who self-select themselves into the panels. That is, respondents in one panel may have different characteristics to respondents in a different panel, which may drive measurement differences if these characteristics correlate with different response behaviors. Thus, balancing the composition of the samples drawn from different panel providers is an important consideration. While full balancing is unlikely to be achieved in practice, weighting adjustments can help standardize the sample with respect to some observable characteristics and this may improve the comparability of the group measurements (Hox et al., 2015). We consider this issue in our investigation.
Research questions
Given the proliferation of nonprobability online panel surveys, the reviewed literature highlights a research gap in exploring differences in measurement between these surveys and probability surveys. On one hand, if measurement equivalence is attained in multi-item scales, then researchers can be more confident that latent constructs are measured in the same way in both probability and nonprobability surveys. On the other hand, if measurement equivalence is unattainable, then this could raise serious issues when combining or comparing results from both types of surveys. Similar issues could arise within a particular survey type, for instance, when scale data collected from multiple nonprobability panel providers are not equivalently measured. Using demographic weights to account for differential selection may help to improve measurement equivalence if the likelihood of survey participation varies among demographic groups and is related to response behaviors; thus, we also assess the effects of weighting on measurement equivalence. We address these research gaps by analyzing measurement equivalence in probability and nonprobability panel surveys in Australia and Germany. Specifically, we address the following research questions:
Q1: Are multi-item scale measurements equivalent between probability and nonprobability panel surveys?
Q2: Are multi-item scale measurements equivalent between different nonprobability panel providers?
Q3: Does weighting by demographics improve measurement equivalence between probability and nonprobability surveys, and between different nonprobability panel providers?
Data and methods
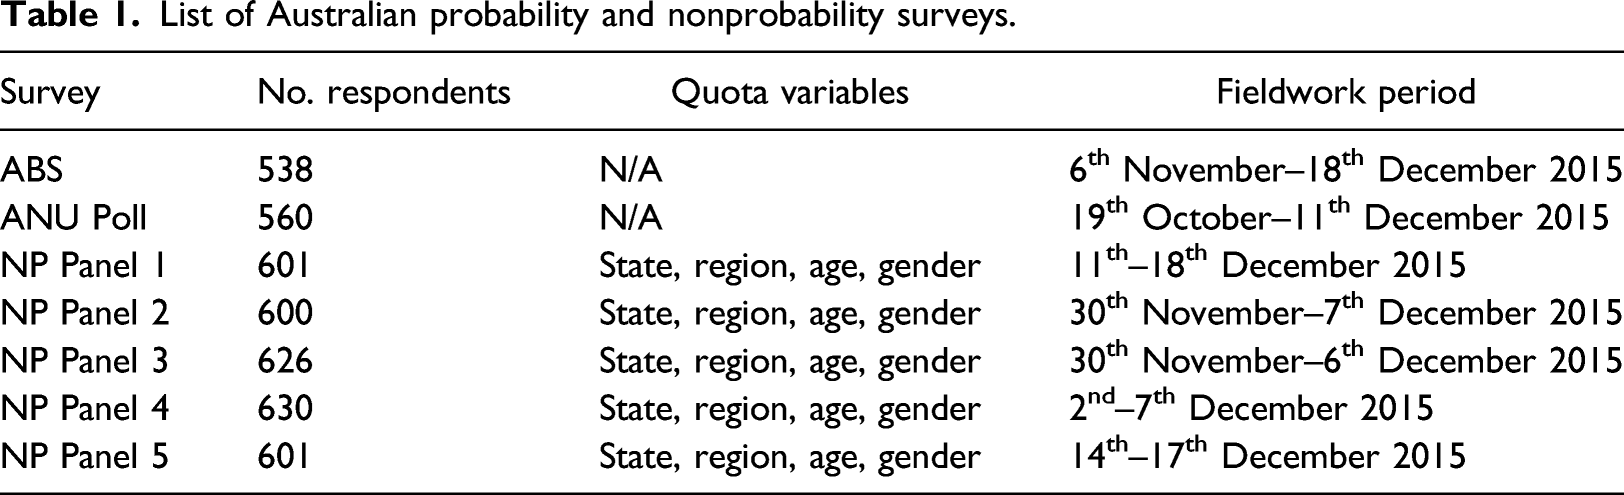
Probability surveys: Australia
We utilize two probability-based surveys from the Social Research Centre’s 2015 Online Panels Benchmarking Study in Australia (Pennay et al., 2016). The first is an address-based sample (ABS) survey. The sample was drawn from a national address index for Australia (the Geocoded National Address File) using a stratified sampling design. The ABS survey allowed for multiple modes of completion. Printed questionnaires were mailed to all households, and a link to the online version was provided for those who preferred to complete the survey online. The cover letter invited the household member (aged 18 years or over) with the next or most recent birthday to complete the survey. Telephone follow-ups were conducted with those who did not respond via hard copy or online. Data collection took place between 6th November and 23rd December 2015. A total of 2,050 households were contacted and 538 persons completed the survey, which resulted in a response rate of 26.2% (based on Response Rate 3; AAPOR, 2016). A total of 208 persons completed the survey online, 202 completed the hard copy version, and 128 were interviewed via telephone.
The second probability-based sample consisted of persons who previously participated in the Australian National University Poll (ANU Poll), a dual-frame RDD survey. Respondents of the ANU Poll conducted in October 2015 were invited to take part in a “future study about health and wellbeing.” Those who agreed were asked for contact details which, depending on their preferences, were used to either email a link to complete the survey online or send a hard copy questionnaire to be returned by mail. The October 2015 ANU Poll used a stratified sample design and the “next birthday method” to select the target respondent. Among the 1,200 respondents in the October 2015 ANU Poll who were invited to take part in the “future study,” 693 (58%) agreed to participate and provided an email or postal address for distribution of the questionnaire. Telephone interviews were available if sample members had not responded online or via hard copy. Data collection took place between 19th October 2015 and 11th December 2015. A total of 560 persons completed the survey for a response rate of 80.8% (AAPOR RR1) based on the initial ANU Poll, with 292 online responses, 40 hard copy responses, and 228 telephone responses.
For both Australian probability surveys, the original survey weights were constructed in two steps. First, design weights were calculated to account for respondents having different selection probabilities. In the second step, the design weight was combined with raking weights using known distributions of key sociodemographic characteristics (telephone status, education by age, region, gender, country of birth, age group, and state) based on official statistics published by the Australian Bureau of Statistics. As our study is focused on measurement equivalence in online surveys, all hard copy or telephone respondents are excluded from the analysis to remove mode effects, limiting the analysis to those who competed the web surveys. We further adjust the survey weights accordingly using a standard propensity score weighting procedure to account for selection into the web mode (for more details, see the “Accounting for Selection into Web” section below).
Nonprobability surveys: Australia
List of Australian probability and nonprobability surveys.
Probability surveys: Germany
The probability surveys from Germany consist of the German Internet Panel (GIP) and the GESIS Panel, both population-based panel surveys representative of the general population. The GIP is an ongoing longitudinal household panel survey of persons residing in Germany, aged 16–75. A multi-stage stratified area probability design was used to select the sample of households. Each sampled household was approached by face-to-face interviewers for an initial recruitment survey. The recruitment interview was conducted with a non-randomly selected member of the household, who provided information on all other household members during the interview. After the recruitment interview, all household members within the GIP age range (i.e., between 16 and 75) were invited to register to the panel online (Blom et al., 2015).
To facilitate coverage of the whole population, offline households were provided with Internet access and/or an Internet-capable browsing device if they did not already have one or both (Blom, Herzing et al., 2017). Participants were recruited in two independent recruitment rounds, initially in 2012 with a response rate of 18.5% (AAPOR RR2), followed by a second recruitment round in 2014 with a response rate of 20.5% (AAPOR RR 2). Every two months panel members are invited to login and complete a web survey containing a range of question modules on social and political issues, typically completed within 20–25 minutes. We use data from the March 2015 wave of the GIP, in which 68.7% of panelists (or 3,426 out of 4,989) completed the web survey and include only those respondents who matched the age range of the GESIS Panel and nonprobability samples (18–70 years, as discussed below).
The GESIS Panel is a mixed-mode (web and paper) panel survey of adults (18–70 years) residing in Germany. We analyze data from panel members initially recruited in 2013. A multi-stage stratified probability sampling design using municipal population registers was used to select the initial sample. Face-to-face recruitment interviews were conducted in which all participants were asked to join the GESIS panel. Of the initial sample of 21,870 individuals, 6,210 (28.4%) agreed to join the panel (AAPOR RR1). Panel members are invited to complete a web survey (with a mailed questionnaire option available for those who are unable or unwilling to respond online, see Cornesse and Schaurer (2021) for more information) every two months, with estimated average completion times of 20 minutes for each survey. The core questionnaire modules contain items on values, political behavior, well-being, among others. The questionnaire module used in our analyses was approved by the GESIS Panel team and fielded from 8th February to 14th April 2015. The completion rate among panelists for this module was 61.5% (3,822 out of 6,210). A detailed description of the methodology for the GESIS Panel can be found in (Bosnjak et al., 2018) and a comparison of the GESIS Panel recruitment design to the GIP and other European probability-based online panels can be found in (Blom et al., 2016). As for the Australian mixed-mode surveys, we exclude paper responses and focus only on the web responses in the forthcoming analysis of the GESIS Panel data and adjust the survey weights for selection into the web mode (for more details, see the “Accounting for Selection into Web” section below).
Nonprobability surveys: Germany
List of German probability and nonprobability surveys.
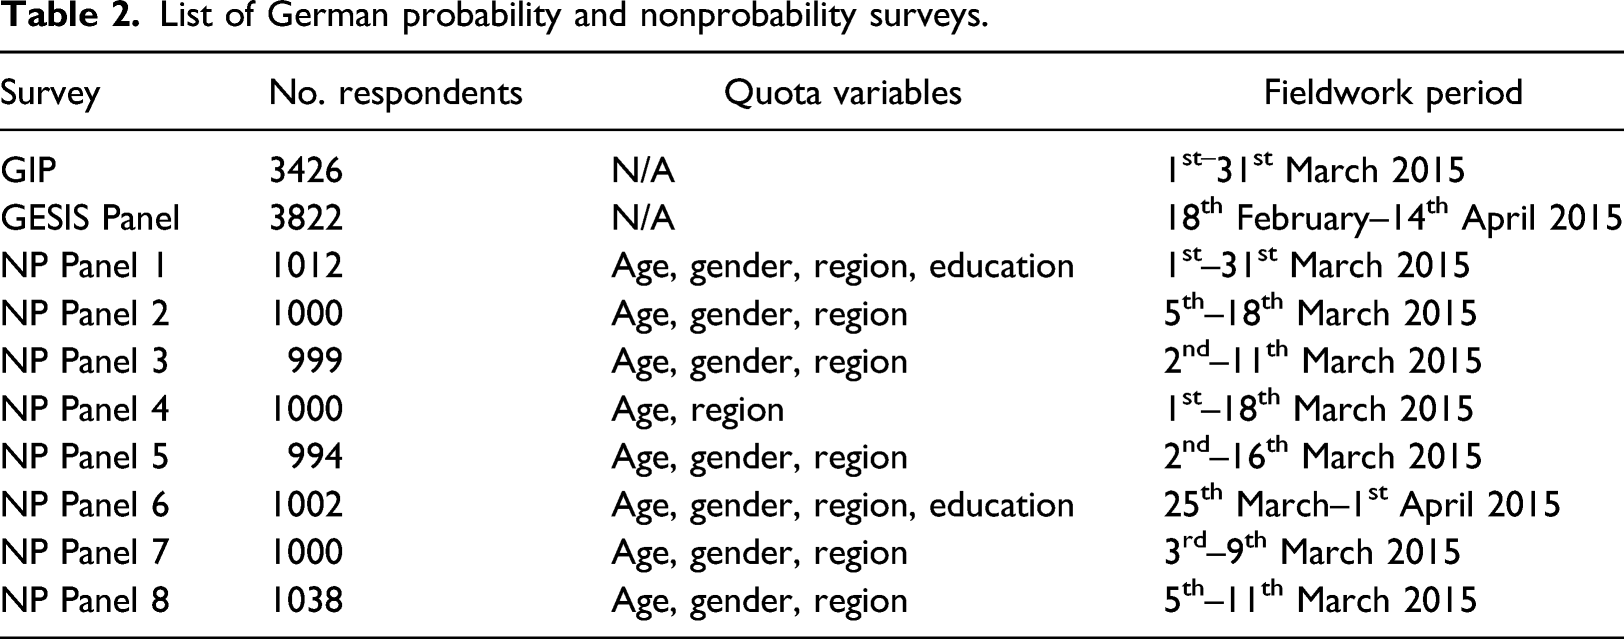
Weights were created for the GIP and GESIS Panel surveys and the eight nonprobability surveys based on the standard raking procedure used in the GIP. The raking weights were based on the following benchmark variables taken from the German micro-census: marital status, household size, age, and education.
Accounting for selection into web
Because our focus is on online respondents only, we apply a further adjustment to the original survey weights to account for selection into the web mode for the probability-based mixed-mode surveys, that is, the GESIS Panel, the ABS survey, and the ANU Poll survey. A propensity-score adjustment method (Rosenbaum & Rubin, 1983) was implemented by modeling the likelihood of respondents answering in the web mode versus the non-web mode(s).
The logistic regression model for mode of response for the Australian data included as covariates: age, sex, education, employment status, citizenship, internet usage, number of surveys completed in the past 4 weeks, mobile phone usage, general health status, household status, moving in past 5 years, and home ownership. For the German data, the following covariates were included: age, sex, education, employment status, citizenship, internet usage, general health status, household size, marital status, and home ownership. The fitted model was used to estimate the probability of answering in the web mode for each respondent. These probabilities were sorted from lowest to highest and quintiles were formed. The average propensity score in each quintile was then calculated and the inverse of this average was used to produce the adjustment factor. This factor was then multiplied with the original survey weight to produce the overall weight used in the forthcoming analyses.
Measures
We analyze all multi-item scales measured in the German and Australian surveys. In both countries, this included three multi-item scales. In Australia, the items included questions on New technology, Internet use, and Psychological distress (Kessler et al., 2002). The New technology scale dealt with how willing respondents were to adapt new brands and technologies, the Internet use scale items dealt with how often various Internet activities were performed, and the Psychological distress scale (Kessler et al., 2002) asked respondents to report how often they felt certain negative feelings. In Germany, the items included a short version of the Big Five personality scale measuring two dimensions: agreeableness and openness (Digman, 1990; Goldberg, 1993; Rammstedt et al., 2013). A second scale included items regarding interest in politics and political activity. Finally, two dimensions from the Need for Cognition scale were measured: cognitive persistence and cognitive complexity (Beissert et al., 2014; Cacioppo & Petty, 1982; Tanaka et al., 1988). The full wording of items and response categories can be found in Table A7 of the Online Supplement.
Method
To understand whether the measurement structure of multi-item scales differs between probability and nonprobability panels we apply confirmatory factor analysis (CFA; Bollen, 1989). This approach estimates a latent variable based on related observed variables. The statistical model is defined as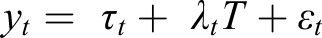
The model can also be visualized as shown in Figure 1. Here the latent variable is represented by a circle and the observed variables are represented by squares. All the coefficients discussed before are represented with each observed score, y, being explained by the true score T with a slope of Visual representation of measurement model tested across groups.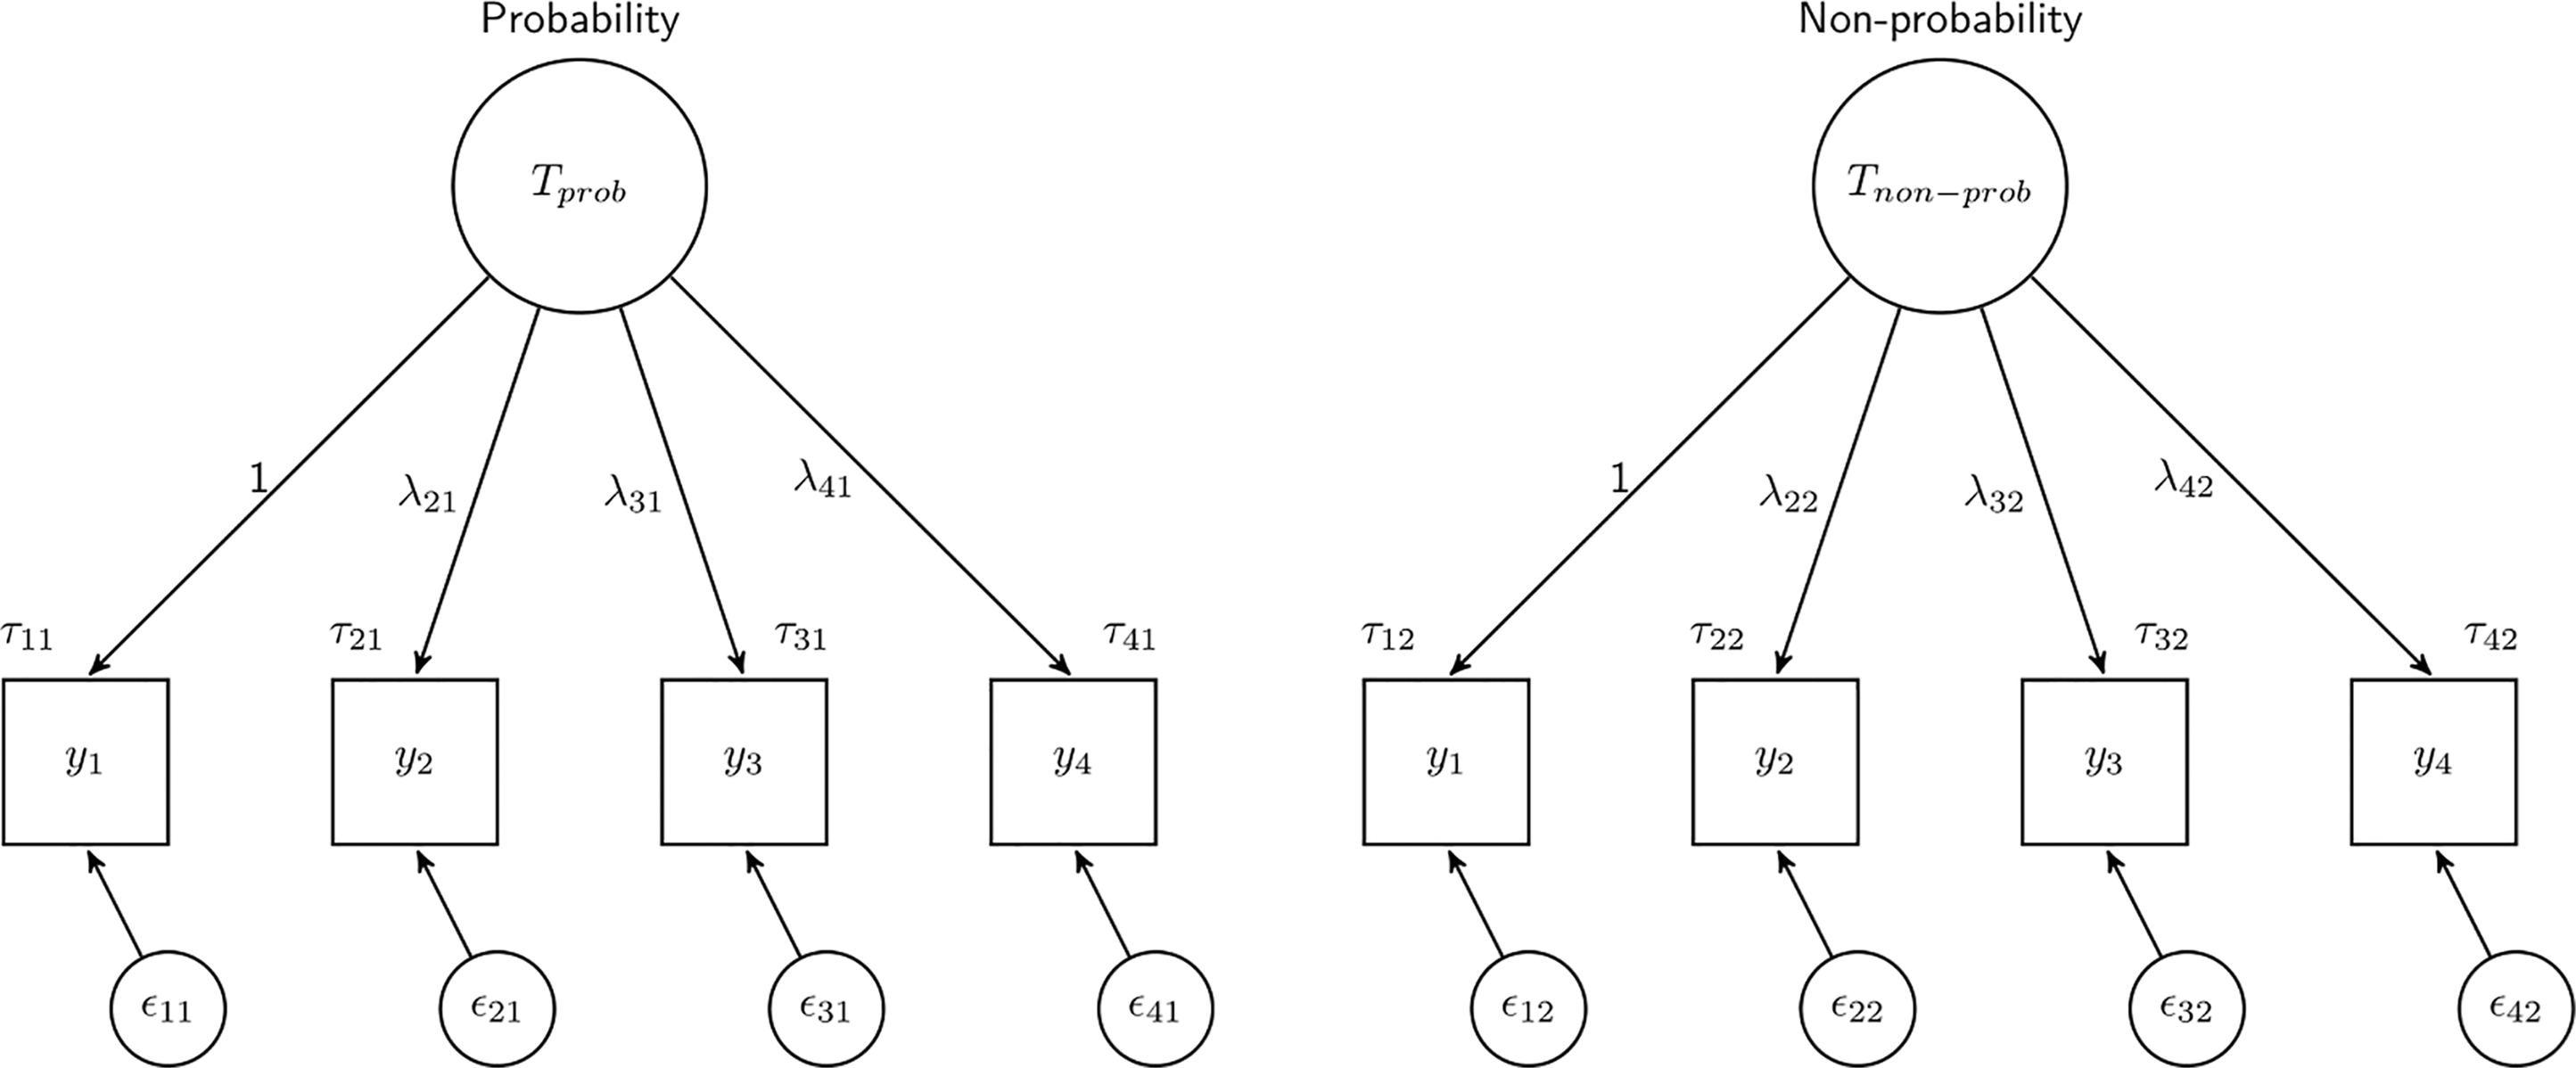
We use a simple CFA model (as seen in Figure 1) for all the scales analyzed using the Australian data. In Germany, due to the limited number of items that were part of a scale, some restrictions were made to the models. For the Big Five and Need for Cognition scales, even if they were comprised of four items each, they measure different sub-dimensions of the concept of interest (based on substantive and statistical reasoning). As a result, we estimate two latent variables with two indicators each for each scale. To estimate the models, loadings are fixed to 1 for all the indicators and the correlations of the two latent variables are fixed to 0 (they were very close to 0 when freely estimated). Similarly, for interest in politics, only two indicators were observed and, as such, the loadings had to be restricted to 1.
The CFA estimation method has a number of advantages, but one of the most important ones is that it can be used to formally test for measurement equivalence between groups (Baumgartner & Steenkamp, 2006; Meredith, 1993). For example, multi-group CFA is often used for comparisons of attitudes across countries (Davidov et al., 2014) or between different survey modes (Cernat & Revilla, 2020). This is important for both substantive and methodological reasons. First, from a substantive point of view, the measurement of interest is typically assumed to be equivalent or invariant across groups. If this assumption does not hold, then one cannot meaningfully compare concepts across groups. This is also relevant in the present context, as attitudinal measurements and other social phenomena are commonly collected and compared between probability and nonprobability surveys and within each type. For example, in political polling and election forecasting, estimates obtained from probability and nonprobability surveys are often compared (Sohlberg et al., 2017; Sturgis et al., 2018). The second reason is methodological. Comparing the factor models (also called measurement models) across groups can provide insights regarding the quality of the measures. For example, this might identify translation issues or problematic items in cross-country surveys. In the present study, this approach is used to understand whether probability and nonprobability surveys differ in terms of their measurement structures for estimating latent variables.
Therefore, the focus of the present study is on multi-group analysis (also known as equivalence or invariance testing), where the measures presented above are compared across different groups. More precisely, we focus on three groups of comparisons. The first comparison is between the probability surveys (two in each country) and nonprobability surveys (five in Australia and eight in Germany) to assess whether the measurement equivalence can be established between these two sampling streams (RQ1). The second comparison is between the different nonprobability surveys to each other, five surveys in Australia and eight in Germany (RQ2). All comparisons are conducted separately within country and topic, and with and without the adjustment weights (RQ3) to assess whether selection plays a role in affecting the measurement comparisons. Typically, multi-group analysis involves comparing a series of nested models. Here, we compare five models that become cumulatively restrictive (each model includes the restrictions of the previous models): 1. Configural model: the factor structure of the measurement model is the same across groups, but all coefficients are allowed to be different across groups. 2. Loadings (metric) model: the loadings are restricted to be equal across groups.
1
3. Intercepts (scalar) model: the intercepts are restricted to be equal across groups. 4. Means (of the latent variable): the mean of the latent variable is restricted to be equal across groups. 5. Residuals: the variances of the residuals are restricted to be equal across groups.
Each of these restrictions provides insights about the comparability of measurement across groups. The loadings and the residuals refer to variance and, as such, can be viewed as proxies of reliability. The intercepts and latent means refer to systematic differences that affect the averages. The models are also important as they indicate what can be appropriately compared across groups. If the best fitting model is the loadings model, then only covariances can be compared across groups but no other comparisons can be made. If the intercept model is the best fitting model, then the means of the latent variables can be compared across groups as well. If the means model is the best fitting model, this indicates that the means of the latent variables are the same across groups. If the residuals model is the best model, then the observed summative scores can be compared across groups. Because we compare data that should refer to the same population, using the same items, and the same mode (i.e., web), we expect that the full measurement structure will be the same across groups (i.e., model 5 will be the best fitting one). If that is not the case, then there are differences in the measurement structure that are not accounted for.
There are multiple ways of assessing model fit and selecting the best fitting model. Given the large number of models analyzed here we concentrate on only one indicator that is often used in this context, the difference in the Comparative Fit Index (ΔCFI) between adjacent models. This metric has been found to perform well when used to investigate measurement equivalence and, unlike other metrics, it is not very sensitive to sample size. We adopt the commonly used threshold of a CFI difference of 0.01 or more to indicate a significant decrease in the fit of a given model (Chen, 2007). For the reader’s information, we also report other commonly used model fit indicators (Chi2, p-value, RMSEA, and BIC). All outcome variables are treated as continuous and listwise deletion is used for the small number of missing cases (below 5%). The models were run in R 3.6.2 (R Core Team, 2019).
Results
Fit indices for measurement models in the pooled data.
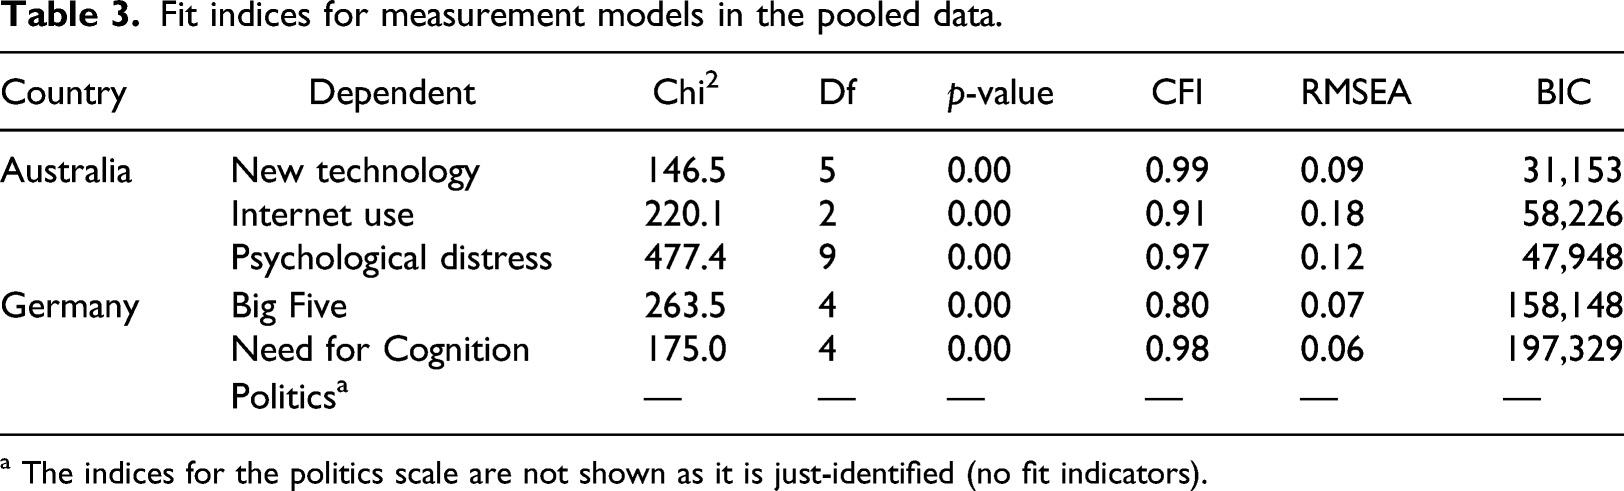
a The indices for the politics scale are not shown as it is just-identified (no fit indicators).
Comparing probability and nonprobability surveys
Equivalence testing of probability versus nonprobability data in Australia, unweighted. Differences in ΔCFI larger than 0.01 are bolded.
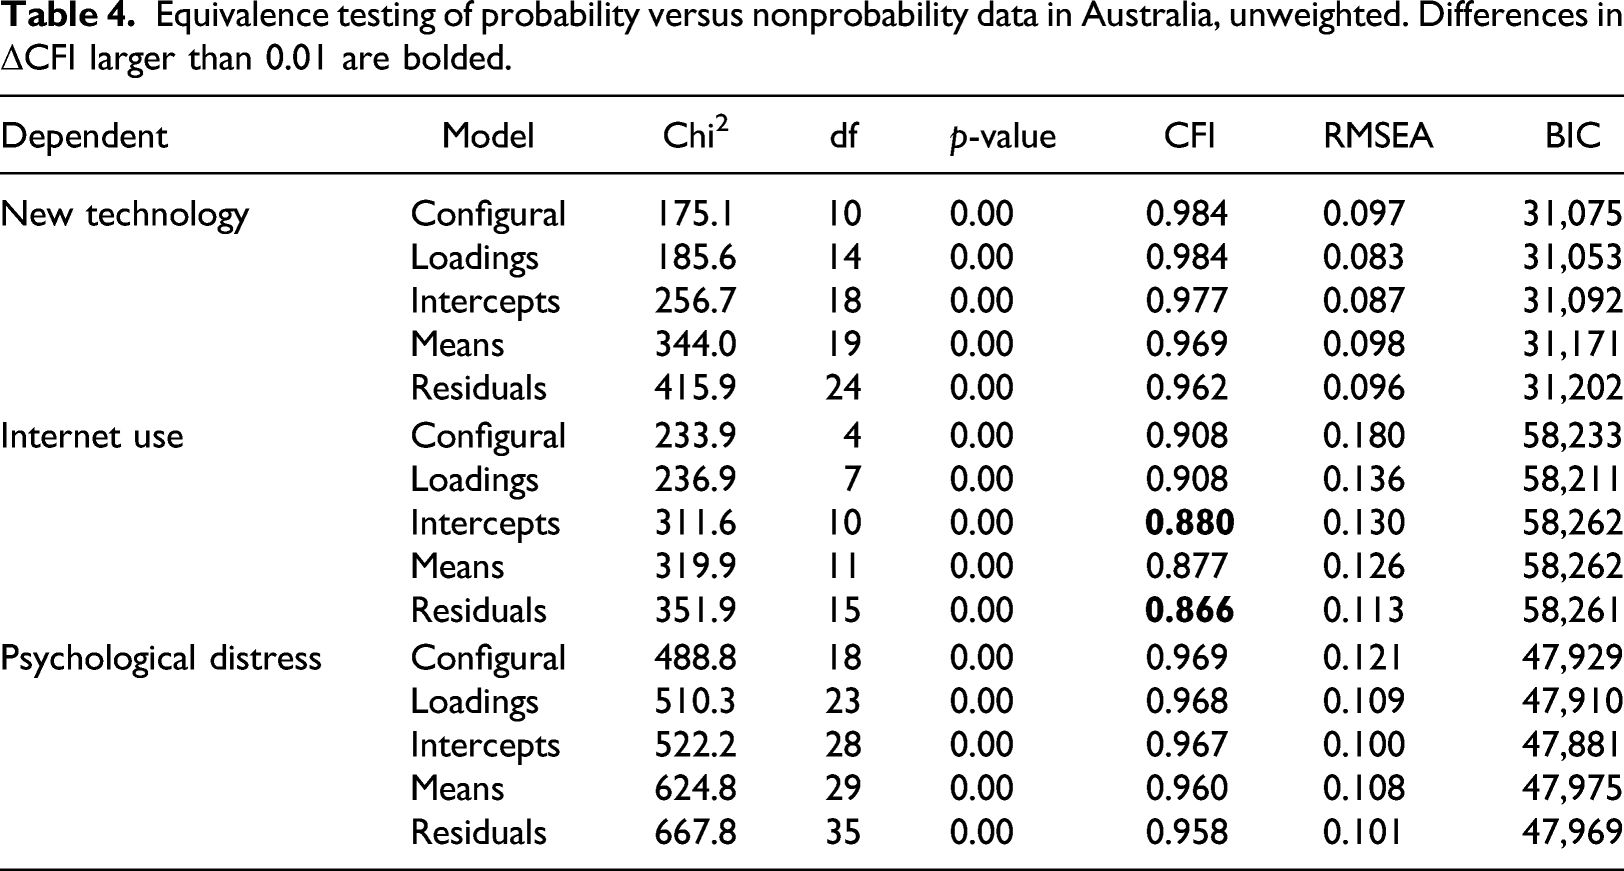
We next look at the coefficients within the Internet use scale that were indicated as significantly different by the ΔCFI. In the nonprobability sample, respondents seem to systematically underreport how often they look for information over the Internet (a4a) compared to the probability sample (the intercepts are 0.61 for nonprobability vs. 0.22 for probability). The opposite is true for using the Internet to post on blogs/forums/interest groups (the intercepts are 1.92 for the nonprobability sample and 2.37 for the probability sample). Mixed results are also found when looking at differences in the residuals with lower estimates (and thus more reliable data) for the nonprobability panel for using the Internet to post images to social media (a4b) and to conduct financial transactions (a4c), and higher estimates (and thus less reliable data) for looking for information over the Internet (a4a) and using the Internet to post on blogs and forums (a4d).
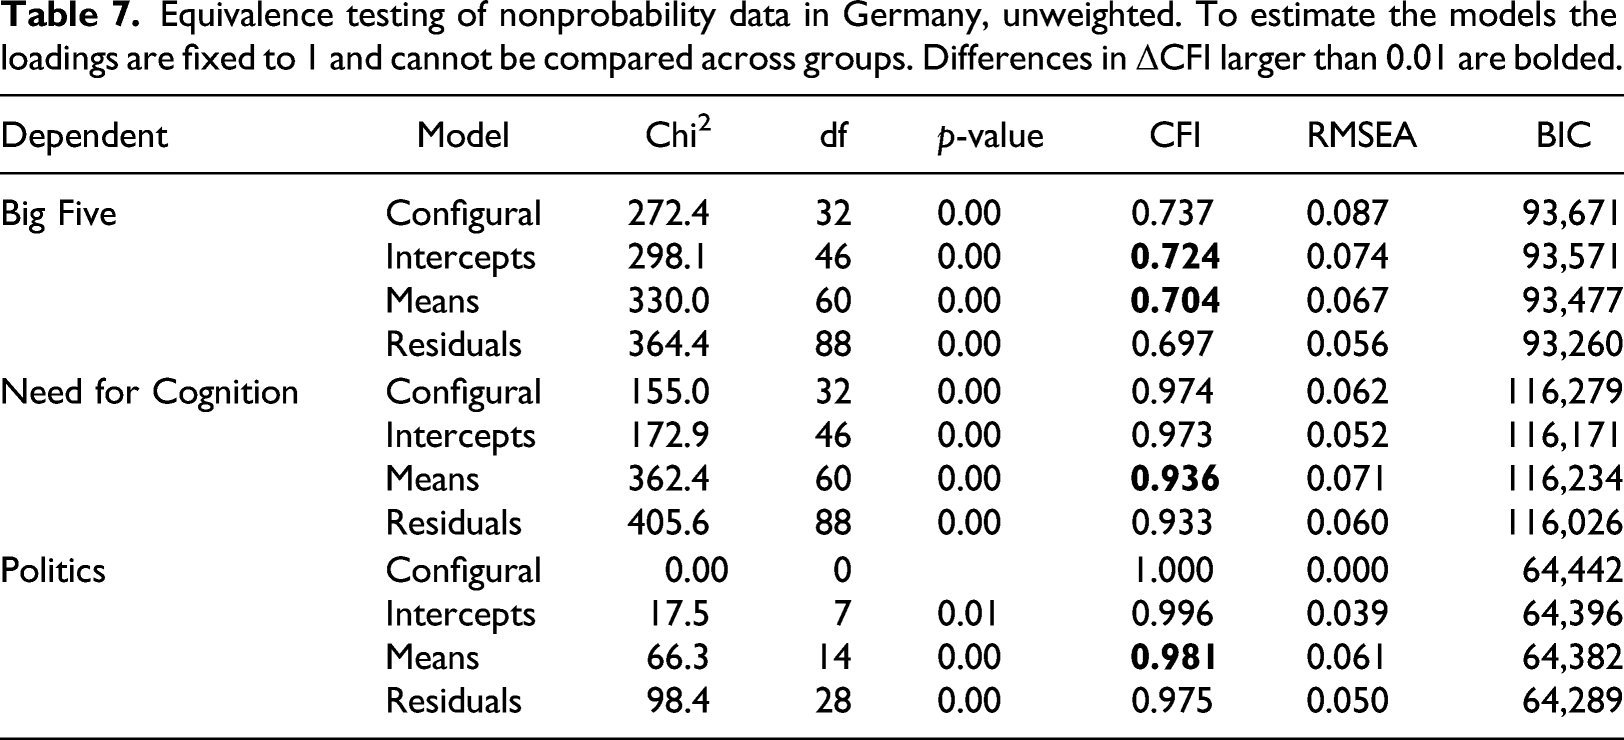
Equivalence testing of probability versus nonprobability data in Germany, unweighted. To estimate the models the loadings are fixed to 1 and cannot be compared across groups. Differences in ΔCFI larger than 0.01 are bolded.
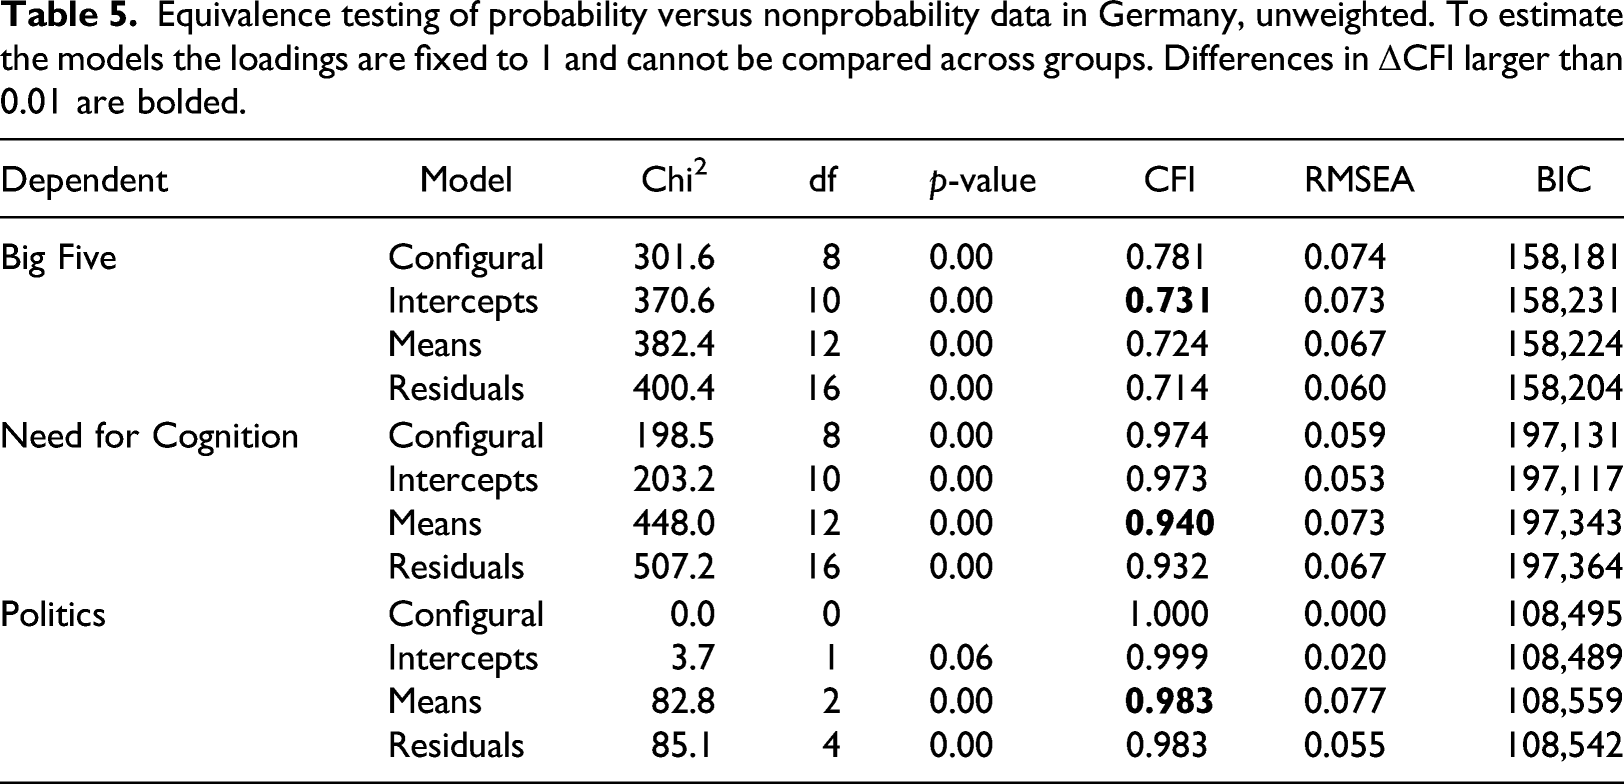
Looking at the model coefficients where measurement equivalence was not found, we find mixed results. For the Big Five scale there are no consistent differences in the intercepts across groups as two of them are higher in the probability data while two are lower compared to the nonprobability data. For the second scale, Need for Cognition, it appears that nonprobability surveys systematically underestimate the mean of the latent variable (2.84 vs. 3.68 for the cognitive persistence factor and 2.55 vs. 3.45 for the cognitive complexity factor) compared to the probability sample surveys. These differences could be the result of higher propensities to provide socially desirable answers in the probability panels (e.g., respondents tend to say they like to be intellectually challenged) or due to higher acquiescence (tendency to agree more). For the politics scale, however, we find that the average of the factor is higher in the nonprobability data (4.14 vs. 3.88), possibly indicating higher social desirability (e.g., more likely to say that they are active in or interested in politics).
In summary, of the six scales compared in this study, four did not achieve full measurement equivalence between probability and nonprobability panels. Only one of these scales (i.e., Internet use) is from the Australian data, where the loadings model is the best fitting one, meaning that covariances can be compared across groups, but no other comparisons can be made. For the German data, the lowest level of equivalence was found for the Big Five scale, where the configural model is the best fitting model, meaning that the factor structure holds across groups, but no other comparisons can be made. For the other scales (Need for Cognition and Politics), the intercepts models fit best, implying that the means of the latent variables can be compared in addition to covariances. Our results show that scales differ in terms of equivalence between probability and nonprobability data. Some scales reach full equivalence while others do not, limiting their use in social research.
Comparing nonprobability surveys
Having identified some measurement differences between probability and nonprobability surveys, we turn to assessing whether measurement equivalence can be established between the nonprobability surveys (RQ2). Comparing the different providers of nonprobability surveys can show whether the measurement structure of latent variables differ between nonprobability panel vendors and hint at the potential impact of methodological choices made by different vendors.
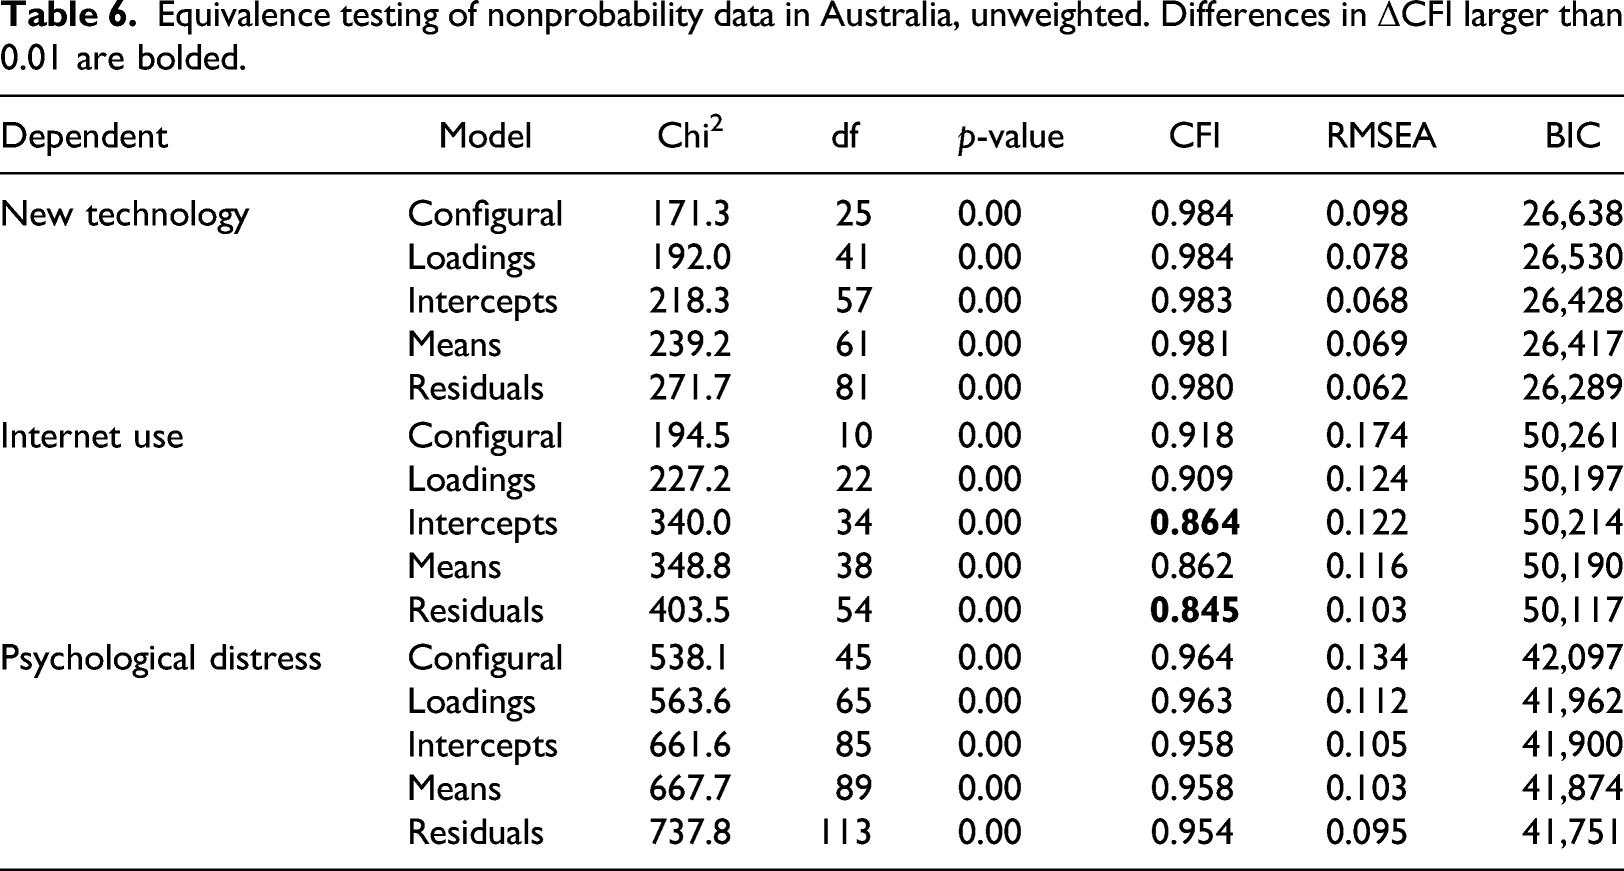
Equivalence testing of nonprobability data in Australia, unweighted. Differences in ΔCFI larger than 0.01 are bolded.
Equivalence testing of nonprobability data in Germany, unweighted. To estimate the models the loadings are fixed to 1 and cannot be compared across groups. Differences in ΔCFI larger than 0.01 are bolded.
In a separate analysis, we also compared measurement models across the two probability panels in Germany and Australia. These results can be found in Tables A1 and A2 of the Online Supplement. The German probability panels differed in Politics (intercepts, means and residuals), Big Five (intercepts), and Need for Cognition (residuals), but other differences were not larger than the ΔCFI threshold of 0.01. In Australia, differences in ΔCFI larger than 0.01 were only found for Internet use (intercepts, means, and residuals) when comparing probability panels. The New technology and Psychological distress scales were fully equivalent across the probability surveys. Thus, in both countries it is apparent that measurement differences (especially of the systematic type) can arise not only between nonprobability panels but also between probability panels.
Do weights correct for differences in measurement?
The final research question (RQ3) is addressed by assessing whether the measurement differences are influenced by differential selection. Differential selection has been highlighted in prior research when comparing probability and nonprobability surveys and nonprobability panel vendors (Dutwin & Buskirk, 2017; Macinnis et al., 2018; Sturgis et al., 2018). To investigate this, we re-ran all previous models with weights that control for selection based on demographic characteristics found in official statistics (see the Method section for a description of the weighting approach for each survey). Next, we compared the model results from the unweighted analyses (previous tables) with those from the weighted models (not shown).
Types of coefficients different by group based on a ΔCFI of 0.01. Bold denotes coefficients that are made similar across groups by weighting while italics denotes those that are made different by weighting.
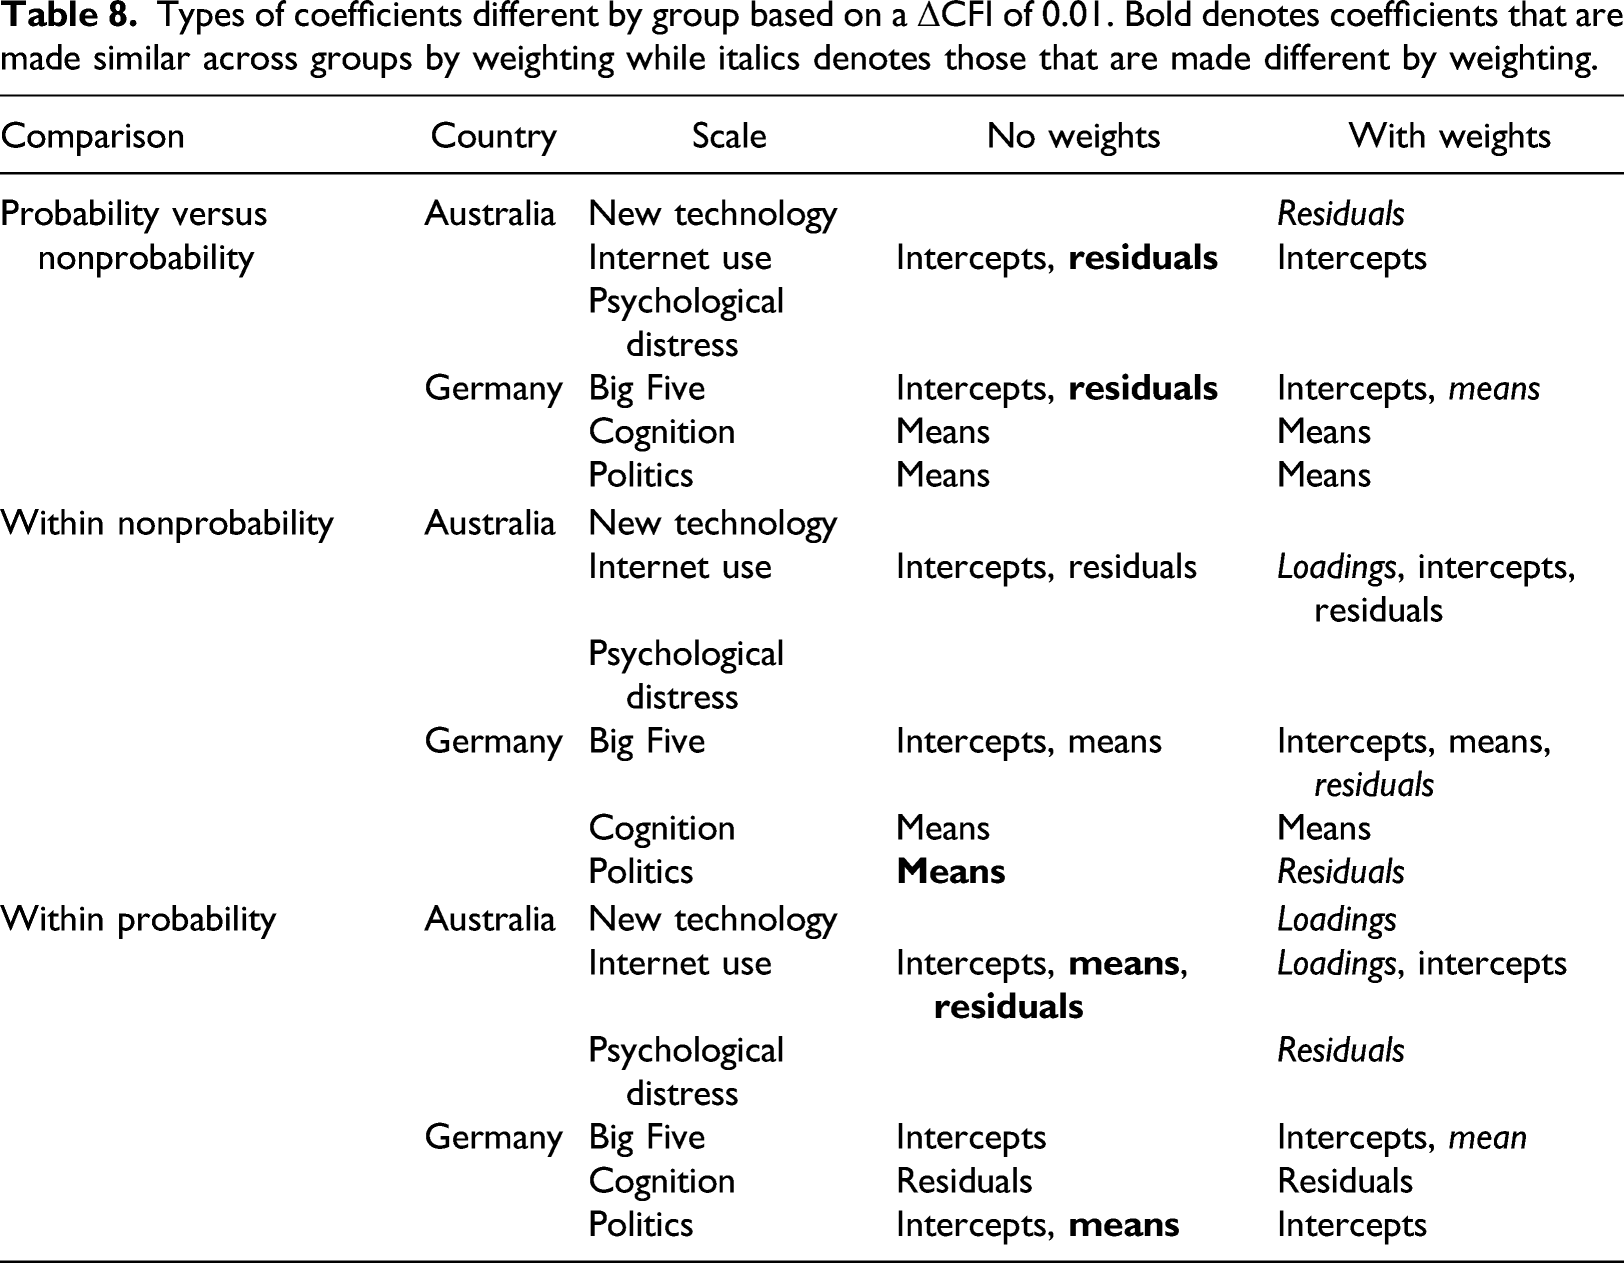
When comparing the different nonprobability panels, the weights shift the means of the Politics scale to be the same across groups while causing the loadings for Internet use and the residuals for the Big Five and Politics to be different. The weights have no effect on measurement equivalence for the New technology and Psychological distress scales. We also find mixed results for the probability online panels where three types of coefficients become similar across panels with the weights, but four other types of coefficients become more divergent. Only the cognition scale is unaffected by the weights.
In short, weighting to account for differential selection does affect several coefficients, but in mixed and unpredictable ways. Some coefficients are made more similar, others more divergent, while others are unaffected by weighting. No discernable pattern is evident, and effects are found with each type of comparison (between probability and nonprobability and within each type). Weighting by demographics can improve measurement equivalence in certain cases, but the effects are heterogeneous and insufficient as a general remedy for ensuring measurement equivalence.
Discussion
This article investigated measurement equivalence between probability and nonprobability panel surveys for several multi-item scales measured in Germany and Australia. Confirmatory factor analysis was used to formally test measurement equivalence between (and within) these two sampling types. Failing to achieve measurement equivalence can be problematic in this context as it means that multi-item scale data cannot be meaningfully combined or compared across the different sample types. Such differences can be indicative of differences in the response behavior or response styles of the respondents.
When comparing probability and nonprobability panels, we found differences in five (out of 27) coefficients tested across the six scales. In Australia, differences were found for two coefficients related to Internet use, while one type of coefficient differed in each of the three scales used in the German surveys. Interestingly, most of the coefficients that were different were related to the average (mean of the factor and intercept). This may be an indication of systematic (related to the mean) differences between the groups. These results suggest that differences in measurement can (but do not always) arise when comparing data from probability and nonprobability samples. Therefore, researchers comparing or combining data from the different types of samples should be wary of drawing inferences before measurement equivalence has been established.
By examining the coefficients that were different we found mixed patterns. There were some signs of systematic differences that could be due to social desirability or acquiescence in some of the means of the latent factors but, again, the pattern was mixed. Although we found differences between probability and nonprobability panels there were no consistent differences to indicate that respondents in nonprobability samples produce more measurement error compared to those in the probability samples and vice versa.
In addition to exploring differences between probability and nonprobability panels, we examined whether measurement equivalence could be established between different nonprobability panels in the same country. The results were similar, as six (out of 27) coefficients were different, and these were the same coefficients that differed in the prior analysis (with the addition of one more difference in Germany). Therefore, comparisons of nonprobability panels face the same types of problems as comparisons between probability and nonprobability panels. Although not a research question, we also tested for measurement equivalence between the probability panels. Those results (presented in the Online Supplement) showed that measurement equivalence is not established for four of the six scales analyzed: Internet use in Australia (intercepts, means, and residuals), and for all scales in Germany (Big Five (intercepts), Need for Cognition (residuals), and Politics (intercepts, means, and residuals)). This is also not ideal, as probability surveys are typically assumed to be the gold standard for measurement and are commonly compared, but they too can sometimes produce non-equivalent measurement results.
Applying weights to adjust for differential selection by demographics did not improve comparability across groups, as some scales became more similar in their coefficients, while others became more divergent. Still, there were some interesting trends in the effects of the weights, as the coefficients that diverged tended to be related to variance (loadings and residuals) while the coefficients that became more similar tended to be related to the average of the latent variable (means and intercepts). This may suggest that compositional differences affect the means, but weighting adds noise to the measurements by inflating the variance. When comparing the probability panels to the nonprobability ones, the weights improved the differences in residuals. These findings show that correcting for selection based on official statistics variables is insufficient to ensure measurement equivalence between different data sources; see also Hox et al. (2015). These results highlight the fact that more work remains in understanding under which circumstances valid comparisons can be made between measurements collected from different sample types.
Also evident from the comparison is that not all scales are affected by the sampling design. For example, all coefficients for the Psychological distress and New technology scales were equivalent, while issues arose with the Internet use scale in every comparison made (probability vs nonprobability, and comparisons within each type). This indicates that measurement equivalence might be more robust for some topics than others.
As with all studies this one has limitations. Our analyses cannot establish whether one sampling approach (probability or nonprobability) produces more accurate measurements than the other, only that they do not measure all scales in the same way. Furthermore, the study was restricted to two countries with a limited number of surveys (Australia: N = 7, Germany: N = 10), which did not use the same scales, and was not designed to assess country-specific effects on measurement equivalence. Future research should focus on testing the effects of the same scales in probability and nonprobability panels in multiple countries and across more survey questions. The samples were also recruited using different survey designs, which may affect response behavior in different ways. This includes reaching the offline population in Germany which may respond in different ways due to their lack of experience interacting with questionnaire forms compared to those who were web users before being recruited to the probability surveys. Finally, we accounted for selection by using weighting adjustments based on demographics to control for compositional differences between the samples; however, there is always the risk that weights do not completely explain the selection mechanism. Future research could examine the effects of weighting on variables other than demographic characteristics, or on different weighting adjustment approaches than the logistic regression procedure that was used here.
This study has found differences in measurement for probability and nonprobability panel surveys, and within each sampling type. The differences between the two sample types were not larger than those found within each type. Full measurement equivalence can therefore not be guaranteed in any of the comparisons, although many coefficients were equivalent. The practical implications of these findings are that before combining or comparing data from different types of samples, in addition to accounting for differences in selection, measurement equivalence should be tested and established for multi-item scales. This could be done using multi-group CFA, as we have done. If differences in the measurement structure of latent variables are identified using CFA, then users can attempt to establish partial equivalence by relaxing the parameter restrictions for the problematic questions (Byrne et al., 1989), given that all parameter restrictions hold for at least two of the other questions measuring the latent construct. This approach can also be used to correct for differences in measurement across samples. By using the latent variables, as opposed to the observed variables or sum scores, researchers will then be able to validly combine or compare the concepts between probability and nonprobability samples.
In conclusion, we find that measurement equivalence is not ensured when combining or comparing data from different probability and nonprobability panels. Differences in measurement equivalence were found between probability and nonprobability panels and within each type and demographic weighting adjustments did not consistently resolve these discrepancies. While this study has shown the importance of testing for measurement equivalence when using survey data from different sources, it is only a first step. Understanding the specific mechanisms that lead to non-equivalence is still an open question and an important topic for future research.
Supplemental Material
Supplemental Material - Measurement equivalence in probability and nonprobability online panels
Supplemental Material for Measurement equivalence in probability and nonprobability online panels by Hafsteinn Einarsson, Joseph W Sakshaug, Alexandru Cernat, Carina Cornesse, and Annelies G Blom in International Journal of Market Research
Footnotes
Declaration of conflicting interests
The author(s) declared no potential conflicts of interest with respect to the research, authorship, and/or publication of this article.
Funding
The author(s) disclosed receipt of the following financial support for the research, authorship, and/or publication of this article: This work was supported by German Research Foundation (139943784 (SFB 884)) and German Federal Ministry of Education and Research.
Supplemental Material
Supplemental material for this article is available online.
Note
References
Supplementary Material
Please find the following supplemental material available below.
For Open Access articles published under a Creative Commons License, all supplemental material carries the same license as the article it is associated with.
For non-Open Access articles published, all supplemental material carries a non-exclusive license, and permission requests for re-use of supplemental material or any part of supplemental material shall be sent directly to the copyright owner as specified in the copyright notice associated with the article.