
Abstract
Multimodal design in educational videos is a complex task, requiring the effective integration of various semiotic modalities to promote understanding among recipients. While superficially meeting proposed multimedia design principles, educational videos vary significantly in effectiveness. To explore this variation, the authors conducted a 2 × 2 experimental study with 45 students, examining the impact of instructor presence and dynamic vs static slide designs on eye gaze behaviour and learning outcome. Instructor presence was found to attract about 25 percent of visual attention away from presentation slides irrespective of their static or dynamic design, but learning gain was highest for dynamic videos with a visible instructor. This suggests that gaze behaviour and learning outcome do not correlate with the simple presence or absence of design features and a finer-grained approach is needed. The authors consequently applied a framework for multimodal cohesion analysis to relate individual design elements to a video’s discourse structure more tightly, finding that quantitative differences in cohesion predict differences in gaze behaviour between dynamic and static slide presentations, but irrespective of instructor presence. Future research will therefore need to formulate corresponding finer-grained pre-post knowledge tests to further correlate between discourse structures, gaze behaviour and learning outcome.
Keywords
Introduction
Educational videos are increasingly complementing or even replacing textbooks in formal education contexts (e.g. Bétrancourt and Benetos, 2018; Kay, 2012; Schmidt-Borcherding et al., 2020). While basic learning principles should remain unaffected by specific learning media (see Clark, 1983; Kozma, 1991), some characteristics of educational videos demand closer attention (Fiorella, 2021). Educational videos are strongly audiovisual, involving a very diverse range of semiotic modes. This multimodality, in combination with the transient nature of video, raises particular cognitive and perceptual demands on the learner. Effective design should help mitigate these demands. While educational videos both by their nature and design already fulfill a range of broad learning principles (La Torre and Désiron, 2024; Mayer, 2001), it is still unclear just which design features support effective learning: a number of studies have put forth contradictory findings, where even fundamental design elements, such as the display of a ‘talking head’ or redundantly combining text and images, are found to be advantageous in some cases but not in others (e.g. Eitel and Scheiter, 2015; Richter et al., 2016). Consequently, dichotomous variables concerning the mere presence or absence of design features are insufficient for predicting the effectiveness of educational multimodal material. More fine-grained descriptions will be necessary.
Bateman and Schmidt-Borcherding (2018) propose that the instructional quality of educational videos should depend on their construction of correspondences between the semiotic modes in use and the sensible deployment of those modes to form a video’s discourse. From this perspective, the instructional quality of an educational video should be derivable from an appropriately fine-grained description of its discourse structure while, from an empirical perspective, instructional quality should result in reasonable learning processes and positive learning outcomes.
This article brings these two perspectives together by combining an experimental reception study on specific design features of an educational video with fine-grained multimodal analysis. The experimental study focuses on two design features expected to affect attention allocation and subsequent learning outcomes: (i) the use of a dynamic, successive appearance of visual elements that may guide visual attention and facilitate learning, and (ii) the presence of an instructor on the screen, which may challenge the visual attention devoted to the visualizations and, hence, hinder rather than help learning. Besides learning outcome, we also observe interaction with the multimodal text by eye tracking. The observation of gaze behaviour as measured by eye tracking serves two functions: differences in attention allocation may help explain effects on learning outcome between experimental conditions, while the gaze behaviour itself may be predicted by a sufficiently precise multimodal description of the stimulus material. The main purpose of the multimodal analysis is then to capture the discourse structures of educational videos in a way that allows us to test whether these structures are consistent with learners’ gaze behaviour, which may in turn be related to learning outcomes.
Instructional Design of Educational Videos: Signalling and Instructor Presence
Due to its multimodal nature and purpose to facilitate understanding, multimedia learning typically imposes a high cognitive load. Two common design features of educational videos that have been found to gain and guide attention to ease that load are the use of signalling and instructor presence. This section discusses to what extent previous studies have delivered empirical evidence for how these two features might be effective design tools with regard to promoting learning. As findings are somewhat contradictory, several further research implications are raised.
Signalling is the practice of guiding a learner’s visual attention towards relevant referents through design features such as the synchrony of verbal speech and appearance of visual elements (temporal contiguity principle: Mayer, 2009) and other forms of visual highlighting, e.g. by animation. Such features are subsumed under what is termed the signalling or cuing principle of multimedia learning (Van Gog, 2021). Such principles have been investigated in a range of media, including, for example, infographics (e.g. Holsanova et al., 2008). Although a natural hypothesis would be that including more signalling should result in more effective designs, empirical evidence for this turns out to be mixed. This may be due to experimental studies often treating signalling as a dichotomous variable, that is, signals are either used or not used. Consequently, when probing the utility of signalling, many eye-tracking studies (e.g. Jamet, 2014; Jian et al., 2014; Ozcelik et al., 2009, 2010; Richter and Scheiter, 2019) make the assumption that it is sufficient to simply note the presence or absence of signals along the lines of arrows/no arrows, animations/no animations, colour codes/no colour codes, and so on. Intended references of signals are assumed to be straightforwardly recoverable.
The function of signalling is, however, complex. In the ideal case, signals need to adhere to the cognitive processes of selection, organization and integration (see Fiorella and Mayer, 2021; Mayer, 2001, 2021; Mayer et al., 2020). Appropriate cues thus have to make relevant information perceptually more salient in order to draw a learner’s attention, which facilitates selection of this information and reduces the risk of missing it while the video continues. The functions of organization and integration, in which a learner has to process which parts of the multimodal material belong together, demand even more complex cognition. A dichotomous treatment of the signalling variables can then readily mask more subtle effects because signalling features cannot be assumed to be equally effective across different videos or even across different places within a single video. Elements subsumed under the signalling principle must be implemented in a coherent manner in order to allow a learner to perform the complex cognitive tasks of selection, organization and integration required. This is challenging for design, especially with this kind of medium becoming ever more complex in its multimodal diversity. Failing to characterize design choices sufficiently is then a source of uncontrolled variation that needs to be accounted for.
In order to differentiate the effectiveness of a signal, therefore, a more continuous, non-dichotomous treatment of design variables is needed. This can be provided by motivated treatments of the unfolding local context of any signals deployed. In particular, analysing the discourse structures resulting from varying designs may deliver a more fine-grained metric for evaluating the extent to which signals may succeed in identifying appropriate referents in the discourse and, as a consequence, also offer an indication of how strong the effect on attentional guidance can be assumed to be. Below we suggest that a more fine-grained description particularly of a video’s cohesive structure may provide such a metric and so help in understanding how specific forms of signalling facilitate the organization and integration of a video’s content.
Instructor presence presents another main issue of research on educational videos (Fiorella, 2021) but studies regarding learning outcomes related to instructor presence also show divergent results. On the one hand, there is empirical evidence that instructor presence facilitates learning (e.g. Bateman and Schmidt-Borcherding, 2018; Chen and Wu, 2015; Colliot and Jamet, 2018; Wang and Antonenko, 2017). On the other hand, there are studies that fail to find such positive effects (e.g. Schmidt-Borcherding and Drendel, 2021; Van Wermeskerken et al., 2018; Wang et al. 2004; for a recent meta-analysis, see Beege et al., 2023). Here again, many of these studies have tended to consider instructor presence as a dichotomous variable; that is, in some videos the instructor is visible, in others not. Similar to signalling, however, the phenomenon itself is intrinsically far more complex. If visible, visible features could be the face, the torso or the whole body, showing the instructor’s gaze direction, gestures, and even performed actions such as drawing, and so on. Non-dichotomous treatments of instructor presence may therefore help in understanding these inconsistent results as well.
We propose that a closer look at the underlying attentional processes may be beneficial for this. For example, measuring learners’ gaze behaviour with eye-tracking, Van Wermeskerken et al. (2018) found that in their videos a visible instructor attracted 30 percent of visual attention, although there were no differences in learning outcomes between videos with vs without a visible instructor. In the first place, this suggests an ‘inverted signalling effect’ on visual attention in that a visible instructor drags attention away from relevant content. From this perspective, the best a visible instructor can do is not to hinder the learning process. Complicating the matter further, however, the instructor’s eye gaze, gestures and actions can themselves serve as signals. In an eye-tracking study with video-based modelling examples (Ouwehand et al., 2015), students spent more time gazing at the instructor than at the task area the instructor referred to. If, however, the instructor gazed at the task area or if the instructor gazed and gestured at the task, students spent relatively more time gazing at the task area compared to when the instructor looked straight into the camera. They concluded that gestures and gaze behaviour can serve as cues to direct the learners’ attention away from the instructor and towards the task when appropriately placed.
These issues illustrate that it will also be necessary for instructor presence to distinguish more clearly between the presentation characteristics of an educational video and their presumed function in information processing – that is, again, the selection, organization and integration of information by the learner. The mere physical presence of an instructor on the screen may have a disturbing effect on information processing, while the same instructor may serve as a useful signal as soon as they point to some relevant area in the accompanying visual presentation. In precisely the same fashion, a colour, an appearing circle, or a flashing arrow may help or hinder information processing depending on how obviously appropriate references can be perceived and attended to by the learner.
These varied design features also have motivational and affective effects. However, for current purposes, we now focus on the cognitive and attentional processes involved. In order to move beyond dichotomous characterizations of the phenomena, we differentiate between a coarse-grained and a fine-grained perspective on attention during information processing. The coarse-grained level roughly corresponds to the issue of attending to relevant information at all, that is, the appropriate selection of information. Many of the eye-tracking studies referenced above chose this approach by reporting overall gaze durations on comparably large visual areas. In order to describe specific design features in terms of their function for organizing and integrating information, however, we also need a more fine-grained level. The study presented here articulates such a fine-grained level of analysis building on and refining the prior mentioned broad studies so that we can explore just which kinds of multimodal discourse structures may facilitate and aid processing best.
A Descriptive Framework for Fine-Grained Cohesion Analysis in Educational Videos
In Thiele et al. (2024) we presented a descriptive multimodal framework for educational videos which offers a fine-grained level of formal description of the kind motivated in the previous section. This framework enables one to pin-point traceable multimodal features of an educational video’s design which may contribute to the effectiveness of its signalling. In particular, Thiele et al. showed how a description of the multimodal cohesion of concrete multimodal elements across all the various forms of expression that are employed (visual modes: diagrammatic, compositional, graphic, etc.; verbal modes: written, spoken; etc.) offers a tighter perspective on features than that provided by the rather under-specified signalling principles above.
Originally, cohesion was regarded as a source of cues for monomodal textual interpretation (Halliday and Hasan, 1976), identifying those textual elements within a text that require other textual elements within the same text in order to be sufficiently identified. The most straightforward example for this is the occurrence of pronouns in a text which are ‘dependent’ on the occurrence of a referent in the same text so that a recipient can build an ‘interpretative bridge’ to that referent. Although traditionally developed in linguistic contexts, here we follow Tseng (2013) in regarding cohesion as a multimodal phenomenon: the function of multimodal cohesive connections is then hypothesized as guiding recipients in bringing together different sources of information, corresponding to the organizing and integrating function introduced above. Moreover, and crucial for our current concerns, each such connection can potentially be conveyed
A central aspect of cohesion as we develop it here is then the notion of phoricity, that is, the direction of cohesive connections, or co-references. A co-reference can be prospective, as in ‘looking forward’ to referents in the text, termed cataphora, or retrospective, as in ‘looking back’ to referents in the text, termed anaphora. While in the mono-modal case this account is sufficient, it does not cover discursive processes in multimodal contexts; several quite specific extensions need to be made. One of these concerns the fact that, in any multimodal artifact, there may be several cohesively related units co-present even within single semiotic modes, both spatially and temporally. Such units can build cohesive links to one another and, moreover, in a time-based medium can do so while co-occurring at the same time. To cover such situations, therefore, we propose a third kind of phoric relation, which we call co-phoric.
In order to document the deployment of these specific cohesive connections in any video, we annotate our data. The framework for annotation we have developed includes two steps: (i) the temporal and formal registration of all modes involved in an educational video; and (ii) the temporal registration of their cross-modal connections over the course of the video’s discourse. Both types of information are annotated in layers. Layers correspond to distinct kinds of information separated according to individual semiotic modes and linked back to the original data through timestamps. To capture this information, we use the annotation software ELAN (developed at the Max-Planck Institute in Nijmegen, see Wittenburg et al., 2006; ELAN, 2023) and its notion of tiers, which allows information to be stored in multiple layers as required.
Step (i): Annotation of modes
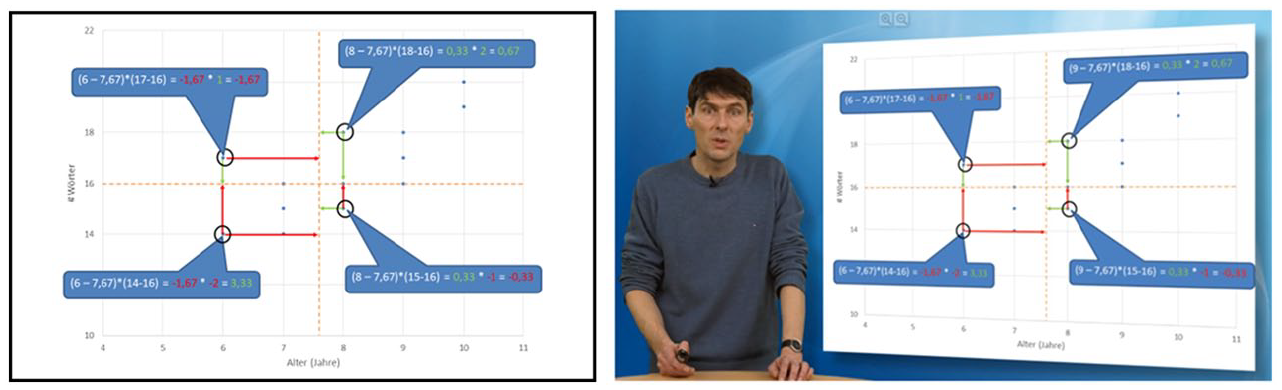
For step (i), each unit of a particular mode receives its own layer of information through a tier, documenting the type of mode and the temporal extent of the presence of the mode unit. Additionally, we also annotate visual information when necessary in order to document other types of cohesion, such as linking by colour or shape. To briefly illustrate this first step, Figure 1 shows a screenshot of the self-produced educational video we use in the study reported below, in which visual information in the slides appears successively and synchronously with the verbal speech. The topic of the video is mathematical covariance and correlation; the instruction is conducted in German. In the example screenshot, the instructor is discussing some data points present in the displayed diagram.
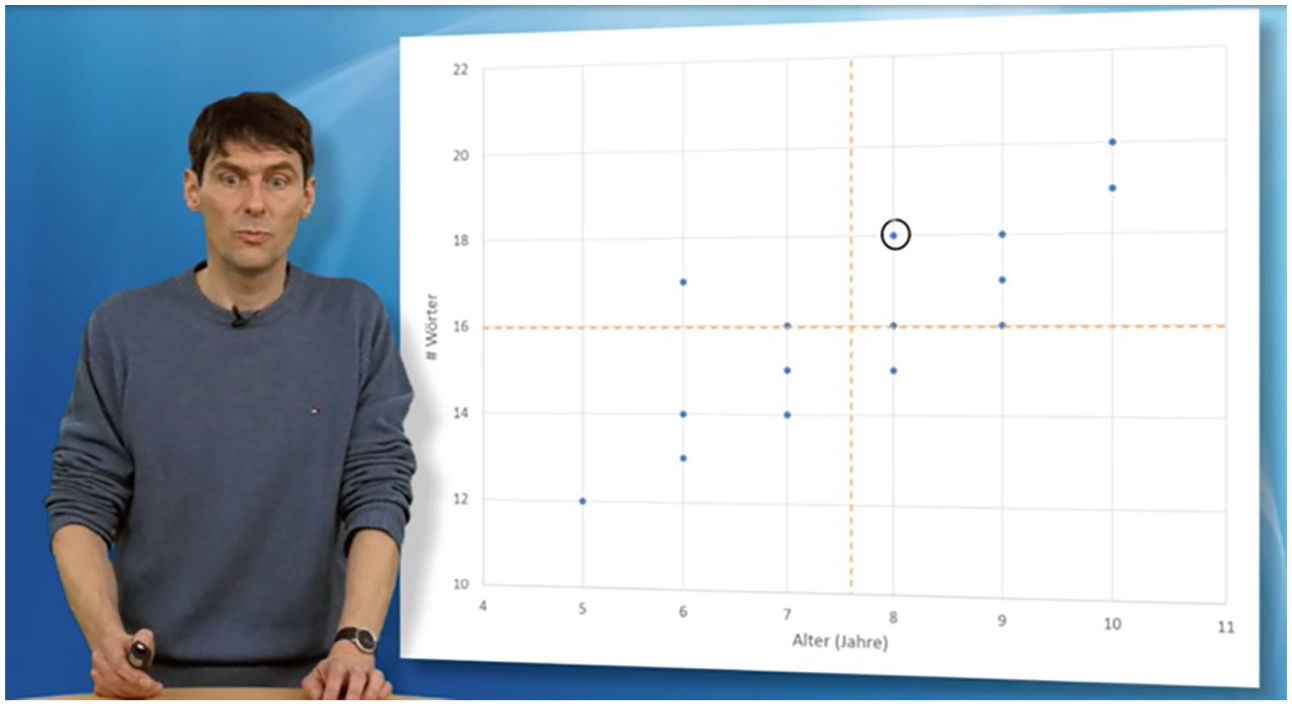
Screenshot from an educational video on covariance and correlation.
In Figure 2, we show the basic principles of our annotation framework for this example in an abstract, simplified way. The extra-textual numeric red identifiers 1, 2 and 3 in the upper part of the figure overlaying the original presentation single out illustrative examples of the units of the semiotic modes present in this specific time-frame of the video’s timeline. In addition, the accompanying spoken language is represented in the upper portion of the figure as a superimposed speech-bubble. The verbal text says: ‘. . . dieses Kind hier . . .’ (English translation: ‘. . . this child here . . .’). Several more modes are at play in this specific example, such as the sub-parts of the overall diagram (numbers, labels, mean values, etc.) but for illustrative purposes and space reasons these are omitted here.
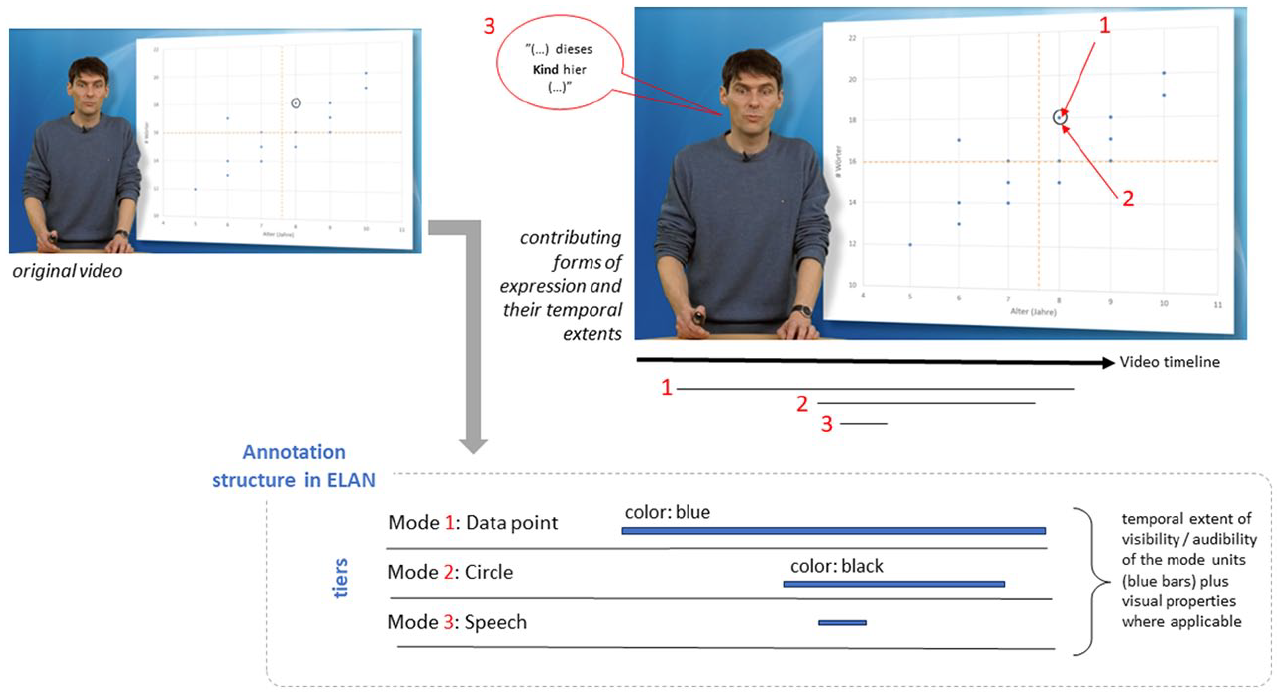
Schematic representation of temporal and formal annotation in ELAN.
As can be seen in the lower part of Figure 2 (‘Annotation structure in ELAN’), each of the identified units then receives its own tier of information. Mode 1 refers to a data point as part of the overall diagram shown; mode 2 represents a black circle around the data point; and mode 3 marks the verbal speech spoken by the instructor. The tiers for the units 1–3 are labelled according to their specific modes. The temporal extents of the units are indicated through time segments shown as horizontal blue lines. Moreover, if a mode-unit shows some specific visual properties, that information is added to the tiers as well (indicated in the figure above the horizontal blue lines).
Step (ii): Annotation of cohesive connections
The second step of annotation focuses on documenting the ‘interconnectedness’ of (units of) semiotic modes. For current purposes we focus on cohesive references between modes as described above. In order to analyse which kinds of cohesive relations are at play in an educational video, we base this part of our framework on the methodology developed by Tseng (2013), which analyses cohesive links multimodally, i.e. across modes. Within this method, ‘cohesion diagrams’ are built to visualize linked discourse relations between modes as well as the co-occurrence of different units within the same mode. By these means, one can track different discourse relations across the whole extent of a multimodal text, both between and within the same modes, indicating the discourse structure.
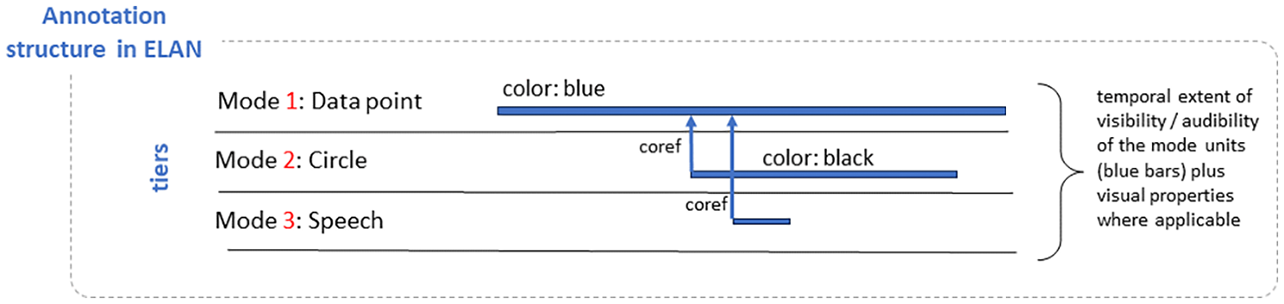
To capture this referential linking information, we introduce new sets of tiers which contain temporal information concerning when references co-occur and the tiers, or units, engaged in those references. Figure 3 shows this additional information as blue vertical arrows to indicate which tiers are in a ‘co-reference’ relation (abbreviated as ‘coref’) with other tiers. The temporal information here allows us to differentiate between the different types of phoric references (i.e. anaphoric, co-phoric and cataphoric).
Schematic representation of annotation functionalities in ELAN, extended for coreference information.
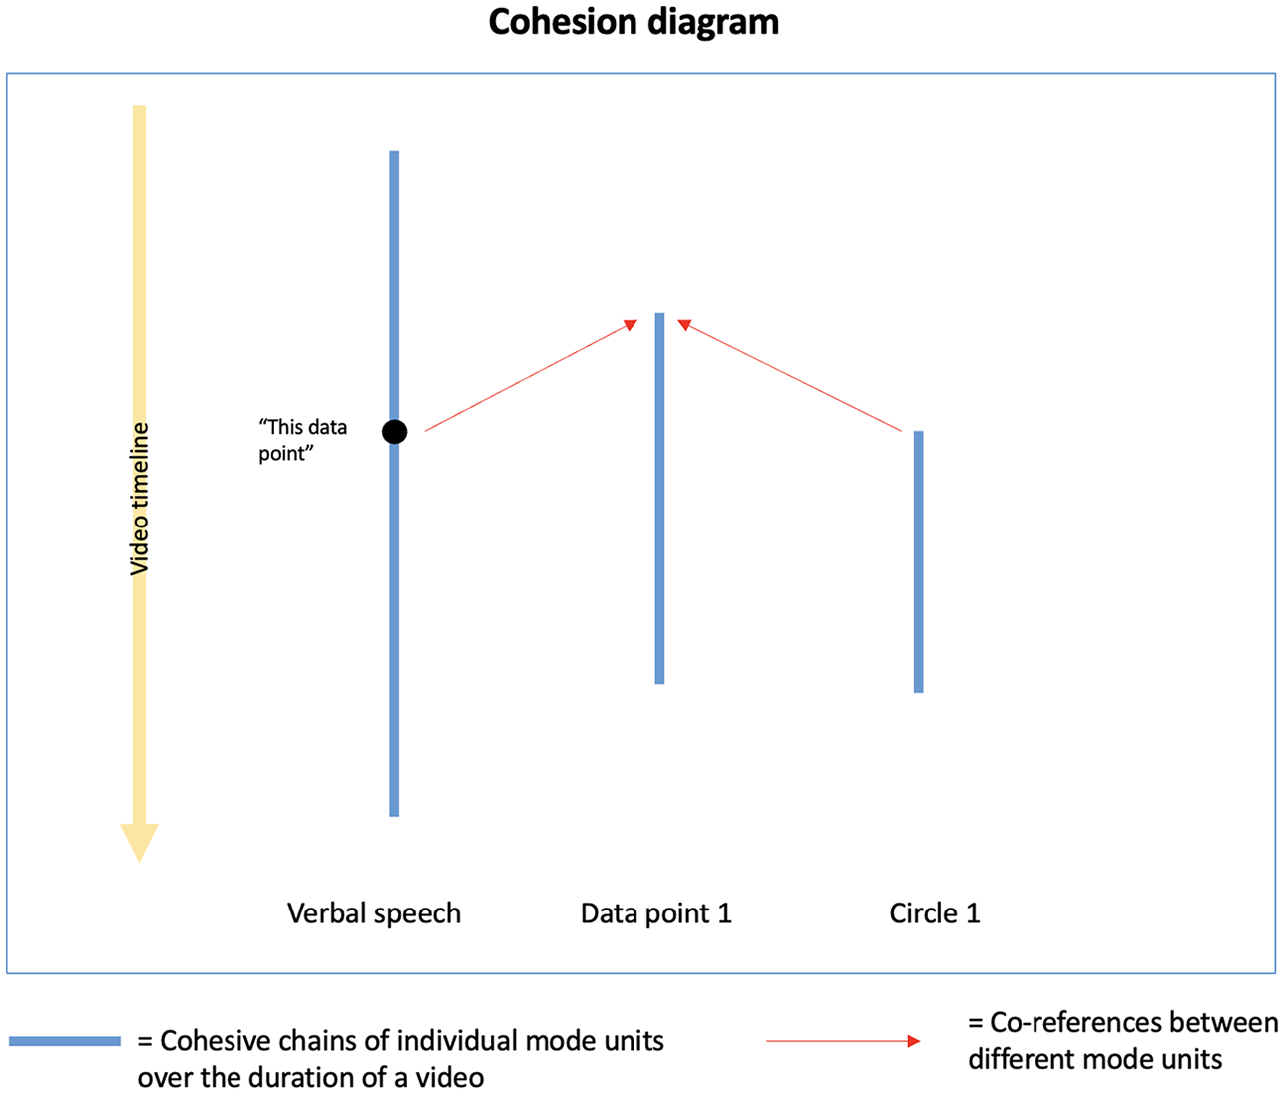
The information from the annotations covered in Figures 2 and 3 are then combined into cohesion diagrams. Figure 4 shows the resulting diagram in a simplified way. The information from the ‘coref’ tiers is visualized as follows: the various mode units that participate in cohesive references are shown running across the horizontal axis; the temporal extents of these units are represented by blue vertical lines. The times when cohesive references occur are indicated by placement on the vertical axis. Cohesive connections between mode units are displayed via horizontal dashed arrows. In the figure, for example, both the verbal speech element and circle co-reference data point 1 in the middle.
Schematic representation of cohesion diagrams.
As can be seen from the vertical axis on the left-hand side of the figure, these different mode units occur at varying positions along the video’s timeline and are also visible and/or audible at different points in time. They also refer to each other at different times. More specifically, as both these references are established after the data point has appeared, they are regarded as anaphoric references according to our phoricity definition. Determining at what point a reference becomes anaphoric or cataphoric rather than co-phoric is still an open research issue related to how we can fix the precise boundaries of simultaneity; for the discussion below we work with an initial threshold of ⩽ 5 seconds.
In earlier accounts of cohesion, these kinds of relations were tracked manually; our account extends this for semi-automatic analysis by processing the ELAN annotations directly with R (R Core Team, 2016). Depending on the amount of data one is examining, these diagrams can become quite complex. We see some such examples in our discussion below (see Figure 9) and several more complex examples are given in Thiele et al. (2024), where the precise rendering of the information within ELAN is also described. In the automatically generated diagrams, we colour-code the different phoric relations: red arrows denote anaphoric relations, while blue arrows denote co-phoric relations. There were no cataphoric relations in the data discussed here.
In this section, we have explained the functionality of our framework for documenting semiotic modes involved in educational videos and for tracking cohesive references across those modes via cohesion diagrams. The detailed characterization of discourse structure offered will serve below as a way of capturing the fine-grained placement of particular signalling cues and potential inter-relationships with instructor presence. In the following sections, we show how we connect gaze data obtained from a reception study with phoricity data captured with the framework presented in this section in order to evaluate to what extent certain discourse structures might impact gaze behaviour and ultimately learning outcomes.
Reception Study
In this section, we report on a reception study which addresses both the coarse-grained and fine-grained levels of information processing and attention allocation in learning with an educational video. The section is divided into three parts: (i) presentation of the experimental study and coarse-grained analyses of learning outcome and gaze behaviour; (ii) multimodal description of experimental conditions in terms of ‘phoricity’ and derivation of testable predictions of gaze behaviour; and (iii) fine-grained analyses of how well the description of the material fits to actual gaze behaviour.
The experimental manipulations selected ask to explore the effects of visual signals and instructor presence on attention allocation and learning. However, the two variables are initially described in their visual appearance, while their presumed function in information processing is approximated by the fine-grained multimodal cohesion description. That is, visual signals appear as dynamic or static elements on presentation slides. Instructor presence is realized as a mere physical presence on the screen, i.e. purposely avoiding as much as possible any additional, potentially cueing visible behaviour of gesturing or pointing and the like.
While specific, fine-grained hypotheses for the particular gaze behaviour are only derived and tested in the respective subsections, hypotheses concerning the coarse-grained analyses can already be derived from the theoretical considerations and empirical evidence presented above. The cognitive effects of dynamic visualizations and instructor presence may be reduced to the matter of how much they serve appropriate attention allocation. In addition, given that dynamic presentation of text elements, circles, arrows, etc. are appropriate forms of signalling, we predict higher learning outcome for an educational video with dynamic compared to static slides.
It is not yet clear how instructor presence may interact with this effect. On the one hand, if the instructor has no signalling function, their visibility should at best have no effect on learning outcome. On the other hand, if instructor presence interferes with the attention allocation to presentation slides, a visible instructor should lead to especially poor learning outcomes. That is, a visible instructor is expected to have no or detrimental effects on learning outcome.
Eventually, instructor presence may also interact with the mode of slide presentation. A possibly detrimental effect of instructor presence on learning due to their visual salience (see above) might be compensated by appropriate signalling via dynamic slide presentation, for example. That is, any effect of signalling (Hypothesis 1) should be comparably stronger in the presence of distractors such as a visible instructor presence. In other words, we expect an interaction effect between slide presentation and instructor presence on learning outcomes with a stronger signalling effect in the presence of an instructor.
Such an interaction should also be observable in gaze behaviour. That is, the ratio of visual attention distribution between slides and instructor could be expected to shift towards the slides if they are dynamic rather than static.
Experimental design
The sample consisted of 45 students of education sciences (mean age = 24.93 years; 35 female) who participated in the study as part of a course requirement. Students were asked to learn about covariance and correlation with a 10-minute educational video consisting of 15 presentation slides shown on a 15” laptop screen. The video varied based on a 2 × 2-design with the factors slide presentation (dynamic vs static) and instructor presence (slides with instructor vs slides only). Participants were randomly assigned to the four experimental conditions: dynamic slides with instructor (12 participants), static slides with instructor (11), dynamic slides with slides only (11) and static slides with slides only (11).
The content of the slides and the verbal explanation were the same in all four conditions. In the dynamic conditions, individual elements of the presentation slides in the video (sequential text elements, diagrams, circles, arrows, colour coding, etc.) occur dynamically and synchronously with the verbal speech. In the static conditions, the compositional elements of an entire slide being presented do not occur successively but concurrently ‘all at once’, and are consequently not generally synchronous with the speech. In the slides with instructor conditions, the instructor was shown standing to the left of the presentation slides while, in the slides-only conditions, the slides filled the whole screen (see Figure 5). The visible instructor did not interact physically with the slide materials.
Example screenshots of the experimental presentation conditions slides-only (left panel) and slides with instructor (right panel).
Learning outcome and gaze behaviour served as dependent measures. Learning outcome was measured with a (pre-post) knowledge test. The test and the corresponding scoring scheme were adopted from a study by Schmidt-Borcherding et al. (2020). The test consisted of seven open answer items (e.g. ‘How are covariance and correlation related? What similarities and what differences result from this?’), which were administered directly before and after the video. Answers were scored by giving one point for each of a maximum of 23 idea units of the scoring scheme (e.g. ‘The correlation is calculated from the covariance’ (1 point), or ‘In contrast to covariance, the value range of correlation is limited’ (1 point)). The inter-rater reliability of this scheme was satisfying (Cronbach’s alpha = .80 – .83). Gaze behaviour of each participant was recorded by having the participants wear eye-tracking glasses while learning with the video. For this, we used a head-mounted eye tracking system (Tobii Pro Glasses 2) with a sampling rate of 50 Hz. The eye tracking glasses recorded (i) the gazes of both eyes (i.e. binocular) and (ii) the visual stimuli in front of the students’ eyes. Students were tested in single sessions in a windowless room.
Learning outcome
An analysis of variance (ANOVA) with the four experimental conditions as between-subjects factor and prior knowledge as dependent measure revealed no statistically significant differences in prior knowledge between the participants across experimental conditions, F(3,41) < 1. In order to then estimate the learning gain irrespective of experimental conditions we calculated a repeated-measure t-test with pre-test (M = 2.11, SD = 2.66) and post-test (M = 5.38, SD = 3.56) scores of the knowledge test for the whole sample. Participants had an overall learning gain with a very large effect size of more than one standard deviation, t(44) = 7.316, p < .001, d = 1.10, which corresponds to a mean score gain of approximately 3 points. We then calculated the individual learning gain for each of the 45 participants by subtracting the pre-test knowledge scores from the post-test knowledge scores. Three participants obtained a negative gain (one participant each in the slides only/dynamic condition and both of the slides with instructor conditions, respectively) and were excluded from further analyses. In the context of the very large effect size of learning gain in the sample, the lack of gain cast doubts on the validity of these participants’ data. Hence, the following analyses are based on 42 data sets.
A two-factorial ANOVA with the fixed factors slide presentation (dynamic vs static) and instructor presence (slides with instructor vs slides only) and the learning gain as dependent variable revealed no main effect for slide presentation (F(1,38) = 2.40, p = .13) or instructor presence (F(1,38) = 1.89, p = .18), but a significant interaction effect (F(1,38) = 7.54, p = .01,
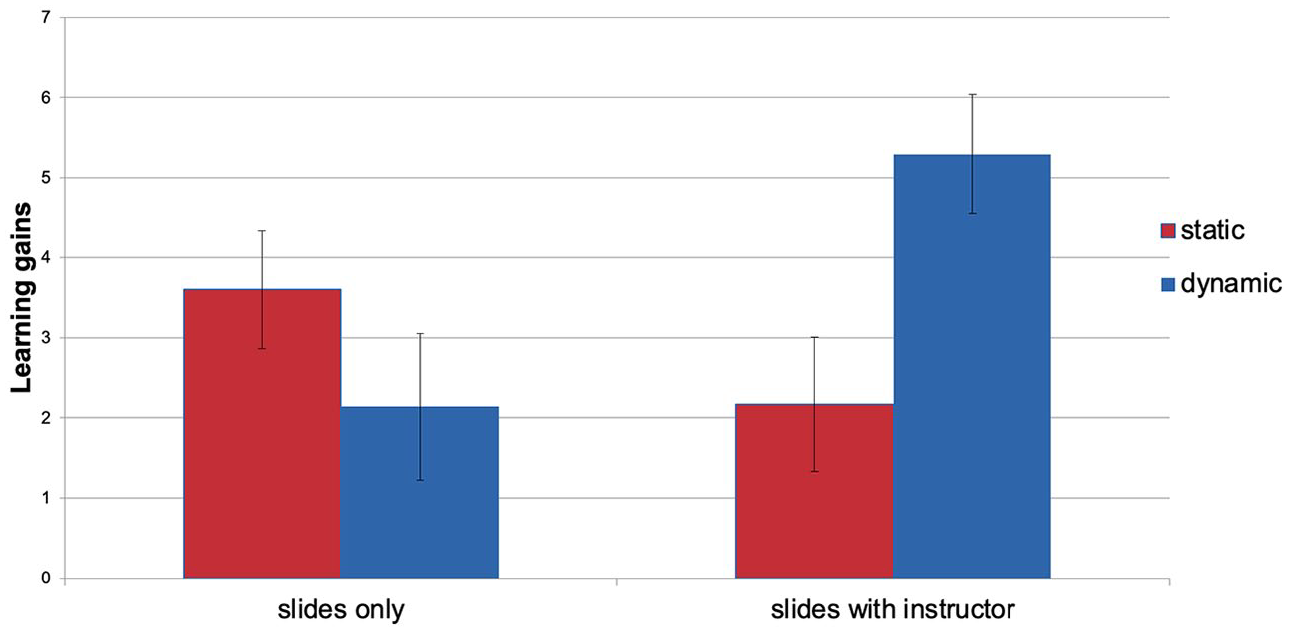
Learning gain in dynamic (blue) and static (red) slides presentation conditions differentiated between slides only (left panel) and slides with instructor conditions (right panel).
Overall gaze behaviour
Among the 42 participants with non-negative learning gain, eye tracker calibration failed in seven cases: one participant in the dynamic slides with instructor condition, four participants in the static slides with instructor condition, and two participants in the static slides only condition. Hence, the following analyses of gaze behaviour are restricted to 35 valid datasets: dynamic slides with instructor (10 participants), static slides with instructor (6 participants), dynamic slides only (10 participants) and static slides only (9 participants).
Raw eye tracking data of the remaining 35 cases were aggregated into fixations using the default value thresholds for fixation duration and recognition implemented in the Tobii Pro Lab Eye Tracking software. A fixation is defined as a time interval during which the eye gaze is maintained at a single location. Typically, those fixations alternate with so-called saccades, which are quick movements of the eye to the next fixation location. 1 During a saccade, the eye is functionally blind. Hence, according to the eye–mind–hypothesis (see Just and Carpenter, 1980), the location of fixations can be interpreted as indicating the locus of visual attention, the duration of fixations can be interpreted as an indication of the amount of visual attention devoted to the locus of attention and the sequence of fixations can be interpreted as the shift from one locus of visual attention to the next.
When conducting eye-tracking experiments of this kind, it is generally beneficial to define particular spatial areas (areas of interest: AOIs) in the visual materials being used as stimuli so that gaze behaviour can be contrasted specifically for those areas under differing viewing conditions. On a coarse grain level, the area in which the slides appeared and the area in which the on-screen instructor appeared were defined as AOIs to investigate the overall attention allocation between slides and instructor (see Figure 7); these results are discussed in the next section. We also defined finer grained AOIs around graphical elements on a single selected slide for closer analyses of gaze behaviour and its relation to cohesion. If not noted otherwise, we aggregated fixations on AOIs as summed fixation durations on those AOIs.
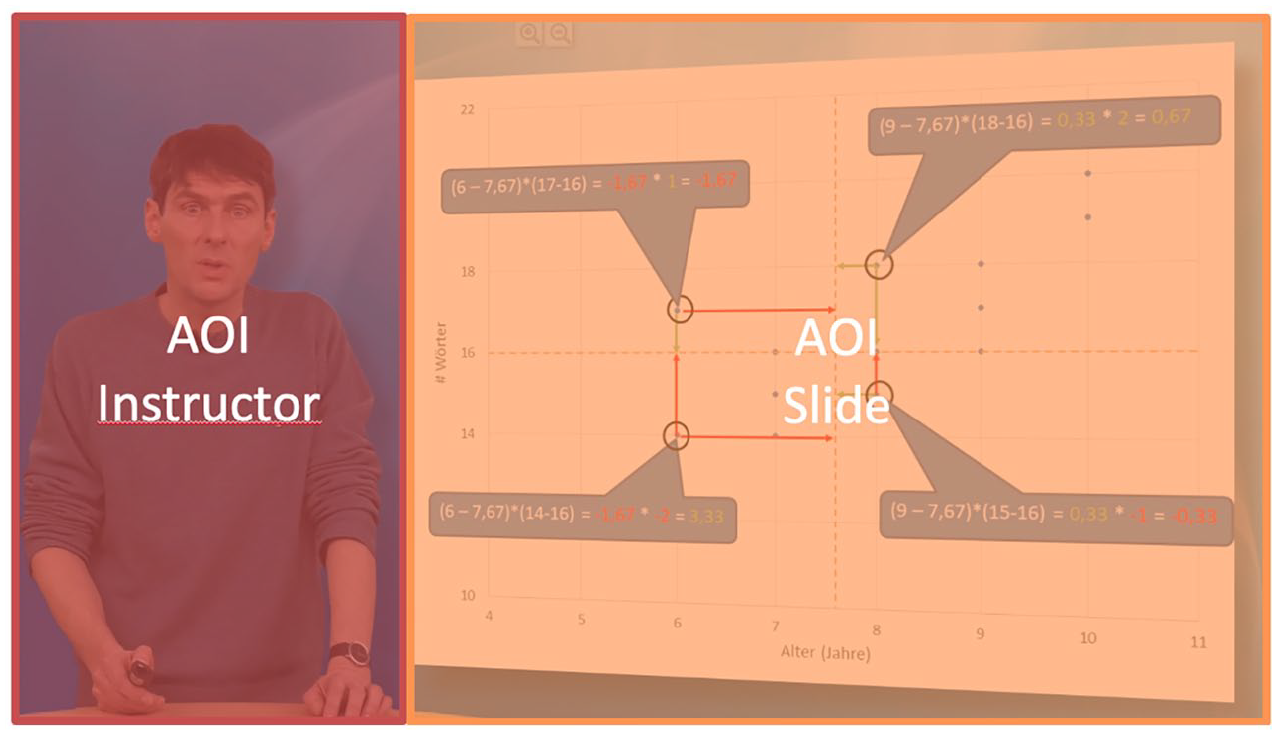
AOIs for the slides with instructor conditions superimposed over an original screenshot.
As a first step, we checked how instructor presence may disrupt attention allocation to the slides and if the amount of disruption is affected by the slide presentation condition. Hence, this analysis is restricted to the two experimental conditions where the instructor was present (n = 16). Comparing the time spent viewing the slides with the time spent watching the instructor revealed a significant difference (t(15) = 7.62, p < .001). That is, more time was spent viewing the slides (m = 323521 ms, SD = 84595) than watching the instructor (m = 107103 ms, SD = 56131) with the instructor gaining 25 percent of the total fixation time.
In a second step, we checked if this ratio was influenced by the condition of dynamic vs static slide presentation. An ANOVA with the repeated measures factor AOI (slides vs instructor), the between subjects factor slide presentation mode (dynamic vs static) and summed fixation durations on the respective AOIs confirmed the significant difference of attention allocation in favour of slides over instructor (F(1,14) = 54.18,
If this shift were to be statistically significant, it would support the conclusion that dynamic presentation drags visual attention towards the slides. If this conclusion were valid, it would be sufficient to explain the higher learning gain in the dynamic slides with instructor condition. However, since statistical significance was not reached, it appears likely that there is more to learning from an educational video than simply dragging the overall attention towards the content. In the following analyses, therefore, we take a closer look at how dynamic slide presentation affects gaze behaviour in order to further explore the relation between signalling, visual attention and learning. For these analyses, we apply the descriptive framework introduced above to a specific, assumed crucial, part of the educational video.
Relating gaze behaviour with multimodal cohesion analysis
For this part of the study we selected a particular sequence within the videos for close attention, building on the methods and earlier results reported in Thiele et al. (2024). We described this sequence in terms of the phoricity framework and prepared the eye-tracking data accordingly. This analysed segment concerns the presentation and explanation of the slide that was shown in Figure 5. The interval of this video sequence extends from 04:42 min to 05:44 min in the videos as a whole, resulting in a duration of 62 seconds. We defined eight non-overlapping AOIs for this complex slide, positioned with respect to the slide as indicated in Figure 8. For ease of reference, these AOIs were numbered so as to follow the approximate ordering of the spoken discussion of those areas, although nothing hinges on this in the analysis. These AOIs themselves were then kept constant across the experimental conditions of dynamic and static presentation so that any systematic differences found in gaze behaviour can be attributed to variation in the conditions.
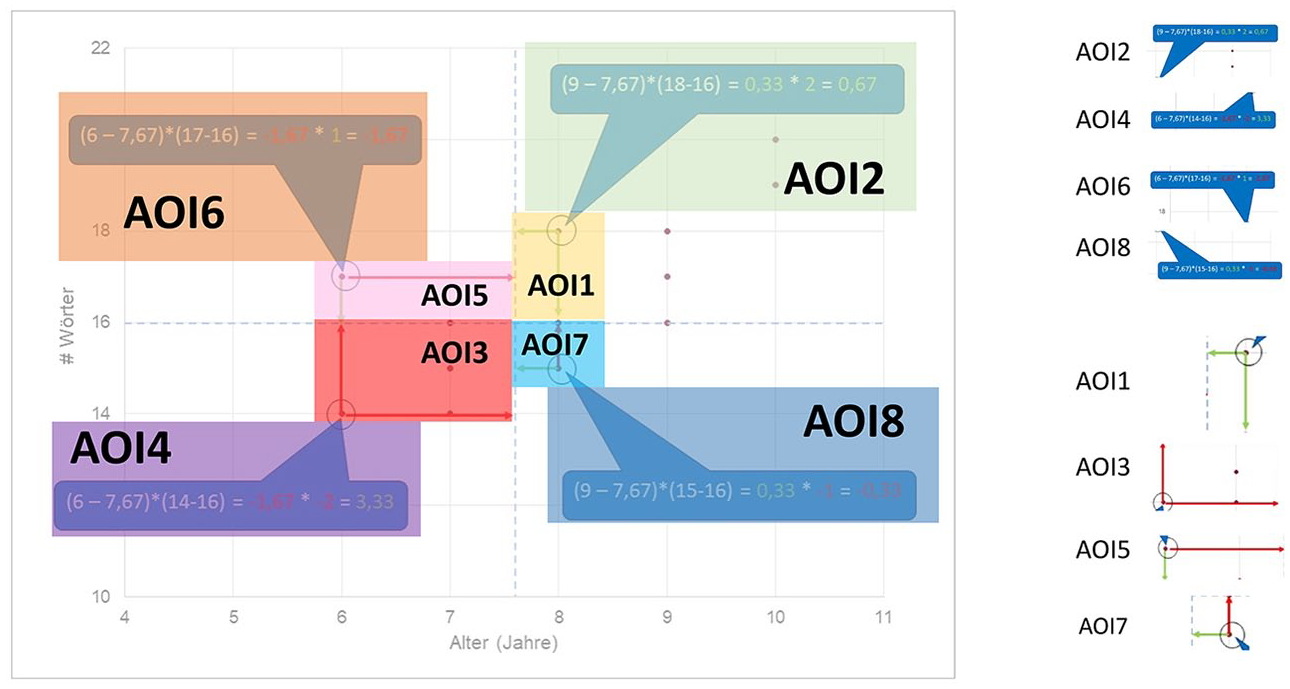
AOIs for the example under discussion superimposed over the original slide.
The sequence was also temporally divided into eight respective Times of Interest (TOI) to focus comparisons further. These TOIs are defined in broad correspondence to the AOIs: that is, a new TOI is defined as starting as soon as the first reference in the verbal speech is made to an element present in the corresponding AOI. Since the signalling function in the dynamic slides conditions was applied by synchronizing dynamic elements with verbal speech, the TOIs also correspond with the onset of these elements.
In the following subsection we briefly present the cohesion/phoricity analysis for this sequence using the framework introduced above. The two figures used for illustration purposes in this subsection are taken from Thiele et al. (2024).
Phoricity analysis
Following the methodological steps described above, Figure 9 (Figure 10 in Thiele et al., 2024) shows a detailed overview of the phoric relations at play in the example of AOI 7 (see Figure 8) for the two presentation conditions. These diagrams follow precisely the instructions for displaying cohesive links set out above (see Figures 3 and 4) and are derived automatically from the ELAN annotations. The vertical lines are therefore the distinct carriers of cohesive links, while the horizontal and diagonal lines capture the corresponding cohesive links between those elements: red arrows mark anaphoric links between units and blue arrows mark co-phoric links. Elapsed time runs vertically down the graphs and the green band across both graphs picks out the temporal interval where the respective AOI, AOI 7 in this case, is ‘active’.
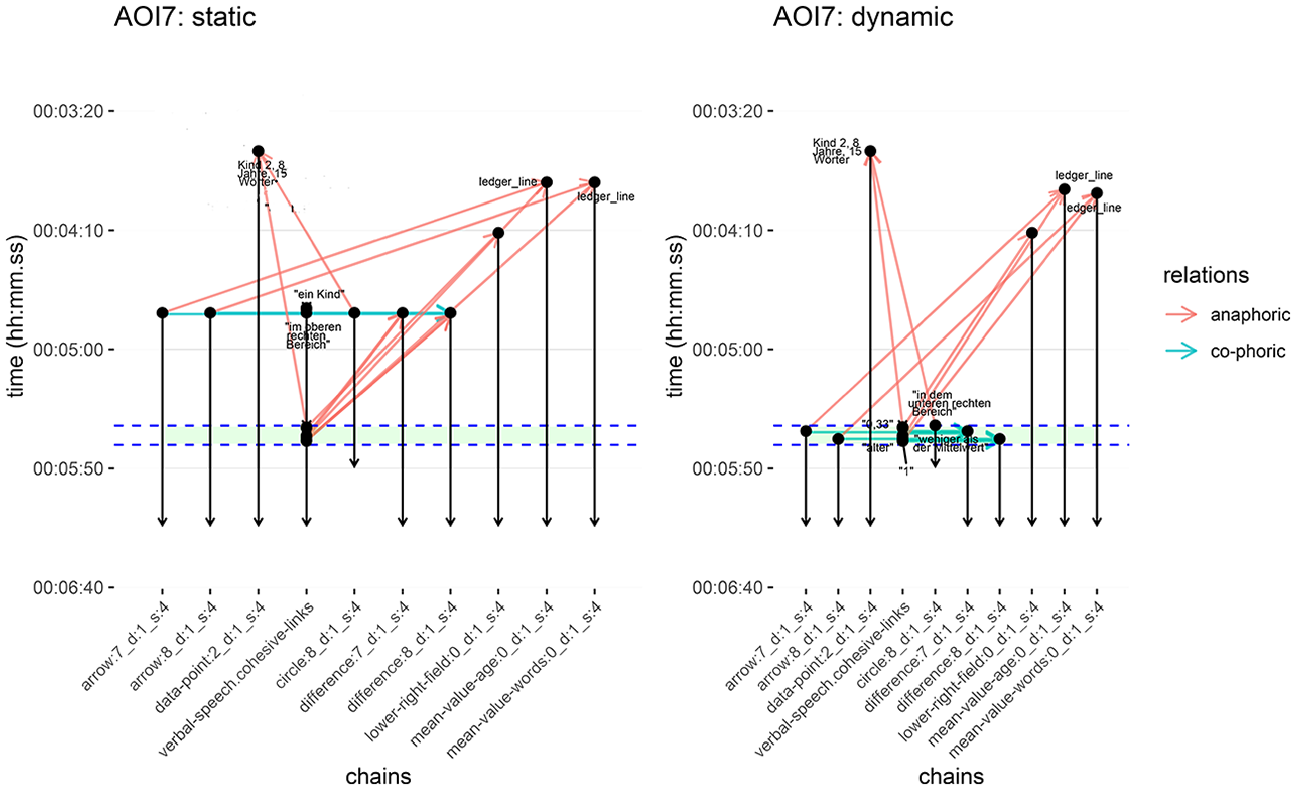
Cohesion diagrams in AOI 7 for both static and dynamic conditions. The green band running across both figures indicates the defined time of interest (TOI 7) from the eye-tracking study. Anaphoric and co-phoric links are marked as before (see Figure 10 in Thiele et al., 2024).
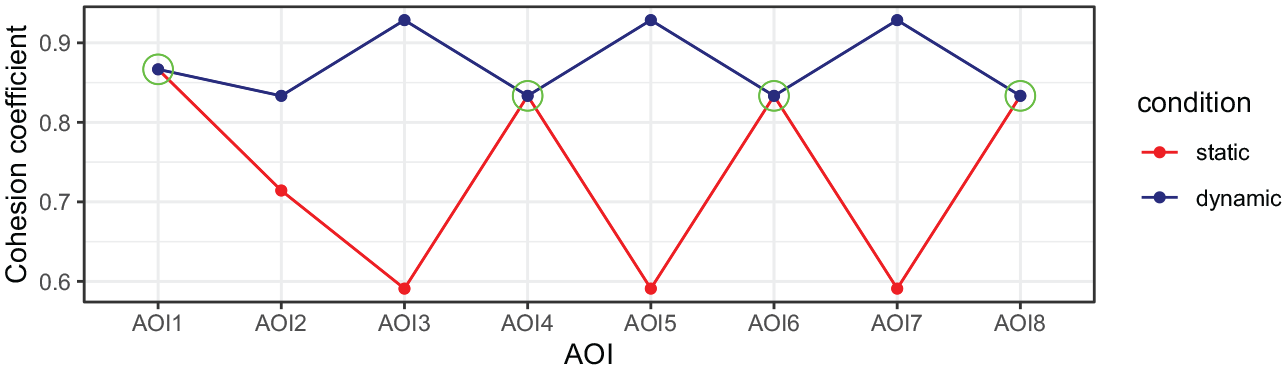
Aggregated cohesion metric for the two conditions across AOIs (Figure 12 in Thiele et al. 2024).
Visualizations of the instructor annotation are omitted from these diagrams because the presence of the instructor in both conditions is identical and, as mentioned, no additional cohesion signals via gestures were present; therefore, the presence of the instructor does not provide any means of referencing or signalling and so does not have any influence on the formal phoricity analysis.
Contrasting the two diagrams in Figure 9 shows that the frequency of anaphoric and co-phoric links differs between the two conditions: in the static video design condition (left-hand side of the figure), cohesive references are predominantly anaphoric with very few co-phoric links (two in total). The types of references in the dynamic condition (right-hand side of the figure) paint a converse picture, namely a more balanced distribution between co-phoric and anaphoric references. In Thiele et al. (2024), we found that this kind of distribution holds true for all other AOIs as well. Specifically, there are more balanced counts between anaphoric and co-phoric references, and there are more co-phoric relations in the dynamic condition compared to the static slides condition.
In order to explore further how these phoric patterns may interplay with certain viewing behaviours, we developed certain overall metrics calculated on the basis of the cohesion analyses (all AOIs in both conditions) that could then be considered in relation to the gaze duration data. This provides ‘cohesion coefficients’ that offer a measure of the similarity of co-phoric and anaphoric references across conditions. These coefficients are calculated for each condition and each AOI by taking the proportions of anaphoric and co-phoric references present and applying the formula:
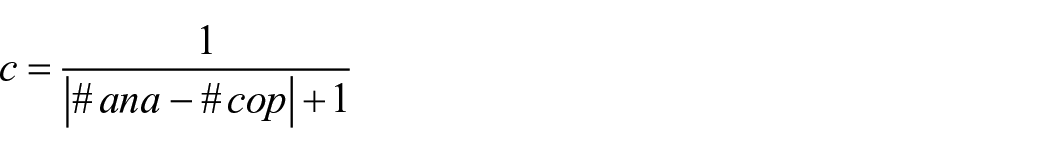
The cohesion coefficient reports higher scores when the co-phoric and anaphoric reference proportions are similar for an AOI, and lower scores when they differ. Figure 10 (Figure 12 in Thiele et al., 2024) shows the resulting cohesion coefficients for each condition across the AOIs. The circled points indicate the AOIs where this metric is equal across conditions (AOIs 1, 4, 6 and 8). Maximum divergence is evident on AOIs 3, 5 and 7; AOI 2 shows a moderate divergence. Crucially, these measures reflect formal properties of the videos derived solely from the cohesion analyses.
In the following, we discuss the implications of these figures further in the light of phoricity as a potential predictor for gaze behaviour.
Phoricity predictions on gaze behaviour
What we can infer from the results discussed above is that the aggregated cohesion metric allows predictions for the participants’ gaze behaviour which are statistically testable. In general we assume the gaze behaviour to follow the textual flow ‘path’ brought about by phoric links moving from AOI 1 to AOI 8. The static and dynamic video conditions differ in how salient each of these AOIs is in terms of cohesion signals: circles, arrows and other highlights are used in the dynamic slide designs simultaneously to the verbal text, to signal to certain parts on a slide, while the static slide design does not offer such simultaneous highlights. This is then also reflected in the cohesion coefficients for each AOI allowing us to construct the following hypotheses. Concerning the video conditions, gaze behaviour should diverge between static and dynamic videos whenever the cohesion coefficients are different; conversely, there should be no difference between static and dynamic conditions on AOIs with comparable cohesion coefficients because, in those cases, the respective deployments of cohesive relations across conditions do not differ either.
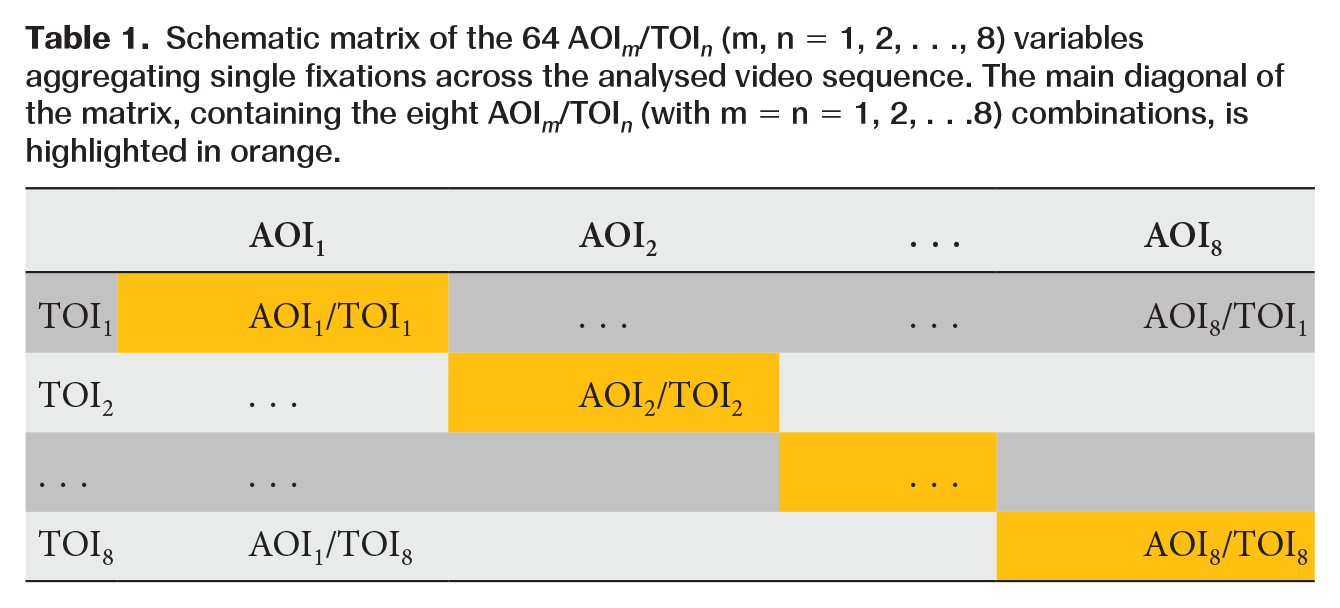
To derive and test these specific hypotheses, we aggregated fixations along the spatial and temporal dimensions of attention to the sequence. For each participant, we summed fixation durations on each AOI for each TOI, giving 8 (AOIs) × 8 (TOIs) = 64 variables representing the amount of visual attention devoted to a specific part of the slide during a specific time interval. The combination of AOIs and TOIs can be visualized in a matrix as shown in Table 1. The principal textual development is represented by the main diagonal of this matrix. Given the cohesion metrics for AOIs in Figure 10, we would expect fixation durations on AOIs along the textual organization (AOI m /TOI n with m = n = 1, 2, . . ., 8) to be higher for dynamic than static slide conditions. This overall effect should be restricted, however, to just the AOIs exhibiting greater differences in cohesion coefficients, that is AOIs 2, 3, 5 and 7. The AOIs in which the cohesion coefficients between dynamic and static slides are equal, i.e. AOIs 1, 4, 6 and 8, should not reveal statistically relevant differences in fixation durations.
Schematic matrix of the 64 AOI m /TOI n (m, n = 1, 2, . . ., 8) variables aggregating single fixations across the analysed video sequence. The main diagonal of the matrix, containing the eight AOI m /TOI n (with m = n = 1, 2, . . .8) combinations, is highlighted in orange.
To explore this, we first performed an ANOVA with the between-subjects factor slide presentation mode (dynamic vs static) and the within-subjects factor AOI referring to the eight AOI/TOI-pairs on the diagonal of the AOI/TOI-matrix (i.e. {AOI
m
/TOI
n
}n=1−8, see Table 1). The descriptive statistics are shown in Table 2. The ANOVA revealed no effect for the between-subjects factor mode of slide presentation (F(1,33) = 3.507, p = .07), a significant main effect for the within-subjects factor AOI (F(7,27) = 4.540, p < .01,
Means (M) and standard deviations (SD) of summed fixation durations (in milliseconds) on AOIs for AOIn/TOIn (n = 1, 2, . . ., 8) pairs for the experimental conditions dynamic and static slide design.
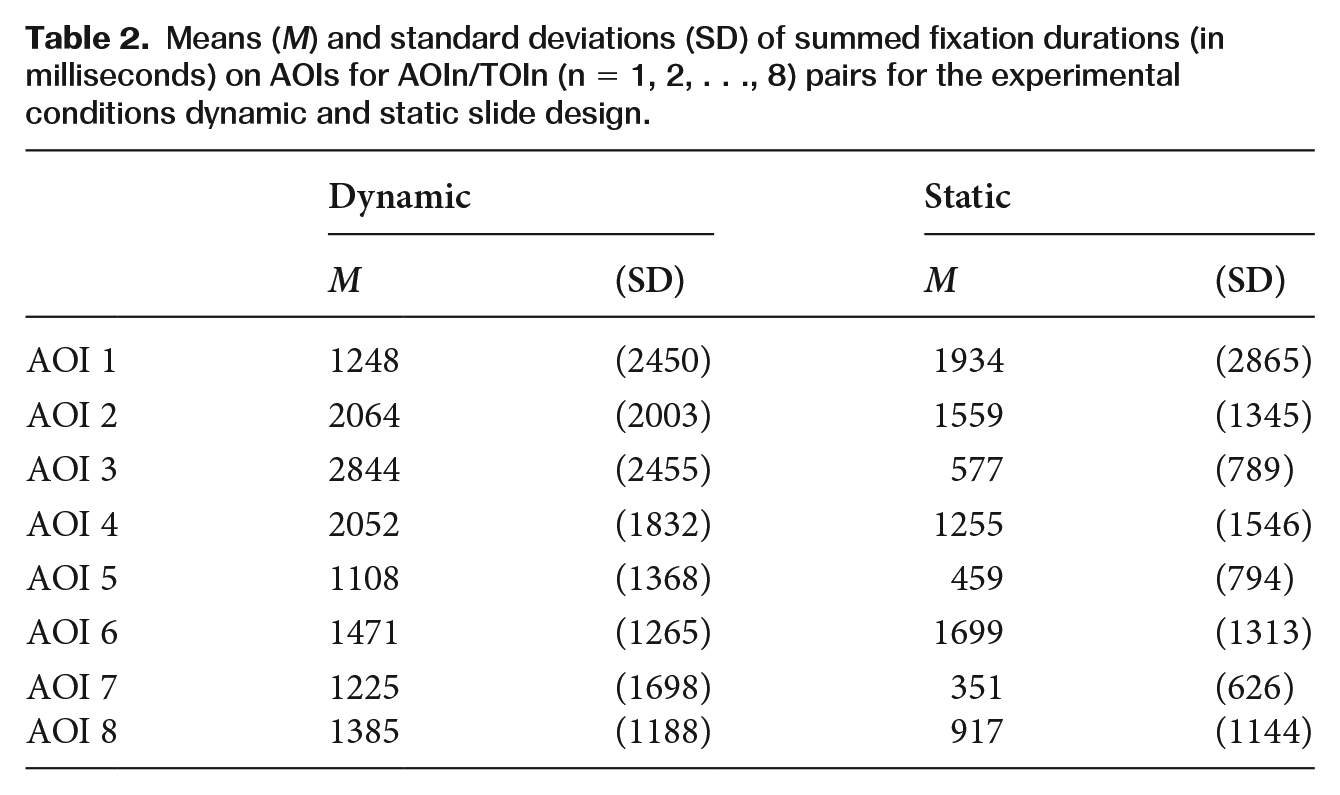
These statistical findings are visualized in Figure 11. In the left panel of the figure, gaze durations along the AOI n /TOI n diagonal are averaged across all participants, i.e. irrespective of presentation condition. While the graph in the left panel appears rather smooth at the beginning, it starts zigzagging towards the end of the segment, which nicely illustrates that the eight AOIs gain different amounts of attention. In other words, if attention were evenly distributed across AOIs, the graph would continue to vary smoothly along a horizontal line.
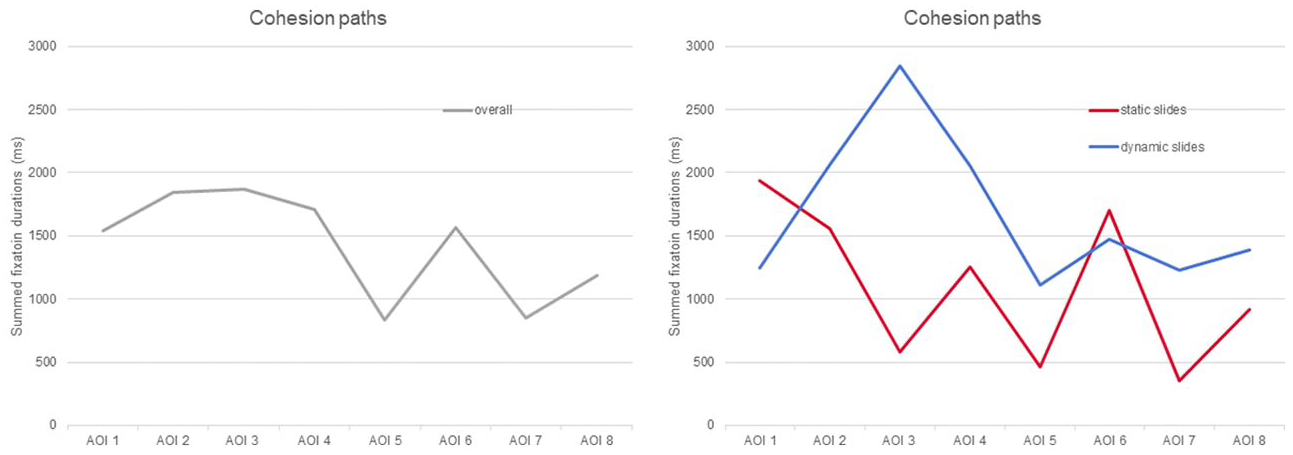
Distribution of visual attention (expressed in summed fixation durations) along the main path of textual development (i.e. over AOIs for their specific TOIs): (a) averaged across all participants (left panel); and (b) differentiated between dynamic and static slide presentation conditions (right panel).
This main effect of AOI is further qualified by its statistically significant interaction with slide presentation mode, i.e. whether that presentation is dynamic or static. This interaction is visualized in the right panel of Figure 11. The two graphs in the right panel depict the data from Table 2, that is, mean gaze duration along the AOI n /TOI n diagonal differentiated between dynamic and static slide design. Obviously, both graphs deviate from each other and none of them even remotely resembles a horizontal line. On the contrary, precisely where a comparatively even distribution of visual attention is suggested in the cumulated graph in the left panel, the two graphs in the right panel appear to split in different directions. This dissimilarity between the two graphs illustrates that the distribution of visual attention along the path of textual development varies with the presence or absence of visual cohesion signals. This result is in accordance with our hypothesis that some AOIs in the dynamic presentation condition were expected to be more salient than in the static presentation condition while there are no such differences expected for the other AOIs. This is, however, only a first approximation to the specific hypothesis we derived and so the statistical interaction justifies a closer, hypothesis-driven inspection of the gaze behaviour.
In order to test the hypothesis that the interaction between slide presentation and AOIs is particularly due to a higher visual salience of AOIs 2, 3, 5 and 7, we conducted two further analyses. First, we summed up fixation durations for these AOIs and also for the AOIs 1, 4, 6 and 8 and conducted a 2 × 2 ANOVA with the between-subjects factor slide presentation mode (dynamic vs static) and the within-subjects factor AOI (equal vs unequal cohesion coefficients), building on the differences in cohesion coefficients calculated for the AOIs. The ANOVA revealed no effect for the between-subjects factor mode of slide presentation (F(1,33) = 3.507, p = .07), no main effect for the within-subjects factor AOI (F(1,33) = 1.956, p = .17), but, as predicted, a significant interaction of AOI with presentation mode (F(1,33) = 9.657, p < .01,
To further qualify this interaction we conducted one-tailed t-tests for the AOIs with unequal cohesion coefficients. These tests indicated the differences in fixation durations on AOI 3 (t(33) = 3.87, p < .001), AOI 5 (t(33) = 1.76, p < .05), and AOI 7 (t(33) = 2.12, p < .05) to be significantly different between the dynamic and static slide presentation conditions. These differences are in accordance with the greater differences in cohesion coefficients for these AOIs across the dynamic and static modes of slide presentation.
Taken together, the attention distribution patterns for dynamic vs static slide design, as depicted in Figure 11, vary similarly to the cohesion coefficients derived from the phoricity analysis, depicted in Figure 10. That means that the theoretically derived cohesion coefficients may serve as a predictor of differences in visual attention devoted to a specific area in an explanation video.
Discussion
In this reception study on educational videos, we combined a multimodal-linguistics approach with an instructional design perspective. We introduced multimodal cohesion analysis to describe instructional design measures of education videos and to derive testable predictions. In particular, we explored the influence of slide presentation (dynamic vs static) and instructor presence (slides with instructor vs slides only) on learning outcome and gaze behaviour.
Concerning learning outcome, the study revealed an interaction between slide presentation and instructor presence. Participants in this study achieved the highest learning gain with an education video containing dynamic slides and a visible instructor. The design of the dynamic slide presentation was intended to signal references between visual elements and the accompanying verbal explanation. Instructor visibility had no such design intention, that is, the instructor avoided any signalling gestures to the content area on purpose. Consequently, we found no evidence for a positive effect of instructor presence on learning outcome. Nevertheless, we expected that a visible instructor would drag visual attention away from the slides and, thus, may rather hamper learning. The higher learning gain for dynamic compared to static slides in the visible instructor condition indicates that signalling may help in avoiding distracting effects of a visible instructor.
This interpretation is partly supported by the participants’ gaze behaviour. In general, the visible instructor gained approximately 25 percent of the gaze duration on the video, indicating that a certain amount of visual attention is dragged away from the slides. This ratio is in accordance with findings in other eye tracking studies on the role of instructor presence (see Van Wermeskerken et al., 2018). When the slides were dynamically presented while the instructor was visible, descriptively more visual attention was devoted to them compared to static slide presentation. This difference, however, failed statistical significance and so the higher learning gain for dynamic compared to static slides with a visible instructor cannot simply be explained by an overall shift of visual attention towards the content. That is, signalling effects may not be reduced to a facilitated selection of appropriate information on a coarse-grained level. Note, however, that the power of this analysis must be considered rather small due to the number of invalid data cases concerning the eye movement measure. A lack of significance in this coarse-grained gaze behaviour does not, therefore, mean that facilitated selection does not contribute to successful learning with this explanation video.
In order to explore the organization and integration of information on a more fine-grained level, we applied a descriptive framework for educational videos based on multimodal cohesion analysis. This analysis revealed three important insights. First, it provided a description for signalling in terms of phoric references. Second, this description allowed us to derive a path of textual organization which suggests how attention allocation is guided along the cohesion diagram of an educational video. This path may serve as a prediction for actual gaze behaviour. And, third, the relation between anaphoric and co-phoric relations allowed a precise description of the differences between dynamic and static slide presentation conditions. Furthermore, the presence of the instructor did not factor into the formal phoricity analysis as it did not provide any means of signalling. That is, the formal analysis validated that the visible instructor did not add any additional cohesion signals via gestures, which justified our decision to disregard this factor in the further analyses of gaze behaviour on the content slides.
Using the cohesion coefficients as a metric to predict attention distribution along an ideal path in terms of gaze durations revealed a surprisingly good fit of empirical eye tracking data with the theoretical model. That is, the differences in gaze behaviour between dynamic and static slide presentation became manifest only in the AOIs with the maximal divergence in cohesion coefficients between dynamic and static slide presentation conditions. This result has implications for the understanding of signalling in that it supports our assumption that phoricity is an appropriate metric for the strength of signals in terms of relative visual salience. Clearly, this result needs to be cross-validated with other material. What needs to be further explored, then, is if quantity of (co-)phoric relations is enough to estimate signal strength and relative salience, and/or which other relations are applicable to do so.
As in every study, there are limitations to consider. One issue is the control of possibly confounding variables in the experimental design. Concerning the specific factor of the mode of slide presentation (dynamic vs static), we described the manipulation in terms of a multimodal cohesion framework which focused on the temporal contiguity of cross-modal referents. Doing so, we derived a measure for strength of cohesion in terms of what we called phoricity. Although there may be other metrics to express how closely related the elements of a discourse structure are, the time scale provided by the cohesion analysis appears an appropriate choice – particularly as the goal is to offer explanations of gaze behaviour.
The other factor, instructor presence, may also be difficult to control in the context of gaze behaviour. Most obviously, a visible instructor drags visual attention by their mere presence. A multimodal description of a video’s cohesive structure alone might then be insufficient to deliver a complete prediction of gaze behaviour. Therefore, cohesion is only one dimension among others that may be necessary to fully capture the visual salience of all the multimodal elements of an educational video. Furthermore, the obvious salience of a visible instructor may have particular motivational and affective reasons we could not control in this study on cognitive and attentional processes. Indeed, positive effects of instructor presence has been reported in reduced subjective perception of cognitive load (Beege et al., 2023). However, in a prior study with the same material and manipulation (but without the use of eye-tracking), Schmidt-Borcherding and Drendel (2021) found no effects of instructor presence on subjective learning experience.
Another limitation of the study concerns the reliability of its measures of gaze behaviour. The reliability of these measures is challenged in two ways: (i) the eye tracking system, and (ii) the definition of AOIs. Concerning the first issue, the head-mounted eye tracking system that was used in this study was the equipment available to us at the time the experiment was performed. Since the educational videos were displayed on a computer screen, it would have been technically possible and more appropriate to use a screen-based eye tracking system instead. The main reason for this is not the accuracy of the tracking itself, which is comparable for both devices, but rather the need to compensate for head-movement. With a head-mounted eye tracker, the stimulus moves with the head and so requires a further process that matches the gaze behaviour with the visual stimulus. This matching process is time-consuming and error-prone. As a consequence, the present eye tracking data may be potentially noisy compared to measurements obtained from a screen-based device.
Nevertheless, matching accuracy must also be weighed against the background of the research questions and the stimulus properties. The equipment used in the present study can be considered sufficiently precise for summarizing fixations over several seconds on AOIs covering some square centimetres of a presentation slide, compared, for example, to the much higher resolution required for a reliable measure of reading behaviour or scan paths (Holmqvist et al., 2011). Indeed, comparing the similarity of actual scan paths with theoretical ‘cohesion paths’ exhibited in educational videos is itself a promising direction for further research.
The definition of AOIs is another factor influencing the reliability of measures of gaze behaviour. In the current experiment, defining the AOIs was relatively straightforward because it was based on the properties of the signals used, that is the circles, arrows and bubbles that appeared on the presentation slides. The only issue then is how large to make the margins between AOIs in order to control for false positive/negative statistical results induced by small offsets in eye movement events (see Holmqvist et al., 2011). The proper size of such margins is moderated by factors such as eye tracker accuracy (see above) as well as the particular stimulus properties (e.g. a distracting advertisement on a web page). In our case, the proximity of the critical design features used as signals did not allow for margins between the AOIs without questioning the validity of the AOIs. To ensure this validity, we accepted a possible limitation in reliability. A limited reliability is particularly troublesome for the explanation of null effects due to a reduced test power. On the other hand, if statistically significant effects were detected, this likely happened not because but in spite of limited reliability. Thus, the effects of fine-grained gaze behaviour do not have to be considered invalid just because of a limited selectivity between AOIs. Nevertheless, the gaze measures have to be treated with some caution and the results need to be replicated with more accurate eye tracking systems and other systematically controlled material.
In summary, we found a relation between stimulus characteristics and gaze behaviour on a fine-grained process level but failed to find statistical support for a relation between coarse-grained gaze behaviour and learning outcome. Concerning the coarse-grained level, the descriptive results pointed in an interpretable direction. It remains reasonable that signalling facilitates the selection of relevant information in the presence of irrelevant aspects competing for visual attention. From this perspective, it may be revealing to contrast signalling with other competitors than a visible instructor. However, analysing gaze behaviour at this level appears to be too unspecific to observe organization and integration processes which are assumed to be facilitated by signalling as well.
Concerning the fine-grained description, we lack a main effect of signalling on learning outcome in order to relate it to gaze behaviour at this level. Obviously, the measurement levels did not match. The learning outcome measure in this study aimed only at broad concepts of covariance and correlation (i.e. remained on a coarse-grained level), whereas the slide selected for the fine-grained analyses of gaze behaviour focused on a very specific aspect of the idea behind these concepts. More fine-grained outcome measures may then have the potential to produce clearer results. Further research is needed, therefore, also to replicate the present findings on the fine-grained level with other educational videos.
Conclusion
In this article, we have shown how specific descriptions of phoric cohesive relations in a multimodal text allow for a fine-grained prediction of gaze behaviour. We supported this claim by showing how our cohesion coefficient predictions could indeed be statistically validated. Nevertheless, we found that this model is still insufficient in so far that it could not explain the learning outcome of the interaction of dynamic signals on the presentation slide level with instructor presence. Further studies thus have to approach the outcome measures with the same fine-granularity as the gaze measures in order to support more fine-grained modelling. Moreover, further work needs to be dedicated to the question of which other ways the effects of the presence of an instructor in educational videos might be incorporated in a multimodal–linguistic description of the video material even when these are not of a cohesive nature.
Footnotes
Ethical Considerations
Experimental data was gathered in full accordance with the ethical guidelines of the university.
Consent To Participate
All subjects gave informed consent to participate in the study. The study was conducted in accordance with the code of ethics of the German Educational Research Association (DGfE) as well as APA ethical standards. All data were collected and analysed anonymously.
Data Availability Statement
Data may be requested from the lead author.
Notes
Biographical Notes
Address: University of Bremen, Bibliothekstrasse 1, 28359 Bremen, Germany. [email:
Address: University of Bremen, Bibliothekstrasse 1, 28359 Bremen, Germany. [email:
Address: University of Bremen, Bibliothekstrasse 1, 28359 Bremen, Germany. [email: