
Abstract
Contemporary television news programmes are often complex examples of hybrid communication (see Bucher, ‘Multimodal understanding or reception as interaction’, 2011). Television news presents related as well as unrelated information in both a linear and non-linear fashion by combining the news read with a variety of visual elements. Studies utilizing eye-tracking have found the visual attention received by the various types of elements to vary considerably (see Josephson and Holmes, ‘Clutter or content? How on-screen enhancements affect how TV viewers scan and what they learn’, 2006; Pjesivac et al., ‘Television infographics as orienting response’, 2021; Rodrigues et al., ‘A television news graphics layout analysis method using eye tracking, 2012; and ‘Analysis of the layout on TV news reception, 2014). ‘The limited capacity model of motivated mediated message processing (see Lang, ‘The limited capacity model of mediated message processing’, 2000) also suggests those elements can both positively and negatively impact viewers’ ability to effectively process information.
The present study relates eye-tracking data with a multiple-choice information recall test by building generalized linear regression models to gain deeper insight into the effects of the diverse multimodality of modern digital screen layouts on visual attention and message processing. Six common visual elements of television news are presented in two experimental conditions of varying visual complexity. The study found a large difference in fixations received by and information recalled from different elements of the news screens. While the more complex condition’s effect on information recall was found to be not significant, it did significantly affect the distribution of fixations and gaze duration across screen elements. Biographical factors such as general news interest and time spent watching television were also found to significantly impact gaze behaviour.
1. Introduction
Television news programmes rely on a wide range of visual elements to aid newscasters in effectively communicating current events to viewers. As the information presented on contemporary news screens has ‘increased in complexity such that visual stimuli are presented diversely in the visual space and in most situations, also simultaneous in time’ (Rodrigues et al., 2012), the question of the effectiveness of the various elements has gained increasing relevance for the field of reception studies. Concerns about the potential of cluttered screen layouts to exceed viewers’ capacity for information processing have been raised repeatedly (Bergen et al., 2005; Josephson and Holmes, 2006; Mandelbaum and Quilty-Dunn, 2015), but research on their effects remains sparce.
The present study relates eye-tracking data with a multiple-choice information recall test by building generalized linear regression models to gain deeper insight into the effects of the diverse multimodality of modern digital screen layouts on visual attention and message processing. Eye-tracking allows researchers to determine the focus of subjects’ gaze by recording movements and fixation-periods of the pupil (Cummins, 2017; Jacob, 1995). Studies utilizing eye-tracking have found considerable variation both in the visual attention received (Pjesivac et al., 2021; Rodrigues et al., 2012, 2014), and the information recalled by recipients (Hawkins et al., 1997; Josephson and Holmes, 2006) between various common visual elements, tying both to a complex interplay of individual ‘top-down’ factors such as ‘overall news interest’ (Pavolik et al., 2015) and ‘bottom-up’ material factors such as movement.
Within the framework of the limited capacity model of motivated mediated message processing (Lang, 2000), presenting redundant information via multiple sensory channels can lessen the extent of cognitive resources needed for processing, while excessive or unrelated information can have the opposite effect. Several studies have been conducted on the ticker – a dynamic, scrolling strip of information displayed at the bottom or side of a screen, often used to convey breaking news, updates, or other time-sensitive data – and the headline-bar or ‘lower third’, in particular (Bergen et al., 2005; Josephson and Holmes, 2006; Pavolik et al., 2015). The present study extends this line of questioning to information associated with other screen elements such as ‘locators’ or on-screen advertisements. By exploring statistically significant corelations between gaze data for the various elements and information recall results through generalized linear regression, the current study seeks to provide insight into:
Differences in visual attention received by the various multimodal elements common among news programmes;
Interactions in gaze allocation and information recall between elements presenting related versus unrelated contents;
The effect of media habits on participants’ gaze behaviour and information recall.
2. Theoretical Issues and Literature
2.1 Increasing visual complexity of TV news
Initially adopted for displaying stock-market updates and sports results between the 1980s and 2000s (Fruttaldo, 2014), the widespread use of animated text crawls in news broadcasting was facilitated in part by the increased demand for continuous news coverage during the aftermath of the 9/11 terrorist attacks in 2001. A need to provide continuous updates on multiple high-stakes news items simultaneously contributed to the rise of unrelated text crawls. Josephson and Holmes (2006) add that this development coincided with the advent of another feature prominent in contemporary news-broadcasts, the ‘split screen’: Viewers often saw a split screen, with a news anchor or reporter presenting information on one side and a live shot of the scene on the other side. This was often accompanied by a bulleted summary of news developments, which at times complemented and other times supplemented what was being reported in the majority of the screen. (p. 155)
These layouts (See Figure 1) in turn require the introduction of additional digitally overlaid text to identify persons, locations and sources.

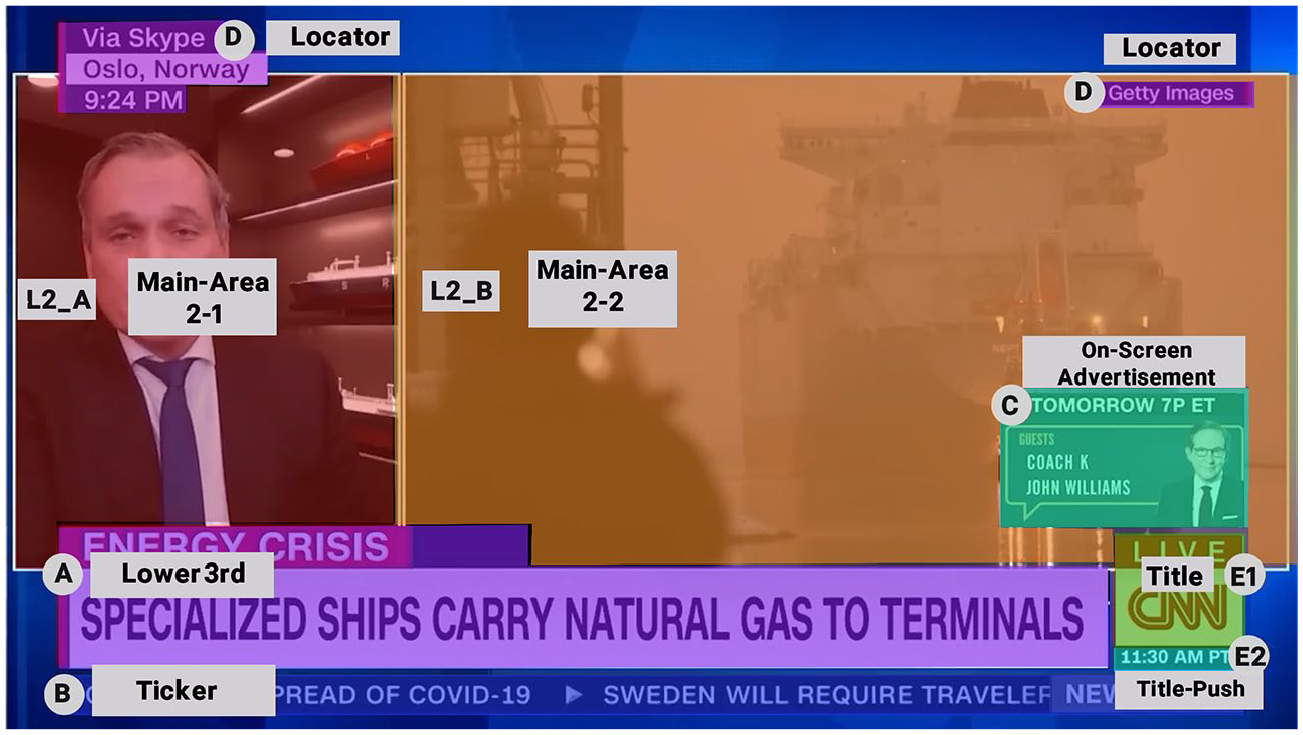
Screenshot from stimulus video 1.2 (German–Norwegian Gas Deal) with graphic 3 distinguishable multimodal clusters colour coded: (1) (red) elements supporting the news read (locators 4–5 shaded lighter as they can be considered to anchor the video materials but do not provide information relevant to the read); (2) (yellow) crawling ticker with static ‘newsroom’ design-element’; and (3) (green) advertisement graphic, logo and clock element for branding and promotion of upcoming programmes.
Providing related as well as unrelated information simultaneously and across various semiotic modes, Bucher (2011: 1) lists news programmes utilizing such additional graphics as an example of ‘hybrid communication’ combining both a linear message akin to more traditional film and simultaneous non-linear information, and requiring some degree of choice. They can be characterized as micro-ergodic, requiring ‘substantial work to be done by the sign interpreter’ (Bateman et al. 2017: 107) in terms of composition. The composition problem in multimodality refers to the question of how the individual elements of a multimodal artifact contribute to the meaning of larger multimodal clusters (Bucher, 2011: 3) and how such clusters are to be delineated. The reception problem, on the other hand, is concerned with the reception side of the same question, focusing on what guides participants in their identification and interpretation of such clusters.
According to Bucher (2012), multimodal clusters can be delineated by identifying associated elements, the cohesion of which is indicated to audiences by ‘visual linking devices’ such as filmic camera techniques, recognizable props or the movement, and gaze behaviour of characters on screen. Bucher’s eye-tracking study on television commercials also found evidence of ‘recursive relations’ (p. 258) with auditory elements guiding participants’ expectations towards and interpretation of what elements in a scene are salient.
On the reception side of the issue, different theoretical frameworks have been proposed on the relation of material features and recipient goals in guiding the reception of multimodal texts. While salience theories prioritize bottom-up ‘attention-grabbing’ elements of the texts (p. 260), schematic theories emphasize the ‘competences, cognitive schemes and intentions’ with which recipients engage multimodal texts top down. Bucher (2012), Bucher and Schumacher (2006) and Yarbus (1967) found that knowledge of the material or posing different tasks also had notable effects on gaze behaviour and subsequent interpretations.
Bucher (2012) proposed an alternative framing of both the composition and reception problem around a ‘pragmatic theory of multimodality’ (Handlungstheoretische Multimodalitätstheorie), according to which a text is multimodal not just because it contains different semiotic modes, but because it realizes a communicative act, ‘e.g. narrating or advertising’ (p. 290), through signs in multiple semiotic modes. Gaze data collected on his advertisement videos, accordingly, showed gaze paths to be less linear and more varied between participants in the section of the spots listing product features when compared to the short narrative skit preceding it. Other than in the case of Bucher’s TV commercials, however, the co-present visual elements deployed in the type of news broadcast this project is concerned with do not all serve the same communicative purpose. Unless presented via physical monitors in the newsroom, as is still frequently the case for maps in weather reports, the digital nature of modern news graphics all but prohibits meaningful interaction by the anchor people through gaze line (p. 280) or gestures such as pointing. Despite deploying various semiotic modes simultaneously, programmes like the ones considered here arguably exhibit little cohesion in terms of their composition as multimodal texts, making equally little use of their potential for meaning multiplication (p. 291).
Take the screenshot from one of the stimulus videos for the present study (Figure 1), a story about a German–Norwegian gas deal: the guest seen in the smaller split-screen area (1) is describing verbally how ‘specialized ships will carry the liquid natural gas’. The larger area (2) simultaneously shows a photograph depicting a ship and can be said to illustrate (Van Leeuwen, 2004) the contents of the audio-track. While the split-screen located guest’s video feed and photograph next to each other, the setup does not allow the guest to react to the image through gestures or looks. The text of the lower third (3) again restates this point of the read while serving to anchor the accompanying footage by restating how it relates to the story. Two locator elements (4–5), connected to the two split-screen areas by being superimposed on them, further contextualize the images by providing the location of the guest and the source of the photograph. Locators are thus part of the central multimodal cluster related to the news read both by placement and content. Identifying them as such arguably requires a greater amount of interpretative work and genre knowledge from recipients, however, as their contents usually relate to relatively minute details of the news production rather than central story items. Discussion around the ticker crawl (6) as potential ‘visual clutter’ centres around its role of providing updates on unrelated stories. On-screen advertisement (7) and station logo (8) do not serve any function beyond branding and promotion. The clock element (9) again adds unrelated information and visual pushes, periodically switching between different time zones with a spinning animation.
Rather than one (non-linear) multimodal cluster consisting of different sub-clusters of associated elements all serving the same communicative purpose, there are at least three different ‘lines’ of communication co-present, competing for audience attention. Where lower third, main areas and locator are involved in conveying a news story alongside the news read, the ticker conveys updates on a set of other unrelated stories. Meanwhile the advertisement and logo all serve just to promote the network and its other programmes.
Previous eye-tracking studies of various television news setups repeatedly found that those elements associated with the main news read tend to receive considerably more attention than unrelated tickers and miscellaneous logos. Rodrigues et al. (2012, 2014) found that station logos consistently receive the least visual attention among visual elements with around 1.4 percent in the 2012 study and less than 0.5 percent in the 2014 study. Most fixations in both studies were received by the news anchor seen in the main screen area, followed by the lower third and an over-the-shoulder graphic. In the 2014 study, they also note that the ticker, if present, only ever received between 5 and 12 percent depending on which other elements were present, while the lower third in the same layouts typically received around 40 percent during the anchor-lead in and around 25 percent when paired with on-location footage. It should also be noted that the much smaller and less prominent lower third in the 2012 study received only 5.4 percent of fixations while the ticker below it received 15 percent. This ticker, however, utilized occasional updates rather than a crawl.
Other studies emphasize more overtly bottom-up factors such the size of elements, their position in relation to others and what movement cues are associated with them. Josephson and Holmes (2006) found that the presence of certain elements can also draw viewers’ attention to elements located in the same screen area. The ticker received more fixations when a lower third was also present. Attention was distributed roughly equally across both elements when they were co-present. The main area of the screen still received the most fixations. The small animated logo and a ‘generic source label’ (p. 156), located in the lower corners of the screen, were only rarely fixated on. Brechman et al. (2015) compared two different types of ticker, the continuously moving text crawl and an occasionally updated variant. The version only updating occasionally received both more and longer fixations than the continuous crawl. Considering the multimodal analysis from the previous section and the design of the elements it can thus be assumed that
H1: Elements functionally related to the primary news crawl (main screen area Areas of Interest [AOIs], lower third and locator) will receive more and longer fixations than functionally unrelated ones (ticker, advertisement and logo elements).
As ‘structural’ (Lang, 2000: 51), bottom-up features of the elements such as size, position and movement as well as proximity of elements to one another (Josephson and Holmes, 2006) have also been shown to influence gaze allocation regardless of their content, it is also worthwhile verifying if
H2: The number and duration of fixation will co-vary positively between functionally related elements and negative covariance between unrelated ones regardless of whether the elements are adjacent.
The primary difference between the different split-screen layouts considered for this study, all the time, is how they disperse their respective video feeds across the screen, suggesting two competing hypotheses in terms of their gaze properties:
H3: More complex split-screen setups will draw more attention to the central screen area on account of increased movement and visual novelty in the specified area.
H4: Locating content more widely across the central screen area, viewers’ gaze will more likely be drawn to other elements on the sides.
2.2 Selective attention and message processing: The LC4MP
First proposed by Annie Lang (2000) in regard to visual complexity, redundancy and information processing in television, the Limited Capacity Model of Motivated Mediated Message Processing, or LC4MP, provides a powerful psychological framework for why the abundance of multimodal features in television news might be a problem in the first place. The model characterizes message processing as a three-step process consisting of information ‘(a) encoding; (b) storage and (c) retrieval’ (p. 46). Each step requires cognitive resources to be performed successfully. One central assumption of the model is that ‘human information processing is capacity limited and that these limitations place predictable constraints on how messages are processed’ (Fisher et al., 2018: 2).
According to the model, human ‘working memory’ dedicates separate ‘sensory stores’ to auditory and visual information (Brechman et al., 2015: 973; Lang, 2000: 48). These stores can hold large quantities of information bites at any given moment, but are limited severely in terms of how long information can be stored. A wealth of information continuously becomes available, but its availability is temporally limited, salient information is selected based on both ‘automatic (unintentional) and controlled (intentional) processes’ (Lang, 2000: 48) tied to bottom-up ‘attention-grabbing stimulus features’ (Fisher et al., 2018. 2) and top-down individual goals, habits and experiences, respectively. Information is encoded more effectively if that information is present in multiple sensory stores at the same time (Mayer and Moreno, 1998), since new information is initially encoded by relating it to other information currently present in working memory (Lang, 2000: 49) as well as previously encoded information. The dual-coding hypothesis then holds that ‘the task of information reception can be partitioned between visual and audio channels freeing more resources for cognitive processing’ (Pavolik et al., 2015: 141) if redundant information is presented across multiple channels such as pairing a news read with matching video footage. The notion of ‘mental load’ as the proportion of required, allocated and available resources for any given task, however, also suggests a limit to the usefulness of additional information.
While several studies found evidence for the effectiveness of redundancy between audio-track and accompanying video-footage (Drew and Grimes, 1987; Son et al., 1987; Zhou, 2004), results are less clear-cut when it comes to redundancy between audio and text. Bergen et al. (2005) found that news viewers in their late teens to early 20s recalled fewer informational items from 2-minute excerpts of CNN’s Headline News than from a visually simple version without overlayed graphics. Josephson and Holmes (2006: 161) found redundant headlines improved recall of dual-coded items while diminishing recall of others, ‘exhibiting an information interference effect’. For the present study, it can thus be expected that:
H5: Information presented in the central multimodal cluster (audio, footage, lower third and locator) will be recalled more frequently than a ticker or advertisement
H6: Dual-coded items will be recalled most frequently
Several further studies also investigated information recall from redundant versus unrelated news tickers. Scrolling news tickers, in particular, have been criticized repeatedly. Brechman et al. (2015) found participants able to recall significantly more ticker contents from the occasionally updated ticker versus continuous crawl. Rodrigues et al. (2014) found that information presented in news tickers is rarely recalled if it is unrelated to the news story. Both the redundant and no-crawl group exhibited better immediate recall of story items according to Pavolik et al. (2015) although the unrelated crawl group exhibited better long-term recall. Josephson and Holmes (2006) found that adding an unrelated text crawl to news footage did not diminish the recall of information from the news reading. It was thus assumed that:
H7: Ticker items will be recalled least frequently
Two studies finally show that, in viewing situations, where multiple parallel messages or simultaneous sources of information are present, personal goals and interests can have considerable influence on where and how viewers allocate cognitive resources. Using eye-tracking data to examine participants’ viewing behaviours for excerpts from the 2012 World Series, they found that ‘although viewers universally attend to these graphics upon onset, those with greater interest in sports and sports statistics exhibited greater cognitive processing of these elements as indexed by gaze duration’ (Josephson and Holmes, 2016: 102). Pavolik et al. (2015: 142) similarly found ‘overall news interest’ to affect participants’ susceptibility to information overload when watching news broadcasts. For the current project, it was thus expected that:
H8: Participants’ ‘general news interest’ and ‘daily television watch-time’ will significantly impact their gaze behaviour;
H9: Participants’ ‘general news interest’ and ‘daily television watch-time’ will significantly impact the number of informational items they recall.
3. Procedure
From a pool of 22 participants, 11 were randomly assigned to each of two packages of stimulus videos. Both packages consisted of two video clips with lengths of 2:03 minutes each. Each package contained a condition 1 and a condition 2 clip. Condition 1 features only two distinct screen layouts (Figures 2 and 3) with a maximum of two parallel video feeds. The more visually complex condition 2 features an additional third layout (Figure 4) featuring parallel three video feeds. The videos were separated by a 10-second rest screen displaying a simple timer counting down to the beginning of the next clip. Packages were distinguished by the stories that were presented. There were four news stories in total, two for each condition. Among the 11 participants who viewed the second version of the materials, data for one participant had to be discarded due to technical difficulties with the eye-tracking equipment, leaving the group viewing version 1 at a size of (n = 11) and the group viewing version 2 at (n = 10) participants. Within each group, half of the participants were shown the condition 1 clip before the condition 2 clip to make the video order available as an independent variable for checking possible order effects on the results of the information recollection tasks. Gaze data was recorded using a Tobii Pro X3-120 EPU eye-tracking device at a scanning-rate of 60Hz and the Tobii Labs Pro software. Questionnaires were presented digitally in the Tobii Labs Pro software directly after viewing. Both gaze data and questionnaire results were further analysed in R Studio.

Layout L1 – full-screen main area – occurs in both conditions.
Layout L2 – two-element split-screen main area – occurs in both conditions.
Layout L3 – three-element split-screen main area – unique to condition 2.
Participants received a short, initial briefing on the experimental procedure, were informed that their viewing behaviour would be recorded via an eye-tracking device and were instructed to view the stimulus materials as they would usually view a news broadcast. Participants were informed that their data would be anonymized and were assigned a participant number after giving written consent that their data could be used. Participants were then led to the work station where their point-of-gaze was then calibrated using the standard 9-point calibration screen before stimulus materials and a questionnaire were presented. The experiment took between 20 and 30 minutes to complete.
3.1 Stimulus materials and areas of interest
As the theoretical framework outlined in previous sections suggests, recipients’ familiarity with and recognition of specific layout-conventions to influence how they navigate the layouts – a primary concern for the stimulus construction for the project – was to match the presentational style of authentic CNN broadcasts as closely as possible. A generic station logo might be attended by frequent news viewers on account of its novelty, where the logo of a popular news network might be ignored out of habit. Stimulus materials were therefore constructed from longer news stories collected from the network’s YouTube channel. Where necessary, elements were added and removed through digital compositing of multiple clips to standardize the number of cuts and content changes in the areas of interest.
Clips were identical in structure, consisting of package and lead-in. Each featured an anchor and at least one expert guest. Care was also taken to select stories which were neither so prominent that participants could be expected to be familiar with their details, nor so obscure as to be uninteresting to most viewers. Version 1, viewed by (n = 11) participants, featured a story about former US Vice-President Pence’s then pending testimony in an investigation of the 6 January Capitol Riots and one about an unusual seaweed bloom round Florida’s coast. Version 2, viewed by (n = 10) participants, consisted of a story on a major natural gas deal between Germany and Sweden, and one about a successful NASA test flight.
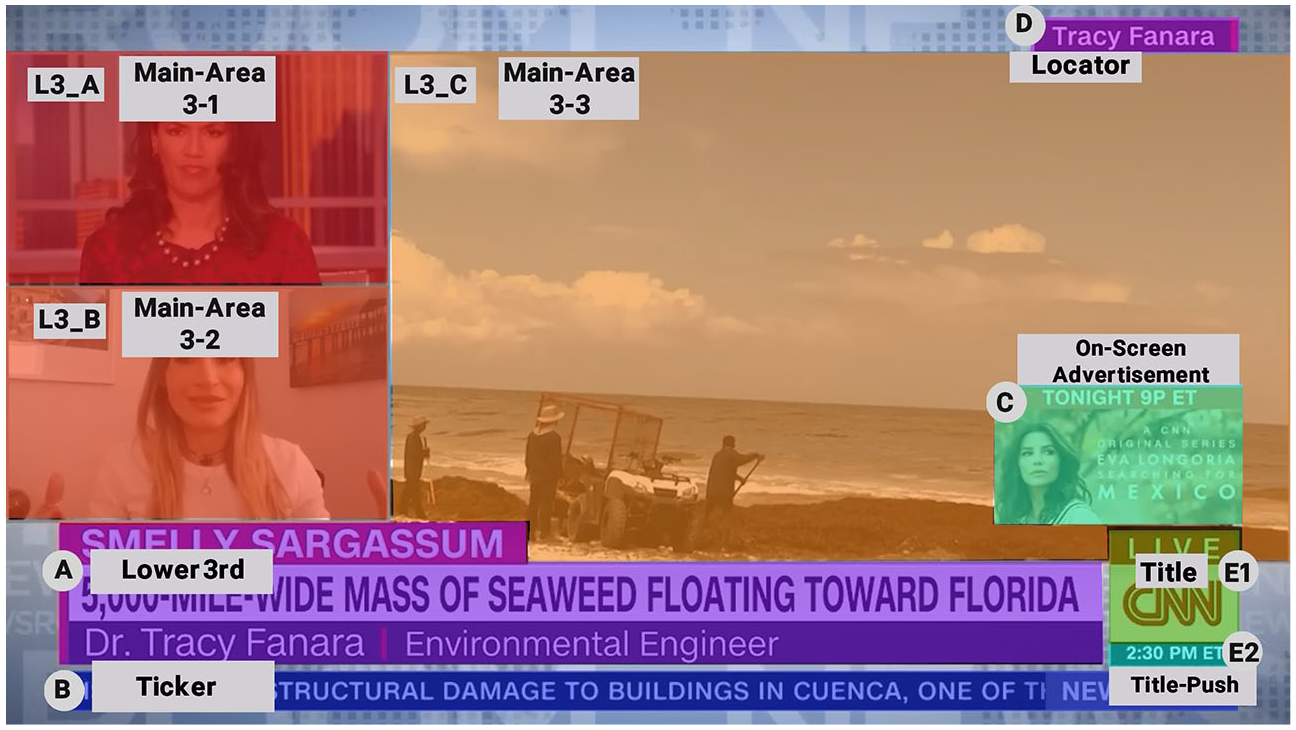
As indicated by the brief analysis of the layout in section 2, AOIs defined for the project include the following (Figures 2–4): each clip featured a two-tier lower third introducing the featured expert and three one-tier lower thirds featuring only headline summaries (A). Each clip also features a ticker (B), a locator (D), an on-screen advertisement (C) and the station logo (E1) with its associated clock element (E2). The number of AOIs in which the main area of the screen is partitioned differs between condition. All videos begin with an anchor lead-in utilizing layout 1 (Figure 2) before introducing an expert guest. This layout features only one main area AOI, L1. Condition 1 videos then cut to a two-area split-screen (layout 2 – Figure 3) which accordingly features two AOIs, L2-A and L2-B. For condition 2, there is a third layout type (layout 3 – Figure 4) featuring a three-area split-screen and accordingly three AOIs, L3-A, L3-B and L3C. While condition 1 videos cut back and forth between layout 1 and 2, condition 2 videos cycle through all three types of layout. As the overall number of cuts was standardized to ten across all four videos, the difference between conditions lies in the number and arrangement of elements which can appear in the main area. In the case of condition 1, the contents of split-screen area L2-B varied between the guest’s video feed and footage related to the story contents. Condition 2 videos featured a designated split-screen area L3-C for related footage.
3.2 Questionnaire
As in previous studies (Kallenbach et al., 2007; Josephson and Holmes, 2006; Rodrigues et al., 2012), encoding was assessed via a simple multiple-choice questionnaire immediately after the viewing session prompting participants to identify major story items, names and locations from among four options or a choice of ‘I did not notice’. Questionnaires consisted of 10 questions per story. For each story, two questions related to dual-coded items brought up in audio form while simultaneously appearing in the headline summaries as well. Informational items presented only in the lower third, the ticker and via the aural channel were similarly covered by two questions, respectively. The remaining two questions related to items only present in text form through advertisement and locator, respectively.
Participants then assessed on a 5-point Likert-scale from 1 = ‘very hard’ to 5 = ‘very easy’ how easy they found each story to follow (‘ease of comprehension’) and how well the presentation of the materials matched their expectation of TV news from 1 = ‘not at all’ to 5 = ‘closely matched my expectations’ (‘expectation’), similar to subjective rating questions deployed in previous studies (Brechman et al., 2015, Holton and Chyi, 2012; Josephson and Holmes, 2006). On top of age, gender and education level, participants were asked how frequently they seek out news programmes (‘news interest’) and how many hours per day they spent watching television or comparable online video content (‘daily TV watch-time’). The biographical questionnaire was administered last to avoid priming participants, especially since those questions related to their news-viewing behaviours.
3.3 Statistical modelling
Bateman and Hiippala (2021) describe how Generalized Linear Models (GLMs) offer a powerful method for revealing and predicting patterns of multimodal usage through linear regression. Linear regression is a type of mathematical regression which provides insight into correlations between sets of values by calculating the closest path lying between those data points. From the regression line’s point of contact with the coordinate system’s y-axis or ‘intercept’ as well as its steepness or ‘slope’, the effect that changing x-values have on the y-value can be calculated, giving an estimate of how a certain change in an independent variable considered will affect the dependent one. An increase in slope points to a positive effect and a decrease in slope suggests a negative one.
As an empirical methodology, linear regression aims to gain insight into a larger phenomenon based on a smaller, representative data sample. Following the assumption that the sample is sufficiently representative of the data in general, the method also allows one to determine how likely changes observed in the data would have come about by chance rather than through the effects estimated by the model (Bateman and Hiippala, 2021: 79). Generalized linear models can then be differentiated from other forms of linear regression in that they allow for other, more specific, assumed distributions among the data, which can support more reliable predictions for data that does not behave in accordance with the ‘standard’ bell-curve of Gaussian distribution (McElrath, 2020: 73). For example, while count-data is typically modelled assuming a ‘Poisson’ distribution, the ‘negative binomial’ distribution can correct for overdispersion by relaxing the assumption of an equal variance and mean. With the necessary information on the outcome variable, one can thus assume a more specific distribution for generalized linear model building offering more reliable predictions. For the project at hand, the most accurate results for overall test scores were obtained assuming ‘Poisson’ distribution, while ‘negative binomial’ distribution was assumed for the eye-tracking fixation counts.
To determine which choices in model construction improve predictive power, so-called ‘goodness-of-fit’ tests can be used to determine how well the assumptions of a particular model fit the data at hand. According to Field et al. (2012), a residual deviance lower than the null deviance is an indication that a given model provides better predictive power than random chance. For most distributions, the significance of this difference can then be verified using the chi-squared test. For different iterations of a model with the same outcome variable, the Akaike Information Criterion (AIC) also provides a ‘goodness-of-fit measure that is corrected for model complexity’ (Field et al., 2012: 868). Additionally, such deviance statistics of competing models can be compared via ANOVA and the significance of differences once more verified via chi-squared or F-test depending on the type of distribution assumed. Further goodness-of-fit tests have already been implemented in R in the DHARMa package (Harting, 2022) to check that the parametric assumptions of the models match the data. DHARMa provides QQ-plots that visualize expected and observed distribution, tests for significant dispersion as well as additional tests of correct distribution, dispersion and outliers. Dispersion is important to consider because overdispersion is a common indicator of misspecifications or suboptimal choice of distribution in a model and can lead to type I errors. Underdispersion can have the opposite effect and is a frequent sign of ‘overfitting’ in GLMs. Both can be identified through distinct patterns in the plots generated by DHARMa and the results of the additional goodness-of-fit tests.
Based on the tests outlined above, the methodology proposed by Bateman and Hiippala was employed to construct and refine a series of models, starting with a relatively broad formula including all potentially relevant predictors based on theoretical considerations, and then exploring further by removing or exchanging predictors that did not positively affect model-fit.
3.4 Participants
As the project’s most immediate limitation, the small pool of participants to some extent dictated the procedure and analytical techniques that could reasonably be deployed. Since comparison between experimental condition was conducted within-person, equally large datasets for conditions 1 and 2 were available, although datasets were not large enough to permit reliable modelling relations between gaze and questionnaire data for individual videos. Another challenge posed by the small pool of participants was ensuring emerging statistical trends were not skewed by hidden pattern or individual outlier choices in the biographical data collected. On top of combining rarely chosen levels of independent variables, e.g. summarizing the originally decade-based levels of the ‘age’ variable into the categories ‘below 30’, ’30–50’ and above 50’, a Principal Component Analysis was conducted to identify potential sources of ‘Multicollinearity’, a common source of type II error in regression models (Kassamabaro, 2023). For outlier detection, the project largely relied on the tools provided by the DHARMa package. Where the program detected significant outliers, the observations in question were removed, preventing potential type I error but losing more data points for the model at hand. The small participant pool also meant that, in order to obtain the results presented in sections 6 and 7, the total number of items recalled per participant was used as a dependent variable rather than modelling dual-coded, headline items and so on separately, thus avoiding problems of overdispersion and zero inflation. All models – the results of which are presented in the following section –satisfied all post-hoc tests implemented via the DHARMa package and were found to predict the data significantly better than the null hypothesis based on chi-square probability.
4. Results On Distribution Of Visual Attention
Simple comparison of fixations per AOI (Figures 5 to 6) confirms H1 for the most part. Most fixations took place in the main-area AOIs. The lower third received the most fixations among supplementary graphics both overall and in the different conditions. The animated clock beneath the station logo consistently received even fewer fixations than the logo itself. In the more visually complex condition 2 (high complexity) there was notably less difference in fixation percentage between it and the ticker than in condition 1 (low complexity). The on-screen advertisement, however, consistently received more fixations than the locator. While the locator’s size and placement already suggested that it would receive fewer fixations than other elements related to the news read, this difference to the unrelated advertisement was somewhat surprising. Both on-screen advertisement and locator also gained visual attention in the low complexity compared to the high complexity condition.
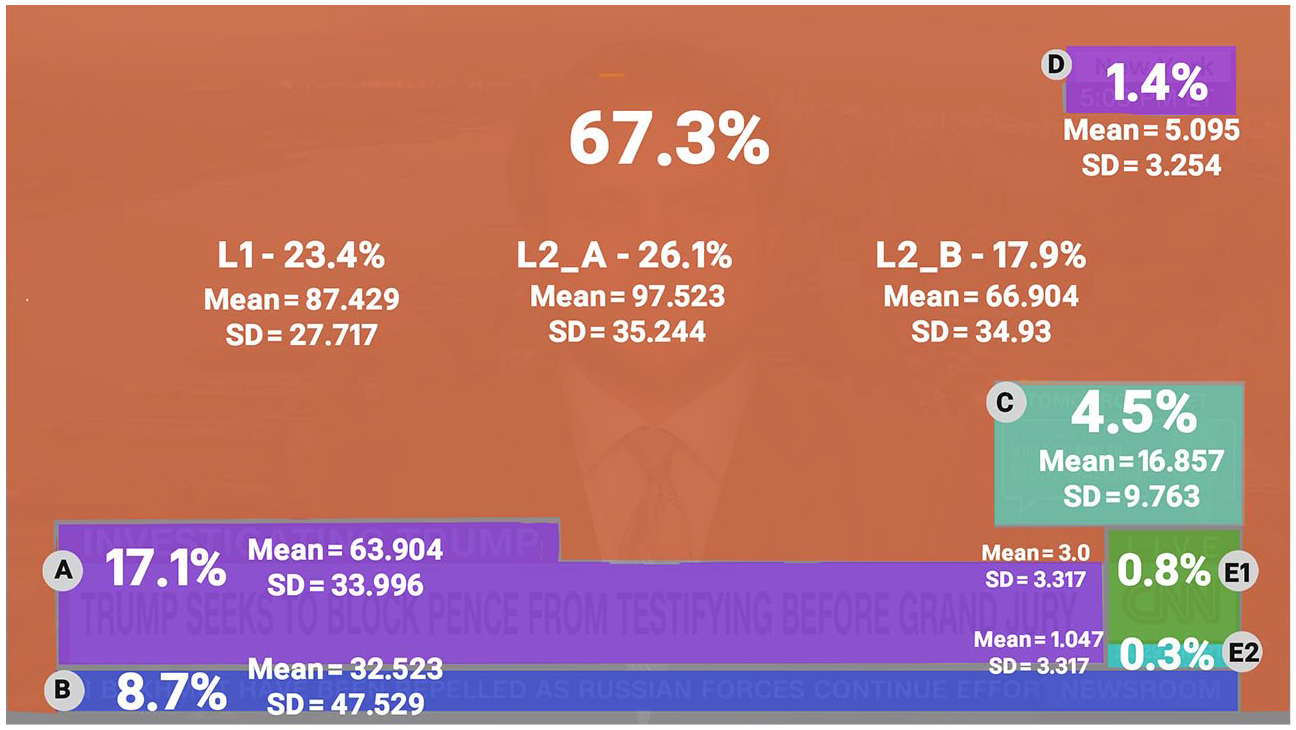
Percentage of overall fixations, mean number of fixation and standard deviation per AOI for condition 1 (large number in the middle of the main area gives combined fixation percentage for all main-area sub-sections.) Percentages calculated from both condition 1 videos, thus all (N = 21) participants.
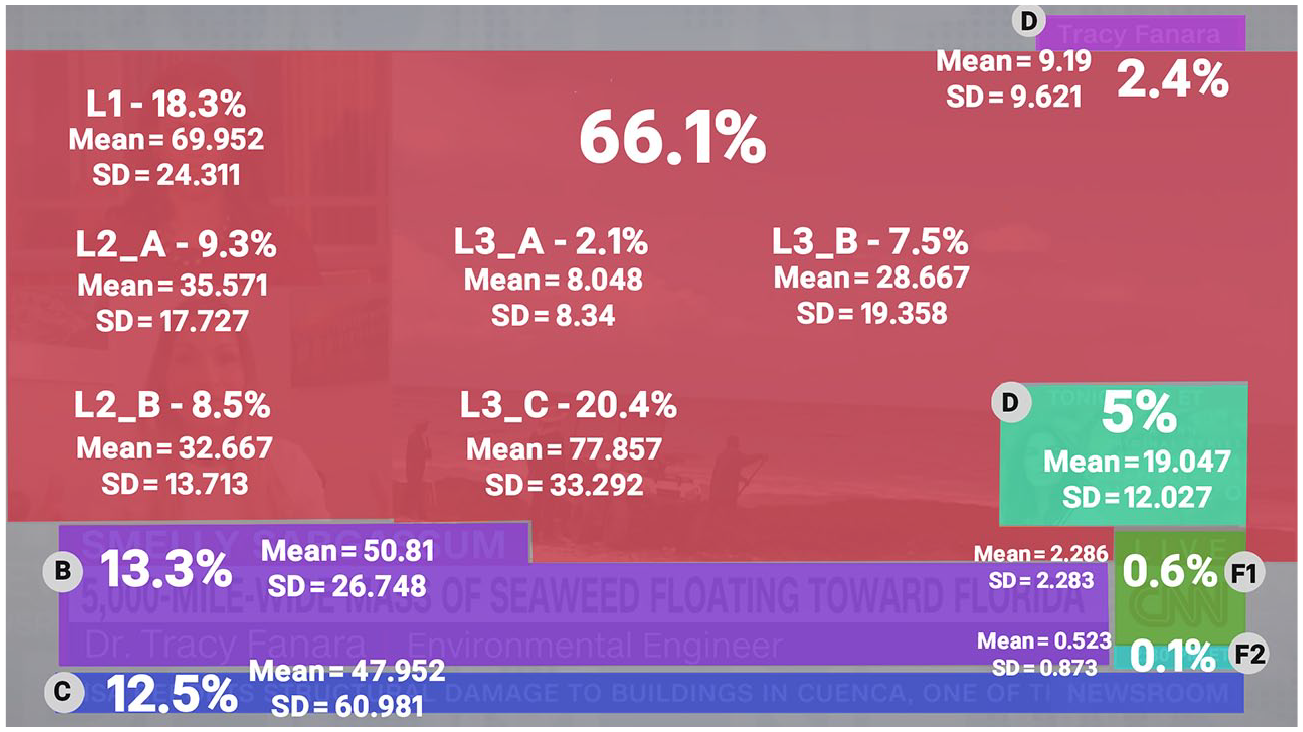
Percentage of overall fixations, mean number of fixation and standard deviation per AOI for condition 2 (large number in the middle of the main area gives combined fixation percentage for all main-area sub-sections.) Percentages calculated from both condition 2 videos, thus all (N = 21) participants.
Statistical analysis confirmed the difference in the number of fixations per element to be significant (β = −0.385, SE = 0.105, p < 0.001) when ‘condition’ is the only predictor. The effect of ‘condition’ is still present when adding the type of visual element (β = −0.223, SE = 0.213, p = ns), although not significant. Among the visual elements, all received significantly less fixations than the lower third, although this effect was least pronounced for the ticker (β = -0.675, SE = 0.271, p < 0.05). The number of fixations received differed significantly between conditions only for the ticker (β = 36.326, SE = 15.437, p < 0.05). Within-condition analysis of fixations per AOI revealed that the ticker received significantly less fixations than the lower third in the low complexity (β = −0.6754, SE = 0.258, p < 0.01) but not the high complexity condition (β = −0.0579, SE = 0.284, p = ns). While the increase in fixations is only significant for the ticker-AOI, comparing the total fixations received per AOI thus points to H4 over H3.
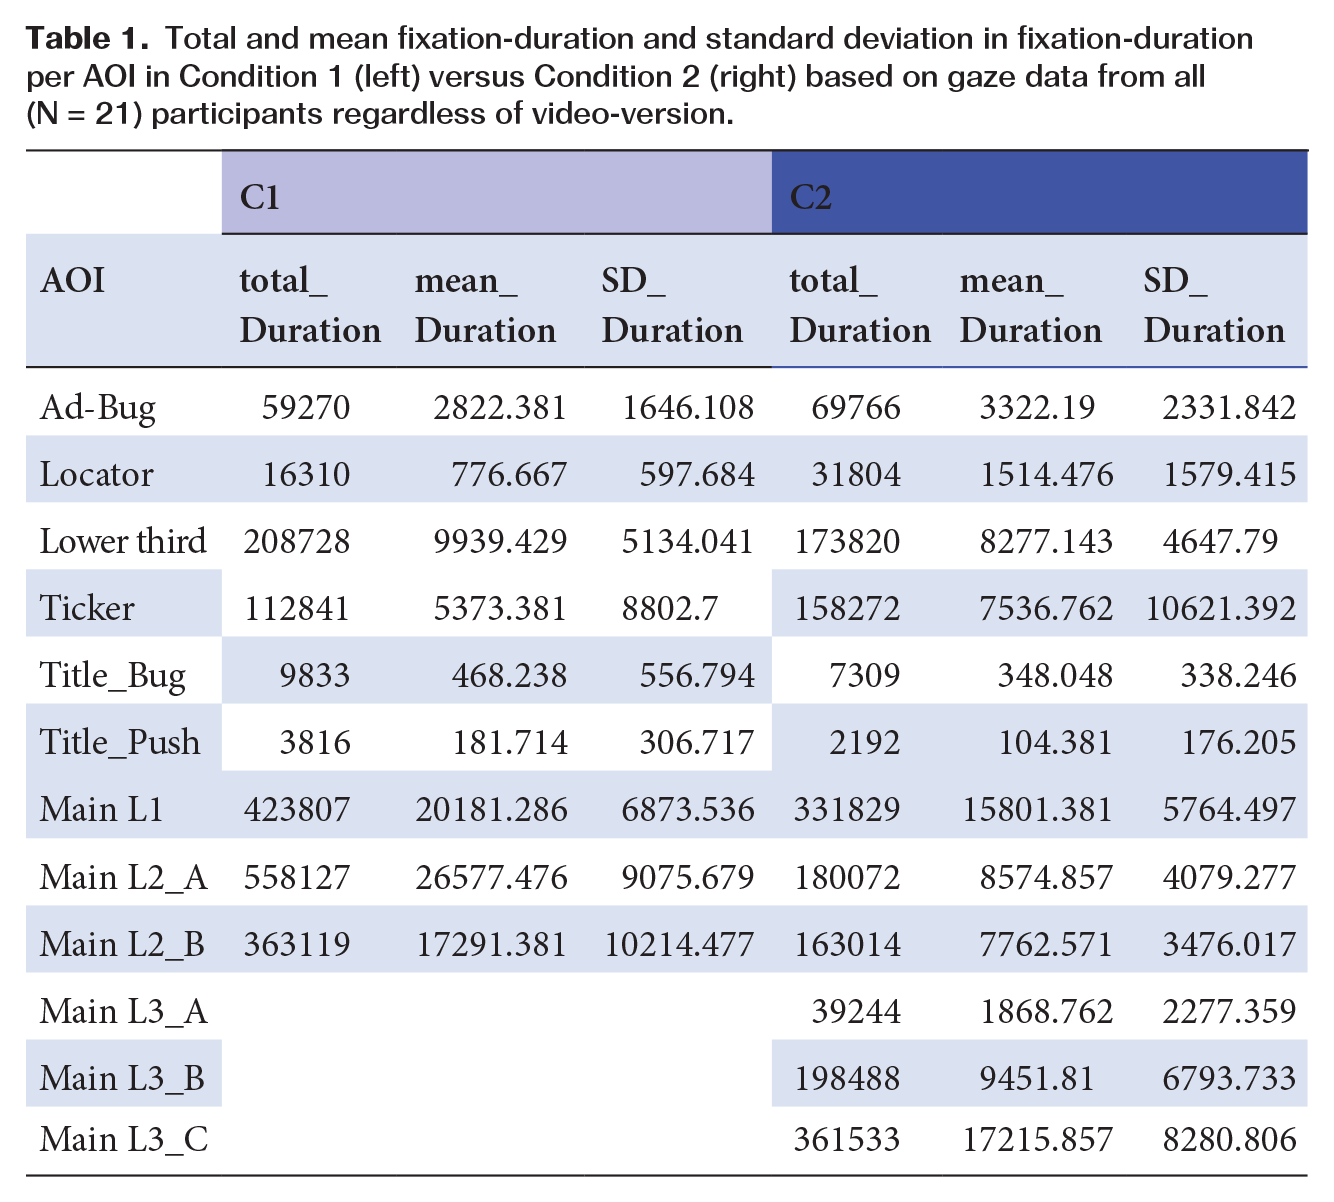
Total fixation times (Table 1) for visual elements were generally significantly lower than for the sections of the main area. The notably high standard deviation in fixation time observed for elements such as locator, station logo, or the ticker in the high complexity condition indicate that these elements received long gazes from some participants while being largely disregarded by others. Condition also had a negative, though barely significant (β = −4380, SE = 2256, p < 0.1), effect as a predictor for modelling total duration of fixations. The on-screen advertisement also notably received longer fixations on average than both the ticker (β = 33.783, SE = 14.485, p < 0.05) and lower third, although the effects are only significant for the former. H1 was still only partially confirmed.
Total and mean fixation-duration and standard deviation in fixation-duration per AOI in Condition 1 (left) versus Condition 2 (right) based on gaze data from all (N = 21) participants regardless of video-version.
Especially in the low complexity condition, several patterns of covariance can be adequately explained by proximity of elements to others. Co-variance between fixations to the on-screen advertisement and the station logo (β = 0.079, SE = 0.034, p < 0.05) as well as ticker and clock element (β = 0.008, SE = 0.002, p < 0.01) is significant and positive in this condition. In the high complexity condition, fixations to the on-screen advertisement show co-variation with fixations to the main screen area L2_B (β = 0.027, SE = 0.009, p < 0.01). Fixations on the lower third in condition 2 also correlated positively with fixations to the adjacent station logo (β = 0.081, SE = 0.041, p < 0.05).
Several effects observed for ticker, locator, lower third and main areas, however, ultimately confirm H2. The ticker exhibited negative covariance with several AOIs related to the central multimodal cluster. Fixations on the ticker co-varied negatively with fixations to the main screen area in both conditions. This is the case for L2_B (low complexity: β = −0.011, SE = 0.006, p < 0.1 | high complexity: β = −0.027, SE = 0.016, p < 0.1) as well as L2_A in the low complexity (β = −0.018, SE = 0.006, p < 0.01) and L1 in the high complexity condition (β = −0.036, SE = 0.009, p < 0.001). Average fixation time did also covary negatively between lower third and ticker (β = −0.177, SE = 0.06, p < 0.1). In the high complexity condition, fixations to the locator correlated positively with fixations to main area L1 (β = 0.015, SE = 0.007, p < 0.01) and negatively with L2_B (β = −0.01, SE = 0.006, p < 0.1). In the low complexity condition, it showed positive co-variance with main screen area L3_B (β = 0.246, SE = 0.073, p < 0.05) and with the lower third (β = 0.174, SE = 0.009, p < 0.05).
5. Effects of Biographical Predictors on Visual Attention Distribution
General news interest was found to have a significant negative effect on fixations in the lower third, (low complexity: β = −0.61, SE = 0.216, p < 0.01 | high complexity: β = −0.511, SE = 0.183, p < 0.01) while high daily TV watch-time had a positive one (low complexity: β = 0.46, SE = 0.231, p < 0.05 | high complexity: β = −0.511, SE = 0.197, p < 0.001). High daily TV watch-time positively affected fixations to the ticker AOI in C1 (β = 1.612, SE = 0.282, p < 0.001), but had a significant negative effect in C2 (β = −0.417, SE = 0.153, p < 0.01). High daily television watch-time also had a significant positive effect on the number of fixations to the locator in C1 (β = 1.52, SE = 0.655, p < 0.05) while general news interest had a significant negative one (β = −1.429, SE = 0.521, p < 0.01). High TV watch-time correlated negatively with fixations to the main area L1 in both conditions (low complexity: β = −0.289, SE = 0.104, p < 0.01 | high complexity: β = −1.337, SE = 0.373, p < 0.001).
In the low complexity condition, high news interest affected the average duration of fixations positively for the lower third (β = 72.74, SE = 28.843, p < 0.05) and negatively for the ticker (β = −252.52, SE = 134.55, p < 0.1) as well as the locator (β = −84.124, SE = 34.517, p < 0.05). In the high-complexity condition, average fixation duration showed no significant co-variance with any of the listed biographical predictors. The two variables highlighted in section 2.2 had significant interactions with gaze behaviour in several ways, confirming H8.
Several interesting patterns of co-variance also emerged in relation to self-reported ease of comprehension. This implies that fixating on or ignoring certain elements at least influenced participants’ perceived mental work load. Ease of comprehension has a significant negative effect on locator fixations (β = −2.207, SE = 0.641, p < 0.001) in the low complexity condition. High ease of comprehension also has a significant negative effect on the fixations on the station logo (β = −1.287, SE = 0.563, p < 0.05) in the low complexity condition. High ease of comprehension had a similar negative effect on fixations on the on-screen advertisement in both conditions (low complexity: β = −0.518, SE = 0.174, p < 0.01 | high complexity: β = −0.924, SE = 0.256, p < 0.001). Fixations to main screen area sub-section L2_B correlate positively with high self-reported ease of comprehension in the low complexity condition (β = 0.5648, SE = 0.1987, p < 0.01).
6. Results on Information Recall
While the results of the information recall test seen in Figure 7 confirm H7, H6 surprisingly had to be rejected. Participants exhibited the lowest recall for ticker items. The highest recall, however, was observed for the headline summaries in the lower third. While the number of dual-coded and headline items recalled is equal in condition 1, the latter increased at the cost of the former in the more complex condition 2. Notably few auditory items were recalled in both conditions, with a slight increase in the more complex one. Modelling the effect of condition on the overall number of items recalled, no significant effect was found (β = −0.024, SE = 0.216, p = ns). Recall of minor visual items was consistently high. Of the 18 correctly recalled minor visual items, 11 were related to the advertisement and only 7 to the locator. The difference between locator and advertisement items was, however, not significant (β = −0.452, SE = 0.484, p = ns). H5 was still confirmed only partially.
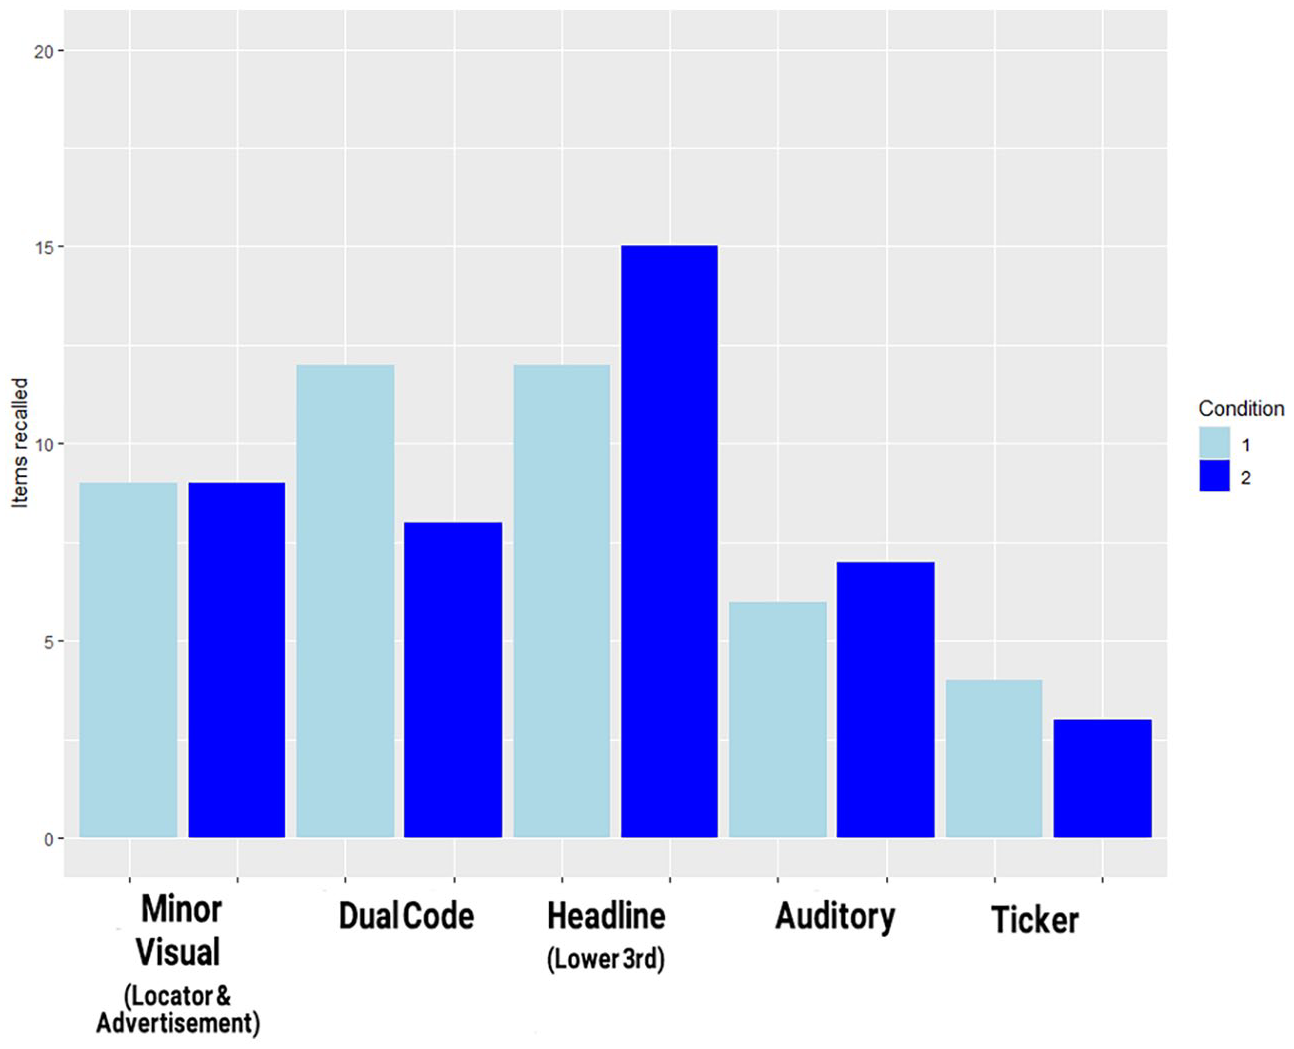
Total number of informational items recalled (y axis) among all (N = 21) participants by information type, compared across conditions.
Using only ‘information type’ as a predictor for number of items recalled across all clips regardless of condition, the difference between ticker items and dual-coded items (β = −1.05, SE = 0.439, p < 0.05) as well as headline items (β = −1.3499, SE = 0.4241, p < 0.01) were significant. Recall of auditory items were also significantly lower than for headline items (β = −0.7309, SE = 0.3376, p < 0.05). Covariance between items of different information types recalled was also modelled, revealing a significant negative relation between number of minor visual items recalled from advertisement and locator (‘Minor visual’) and number of auditory items recalled (β = −2.0152775, SE = 1.1059206, p < 0.1) and a positive one between minor visual items and dual-coded items recalled (β = 0.8751, SE = 0.3667, p < 0.5). Effects of biographical predictors surprisingly had no significant impact on information recall despite daily television watch-time contributing to model strength in condition 2. H9 was thus rejected.
8. Discussion
The gaze data analysed within the context of this study was largely consistent both with the results of previous projects (Josephson and Holmes, 2016; Rodrigues et al., 2012, 2014) and the analysis of the layout in terms of multimodal composition as presented in section 2.1. A large share of registered fixations and overall fixation duration occurred in the main area of the screen and the lower third. Elements outside the multimodal cluster associated with the news read, such as ticker, on-screen advertisement and station logo received significantly fewer fixations despite several of them utilizing animated visual cues.
Modelling the covariation between elements for number and average duration of fixation also provided significant evidence for interactions in line with the initial multimodal analysis. Fixations to the locator co-varied not only with various main-area AOIs, but also the lower third, which is located on the other side of the screen. Participants fixating on one element of the central multimodal cluster were thus likely to also fixate on others regardless of their proximity on screen. The same was also true for the promotional elements (advertisement and logo), although their interaction can be explained by their proximity. Fixations on the semantically unrelated ticker, conversely, showed negative covariance with several of these elements, giving support to the idea that the ticker and central multimodal cluster compete for fixations.
Information presented via the ticker was also recalled significantly less frequently than information presented in the lower third. As suggested by Brechman et al. (2015), the ticker’s continuous crawling animation might have provided an additional detrimental factor for information recall besides its unrelatedness. Attending to its contents requires sustained visual attention and additional cognitive resources for encoding. The lower third, on the other hand, provides short, often redundant, updates and is only updated occasionally. It thus combines several design features which previous studies (Brechman et al., 2015; Josephson and Holmes, 2006; Rodrigues et al., 2014) already found effective. Owing to the ticker’s competitive relationship with the main area and lower third in terms of fixations and the exceedingly low recall of ticker items, its usefulness is brought further into question.
Similar concerns can be raised about the on-screen advertisement. Neither the duration of fixations it received nor the frequency with which participants recalled its contents fell in line with the expectations laid out in hypotheses H1 and H5. As a small, self-contained multimodal text, it consists of several textual elements utilizing different fonts and font sizes alongside one pictorial element (Figure 8). The high average fixation time and the considerably higher total fixation duration elicited by the AOI (Table 1) compared to other visual elements might indicate that participants dedicated more time to processing them. This is also supported by the surprisingly high recall of minor visual items. A significant negative correlation between number of fixations in the AOI and self-reported ease of comprehension in both conditions also indicates, however, that those who frequently attended the advertisement also rated the stimulus materials as harder to comprehend. Another indicator of potential ‘informational interference’ (Josephson and Holmes, 2006) as provided by the significant negative covariance between recall of minor visual items and recall of auditory items suggests that successfully encoding them might take away resources required to encode the aural message of the news read. While a more focused study of locator elements and on-screen advertisements would be in order to fully verify this interpretation, the present study suggests that news-screen layouts featuring on-screen advertisements put the two communicative purposes of informing and advertising in competition.

Example of an on-screen advertisement seen during a CNN news broadcast – from the stimulus materials.
Difference in the distribution of fixations between the two experimental conditions suggests that the introduction of a more complex third split-screen layout in condition 2 was more strongly dispersed towards the edges of the screen than centred in the main screen area. More fixations were received by elements such as the ticker and the advertisement at the expense of the main area and lower third. Condition 2 also negatively impacted the duration of fixations and lead to starker differences in fixation duration between participants. In drawing viewers’ gaze to elements with communicative purposes other than conveying the details of the news story, more complex split-screen layouts might thus be actively detrimental to comprehension, especially as participants might expand additional resources to more actively choose which elements to attend to for how long.
A final set of hypotheses was concerned with the question of whether top-down factors related to participants’ individual interests play a role in navigating and processing the complex multimodal and multi-ergodic environment of television news screens. Two promising variables related to media habits supported by previous literature were general news interest and daily television watch-time. Participants who watched more hours of television per day also had more fixations on the locator and lower third than others. For the ticker, either a significant positive or negative effect was present depending on the experimental condition. High general news interest correlated with fewer fixations on the locator as well as fewer, but also longer, fixations on the lower third. Both predictors were thus associated with significant differences in gaze behaviour which might, on face value, suggest avoidance of visual clutter, or more focused selection of elements related to the central multimodal cluster. Little concrete evidence, however, was found on if and how far the effects observed in gaze distribution translate to differences in information recall, and H9 was ultimately rejected. A severe limitation in this regard was, however, posed by the project’s small sample size prohibiting the reliable modelling of covariance between biographical variables and the number of informational items recalled for specific information types.
9. Conclusion
Digital on-screen graphics can aid the recall of key story items by distributing the effort required to process them across multiple channels or provide additional information for especially invested viewers to attend to. Contemporary news screens, however, commonly feature multiple elements which convey information unrelated to that presented in the news read and it has been argued in this article that we can identify at least three distinct multimodal clusters with distinct communicative purposes.
As one can only ever attend to one area of the screen at a time, however, unnecessary visual clutter always diverts attention and thus cognitive resources away from other areas. As studies repeatedly show that certain elements are rarely attended to and the information they display is unlikely to be recalled, it is getting increasingly clear that we must question their usefulness (Pjesivac et al., 2015: 173). The present study provided evidence for positive interactions between related elements as well as negative interactions between related and unrelated ones in terms of gaze allocation and to a lesser extent information processing. These findings suggest that, while functionally related elements do in fact complement each other in capturing viewers’ attention, the co-presence of the three multimodal clusters puts the communicative aims of informing, providing updates and advertising in competition. Thus, if not adopting a more minimalist aesthetic, contemporary news may well profit from putting greater emphasis on multimodal cohesion.
Footnotes
Data Availability Statement
The datasets generated during and/or analysed during the current study are not publicly available in order to ensure full compliance with the university’s ethical guidelines regarding data privacy but are available from the corresponding author on reasonable request.
Ethical Considerations
Experimental data was gathered in full accordance with the ethical guidelines of the university.
Consent to Participate
Participants were informed, prior to participation, that results will be published in anonymized form. All participants have given written consent for their data to be used in anonymized form.
Biographical Note
JAN HENSELLEK is an MA student in the English-Speaking Cultures: Language, Text, Media program at Bremen University. His research interests include internet linguistics, user-generated online fiction and multimodality with a focus on news media and popular culture.
Address: Department 10: Linguistics and Literary Sciences, Bremen University, Universitäts-Boulevard 13, Bremen 28359, Germany. [email: