
Abstract
Hypothesis/Introduction
Hypoxia defines clear cell renal cell carcinoma (ccRCC), but its transcriptional and therapeutic consequences are unclear. We hypothesized that a specific hypoxia-induced long noncoding RNA (lncRNA) signature links VHL–HIF signaling to immune modulation and anti-angiogenic therapy response.
Materials and Methods
We integrated multi-cohort transcriptomic data to prioritize hypoxia-associated lncRNAs in ccRCC. Direct regulation of candidate lncRNAs by HIF-1α was validated using ChIP-qPCR, and functional assays in RCC cell lines involving HIF-1α silencing, ectopic VHL expression, and HIF-1α overexpression. The tumor microenvironment and therapeutic vulnerabilities were analyzed using bioinformatic tools.
Results
We identified a five-lncRNAs signature, with AP004372.1 and AC046143.3 confirmed as direct HIF-1α transcriptional targets. This signature defined an immunosuppressive milieu with high Tregs, elevated checkpoints (PD-1, CTLA4, TIGIT), and inhibitory cytokines. These tumors also showed heightened predicted sensitivity to VEGF-targeted therapies (sunitinib, pazopanib).
Conclusions
Our study uncovers a hypoxia-regulated lncRNA circuit that is directly driven by HIF-1α and functionally connected to immune evasion and angiogenic dependency. This program provides a mechanistic and clinically actionable framework for stratifying ccRCC patients beyond conventional classifiers.
Keywords
Introduction
Renal cell carcinoma (RCC) comprises more than 90% of kidney malignancies. 1 Representing the predominant form of RCC (over 75% of cases), 2 clear cell RCC (ccRCC) is often marked by the loss of Von Hippel–Lindau (VHL) gene.3,4 Inactivation of VHL results in stabilization and accumulation of hypoxia-inducible factors (HIF-1α and HIF-2α). 5 Consequently, these factors subsequently move to nucleus and drive expression of genes mediating angiogenesis, erythropoiesis, and metabolic reprogramming. 6 These changes promote tumor growth, invasion, and metastasis. Based on this pathway, VEGF-targeted tyrosine kinase inhibitors (TKIs) are established treatments for advanced ccRCC. 7 However, therapeutic resistance often emerges, and overall survival (OS) remains a significant challenge, underscoring the imperative to develop new prognostic markers and VHL–HIF pathway-directed therapies.
Conventionally defined by a length over 200 nucleotides and lack of protein-coding function,8,9 long noncoding RNAs (lncRNAs) are now established as crucial regulators in cancer biology. Their functions span critical aspects of cancer progression, contributing to angiogenesis, 10 drug resistance, 11 and metastasis. 12 Several studies have shown that lncRNAs can serve as prognostic indicators or therapeutic targets in ccRCC.13–16
Importantly, emerging evidence suggests a reciprocal regulatory relationship between HIFs and lncRNAs. HIF-1α can transcriptionally activate specific lncRNAs, such as ENTPD3-AS1, 17 while some lncRNAs, including HABON, 18 have been shown to upregulate HIF-1α expression. Nevertheless, the prognostic relevance of HIF-regulated lncRNAs in ccRCC has not been comprehensively evaluated. Beyond its role in angiogenesis and metabolism, hypoxia is a pivotal sculptor of the tumor immune microenvironment. It can directly foster an immunosuppressive niche by upregulating immune checkpoint molecules (e.g., PD-L1), recruiting regulatory T cells (Tregs) and myeloid-derived suppressor cells (MDSCs), and impairing the cytotoxic function of CD8+ T cells and NK cells, resulting in T cell exhaustion.19–21 Given that lncRNAs have emerged as key mediators of immune responses, we postulated that a specific subset of HIF-responsive lncRNAs might serve as critical connectors between the core VHL-HIF pathway and the establishment of an immunosuppressive phenotype in ccRCC. Clarifying the connection between the VHL-HIF pathway and lncRNA expression, and identifying clinically useful HIF-responsive lncRNAs, may offer new biomarker candidates for predicting patient outcomes and guiding treatment strategies in ccRCC.
This study utilized extensive transcriptomic data from The Cancer Genome Atlas (TCGA) database, Cancer Cell Line Encyclopedia (CCLE) database, and Genotype-Tissue Expression (GTEx) database, to investigate prognostic relevance of HIF-regulated lncRNAs in ccRCC. We developed a five-lncRNA prognostic model associated with HIF activity and validated its clinical relevance. Notably, two of these lncRNAs—AP004372.1 and AC046143.3—were experimentally confirmed to be direct transcriptional targets of HIF-1α, suggesting their potential as both prognostic markers and therapeutic candidates.
Materials and methods
Data acquisition
Publicly available data was acquired from the following sources. RNA sequencing data and clinical data for 531 ccRCC and 72 normal kidney controls were sourced from the TCGA database. Data on VHL gene mutations in 31 RCC cell lines were retrieved from the CCLE database. Additionally, data for 27 normal kidney specimens were sourced from the GTEx database through the UCSC Xena platform.
Quantification of HIF activity
The transcriptional activity of HIF was quantified based on a curated signature of 44 well-established HIF target genes, as previously described and validated.22,23 [This signature was sourced from the Molecular Signatures Database (MSigDB) “HALLMARK_HYPOXIA” gene set, which represents a consensus list of genes consistently induced by hypoxia across numerous studies.] The complete list of the 44 genes is as follows: [ADM1, BNIP3, BNIP3L, CA12, CA9, CDKN1A, CP, CXCR4, DDIT4, EDN1, EDN2, EGLN1, EGLN3, ENO1, ERO1L, FLT1, GAPDH, HK1, HMOX1, IGFBP3, LDHA, LOX, MIF, MXI1, NDRG1, P4HA1, P4HA2, PDK1, PFKFB3, PFKFB4, PGAM1, PGK1, PIM1, PLOD1, RORA, SERPINE1, SLC2A1(GLUT1), STC2, TFR2, TFRC, TGFA, TGFB3, VEGFA, and TMEM45A.] [The specific application and prognostic relevance of this core HIF target gene signature in renal cell carcinoma have been directly validated by Li et al. 22 ].
HIF activities were computed independently for the TCGA-KIRC tumor cohort, the CCLE RCC line panel, and the GTEx normal kidney tissues. For each dataset, the raw expression data for each of the 44 genes were first rescaled to set the median expression value across samples equal to 1. The HIF activity for each sample was determined by averaging these normalized expression values.
For example, in CCLE dataset, we calculated HIF activity for 31 RCC cell lines: SNU349, TUHR4KTB, VMRCRCW, KMRC3, SLR25, TUHR0TKB, RCC10RGB, OSRC2, A704, SLR23, A498, SNU1272, TUHR14TKB, KMRC2, CAKI1-2, SKRC20, KMRC1, CAKI-1, SLR21, KMRC20, UO31, SLR26, VMRCRCZ, SKR24, ACHN, 786O, HEKTE, SLR20, UOK101, 769P, and CAL54. From this panel, seven cell lines (OSRC-2, 786-O, CAKI-1, A704, A498, 769-P, and ACHN) were chosen from this panel for experimental validation, with their HIF activity scores shown in Figure 4(a).
Identification of HIF activity-related genes and enrichment analysis
RCC cell lines sourced from the CCLE dataset were stratified into low- and high-HIF activity cohorts based on median HIF activity score. The limma R package was used to detect differentially expressed genes (DEGs), with significant DEGs defined as those exhibiting an FDR < 0.05 and |log2Foldchange| ≥ 1. Functional enrichment analysis of differentially expressed genes was carried out via Metascape (https://metascape.org/). 24
Identification of HIF activity–associated lncRNAs
A Pearson correlation analysis was performed to determine lncRNAs linked to HIF activity. lncRNAs with absolute correlation exceeding 0.1 and a p-value less than 0.01 were deemed statistically significant and chosen for further analysis. Furthermore, we took an intersection of HIF-activity-related lncRNAs screened from 31 RCC cell lines, 99 normal kidney tissues (27 from GTEx and 72 from TCGA-KIRC) and 531 ccRCC tumors. The intersected HIF-activity-related lncRNAs were then utilized for additional investigation.
Construction and evaluation of the HIF-activity-related lncRNA signature
A lncRNA signature associated HIF activity was developed using a multi-step statistical process, including univariable Cox regression, least absolute shrinkage and selection operator (LASSO) regression and multivariable Cox regression. Initially, univariable Cox regression was applied to pinpoint prognostic lncRNAs. Subsequently, LASSO was employed to refine the selection of survival-associated lncRNAs identified from the univariable analysis. A multivariate Cox regression was conducted to develop prognostic signature: Risk Score = (0.58 × AP004372.1 expression) + (1.12 × TMEM92-AS1 expression) + (0.82 × AC046143.3 expression) + (−1.52 × RP11-327P2.5 expression) + (−0.97 × LINC01801 expression), where the coefficient obtained from the multivariate Cox regression analysis. 25
Validation of the HIF-activity-related lncRNA signature
The 531 ccRCC tumor samples were dichotomized into two groups using median risk score as cutoff. Kaplan–Meier survival analysis showed a significant association between risk stratification and overall survival (OS), while time-dependent receiver operating characteristic (ROC) curves assess predictive accuracy. Additionally, the signature’ stability was confirmed using the Fudan University Shanghai Cancer Center (FUSCC) cohort.
Nomogram construction and evaluation
A nomogram was developed by incorporating the lncRNA-based risk score with other independent predictors identified through multivariate Cox regression. The model's predictive accuracy was assessed using time-dependent ROC analysis and calibration plots.
Cell culture and reagents
All human RCC cell lines 786-O, 769-P, OSRC-2, ACHN, A498, A704, and CAKI-1 were sourced from the National Collection of Authenticated Cell Cultures (Shanghai, China).
Cells, including 786-O, 769-P and OSRC-2 were cultured under standard conditions using RPMI-1640 medium (Cat. # 11875; Gibco); ACHN, A498, and A704 were maintained in MEM (Cat. # 11095080; Gibco); and CAKI-1 was propagated in McCoy's 5A medium (Cat. # 16600082; Gibco). All media were enriched with 10% fetal bovine serum (FBS) (Cat. # A5670402; Gibco) and penicillin-streptomycin (Cat. # 15140122; Gibco).
Lentiviral transduction and stable cell line establishment
Lentiviral particles were packaged in HEK293T cell using Neofect™ transfection reagent (Cat. # TF20121201; Gibco). For stable overexpression or knockdown, lentiviral vectors (pCDH and pLKO.1) were co-transfected into HEK293T cells with packaging plasmids psPAX2 (Cat.Addgene plasmid # 12260;) and pMD2.G (Cat.Addgene plasmid # 12259) using standard protocols. Lentiviral supernatants were harvested at 48 h post-transfection and used to transduce target RCC cells in the presence of polybrene (Cat. # ES-8425; ECOTOP). Puromycin selection (2 μg/mL) (Cat. # A1113803; Gibco) initiated at 48 h post-transduction and maintained for 7 days established stable lines. The sequences for HIF-1α-targeting shRNAs were as follows: shRNA#1: 5′- GAA ACT CTT CCA AGC AAT TTT -3′; shRNA#2: 5′- CTA GAG ATG CAG CAA GAT C -3′; shRNA#3: 5′- GAG AGA AAT GCT TAC ACA C -3′; Control: 5′- TTCTCCGAACGTGTCACGTTTC -3′.
Quantitative real-time PCR analysis
ccRCC tissues (n = 214) were collected from patients undergoing partial or radical nephrectomy at FUSCC between May 2005 and May 2010. Samples were stored in RNAlater (Cat. # AM7024; Invitrogen) and preserved at −20 °C. Ethics approval (FUSCC-IRB-S2025-0847) was granted by the institutional review board of FUSCC.
Total RNA was isolated from cells using TRIzol™ Reagent (Cat. # 15596026CN; Invitrogen) and reverse transcribed into first-strand complementary DNA (cDNA) using the PrimeScript™ RT Master Mix kit (Cat. # RR036A; Takara). Following cDNA synthesis, input cDNA was standardized and amplified for 40 cycles using TB Green™ Premix Ex Taq™ II (Cat. # RR820A; Takara) with gene-specific primers on a Roche LightCycler® 480 system (Roche, Basel, Switzerland). Gene expression were normalized to β-actin and are presented as relative quantitation, which were calculated by the 2–ΔΔCt method. All reactions were run in triplicate. β-actin F: 5′- ACCGAGCGC GGCTACAG -3′ R: 5′- CTTAATGTCACGCACGATTTCC- 3′; LINC01801 F: 5′- CTT AGGCCCCTGGTGTTCTG -3′; R: 5′- AATCAGAGCATGTGAGGGCC -3′; TMEM92-AS1 F: 5′- TAGTCCCATAGTCCCAGCCC -3′ R: 5′- GCAAGCGGGTCT TCTTCCTT -3; AC046143.3 F: 5′- TCCACCCAGTCACACTCTGA -3′ R: 5′- CAT CGGTGGAGCTCTTGGAG -3′; RP11-327P2.5 F: 5′- AATGGG GGTCTTACTGCT GC -3′ R: 5′- TTCTCATCCCCTCTCTGC GA -3′, AP004372.1 F: 5′- TACAGAGGC CGCAGAGGTTA -3′; R: 5′- CCCGCCCTCTACGTCTGATA-3′.
Western blot analysis
Post-treatment, cells underwent three times with ice-cold PBS and lysed on ice for 30 min using RIPA buffer (Cat. # 89900; Thermo Scientific) supplemented with protease and phosphatase inhibitors (Cat. # P1048; Beyotime). Lysates were centrifuged at 12,000 × g for 15 min at 4°C. Protein concentrations in supernatants were quantified with a BCA Protein Assay Kit (Cat. # P0009; Beyotime). Proteins were denatured in loading buffer at 100°C for 10 min, separated on 10% SDS-polyacrylamide gels, and transferred to PVDF membranes (Cat. # IPVH00010; Millipore). Membranes were blocked with 5% non-fat milk in TBST (0.1% Tween-20; Cat. # ST825, Beyotime) for 1 h at room temperature, then incubated overnight at 4 °C with the following primary antibodies: HIF-1α (1:1000; Cat. # ab51608; Abcam), VHL (1:1000; Cat. # ab273655; Abcam), or β-actin (1:500; Cat. # sc47778; Santa Cruz).
Chromatin immunoprecipitation (ChIP) assays
The EZ-Magna G kit (Cat. # 17-409; Millipore) was used for ChIP assays. Briefly, 786-O were cultured in 15-cm dishes and fixed with 1% formaldehyde (Cat. # 28908, Gibco), and genomic DNA was used for sonication to reduce its size. We use 5–10 μg of control antibody IgG and 5–10 μg of target antibody HIF-1α. Promoter regions of AP004372.1 and AC046143.3 were scanned for HIF-1α binding motifs using JASPAR and UCSC genome browser. The primer sequences were as follows: AP004372.1-#1: 5′- TGT GAC AGC TAA GCA ACA GT -3′, 5′- CAA CTA TCC TGC AAG TCA AAG AA -3′; AP004372.1-#2: 5′- AGC ATT GGA GAC TGG CAA GA -3′, 5′- ATT CCT GAC CTG TGC TGT GT -3′; AC046143.3-#1: 5′- CAA TTA GTT GCG CTG CTG AAG -3′, 5′- AGA GTG AGA GGC AGA TGT GG -3′.
Luciferase reporter assay
Promoter fragments, approximately 1.5 kb in length, upstream of the transcription start sites of AP004372.1 and AC046143.3, were amplified from human genomic DNA and inserted into the pGL3-Basic vector. In AP004372.1, two predicted HIF-1α binding motifs (5′-GTACGTGATT-3′, −321/−312 and 5′-AAAGGTGCAA-3′, −214/−205 relative to the TSS) were individually or simultaneously mutated to disrupt the hypoxia response element core sequence (ACGTG → AAAAG) using the Mut Express II Fast Mutagenesis Kit (Vazyme), yielding Mut1, Mut2, and Mut1 + 2 constructs. For AC046143.3, a single predicted binding motif (5′-AAACGTGCCG-3′, −693/−684) was similarly mutated (ACGTG → AAAAG) to generate the Mut construct.
Cells were plated in 24-well plates and co-transfected with 400 ng of the specified pGL3 reporter plasmid along with 40 ng of the pRL-TK Renilla plasmid as an internal control, using Lipofectamine 3000 (Invitrogen). After 24 h, luciferase activity was assessed.
Statistical analysis
All statistical analyses were conducted using R (v4.1.2) and GraphPad Prism (v9.0). Group comparisons were conducted using the Wilcoxon rank-sum test for non-parametric data and the unpaired Student's t test for parametric data. Correlations analyses were conducted using Pearson's correlation coefficient. Survival probabilities were assessed using the Kaplan-Meier method, and group differences were evaluated with the log-rank test. Hazard ratios (HRs) were obtained using univariate and multivariate Cox proportional hazards models. Time-dependent ROC curves were generated using timeROC package in R, while further selection was conducted through LASSO regression with the glmnet package. Multiple comparisons were adjusted using FDR. A two-sided p-value below 0.05 was considered statistically significant.
Results
ccRCC exhibits pan-cancer highest HIF activity, enriched by VHL mutations, but lacks prognostic value
Our pan-cancer analysis indicated that HIF activity was significantly elevated in tumors relative to normal tissues (the pan-cancer distribution of HIF activity is illustrated in Figure 1; p value ranging from 0.05 to 0.0001, Wilcoxon test; Figure 2(a)). Of the 31 cancer types analyzed; renal cell carcinoma (RCC) showed the highest HIF activity (p < 0.0001 compared to other cancers; Figure 2(a)). Among RCC subtypes, clear cell RCC (ccRCC) exhibited the most pronounced HIF activation (p < 0.0001 vs. non-ccRCC, Wilcoxon test; Figure 2(b)). Consistent with this observation, HIF activity was markedly higher in ccRCC tumors than in matched adjacent non-neoplastic tissues (p < 0.0001; Figure 2(c)). In contrast, no significant difference was detected between healthy kidney samples from GTEx and tumor-adjacent normal tissues from TCGA (Figure 2(d)).

Flowchart of the study design for the construction and validation of the HIF activity-associated lncRNA prognostic signature in ccRCC.

Comprehensive profiling of HIF activity in RCC: cell line heterogeneity, VHL dependence, and prognostic significance in ccRCC. (a) HIF activity in tumor vs. normal tissues across cancers (Wilcoxon test, *p < 0.05, **p < 0.01, ***p < 0.001, ****p < 0.0001). (b) HIF activity by kidney cancer pathological type (Wilcoxon test, ****p < 0.0001). (c) HIF activity in normal vs. tumor tissues (TCGA-KIRC; Wilcoxon test, ****p < 0.0001). (d) HIF activity in normal kidney tissues from GTEx vs. matched normal adjacent tissues from TCGA-KIRC (Wilcoxon test, NS). (e) HIF activity in cancer cell lines (CCLE; Wilcoxon test, RCC vs. other cancers: p < 0.0001). (f) Heatmap of 44 HIF target genes and HIF activity in 31 RCC cell lines (CCLE). Cell lines ordered by ascending HIF activity score (threshold = 1.76, based on the median of HIF activity score). VHL status: mutant (red), wild-type (blue). Fisher's exact test p-value for VHL mutation enrichment in high-HIF group. (g) HIF activity in VHL-mutant vs. VHL-wild-type RCC cell lines (CCLE; Wilcoxon test, *p < 0.05). (h) Volcano plot of differentially expressed genes (DEGs) between high- and low-HIF activity cell lines. 119 significantly upregulated genes (FDR < 0.05, log2FC > 1). (i) Pathway enrichment analysis (Metascape) of genes upregulated in high-HIF activity cell lines. Top enriched pathways: 1. Hypoxia; 2. HIF-1 signaling. (j) HIF activity by tumor grade (TCGA-KIRC; Wilcoxon test, NS). (k) HIF activity by tumor stage (TCGA-KIRC; Wilcoxon test, NS). (l–m) Kaplan-Meier curves for overall survival (OS, l) and progression-free survival (PFS, m) in TCGA-KIRC patients stratified by high vs. low HIF activity (based on median split; log-rank test p-value shown). Data are mean ± SEM. NS, not significant. Asterisks denote significance levels as in (a).
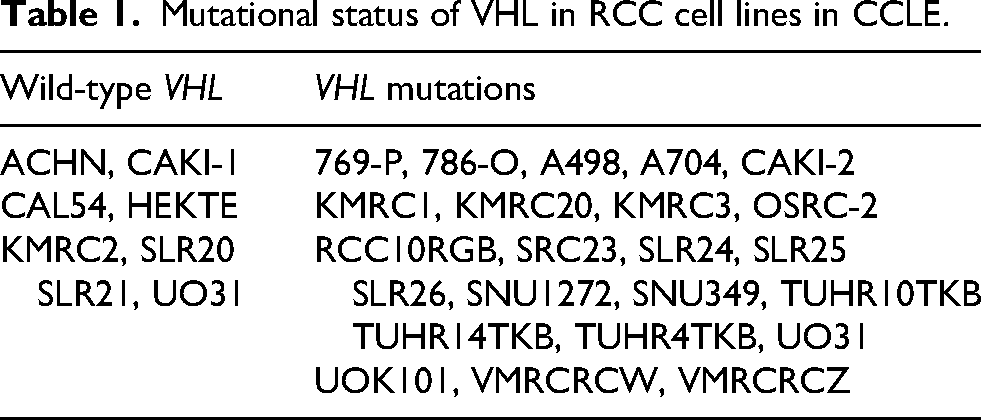
To explore the mechanistic basis of HIF dysregulation, we analyzed cancer cell lines from the CCLE database. RCC lines displayed significantly higher HIF activity than those derived from other cancer types (p < 0.0001, Wilcoxon test; Figure 2(e)). Unsupervised clustering of 31 RCC cell lines, ordered by ascending HIF activity, identified two distinct groups: low-HIF (n = 16) and high-HIF (n = 15) (Figure 2(f)). Strikingly, VHL mutations were notably more prevalent in the high-HIF group: 14/15 exhibiting these mutations, compared to only 9/16 in the low-HIF group (Figure 2(f)). Consistent with this, VHL-mutated lines exhibited significantly elevated HIF activity relative to VHL-wild lines (Figure 2(g), Table 1).
Mutational status of VHL in RCC cell lines in CCLE.
Analysis of differential expression between high- and low-HIF groups revealed 119 genes significantly upregulated in high-HIF lines (log2FC > 1, FDR < 0.05; Figure 2(h)). Pathway enrichment analysis of these genes revealed “Response to hypoxia” as the top-ranked term, followed by “HIF-1 signaling” (Figure 2(i)). In TCGA-KIRC tumors, HIF activity showed no correlation with tumor grade (Figure 2(j)) or stage (Figure 2(k)). Most importantly, stratification of patients based on HIF activity levels revealed no significant differences in OS (Figure 2(l)) or PFS (Figure 2(m)).
Development and validation of a HIF activity-associated 5-lncRNA prognostic signature in ccRCC
To develop a robust prognostic signature, we first integrated transcriptomic data from three cohorts—RCC cell lines (CCLE), normal kidney tissues (GTEx combined with TCGA normal), and ccRCC tumors (TCGA-KIRC). This analysis identified 29 lncRNAs significantly correlated with HIF activity (p < 0.05), representing conserved, core HIF-responsive transcripts (Figure 3(a)).

A five-lncRNA prognostic model derived from HIF activity in ccRCC. (a) Venn diagram illustrating the overlap of 29 lncRNAs significantly correlated with HIF activity across three cohorts: RCC cell lines (CCLE), normal kidney tissues (GTEx combined with TCGA normal), and ccRCC tumors (TCGA-KIRC). (b) Prognostic screening of the 29 HIF-associated lncRNAs in the TCGA-KIRC cohort. The Heatmap summarizes the stepwise feature selection process: Univariate Cox regression identified 16 lncRNAs with p < 0.05, LASSO regression narrowed these to 7 features; Multivariate Cox regression finalized a 5-lncRNAs signature (p < 0.05). (c–d) LASSO coefficient profiles (c) and 10-fold cross-validation curve (d). (e) Multivariate Cox regression coefficients for the five prognostic lncRNAs in the final signature. (f–j) Kaplan-Meier OS analysis based on the expression levels of each individual lncRNA in the signature: (f) AP004372.1, (g) TMEM92-AS1, (h) AC046143.3, (i) RP11-327P2.5, (j) LINC01801. (k) Kaplan-Meier OS curves comparing patients stratified into high- vs. low-risk groups based on the 5-lnvRNA signature. (l) Time-dependent ROC curves evaluating the predictive performance of the risk model at 1–7 years. All analyses presented in panels (b–l) were performed using the TCGA-KIRC cohort.
Through a multi-step regression analysis of the TCGA-KIRC cohort, we established a prognostic signature comprising five HIF-activity-associated lncRNAs (Figure 3(b)–(e)). Among these, three lncRNAs—AP004372.1, TMEM92-AS1, and AC046143.3—were linked to a higher risk (HR > 1), while two—RP11-327P2.5 and LINC01801—were protective (HR < 1) (Figure 3(f)–(j)).
Functional characterization classified these five lncRNAs into two categories based on their HRs. Three were risk-promoting (HR >1): AP004372. (HR = 1.515; Figure 3(f)), TMEM92-AS1 (HR = 2.360; Figure 3(g)), and AC046143.3 (HR = 1.629; Figure 3(h)). The remaining two were protective (HR <1): RP11-327P2.5 (HR = 0.295; Figure 3(i)) and LINC01801 (HR = 0.412; Figure 3(j)), with high expression of RP11-327P2.5 associated with a 70.5% reduction in death risk.
We then constructed: Risk Score = (0.58 × expression of AP004372.1) + (1.12 × expression of TMEM92-AS1) + (0.82 × expression of AC046143.3) + (−1.52 × expression of RP11-327P2.5) + (−0.97 × expression of LINC01801). Kaplan-Meier analysis indicated that high-risk patients had a poorer OS (p < 0.0001), with a hazard ratio of 3.342 relative to the low-risk group (Figure 3(k)). Time-dependent ROC analysis demonstrated the superior predictive performance of the risk model over tumor grade across 1 to 7 years, with 3-year AUCs of 0.72 (risk score) vs 0.70 (grade) and 5-year AUCs of 0.71 (risk score) vs. 0.67 (grade) (Figure 3(l)).
Pan-Validation of the 5-lncRNA risk signature: association with VHL/HIF, clinical staging, and robust prognostic stratification across cohorts
To first establish the fundamental biological relevance of the 5 identified lncRNAs, we interrogated their expression patterns across 20 cancer types using TCGA pan-cancer data. This analysis revealed distinct, tumor-specific expression profiles (Supplementary Figure S1A-E). Notably, LINC01801 and TMEM92-AS1 were frequently upregulated in multiple malignancies, including KIRC, whereas RP11-327P2.5 was broadly downregulated. These pan-cancer aberrations underscore their potential roles in oncogenesis and provide a rationale for constructing a prognostic signature based on these transcripts.
Validation in RCC Cellular Models: Unsupervised clustering of 31 RCC cell ordered by ascending risk score (threshold = 0.44), clearly segregated them into two groups (Figure 4(a)). VHL mutations were more prevalent in high-risk cell lines (14/15 compared to 9/16 in low risk). Additionally, cells with VHL mutation exhibited significantly higher risk scores than wild-type cells (p < 0.0001, unpaired two-tailed t-test; Figure 4(b)).

Validation of the HIF-activity-derived lncRNA risk signature in multi-dimensional cohorts. (a–d) Analysis in CCLE-RCC cell lines (n = 31). (a) Heatmap depicting the risk scores and HIF activity. (b) Comparison of risk scores between VHL-mutated and VHL-wild cell lines (unpaired t-test, ****p < 0.0001). (c) Scatter plot showing a significant positive correlation between the risk score and HIF activity (Pearson's r = 0.589, p = 0.0005). (d) Correlation matrix of the risk score, HIF activity, and signature lncRNAs (red, positive correlation; blue, negative correlation; Pearson's correlation). (e–i) Analysis in the TCGA-KIRC and GTEx cohort. (e–f) Risk scores are significantly elevated in kidney cancer subtypes (e) and ccRCC tumors compared to normal tissues (f) (unpaired t-test, ****p < 0.0001). (g) The risk score positively correlates with HIF activity (Pearson's r = 0.347, p < 0.0001). (h) An expanded correlation matrix incorporating additional variables (format as in d). (i) Risk scores increase with higher tumor grade (unpaired t-test, ****p < 0.0001). (j–n) Subgroup survival analysis in TCGA-KIRC. (j, k) OS stratified by the risk score in patients with low-grade (Grade I-II j) and high-grade (Grade III-IV, k) tumors. (l) Risk scores are significantly associated with advanced tumor stage (unpaired t-test, ****p < 0.0001). (m–n) OS stratified by the risk score in patients with early-stage (Stage I-II, m) and advanced-stage (Stage III-IV, n) disease. (o–t) Independent validation in the FUSCC cohort. (o, r) Association of risk scores with tumor grade (o) and stage (r) (unpaired t-test, ****p < 0.0001). (p–q) OS analysis in grade I-II (p) and grade III-IV (q) subgroups. (s–t) OS analysis in stage I-II (s) and stage III-IV (t) subgroups. Data presented as mean ± SEM. All correlation analyses were performed using Pearson's method. Statistical significance for comparisons was determined by unpaired t-test.
A strong positive correlation was observed between risk scores and HIF activity across cell lines (Figure 4(c)). Supporting the signature's mechanistic relevance, correlation matrix analysis confirmed positive associations between risk scores and both HIF activity and risk-promoting lncRNAs (AP004372.1, TMEM92-AS1, AC046143.3), while revealing negative correlations with protective lncRNAs (RP11-327P2.5, LINC01801) (Figure 4(d)).
Clinical Validation in Human Tissues: In the TCGA-KIRC/GTEx cohort, ccRCC tumors exhibited significantly higher risk scores than both non-ccRCC subtypes and normal kidney tissues (p < 0.0001 for both comparisons, t-test; Figure 4(e) and (f)). The signature maintained a robust positive correlation with HIF activity across clinical specimens (r = 0.347, p < 0.0001; Figure 4(g)), with expanded correlation matrices recapitulating conserved lncRNA-HIF relationships (Figure 4(h)). Critically, higher risk scores associated with advanced tumor grade (Figure 4(i)) and stage (Figure 4(l)), confirming clinical relevance. Table 2 further summarizes the distribution of clinicopathological characteristics stratified by risk score in both TCGA and FUSCC cohorts. Prognostic Performance Across Subgroups: Stratified survival analysis in TCGA-KIRC demonstrated significant prognostic discrimination. For Grade I–II tumors, high-risk patients exhibited worse OS (HR = 2.191, p = 0.0087; Figure 4(j)), while in Grade III–IV cases, risk stratification remained significant (HR = 3.129, p < 0.001; Figure 4(k)). Similarly, early-stage (I–II) patients showed strong separation (HR = 2.430, p = 0.0008; Figure 4(m)), with maintained prognostic value in advanced stages (III–IV: HR = 2.526, p < 0.01; Figure 4(n)).
Clinicopathological characteristics in relation to HIF-activity-associated risk score in ccRCC patients in TCGA and FUSCC cohort.

External Validation in FUSCC Cohort: The FUSCC cohort independently confirmed elevated risk scores in high-grade (Figure 4(o)) and advanced-stage tumors (Figure 4(r)). Consistent subgroup stratification was observed: Grade I–II tumors showed significant OS separation (HR = 2.537, p = 0.032; Figure 4(p)), while Grade III–IV maintained prognostic discrimination (HR = 2.965, P = 0.0019; Figure 4(q)). For Stage I–II patients, clear risk distinction emerged (HR = 2.132, p = 0.0136; Figure 4(s)), with particularly robust stratification in Stage III–IV cases (HR = 3.508, p = 0.0211; Figure 4(t)).
This multidimensional validation establishes that: 1) The signature directly reflects VHL mutation status and HIF activity at the cellular level; 2) It effectively discriminates tumors from normal tissue and advanced versus early disease across independent cohorts; 3) Its prognostic power persists in both early-stage (TCGA Stage I–II HR = 2.43, FUSCC HR = 2.13) and advanced-stage disease (TCGA Stage III–IV HR = 2.53, FUSCC HR = 3.51), demonstrating robust clinical applicability.
Experimental validation of the 5-lncRNA signature and direct transcriptional regulation of AP004372.1 and AC046143.3 by HIF-1α
To experimentally validate the five-lncRNA signature, we began by evaluating HIF activity and risk scores across seven RCC cell lines. Consistent with our computational predictions, both parameters were elevated in OSRC-2, 786-O, and 769-P, and comparatively lower in A498, CAKI-1, and ACHN cells (Figure 5(a) and (b)). Subsequent qRT-PCR analysis of all five lncRNAs revealed that the three risk-associated lncRNAs (AC046143.3, AP004372.1, and TMEM92-AS1) were upregulated in high-risk cell lines (p < 0.0001; Figure 5(c)–(e)), whereas the two protective lncRNAs (RP11-327P2.5 and LINC01801) were downregulated (Figure 5(f) and (g)). Notably, the risk scores calculated from qPCR data strongly correlated with those derived from transcriptome analyses (Figure 5(h)), underscoring the robustness of our signature at the experimental level.

Mechanistic insights into HIF-1α-mediated lncRNA regulation in RCC cellular models. (a–b) HIF activity (a) and risk scores (b) across seven RCC cell lines from the CCLE database. (c–g) qRT-PCR validation of the five signature lncRNAs in seven RCC cell lines normalized to OSRC-2 (unpaired t-test): (c) AC046143.3; (d) AP004372.1; (e) TMEM92-AS1; (f) RP11-327P2.5; (g) LINC01801. (h) Correlation between risk scores calculated from qRT-PCR data and transcriptome-derived risk scores. (i–j) HIF-1α enrichment at lncRNA promoters (ChIP-qPCR vs. IgG): (i) AP004372.1. (j) AC046143.3. (k) Quantification of HIF-1α enrichment at the promoters of AP004372.1 and AC046143.3 by ChIP-qPCR, compared to IgG control (unpaired t-test, n = 3). (l–m) Dual-luciferase reporter assays testing the transcriptional activation of (l) AP004372.1 and (m) AC046143.3 promoters by HIF-1α. Mutation of the predicted HREs impaired or abolished HIF-1α-induced promoter activity. Data are presented as mean ± SEM of triplicate experiments. (n) Western blot analysis confirming HIF-1α knockdown efficiency in 786-O cells using three independent shRNA. (o) Expression levels of AP004372.1 and AC046143.3 following HIF-1α knockdown in 786-O cells (vs. shNC; unpaired t-test, n = 3). (p) Western blot analysis of VHL and HIF-1α protein levels in 786-O cells following VHL overexpression. VHL overexpression led to decrease in HIF-1α protein, with β-actin serving as a loading control. (q) Expression levels of AP004372.1 and AC046143.3 after VHL overexpression in 786-O cells (vs. vector control; unpaired t-test, n = 3). (r) Western blot analysis of HIF-1α knockdown efficiency in 769-P cells. (s) Expression of AP004372.1 and AC046143.3 post HIF-1α knockdown in 769-P cells (vs. shNC; unpaired t-test, n = 3). (t) Western blot analysis confirming VHL overexpression and the consequent reduction of HIF-1α protein in 769-P cells. β-actin was used as a loading control. (u) Expression of AP004372.1 and AC046143.3 after VHL overexpression in 769P cells (vs. vector control; unpaired t-test, n = 3). shNC: scramble shRNA control; ns: not significant; Error bars represent SEM.*p < 0.05, **p < 0.01, ***p < 0.001, ****p < 0.0001. NS: not significant.
We next investigated whether AP004372.1 and AC046143.3 are direct transcriptional targets of HIF-1α. Bioinformatic analysis predicted putative HIF-1α binding sites in the promoters of AP004372.1 and AC046143.3 (Figure 5(i) and (j)). We then experimentally validated HIF-1α binding at these sites using chromatin immunoprecipitation (ChIP) assays, which revealed significant enrichment compared to IgG controls (p < 0.0001; Figure 5(k)). To corroborate these findings and confirm direct transcriptional activation, we performed dual-luciferase reporter assays. For AP004372.1, HIF-1α robustly enhanced the activity of the wild-type promoter. This induction was attenuated by individual mutation of either binding site and was nearly abolished by the combined mutation (Mut1 + 2; Figure 5(l)). Similarly, for AC046143.3, mutation of its single predicted HIF-1α binding site significantly compromised HIF-1α-driven transcriptional activation (Figure 5(m)).
To further establish the regulatory relationship, we modulated HIF-1α levels in 786-O cells. Western blotting confirmed efficient HIF-1α knockdown using three independent shRNAs (Figure 5(n)). HIF-1α depletion significantly suppressed both AP004372.1 and AC046143.3 (p < 0.0001; Figure 5(o)). Concordantly, overexpression of VHL, a negative regulator of HIF-1α, effectively reduced HIF-1α protein levels (Figure 5(p)) and led to the downregulation of both AP004372.1 and AC046143.3 (Figure 5(q)). To generalize these observations, we extended our analysis to a second ccRCC cell line, 769-P. Consistent with the results in 786-O cells, HIF-1α knockdown (Figure 5(r)) and VHL overexpression (which also diminished HIF-1α protein; Figure 5(t)) markedly reduced the expression levels of AP004372.1 and AC046143.3 (Figure 5(s) and (u)).
Collectively, these data indicate that AP004372.1 and AC046143.3 are direct transcriptional targets of HIF-1α, playing a crucial role in the hypoxia-induced lncRNA signature. The remaining three lncRNAs, despite their prognostic value, are likely regulated through indirect or alternative HIF-dependent mechanisms.
The 5-lncRNA signature delineates an immunosuppressive microenvironment and predicts enhanced sensitivity to VEGF-targeted therapy in ccRCC
To delineate the broader biological and clinical implications of the five-lncRNA signature, we systematically profiled the associated tumor immune microenvironment and therapeutic vulnerabilities in the TCGA-KIRC cohort. Differential gene expression analysis identified 1475 upregulated and 594 downregulated genes (|log₂FC| > 1, FDR < 0.05; Figure 6(a)). Enrichment analysis revealed the genes upregulated in high-risk group were involved in immune-related pathways, including adaptive immune response, cytokine-mediated signaling, IL-17 signaling pathway, and Treg differentiation (Figure 6(b)), suggesting an immunologically active yet potentially suppressed state.

The HIF-activity-derived 5-lncRNA signature characterizes an immunosuppressive microenvironment and predicts response to antiangiogenic therapy in ccRCC. (a) Volcano plot of differentially expressed DEGs between high- and low-risk patients in the TCGA-KIRC cohort (FDR <0.05, |log2FC| > 1). (b) Pathway enrichment analysis (Metascape) of genes upregulated in high-risk patients (red bars) and genes upregulated in low-risk patients (blue bars). (c) Correlation analysis between the risk score and ImmunoScore (positive, Pearson r = 0.302, p < 0.0001) or Tumor Purity (negative, Pearson r = -0.248, p < 0.0001). (d) Comparison of immune function scores between high- and low-risk groups (unpaired t-test). (e) Differential expression of immune checkpoint molecules between risk groups (unpaired t-test). (f) Correlation analysis (Pearson) between the risk score and infiltration levels of specific immune cell subsets (CIBERSORT). (g) Correlation analysis (Pearson) between the risk score and expression of immunosuppressive cytokines. (h) Positive correlation between the risk score and Tumor Mutational Burden (TMB; Pearson r = 0.262, p < 0.0001). (i–j) Comparison of predicted IC50 values for (i) Sunitinib and (j) Pazopanib between high- and low-risk groups (Wilcoxon test). Data are presented as mean ± SEM unless otherwise specified. Statistical significance: *p < 0.05, **p < 0.01, ***p < 0.001, ****p < 0.0001. NS, not significant.
Consistent with this, the risk score demonstrated a significant positive correlation with the ImmunoScore (r = 0.302) and a negative correlation with Tumor Purity (r = −0.2481; Figure 6(c)), indicating greater immune infiltration in high-risk tumors. Further characterization of immune functional activity revealed that high-risk patients exhibited elevated scores for multiple processes, including immune checkpoint activity, T-cell co-inhibition, parainflammation, and Type I interferon response, but a reduced Type II interferon response (Figure 6(d)). Concordantly expression of critical immune checkpoint molecules—like CTLA4, PDCD1 (PD-1), LAG3, TIGIT, ICOS, and CD276—was significantly elevated in high-risk patients (Figure 6(e)), indicative of a T-cell–exhausted phenotype.
Immune cell infiltration analysis (CIBERSORT) further elucidated a suppressive landscape. Risk score demonstrated positive correlation with the infiltration of immunosuppressive cell types, including Tregs (r = 0.38), resting NK cells (r = 0.22), and M0 macrophages (r = 0.14), while showing negative correlations with CD8+ T cells (r = –0.161) and activated NK cells (r = –0.11) (Figure 6(f)). This immunosuppressive milieu was reinforced by the positive correlation between the risk score and the expression of key immunosuppressive cytokines, including TGFB1 (r = 0.45), TGFB3 (r = 0.24), IL10 (r = 0.11), and CCL20 (r = 0.32; all p < 0.05; Figure 6(g)). Additionally, a higher risk score was associated with an increased Tumor Mutational Burden (TMB; r = 0.262, p < 0.0001; Figure 6(h)).
Given the established link between angiogenesis and immune regulation in ccRCC, we investigated the predictive value of the signature for antiangiogenic therapy. Patients in the high-risk group showed markedly lower predicted IC₅₀ values for the VEGF-targeted agents Sunitinib and Pazopanib (p < 0.0001 for both; Figure 6(i) and (j)), suggesting heightened sensitivity to these therapies.
In summary, the HIF-activity-derived five-lncRNA signature characterizes an immunosuppressive tumor microenvironment in ccRCC, marked by abundant but dysfunctional immune infiltration, elevated immune checkpoint expression, and a dominant regulatory cytokine profile. Furthermore, its association with increased predicted efficacy of VEGF-targeted therapies underscores its potential clinical utility.
Integration into a clinically applicable nomogram: enhancing individualized survival prediction beyond TNM staging in ccRCC
Univariate and multivariate Cox regression analyses first confirmed age, pathological stage, and the five-lncRNA risk score as independent prognostic factors for overall survival in both the TCGA-KIRC and FUSCC cohorts (Figure 7(a)). Based on these independent predictors, we constructed a nomogram to estimate overall survival probabilities (Figure 7(b)). This nomogram effectively stratified patients into distinct prognostic groups. Notably, the high-point cohort (n = 207) experienced a risk of death 4.66 times greater than the low-point cohort (n = 208), a difference that was highly significant (Figure 7(c)).

Clinical implementation of an integrated personalized nomogram for ccRCC prognostication using HIF activity-derived risk scoring. (a) Univariable and multivariable Cox regression analyses of OS predictors in TCGA-KIRC (top) and FUSCC (bottom) cohorts. (b) Nomogram integrating risk score with clinical parameters (age, gender, grade, stage) for 1-/3-/5-year OS prediction. (c) Kaplan-Meier OS curves stratified by nomogram score (log-rank p-value). (d, f) Time-dependent ROC curves assessing nomogram performance in TCGA-KIRC (d) and FUSCC (F). (e) Calibration plots for 1/3/5-year survival predictions (TCGA-KIRC; 1000 bootstraps). (g) Sample-level profiling in TCGA-KIRC. Top: Risk score distribution (rank-ordered samples). Middle: Survival status (red: deceased; blue: alive). Bottom: Expression of signature lncRNAs and HIF activity. (h) Integrated nomogram profiling. Top: Total nomogram score distribution. Middle: Survival status. Bottom: Component values (risk score, stage, grade, gender, age, HIF activity). All analyses adjusted for clinicopathological variables. Bootstrap resampling: n = 1000 iterations.
We then comprehensively evaluated the nomogram's performance. The time-dependent ROC curves exhibited excellent predictive accuracy in both validation cohorts (Figure 7(d) and (f)), outperforming the TNM staging system alone. The calibration plots demonstrated excellent alignment between nomogram predictions and observed outcomes, indicating optimal calibration (Figure 7(e)).
To illustrate the nomogram's utility at the individual level, we performed sample-level profiling. Figure 7(g) presents a rank-ordered cohort illustrating the distribution of risk scores, patient survival status, and expression patterns of the signature lncRNAs in relation to HIF activity. This comprehensive view underscores the model's ability to delineate risk groups and its biological plausibility. Finally, Figure 7(h) presents an integrated profiling of the nomogram itself, displaying the total score distribution, associated survival status, and the contribution of each component variable for individual patients, providing a clear blueprint for its clinical application.
To illustrate the potential real-world utility of our nomogram, consider a hypothetical patient with advanced ccRCC: a 70-year-old male presenting with Stage III, Grade 3 disease and a calculated lncRNA risk score of 1.5. Using the nomogram (Figure 7(b)), the clinician would assign points for each variable (e.g., 79 points for risk score, 36 for stage, 11 for grade, 0 for age), summing to a total score of 126. This total corresponds to a predicted 3-year survival probability of approximately 48%. This tool could assist clinicians in identifying high-risk patients for enhance monitoring or additional therapy, thus supporting personalized management.
In summary, the clinical nomogram augmented with the five-lncRNA signature provides a valuable tool for refining survival predictions in ccRCC, thereby facilitating more individualized patient risk stratification and management strategies.
Discussion
Hypoxia is a hallmark of ccRCC,26,27 driving tumor progression through extensive metabolic reprogramming and immune remodeling.28,29 This study developed a five-lncRNA signature based on hypoxia activity that effectively categorizes ccRCC patients into prognostically distinct subgroups across various cohorts. Our integrative analysis spanning transcriptomic profiling, experimental validation, and immune deconvolution demonstrates that this HIF-associated lncRNA signature reflects not only transcriptional outputs of HIF signaling but also orchestrates a profoundly immunosuppressive tumor microenvironment (TME), offering implications for risk stratification and therapeutic guidance.
While we experimentally confirmed AP004372.1 and AC046143.3 as direct HIF-1α transcriptional targets, the other three signature lncRNAs (LINC01801, TMEM92-AS1, and RP11-327P2.5), which lack canonical HIF-binding sites, are likely integrated into the hypoxic response via indirect mechanisms. We hypothesize that their expression is coupled to the broader HIF-driven transcriptional program. For instance, they could be regulated by secondary transcription factors that are themselves induced or activated by HIF signaling. Alternatively, their expression might be influenced by HIF-mediated alterations in the cellular state, such as changes in chromatin architecture or the activity of epigenetic regulators, which can globally impact gene expression. The consistent downregulation of RP11-327P2.5 in high-risk tumors further suggests it may act as a tumor suppressor, whose repression is reinforced within the hypoxic tumor microenvironment. Although their precise upstream regulators remain to be elucidated, their strong association with the HIF activity signature positions them as crucial components of the hypoxic response network in ccRCC and delineating their specific mechanisms of regulation represents a promising avenue for future research.
Our findings that the high-risk lncRNA signature correlates with a T-cell-exhausted phenotype and enriched Treg infiltration are consistent with the established role of hypoxia as a master regulator of immunosuppression. Hypoxia, primarily through HIF activation, shapes the TIME via multiple interconnected mechanisms: (1) Induction of immune checkpoints: PD-L1 expression was induced under hypoxia condition, 30 providing a mechanistic link between low oxygen and immune evasion, which aligns with our observation of elevated PD-1, CTLA4, and TIGIT in high-risk tumors. (2) Recruitment and activation of suppressive immune cells: Hypoxia induces the expression of chemotactic factors that recruit Tregs and MDSCs. 31 Our data showing a positive correlation between the risk score and Treg abundance, alongside elevated levels of TGFB1 and CCL20, strongly support this mechanism. (3) Metabolic reprogramming of the TME: Hypoxia-driven accumulation of extracellular adenosine and lactate creates a metabolically hostile milieu that directly inhibits T cell effector functions and promotes T cell exhaustion. 32 Our study extends this paradigm by identifying a set of lncRNAs that are directly transcriptionally activated by HIF-1α (e.g., AP004372.1 and AC046143.3). We propose that these lncRNAs are not mere bystanders but active players in this process, potentially acting as amplifiers or modulators of the aforementioned hypoxic-immune circuits. Future investigations into whether these lncRNAs directly regulate the expression of specific immune modulators or metabolic enzymes will be crucial to fully elucidate their functional contributions.
Mechanistically, the lncRNAs identified in our model, particularly AP004372.1 and AC046143.3, are transcriptionally activated by HIF-1α in a VHL-dependent manner. Their expression closely parallels HIF activity across ccRCC cell lines and tumor tissues, as evidenced by ChIP-qPCR and loss/gain-of-function assays. Notably, these lncRNAs modulate downstream hypoxia-responsive pathways, suggesting their active role in hypoxia-mediated oncogenic programs rather than being mere transcriptional byproducts. Functionally, lncRNA knockdown leads to reduced tumor cell proliferation, migration, and invasion, supporting their tumor-promoting roles.
Our signature exhibits strong prognostic performance, independent of clinical variables such as stage, grade, and age, and remains robust in multivariate Cox models across both TCGA and external validation cohorts. Importantly, the integration of the risk score into a nomogram further improves predictive accuracy, demonstrating its clinical utility in guiding patient management.
From an immunological standpoint, low-risk tumors exhibited elevated infiltration of CD8+ T cells, NK cells, and macrophages, accompanied by upregulation of multiple immune checkpoints (e.g., PD-1, CTLA4, TIGIT)19–21 and immunosuppressive cytokines such as IL-10 33 and TGFB3. 34 Paradoxically, this high immune infiltration was not associated with an active anti-tumor response but rather with T cell exhaustion and immune dysfunction. This aligns with prior reports that hypoxia shapes a metabolically hostile and immunoregulatory niche, leading to functional exhaustion of effector cells and expansion of regulatory populations such as Tregs. The observed enrichment of IL-17 signaling and parainflammatory response pathways further supports this immune dysregulation.
While our nomogram demonstrates robust performance in both TCGA and FUSCC cohorts, several limitations should be considered before broad clinical implementation. First, the model was trained and validated primarily in Chinese populations; its generalizability to other ethnic groups requires further validation. Second, the lncRNA expression profiling relies on RNA-seq data, which may not be routinely available in all healthcare settings. Future efforts to develop PCR- or immunohistochemistry-based assays could enhance accessibility. Lastly, the nomogram does not yet incorporate molecular subtypes or comorbidities, which may also influence prognosis.
Furthermore, the signature correlates with increased sensitivity to VEGF-targeted therapies (sunitinib, 35 pazopanib 36 ), in line with the VEGF axis being a downstream target of HIF signaling. This finding holds translational relevance, as it suggests that the risk score may guide not only immunotherapeutic strategies but also choices of anti-angiogenic therapy.
However, our study has several limitations. First, our analysis relied on transcriptomic data from public databases (e.g., TCGA, CCLE, and GTEx), which were generated from different sequencing platforms and batches, potentially introducing technical variations in lncRNA quantification. Although we applied normalization and batch correction methods to minimize these effects, technical differences across platforms might still challenge the generalizability of our findings. Second, our training and validation cohorts were primarily from Chinese populations (the FUSCC cohort) and TCGA (which predominantly consists of Western populations), thus the general applicability of our signature across different ethnic and geographic groups requires further validation. Additionally, treatment regimens (such as whether patients received neoadjuvant therapy and the specific targeted agents used) may influence the transcriptomic profiles and prognosis of tumors, but we were unable to fully adjust for these treatment-related confounders in our study. Future validation in multi-center, prospective cohorts and the development of clinically routine detection methods (e.g., qPCR) are warranted to facilitate the clinical translation of our signature.
In summary, our study establishes a novel HIF-activity-related lncRNA signature that captures hypoxia-induced oncogenic and immunoregulatory reprogramming in ccRCC. This signature offers prognostic value, biological insight, and therapeutic potential, highlighting the interplay between hypoxic signaling and immune suppression. Future studies exploring the direct molecular functions of individual lncRNAs in modulating immune checkpoints or metabolic pathways may further unravel actionable targets within this axis.
Supplemental Material
sj-docx-1-jra-10.1177_14703203251401461 - Supplemental material for HIF-responsive lncRNAs define an immunosuppressive phenotype and predict anti-angiogenic response in clear cell renal cell carcinoma
Supplemental material, sj-docx-1-jra-10.1177_14703203251401461 for HIF-responsive lncRNAs define an immunosuppressive phenotype and predict anti-angiogenic response in clear cell renal cell carcinoma by Yongqiang Huang, Wei Zhang, Wenhao Xu, Leilei Du, Xingming Zhang, Wenfeng Wang, Guohai Shi and Jianhua Wang in Journal of the Renin-Angiotensin-Aldosterone System
Supplemental Material
sj-pptx-2-jra-10.1177_14703203251401461 - Supplemental material for HIF-responsive lncRNAs define an immunosuppressive phenotype and predict anti-angiogenic response in clear cell renal cell carcinoma
Supplemental material, sj-pptx-2-jra-10.1177_14703203251401461 for HIF-responsive lncRNAs define an immunosuppressive phenotype and predict anti-angiogenic response in clear cell renal cell carcinoma by Yongqiang Huang, Wei Zhang, Wenhao Xu, Leilei Du, Xingming Zhang, Wenfeng Wang, Guohai Shi and Jianhua Wang in Journal of the Renin-Angiotensin-Aldosterone System
Footnotes
Ethics approval and consent to participate
Our study was approved by the Ethics Committee of FUSCC.
Author contributions
Jianhua Wang, Guohai Shi, and Wenfeng Wang were granted full access to all study data and assume full responsibility for its integrity and the accuracy of the analysis.
Concept and design: Jianhua Wang, Guohai Shi, and Wenfeng Wang.
Acquisition, analysis, or interpretation of data: Yongqiang Huang, Wei Zhang, Leilei Du, and Xingming Zhang
Drafting of the manuscript: Yongqiang Huang, Wei Zhang, Wenfeng Wang, and Xingming Zhang.
Cell experiments: Yongqiang Huang, Wei Zhang and Leilei Du.
Critical revision of the manuscript for important intellectual content: Jianhua Wang and Guohai Shi.
Funding
The authors disclosed receipt of the following financial support for the research, authorship, and/or publication of this article: This research received funding from the Shanghai Hospital Development Center (grant no. SHDC2025CCS007).
Declaration of conflicting interests
The authors declared no potential conflicts of interest with respect to the research, authorship, and/or publication of this article.
Supplemental material
Supplemental material for this article is available online.
References
Supplementary Material
Please find the following supplemental material available below.
For Open Access articles published under a Creative Commons License, all supplemental material carries the same license as the article it is associated with.
For non-Open Access articles published, all supplemental material carries a non-exclusive license, and permission requests for re-use of supplemental material or any part of supplemental material shall be sent directly to the copyright owner as specified in the copyright notice associated with the article.