
Abstract
Introduction:
Angiotensin-converting enzyme (ACE), which contributes to adipocyte growth, differentiation and function, has recently been linked with both salt metabolism and obesity development. Therefore, this study has aimed to investigate the putative relationship between ACE genetic polymorphism, serum ACE levels and salt consumption on the risk of developing obesity in the Saudi population.
Materials and methods:
ACE genotype status of 267 adult Saudi volunteers (124 obese and 143 non-obese) was correlated with their serum ACE activity and dietary salt intake amounts.
Results:
Obesity was more prevalent in deletion-deletion genotype individuals (p<0.03), under dominant, co-dominant and monoallelic conditions (p<0.04). Deletion allele corresponds to serum ACE activity in obese patients (p<0.05). The amount of salt intake (<6 g/d) was significantly associated with obesity and particularly high in deletion-deletion and insertion-deletion genotype carriers (p<0.001). STITCH analysis underlined interactions of the ACE protein with sodium molecule, REN, ACE2, KNG1 and AGTR1 in a biological network.
Conclusions:
Our findings suggest the positive association between ACE deletion genotype, serum ACE activity and sodium intake with risk of obesity development in the Saudi population.
Keywords
Introduction
Obesity (OMIM 601665) became a common finding in Saudi Arabians, due to the recent economic growth which led to changes in their dietary habits and lifestyle. 1 Besides history of obesity in the family, sedentary life style and lipid-rich diet, recent studies have also highlighted the increased amount of dietary salt (sodium chloride) as an important contributor to weight gain and obesity. 2 Studies conducted in children 3 and adult populations 4 have noticed the strong association between the amount of dietary intake of sodium and obesity. Another interesting association between salt intake and consumption of sugar-sweetened artificial beverages is reported in obese Caucasian children.5–7 Studies on humans and experimental animals have also well established the effect of high sodium intake on adiposity.8,9 The inclusion of salt not only increases the palatability of foods but encourages greater energy intake. 10
Like other complex diseases, obesity is caused by the complex interplay between genetic and environmental factors. As of today, few genes involved in regulating the adiposity and adipocyte metabolism in humans have been identified as putative genetic risk markers for human obesity. 11 Among them, one major gene is ACE, which encodes the angiotensin-converting enzyme (ACE; EC 3.4.15.1), whose role is to catalyze the transformation of inactive angiotensin I to the active angiotensin II. While the main role of ACE is to control blood pressure, it is also involved in adipocyte growth, differentiation and function. 12
A common 287 base pair Alu sequence insertion/deletion (I/D) polymorphism (rs4646994) located in intron 16 in the ACE gene was reported for its association with overweight and obesity among children, adolescents and adults. 13 This polymorphism accounts for approximately 47% of the variation in the activity of plasma ACE levels, and deletion allele is reported to increase the total activity of the enzyme. 14 The insertion-insertion/deletion-deletion(II/DD) genotypes in the ACE gene are reported to have a positive association with increase in blood pressure during a high sodium chloride diet in older hypertensive individuals. 15 This suggests that ACE polymorphism may act as a potential genetic risk marker of salt sensitivity. Given the ubiquity of sodium chloride use in the Saudi Arabian diet and the limited literature pertaining to salt intake and ACE polymorphism in the context of obesity, this study has investigated if there is any association of ACE gene polymorphism with sodium intake and obesity among Saudi adults.
Materials and methods
Subjects and study design
The current study enrolled 267 unrelated adult Saudi volunteers to participate in this case-control study. All the study subjects were classified into two subgroups: non-obese (body mass index (BMI) <30 kg/m2) and obese (BMI ⩾ 30 kg/m2) in accordance to the World Health Organization (WHO) criteria. The participation criteria for study volunteers include their age (>18 y), negative family history to obesity or related phenotypes, no weight loss (>10 kg) in the last 3 mon and not taking any cholesterol-lowering or weight-controlling medications. Ethical approval to conduct the genetic study of obesity was obtained from King Saud University. Informed consent was taken from the study participants after they were fully informed about the study nature and potential risks involved.
Salt intake survey
The daily salt (sodium chloride) intake was assessed by 24-h dietary recall survey. The amount of sodium in ingested foods and beverages was calculated using NUT Nutrition Software program. Current guidelines issued by the WHO specify the maximum intake at 2400 mg/d of Na (one teaspoon of salt, 6 g) per adult healthy individual. Therefore, we categorized study participants into two groups based on the level of salt intake as high (>6–12 g of salt, that is >4800 mg/d of Na) and low salt intakers (<6 g of salt, that is <2400 mg/d of Na).
Anthropometric measurements
Obesity parameters such as height, weight, and hip and waist circumferences were measured for each study participant. The height of participants in centimeters (cm) was measured to the nearest 0.1 cm by allowing them to stand without shoes against a stadiometer. Body weight in kilograms (kg) was measured to the nearest 0.1 kg using a weighing machine with a maximum weight of 140 kg. BMI was calculated as weight in kilograms (kg) divided by the square of height in meters (m2). Using an elastic measurement tape, waist circumference (cm) was measured to the nearest 0.1 cm midway between the superior border of the iliac crest and lower rib, at the end of inhalation and exhalation. Hip circumference (cm) was measured with the subject standing with feet together and at the point over the buttocks yielding the maximum circumference. Abdominal obesity was defined using the sex- and age-specific ⩾90th waist circumference percentile. 16
Clinical specimen collection
From each participant, 5 mL of peripheral blood was collected into two different vacutainers (in coagulated and uncoagulated forms) and stored in −70°C deep freezers until further assays were done.
Biochemical assays
The serum samples were processed to determine the complete lipid profile (triglycerides, total cholesterol, low density lipoprotein (LDL) cholesterol and high density lipoprotein (HDL) cholesterol) using standard enzymatic methods on a fully automated analyzer (Konelab Instruments, Espoo, Finland). Serum ACE level was measured by the ELISA method using the kit supplied by BEN (Biochemical Enterprise, Milan, Italy). ACE catalyzes the hydrolysis of N-[3-(2-furyl) acryloyl]-L-phenylalanylglycylglycine, a synthetic substance with subsequent reduction in absorbance at 340 nm. 17
Molecular analysis
Genomic DNA was isolated from all the peripheral blood (in uncoagulated form) samples using QIAamp DNA Kit purchased from QIAGEN. DNA sample purity (260/230 and 260/280 ratios) and quantity were estimated with the help of NanoDrop 2000 spectrophotometer. The integrity of each DNA was further checked by agarose gel (0.8%) electrophoresis method. The molecular analysis of I/D polymorphism of angiotensin receptor II gene was carried out using the forward primer 5′-CTGGAGACCACTCCCATCCTTTCT-3′ and the reverse primer 5′-ATGTGGCCATCACATTCGTCAGAT-3′. 18 The polymerase chain reaction (PCR) mixture consisted of a total volume of 25 uL with nuclease free water and the QIAGEN master mix, which includes 10× buffer, MgCl2, dNTPs and Taq DNA polymerase. In each tube 50 ng of genomic DNA was added separately. Standard PCR conditions were carried out as follows: initial denaturation at 94°C (for 5 min), followed by 35 cycle reactions of denaturation at 94°C (for 30 s), the annealing temperature of 64°C (for 30 s), elongation at 72°C (for 45 s), and a final extension at 72°C (for 7 min). All the PCR products along with an oligonucleotide ladder were subjected to electrophoresis on a conventional 2% agarose gel electrophoresis. The size of each band was compared against the reference DNA bands to distinguish the I/D polymorphisms.
Statistical analysis
Data analysis was carried out using Statistical Package for the Social Sciences (SPSS for windows, version 13) for Windows. All continuous variable data were expressed as mean ± standard deviation. Independent t-test was performed to compare the means of normally distributed data. Triglycerides were logarithmically transformed to normalize data before statistical analyses were performed. The stepwise linear regression method was performed to assess the significant predictors for serum ACE activity. The categorical variable data such as ACE genotype statuses of both case and control groups were tabulated and represented in the form of percentages. The statistically significant difference in the genotype and allele frequencies between study groups was determined through Pearson’s coefficient analysis, standard chi-squared (χ2) test, odds ratio (OR), and 95% confidence interval (CI). Hardy–Weinberg equilibrium (HWE) test was applied to examine the compliance of observed genotypes versus expected frequency of the ACE gene polymorphisms in the population. Statistical significance was set at p<0.05. 19
Analysis of molecular interaction between ACE protein and sodium by computational assays
We have used STITCH (Search Tool for Interactions of Chemicals) program to explore the interactions between sodium and ACE protein. Input options for this tool are protein identifier (name or accession number or amino acid sequence, etc.) for a single protein, multiple proteins, the specific organism of interest, and so on. Options to search for protein family are also available. The query compound is to be entered in the form of its name or IUPAC formula. With the given input data, STITCH explores both known and simulated interactions between the chemical molecule and protein of interest. The output will be in the form of network images containing both proteins and related chemicals. Nodes are represented in the form of masses and edges in the shape of springs; the position of nodes in the network images are computed by minimizing the system’s energy. The strength of the probable association between query molecules in the same metabolic map in the KEGG database is calculated in the form of confidence scores, such as c-0.15, c-40, c-70 and c-90, representing low, medium, high and very high confidence scores. The query chemical compound is networked with other chemicals and interacting proteins, based on the evidence generated from laboratory experiments, databases and scientific literature. STITCH hosts the interaction data for more than 68,000 chemical compounds and more than 1.5 million protein molecules belonging to 373 species.
Results
Clinical characteristics
The baseline demographic, clinical and anthropometric characteristics of participating subjects are presented in Table 1. Anthropometric indices, such as BMI and waist and hip circumferences, were all seen to be significantly high in the obese group (p<0.001 for all tests). Consistent with our expectation, elevated levels of serum lipids (triglycerides, cholesterol and LDL) were observed in obese individuals (p<0.005 for all tests). The age factor was seen to be non-contributory to obesity in our study participants.
Basic anthropometric and biochemical characteristics of obesity cases and controls.

Continuous variable values are presented as mean ± standard deviation.
BMI: body mass index; HDL-C: high density lipoprotein cholesterol; LDL-C: low density lipoprotein cholesterol; TC: total cholesterol; TG: triglycerides.
Angiotensin-converting enzyme, insertion-deletion genotype distribution in obese patients
A total number of 267 individuals comprising 124 obese patients and 143 healthy control volunteers were genotyped for ACE insertion and deletion variants. We found that the ACE I/D genotype frequency among all the study participants is in compliance to the HWE. The overall frequencies of insertion polymorphism is 30% and deletion polymorphism is 70%. The distribution of homozygote insertion (II) genotype is seen to be higher in the healthy population (23.77%) compared with the obese patients (14.51%). The frequency of heterozygote ID genotype is comparable between patient (19.35%) and control (22.37%) groups with no statistical significance (OR 1.41; 95% CI 0.65–3.08; p=0.38; χ2 0.76). However, a significant difference in the distribution of homozygote deletion (DD) genotype is observed between obese cases (66.12%) when compared with controls (53.84%) (OR 2.01; 95% CI 1.05–3.85; p=0.03; χ2 4.49). The increased prevalence of DD polymorphism in obese cases has persisted even under co-dominant genotype conditions that is ID+DD versus II (OR 0.54; 95% CI 0.29–1.02; p=0.04; χ2 3.61). In accordance with our genotype results, obese cases demonstrated a high prevalence (75%) of deletion (D) allele compared with the healthy control population (65%). The higher frequency of D allele has shown a greater statistical significance (OR 1.68; 95% CI 1.15–2.46; p=0.006; χ2 7.33). (Table 2).
ACE, insertion-deletion genotype and allele frequency distribution between obese and control subjects.

p value is statistically significant.
D: deletion; DD: deletion-deletion; I: insertion; ID: insertion-deletion; II: insertion-insertion.
Serum ACE levels
The mean serum ACE activity was 36.56±18.99 U/L in the study population. Obese patients demonstrated significantly higher levels of serum ACE activity as compared with the normal healthy adult volunteers (42.39±24.69 versus 30.74±13.29 U/L; respectively, p<0.0001) as shown in Figure 1. In addition, we have found that the mean serum activity in our study population is in agreement with their genotype background. This means that 287 base pair Alu element in the intron 16 of ACE gene influences the serum ACE activity, with the DD, ID and II genotypes, respectively, corresponding to the high, middle and low levels of ACE activity. Obese patients with DD genotype had significantly higher (54.81±24.78 U/L) mean ACE activity than those with ID (40.77±27.68 U/L) and II genotypes (31.59±21.61 U/L). The ACE activity values in the control group are 21.13±13.68 for II genotype individuals, 29.98±9.83 for ID genotype individuals, and 41.12±16.36 for DD genotype individuals. The obese individuals with DD, ID or II genotype backgrounds show a significant difference in the level of their serum ACE activity compared with that of healthy controls (p<0.0001, <0.03 and <0.04, respectively). These results suggest that D allele, whether in single or in double combination, will have a profound impact on the availability of serum ACE activity levels, especially in obese patients. Spearman correlation showed that ACE was positively correlated with waist (R=0.47; p<0.04), hips (R=0.49; p<0.04) and BMI (R=0.38; p<0.04) in the obese group. In the control group, the best predictor for serum activity was age (R=0.32; p<0.002).
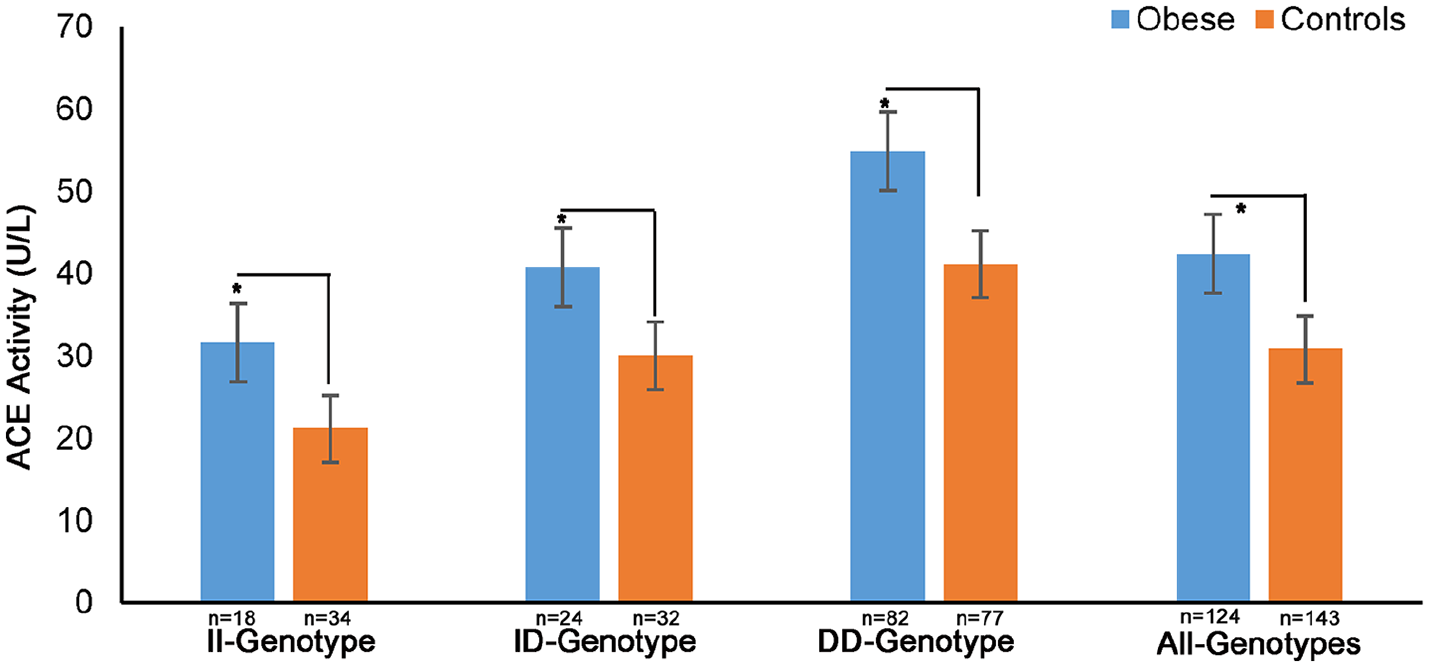
Serum angiotensin-converting enzyme (ACE) levels and ACE genotype background in obese and control subjects.
Salt intake, obesity and ACE genotype
We have analyzed the average intake of dietary salt (sodium chloride) among both study groups to understand the putative relationship between the amount of dietary salt and obesity. Figure 2 shows that the average salt intake is significantly higher in obese subjects (4711±506 mg/d of Na) compared with normal healthy controls (3593±760 mg/d of Na; p=0.0001). When the subjects in both groups were divided as high (6–12 g/>4800 mg/d of Na) and low (<6 g/2400 mg/d of Na) salt intakers and analyzed, high salt intake habit was significantly high in the obese group (84/124; 67.74%) compared with control group (80/143; 55.94%) (OR 1.65; 95% CI 1.002–2.72; p<0.04; χ2 3.88).

Amount of salt (sodium chloride) intake among obese and control groups.
Among these high salt intakers, obese subjects consume a relatively high amount of salt (7291 ± 732 mg/d of Na) than the control group (5102 ± 1136 mg/d of Na) subjects (p <0.0001). These findings suggest that a high amount of dietary salt consumption putatively influences the risk of obesity development. When ACE genetic background was taken as a variable, interestingly, obese subjects with II (36.90%; 8199±1273 mg/d of Na) and ID (22.61%; 7384±1117 mg/d of Na) genotypes have reported the higher average amount of salt consumption [7791.5±1195 mg/d of Na] compared with those who have DD genotype [40.47%; 6290±1018 mg/d of Na] (Figures 2 and 3). This finding suggests that individuals with DD genotype are vulnerable to become obese even when they consume a smaller amount of salt in their diet (Figure 2).

Salt intake and ACE genotype background among obese and control groups.
Sodium and ACE interaction
STITCH analysis showed that ACE protein shows a high level of interaction with sodium molecule with a confident integrated score of 0.94. The other ACE interacting protein partners with high scores are REN (0.99), ACE2 (0.91), KNG1 (0.87) and AGTR1 (0.82). Through enrichment analysis (with a false discovery rate of 427 × 10−9), we identified that ACE, ACE2, AGT, AGTR1 and REN genes are shown to be involved in regulation of the renin-angiotensin system (Table 3). Out of these five genes AGT and AGTR1 genes are involved in positive cholesterol metabolism (p<0.00038) (Figure 4).
STITCH database ACE protein-priteub network scores.


ACE and sodium protein-protein network analysis.
Discussion
Angiotensin-converting enzyme (EC 3.4.15.1), also known as ACE, can catalyze the formation of potent vasoconstrictor angiotensin II from angiotensin I hormone. This is the key enzyme of the renin-angiotensin-aldosterone system (RAAS), which regulates the volume, fluid and electrolyte concentrations of body fluids, and regulates blood pressure in humans. Moreover, the role of ACE, a vital part of the RAAS system, is also proposed as a governing molecule involved in the growth and function of adipocytes, and ACE processed angiotensin II is known to effect the differentiation of adipocytes. 12 Therefore, the role of ACE is also an important factor in developing overweight and obesity. The 287 base pair Alu repeat sequence in intronic region 16 of the ACE gene is known to be present or absent in the populations. 20 In the presented population-based study, we studied the impact of ACE I/D polymorphism in obese and non-obese healthy controls belonging to the Saudi population. We observed a significant difference in the distribution of homozygote deletion (DD) genotype between obese cases and controls. The OR values suggest that the risk of developing obesity among Saudi adults increases by 2 fold if individuals are carrying dominant (DD) genotype, by 0.8 fold if individuals are carrying co-dominant (ID) genotype, and by 1.68 fold if the D allele is under a monoallelic condition. Based on these findings, it is reasonable to assume that ACE I/D polymorphism is important in the development of obesity among the Saudi population. However, the published literature on ACE DD polymorphism on obese patients from different geographically distributed populations reveals both negative associations21–23 and positive associations.20,24–26 The results from a meta-analysis of ACE I/D polymorphism showed the positive contribution of D allele towards the risk of developing metabolic syndrome, a disorder closely related to central obesity. 27 A recent investigation has also confirmed the significant contribution of D genotype and D allele in elevating the overall risk of overweight and obesity. 20 The discrepancies related to association of ACE polymorphism with obesity could be related to the ethnic differences, patient age, BMI cut-off points and sample sizes. 23
More recently, different polymorphisms including ACE I/D variant are identified to account for 3-fold significantly higher serum ACE activity levels and are also associated with different clinical conditions (p<0.001).28–30 The II, ID and DD genotypes in ACE are seen to respectively parallel the low, medium and high levels of serum activity in the serum obstructive sleep apnea syndrome. 28 At present, the specific relationship between ACE I/D polymorphism, serum activity and obesity development remain an unsolved question. Given this situation, we were inspired to examine whether there is any putative relationship between serum ACE activity and obesity with the contribution of I/D polymorphism. Our results show that obese patients had significantly higher levels of serum ACE activity underscoring the crucial role of ACE activity in adiposity (p<0.01). Moreover, we have also observed that obese individuals with DD (p<0.001) and ID (p<0.04) genotypes demonstrated significantly higher serum ACE activity compared with II genotype. This reinforces our assumption that D allele whether in single or in double combination, has a profound impact on the availability of serum ACE levels, especially in obese patients.
Dietary sodium and potassium balance are one of the major factors which activate RAAS, and dietary salt constitutes the principal source of sodium in the human body. Sodium levels are reported to affect the ACE I/D variant phenotype, enhances blood pressure and kidney function. 31 Previous genetic epidemiological investigations in patients with salt-sensitive essential hypertension have revealed that ACE D allele mounts a significantly increased response to dietary salt and causes hypertension when patients consume a higher amount of salt (p<0.05).31,32 In essential hypertensive individuals, the ACE insertion (I) allele or its corresponding II genotype is seen to influence the salt sensitivity positively. 15 Besides its well-known involvement in hypertension, sodium consumption is also linked to obesity. 33
One previous study reported the significant positive correlation between the amount of sodium intake and body weight or body fat (p<0.05). 34 A follow-up study in rodents has supported this concept, showing that a high amount of sodium disturbs the regulatory network of lipid metabolism and increases the fat mass, adipocyte size and adiposity. However, very few studies have investigated the contribution of sodium intake to the ACE I/D polymorphism and obesity among adults. Our results show that the average amount of sodium intake is significantly higher in obese subjects (p<0.0001). When obese subjects were categorized into high salt intakers (>6–12 g/d) and low salt intakers (<6 g/d), we observed that approximately 65% of high salt intakers consume more than 2 folds (7291 ± 732 mg/d of Na) of the daily recommended dose of 6 g of salt (2400 mg of Na).
Furthermore, our results show that the amount of salt intake was relatively higher in obese patients with both II+ID genotypes than those individuals with DD genotype background. This finding points us to assume that individuals with D allele or ID or DD genotypes are more salt sensitive and tend to become obese, compared with the individuals with I allele or II genotypes, who require more sodium intake to develop obesity. One of the most likely mechanisms underlying sodium-associated obesity is that dietary sodium increases ACE concentration and activity, which then accelerates the conversion of excessive angiotensin II, present in adipocytes, and ultimately stimulates lipogenesis.12,35 The frequent intake of energy-dense foods such as fast food containing high sodium content may potentially contribute to obesity in Saudi adults who have the ACE deletion genetic background.
We acknowledge a few limitations of this study. First, the number of obese patients (n=124) is relatively small, thus limiting its statistical power for conclusions about this study group. Still, our study represents a pilot report which demonstrated the association of ACE I/D polymorphism, serum ACE activity and dietary salt intake with obesity in Saudi patients. Our findings require replication with a larger sample size. Second, sodium chloride intake has been estimated using the 24-h dietary recall survey, which has difficulties in quantifying the exact amount of sodium in food recipes and in the underreporting of intake amounts. Third, we did not study the gut microbiome changes among high and low salt intakers, which could have shed more light on the role of different microorganisms and the metabolic products that contribute to adipogenesis in humans.
Our study findings show that ACE I/D polymorphism could act as a potential genetic modulator for serum ACE activity and also salt sensitivity in the obese Saudi population. More specifically, our data indicate that obese patients carrying the ACE, ID or DD genotypes are sodium sensitive and should reduce their dietary salt intake to reduce their risk of developing hypertension and other associated health complications. These results also highlight the complexity underlying the association of ACE I/D polymorphism with obesity and suggest that the salt intake factor should also be considered to interpret the association between genetic background and obesity. Future investigations on Saudi obese patients can focus on multiple genetic markers belonging to the RAAS, and on dietary intake of salt, lipids and other nutrients.
Footnotes
Acknowledgements
The authors are thankful to the Deanship of Scientific Research (DSR), Jeddah, KSA for the technical and financial support (grant no. HiCi-63-130-35).
Declaration of conflicting interests
The author(s) declared no potential conflicts of interest with respect to the research, authorship, and/or publication of this article.
Funding
The author(s) disclosed receipt of the following financial support for the research, authorship, and/or publication of this article: This project was funded by the Deanship of Scientific Research at King Abdulaziz University, Jeddah, KSA under grant no. HiCi-63-130-35.