
Abstract
Introduction:
Tonin is an enzyme that is able to generate angiotensin II (Ang II) from angiotensin I (Ang I) or directly from angiotensinogen. Our goal was to characterize the renal renin-angiotensin system in transgenic mice that express rat tonin (TGM`(rTon)).
Materials and methods:
Mice were euthanized and the kidneys removed for analysis. Tonin activity was evaluated by radioimmunoassay and angiotensin I-converting enzyme (ACE) activity by HPLC. Tonin, ACE and angiotensin II-converting enzyme (ACE2) expression was analyzed by Western blotting.
Results:
Tonin activity was significantly increased in TGM`(rTon) compared to their respective wild-type (WT) littermates (1.7 ± 0.21 vs 0.11 ± 0.02 nmol of Ang II/min/mg of protein). Tonin activity had a strong positive correlation with tonin expression in both TGM`(rTon) and their respective wild-type littermates. The ACE activity and expression levels of 65-kDa N-domain angiotensin I-converting enzyme isoform were significantly increased in the TGM`(rTon) when compared with WT. ACE2 expression levels were statistically significantly higher in the TGM`(rTon) when compared with WT. Angiotensin 1–7 (Ang(1–7)) and Ang I levels were significantly lower in the TGM`(rTon).
Conclusions:
We suggest that the environment of tonin abundance may increase N-domain ACE activity liberated by a secretase able to cleave somatic ACE.
Introduction
The renin-angiotensin system (RAS) is a hormonal cascade in control of cardiovascular and renal functions that control arterial pressure, fluid and electrolyte balance. 1 Traditionally, RAS is thought to be initiated by renin-mediated cleavage of angiotensinogen (AG) to form the decapeptide angiotensin I (Ang I), which is metabolized to the octapeptide angiotensin II (Ang II) by angiotensin-converting enzyme (ACE).2–4 Although the existence of RAS has been known for more than five decades, recent advancements in cell and molecular biology have improved the understanding of the role of this system in normal and diseased states.1,5 Many authors have described that local/tissue RAS are present in many tissues such as the brain, heart, peripheral blood vessels, adrenal glands, and kidneys, and are able to operate in an autocrine, paracrine and/or intracrine manner and exhibit multiple physiological effects at the cellular level that add to and/or differ from the circulating RAS.6–8
Studies have demonstrated alternative pathways for Ang II formation involving proteinases other than renin and ACE and have been observed in several species, including humans.9–11 In tissues, including blood vessels, brain, heart, and adipose tissue, it is possible to generate Ang II directly from AG, independently of renin and ACE. It has been postulated that chymase, cathepsin G and tonin are part of alternative enzymatic pathways for Ang II production.12–14
Tonin (rat kallikrein 2, rKLK2) is a serine proteinase present in several rat tissues, such as the brain, kidney, prostate, and mainly in the submandibular gland.15–20 Tonin releases Ang II from peptides presenting the sequence corresponding to the N-terminal portion of AG like Ang I and tetradecapeptide (AG(1-14)),13,21,22 the synthetic renin substrate. There is evidence that tonin plays a role in blood pressure control 23 and participates in the local hydromineral balance in several sites. 24 Intracerebroventricular injection of tonin induces salt appetite and water intake and increases urinary volume and blood pressure. 16
Tonin was described as an Ang II-releasing enzyme, therefore, since its discovery, tonin has been studied in order to verify its participation in the pathophysiology of hypertension. Some studies have shown that tonin may be involved in the genesis and maintenance of hypertension. Initial studies show that: (a) the activity levels of tonin in the plasma are increased in humans with essential and renovascular hypertension; (b) infusion of tonin intravenously in mice does not alter blood pressure; however, in indomethacin salt-treated rats a marked increase in arterial blood pressure was observed under tonin infusion; (c) a single intravenous administration of rabbit antiserum tonin into one-kidney one-clip hypertensive rats restored blood pressure to normal in seven out of 10 animals. The authors suggest that tonin is important in the maintenance of high blood pressure. However, other factors, possibly prostaglandins and sodium, have to be modified in order to activate the tonin-Ang II system. 25
Cardiovascular and electrocardiographic parameters after tonin administration were recently evaluated in Wistar rats. The authors observed that tonin is able to generate Ang II in the isolated heart, and the cardiovascular response induced by tonin was completely blocked by candesartan, an indication that the action of Ang II on the AT1 receptor is the major mechanism of the heart effects. 26
In order to clarify the importance of tonin for the cardiovascular system, Cardoso et al. (2010) 27 generated transgenic mice that express rat tonin, the TGM(rTon). These mice present high levels of tonin messenger RNA (mRNA) and activity specifically in the brain. As a consequence, TGM(rTon) develop increased blood pressure and water intake. Lisinopril, an ACE inhibitor, is less hypotensive for TGM(rTon) than for control animals. The AT1 receptor antagonist candesartan equally lowers blood pressure in transgenic and in control mice. Plasma Ang II is increased in TGM(rTon) as compared to the wild type. AT1 receptors are desensitized in this transgenic model. Cardoso and collaborators concluded that tonin in the brain may represent an alternative pathway to generate Ang II with effects on the cardiovascular system. 27
Recently, our group generated a second lineage of transgenic mice (TGM`(rTon)) that also express rat tonin in many tissues of cardiovascular importance. More recently, our group demonstrated for the first time that the systemic antinociceptive effects in the TGM`(rTon) are blocked, at least in part, by losartan and A-779, suggesting that Ang II produced in these transgenic mice may be involved with antinociception via the AT1 receptor, while Ang(1–7) induces its effects via the Mas receptor. 28 The aim of the study was to characterize the RAS in the kidney of transgenic mice overexpressing rat tonin.
Material and methods
Production of TGM`(rTon)
Transgenic TGM`(rTon) mice were obtained by microinjection of the transgene into zygotes as described by Cardoso et al. (2010). 27 Total RNA was extracted from the submandibular gland of Sprague-Dawley (SD) rats using Trizol (Invitrogen) according to the manufacturer’s protocol. After reverse transcription with M-MULV (Invitrogen), tonin cDNA was amplified by polymerase chain reaction (PCR) in the presence of Taq polymerase (Invitrogen) and specific primers (59-ACC TGA TAC CAT GTG GCT CC-39 and 59-CAT GGT GGG TTT TAT TGA GAC-39). The product was cloned into the pGEMT vector (Promega, Madison, WI, USA) and sequenced using an automated DNA sequencer. The rat tonin cDNA (0.83 kb) was subcloned into the pBluescript II SKq vector (Stratagene, La Jolla, CA, USA) downstream of a 2.2-kb fragment containing the human glial fibrillary acidic protein (GFAP) gene promoter, previously removed from the plasmid pCAT-2 using KpnI and XbaI. A 0.6-kb fragment containing the SV40 polyadenylation site was excised from the plasmid pDLux with XbaI and cloned downstream of the rat tonin cDNA. All cloning junctions were confirmed by sequencing with specific internal primers (59-CAG CCG TGA TCA CCC AG-39 and 59-CGA GAC TGG CCA GGA GGT GC-39). The transgene was cleaved from the construct using ScaI, BglII and NdeI, and transgenic animals were generated by the pronuclear microinjection method. 29 C57BL/6 mice were used as zygote donors. The presence of the transgene in mouse genomic DNA was verified by PCR using primers that anneal to exon 3 (59-AGG TGG TGT GAA GGT TAT CG-39) and exon 4 (59-CCT CCT TCC ATC TCT CCT GC-39) of the tonin gene. Homozygous transgenic mice TGM’(rTon) were generated and maintained by breeding. Transgene expression driven by the human GFAP promoter was not limited to the brain of TGM`(rTon) animals (Table 1).
Tonin activity levels in the tissues of the WT and TGM`(rTon).

Specific activity: expressed as nanomol of Ang II liberated/minute/milligram of protein. Values are expressed as mean+SE, ap < 0.05.
WT: wild-type; TGM`(rTon): transgenic mice that express rat tonin; Ang II: angiotensin II.
Animal protocols
Studies were performed using tissues obtained from adult male 10- to 12-week-old wild-type controls (WT, C57 black six) and TGM`(rTon). Animals were maintained on a normal diet, with free access to tap water with a 12:12-hour light-dark cycle with food and water ad libitum. Animals were euthanized by decapitation and kidneys were immediately removed and stored at −80°C until experiment procedures. Experimental protocols were approved by the Experimental Animal Use Committee of the Federal University of São Paulo, Brazil (Protocol 0241/08).
Tonin activity
TGM`(rTon) (n = 4) and C (n = 4) were euthanized, kidneys removed and homogenized in 250 mM sucrose buffer (pH 7.0) containing: 10 mM ethylenediaminetetraacetic acid (EDTA) (metalloprotease inhibitor), 10 mM o-phenanthroline (metalloprotease inhibitor), 10 mM dipyridyl (metalloprotease inhibitor), and 10 mM sodium tetrathionate (cysteine protease inhibitor). After centrifugation, a fraction of the supernatant was incubated at 37°C with 5 µg of synthetic substrate of renin, tetradecapeptide (AG(1–14)) in 0.1 mol/l sodium phosphate buffer (pH 6.8) containing the inhibitors described above. The Ang II liberated in the incubation medium was determined by radioimmunoassay as described by Gualberto and colleagues (1992). 18 The detection assay limits were in picomolars and the results were expressed as specific activity as nanomol of Ang II liberated/minute/milligram of protein.
Renin activity
Kidneys were homogenized (TGM`(rTon) (n = 10) and C (n = 9)) in 50 mM Tris/HCl buffer (pH 7.5) containing: 1 µM phenylmethylsulfonyl fluoride (PMSF) (serine protease inhibitor), 10 mM EDTA (metalloprotease inhibitor) and 1.5 mM o-phenantroline (metalloproteases inhibitors). After centrifugation, a fraction of the supernatant was incubated (20 µl) at 37°C for 10 minutes with 1 nmol of synthetic renin substrate, tetradecapeptide (Porcine) in a final volume of 1 ml of 50 mM Tris/HCl buffer in the presence of inhibitors described above. Aliquots were collected at zero time (control assay) and 10 minutes later, the reaction was stopped by addition of orthophosphoric acid 10% (10 µl). The AG(1–14) was quantified by reversed-phase high-performance liquid chromatography (HPLC). Products of reaction were separated on a reversed-phase column Aquapore ODS 300, 250 × 4.6 mm, 7 μ (PerkinElmer’s Browlee Columns) using isocratic gradient for five minutes followed by 20 minutes of linear gradient from 5% to 35% mobile phase B (95% acetonitrile in 0.1% H3PO4), under a flow rate of 1.5 ml/min for 40 minutes. Peptides were identified by comparing the retention times with that of standard peptides. Detection limits of the renin assay were nanomoles order per milliliter. The results were expressed in nanomol per minute and milligram of tissue.
ACE activity
TGM`(rTon) (n = 10) and C (n = 8) were euthanized, kidneys rapidly harvested, rinsed and homogenized in 0.4 M borate buffer, pH 7.2, containing 0.34 M sucrose and 0.9 M NaCl (1 g tissue: 10 ml buffer) in the presence of 100 mmol/l PMSF (serine protease inhibitor), as described by Oliveira and colleagues (2000). 30 The homogenates were centrifuged at 3000 × g, at 4°C for 10 minutes and the supernatant frozen at −80°C until experimental use. ACE activity was determined fluorimetrically as described by Friedland and Silverstein (1976). 31 A tenfold diluted aliquot (10 μl) of the supernatant was incubated for 10 minutes (37°C) with 100 mmol/l borate buffer (pH 8.3) in the presence of 300 mmol/l NaCl and 0.1 mmol/L ZnSO4, containing Z-Phe-His-Leu (Z-PHL) (1 mmol/l) or Hippuryl-His-Leu (HHL) (5 mmol/l). The reaction was stopped by the addition of 280 mmol/l NaOH (1.5 ml) and incubated with o-phthaldialdehyde dissolved in 20 mg/ml in methanol (100 μl) for 10 minutes. The fluorescent reaction was stopped by the addition of 3N HCl (200 μl). The liberated dipeptide HL was measured fluorimetrically (360 nm excitation and 500 nm emission) using a Hitachi Spectrophotometer F2000 (Hitachi, Japan). Detection limits of the ACE assay were nanomoles order per milliliter. The results were expressed in milliunits (specific activity) per milligram of tissue. 32
Angiotensin quantification
Kidneys (TGM`(rTon) (n = 7) and C (n = 7)) were homogenized in 100 mM sodium phosphate buffer pH 7.2 containing 240 mM sucrose, 300 mM NaCl and the proteinase inhibitors: 1 mM EDTA (metalloprotease inhibitor), 1 µM o-phenanthroline (metalloprotease inhibitor), 120 µM pepstatin A (aspartyl protease inhibitor), 1 µM PMSF (serine protease inhibitor) and 1 mM 4-chloromercuribenzoic acid (cysteine protease inhibitor) at a ratio of 5 ml of buffer per gram of tissue. Homogenate was centrifuged at 20,000xg for 40 minutes at 4°C. The samples were concentrated in C18 Sep-Pak column previously activated with methanol (5 ml), tetrahydrofuran (5 ml), hexane (5 ml), methanol (5 ml) and water (10 ml). After activation, the samples were applied to the columns, washed with water and eluted in ethanol/acetic acid/water in the proportion (90:4:6). After elution the material was lyophilized and suspended in 500 μl of buffer A (5% acetonitrile in 0.1% orthophosphoric acid). The peptides were separated using the HPLC System (Milton Roy, USA). Synthetic standards were used (Sigma, USA) and peptide detection was carried out at 214 nm. The angiotensins were identified by comparing them with the retention time of standard peptides and results were expressed in picomol per gram of tissue. 32
Western blotting
Electrophoresis was performed on a polyacrylamide gel (7.5%) in the presence of sodium dodecyl sulfate (SDS) as described by Laemmli (1970) 33 using 40 μg of denatured and reduced protein, which was dissolved in 30 μl of sample buffer. Electrotransfer was performed for 45 minutes at constant voltage (40 V) using a nitrocellulose membrane (Bio Rad, USA). The membrane was incubated in a 5% non-fat dry milk blocking solution for one hour before overnight incubation at room temperature with specific antibody for ACE (Chemicon International, USA, diluted 1:2000), ACE2 (R&D Systems, USA) and tonin. 15 The subsequent steps were performed with the streptavidin/phosphatase alkaline system (GE Healthcare, Sweden). Color development was performed using nitro blue tetrazolium-5-bromo-4-chloro-3-indolyl-phosphate (NBT-BCIP) complex as recommended by the manufacturer (Bio Rad, USA). The β-actin levels were determined in all samples and used to normalize the expression levels of enzymes 32 (TGM`(rTon) (n = 4) and C (n = 4)).
Morphological examination in the kidney
The kidneys (TGM`(rTon) (n = 4) and C (n = 4)) were excised fixed in 10% phosphate-buffered saline (PBS)-buffered formalin, embedded in paraffin and serially cut from the apex to the base. A transverse section (5 mm) was collected every 0.8 mm and six to eight sections were obtained from each kidney. Sections were stained using hematoxylin and eosin and digitalized. We observed 30 glomeruli in each group. Measurements were restricted to glomerulus that showed in a single cut, and at least one of the poles: vascular or urinary. We calculated the diameter of the glomerular tuft and space between Bowman’s capsule and tuft (external area – internal area of the Bowman’s capsule). Scanned images were then obtained through a microscope (Leica DM 1000) coupled with a digital camera. The images were analyzed using the Ipwin program.
Statistical analysis
Results are expressed as mean ± SEM. Data were compared by unpaired Student’s t-test. A value of p < 0.05 was considered statistically significant.
Results
Enzymatic activities
Tables 1 and 2 present the results of specific activity of tonin, ACE and renin in the kidney. Tonin, renin and ACE activities were significantly higher in TGM`(rTon) compared to WT. The ratio between Z-PHL and HHL was higher in TGM`(rTon) when compared to WT (1.89 vs 1.34 mU/mg, respectively), indicating higher levels of ACE N-domain isoform activity in transgenic animals.
Levels of renin and ACE activities in the kidney of WT and TGM`(rTon).
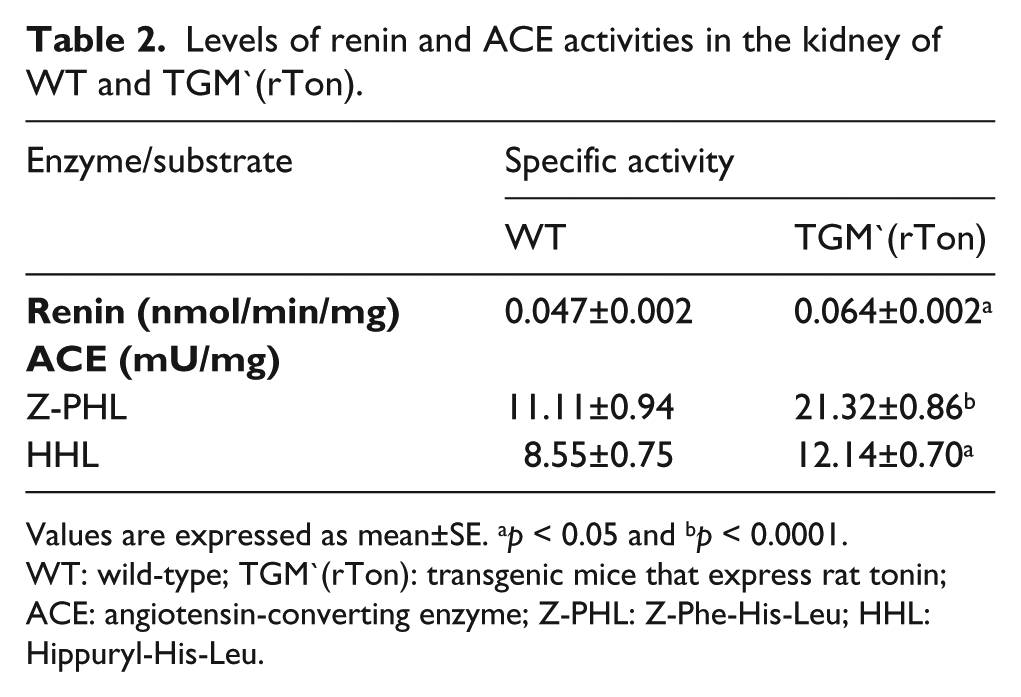
Values are expressed as mean±SE. ap < 0.05 and bp < 0.0001.
WT: wild-type; TGM`(rTon): transgenic mice that express rat tonin; ACE: angiotensin-converting enzyme; Z-PHL: Z-Phe-His-Leu; HHL: Hippuryl-His-Leu.
Angiotensins levels
Figure 1 shows the levels of angiotensins in the renal tissue of TGM`(rTon) and WT. Results demonstrated that the levels of Ang(1–7) (87.89 ± 13.35 vs 1112.00 ± 96.14 pmol/g for TGM`(rTon) and WT, respectively) and Ang I (71.66 ± 8.88 vs 135.80 ± 18.20 pmol/g of tissue for TGM`(rTon) and WT, respectively) were significantly decreased in TGM`(rTon). Ang II levels were significantly increased in TGM`(rTon) (126 ± 10.81 pmol/g of tissue) compared to WT (77.91 ± 8.81 pmol/g of tissue).

Angiotensin (Ang) levels in the kidney of C and T. Results expressed in pmol/g. Data are shown as mean ± SE (*p < 0.05 and **p < 0.0001, n = 7). C: wild-type (WT); T: transgenic mice that express rat tonin (TGM`(rTon)).
Western blotting
Kidney from both groups showed a band of 25 kDa corresponding to tonin. The signal ratio (sr) of tonin/β-actin, expressed as relative scan units, confirms that there was a significant increase (p < 0.05) in tonin expression levels in TGM`(rTon) (5.54 ± 0.08 vs 3.74 ± 0.4 for TGM`(rTon) and WT, respectively) (Figure 2(a) and (b)). Figure 3(a) and (b) show the expression levels of the ACE isoforms with 190 (somatic) and 65 kDa (N-domain ACE isoform) in the kidney of TGM`(rTon) and WT. The 65 kDa isoform ACE expression levels are lower than the 190 kDa isoform in renal tissue in both groups. Expression levels of the 190 kDa isoform are significantly (p < 0.05) higher in the TGM`(rTon) (sr = 3.90 ± 0.23) when compared to WT (sr = 2.20 ± 0.22). However, the presence of rat tonin influenced the expression of 65 kDa isoform between the groups TGM`(rTon) and WT (sr = 2.25 ± 0.16 vs 1.20 ± 0.18, respectively). Figure 4(a) and (b) shows the expression levels of the 90 kDa ACE2 in the kidney are significantly higher in the transgenic mouse when compared to WT (sr = 0.19 ± 0.07 vs 0.37 ± 0.08 for WT and TGM`(rTon), respectively).

(a) Expression of tonin in the kidney of C and T. (b) Signal ratio for tonin/β-actin expressed as relative scan units. Results expressed as mean ± SE (*p < 0.05, n = 4). M: molecular weight marker; C: wild-type (WT); T: transgenic mice that express rat tonin (TGM`(rTon)).

(a) Expression of 190 and 65 kDa ACE isoforms in the kidney of C and T. (b) Signal ratio for ACE/β-actin expressed as relative scan units. Data are presented as mean ± SE (n = 4). *p < 0.05, 190 kDa vs 65 kDa. ‡p < 0.05, 190 kDa TGM`(rTon) vs 190 kDa WT. †p < 0.05, 65 kDa TGM`(rTon) vs 65 kDa WT. M: molecular weight marker; ACE: angiotensin-converting enzyme; C: wild-type (WT); T: transgenic mice that express rat tonin (TGM`(rTon)).

(a) Expression of ACE2 in the kidney of C and T. (b) Signal ratio for ACE2/β-actin expressed as relative scan units. Results expressed as mean ± SE (*p < 0.05, n = 4). M: molecular weight marker; ACE: angiotensin-converting enzyme; C: wild-type (WT); T: transgenic mice that express rat tonin (TGM`(rTon)).
Morphological analysis
Morphological analysis of the mice renal tissues from TGM`(rTon) mice showed alterations in the glomerular tuft diameter (42.92 ± 1.32 vs 52.55 ± 1.38 µm for TGM`(rTon) and WT, respectively) (Figure 5). But, no alteration on Bowman’s capsule space was detected (526.70 ± 44.10 vs 523.3 ± 41.7 µm2 for TGM`(rTon) and WT, respectively).

Morphological analysis of renal tissue using hematoxylin-eosin stain for C and T (magnification = 40×). C: wild-type (WT); T: transgenic mice that express rat tonin (TGM`(rTon)).
Discussion
Given the lack of information regarding tonin in RAS, the present work investigated the role of tonin in renal RAS in animals TGM`(rTon). We observed in summary an increase of tonin, renin and ACE activities, a reduction of Ang(1–7) and Ang I with an increase in Ang II levels in the kidney of TGM`(rTon) when compared to control animals.
In this model renal renin activity was increased, but Cardoso and colleagues (2010) described that systemic levels of renin in TGM(rTon) are not statistically different. 27
The focus of our work was to study RAS in the kidney. The early controversy on the novel concept of tissue RAS has been based on the question of local synthesis vs uptake from the circulation. 8 Thus, it has been difficult to delineate the quantitative contributions of systemically delivered vs locally formed Ang peptides. 34 These potential autocrine-paracrine systems may be important in the regulation of local tissue functions in addition to the circulating endocrine system. 35 An independent function of local RAS (for example, in the brain where the RAS components are also expressed in regions inside the blood-brain barrier) has been postulated. 8
Evidence suggests that local formation is of major significance in the regulation of Ang levels in many organs and tissues. It is necessary to understand the mechanisms responsible for independent regulation of the intrarenal RAS vs circulatory RAS of the development and maintenance of hypertension and renal injury. 34 Local synthesis of renin may be limited to very small amounts, but uptake of renin from the circulation is very likely. 36 Our results in the kidney taken together with the observation made by Cardoso et al. (2010) 27 suggest the existence of a possible dissociation of circulating and renal RAS in this animal model.
These transgenic animals produced an environment with significantly increased levels of Ang II. Ang II plays an important role in the physiology and pathophysiology of the renal tissue. 2 Ketteler and colleagues (1995) suggested that Ang II damages the kidney by increasing glomerular filtration pressure, whereas autocrine transforming growth factor-beta (TGF-beta) overexpression occurs from unidentified mechanisms. Recent studies reveal that Ang II is a potent inducer of TGF-beta synthesis in a variety of cells and that this mechanism exerts important biological effects including extracellular matrix accumulation, cell proliferation, and hypertrophya. 37 Histomorphometric analysis revealed a decrease in the glomerular tuft diameter, without changes in space of Bowman’s capsule of TGM`(rTon). These changes may be related to increased Ang II and TGF-beta effects, which contribute to the formation of renal fibrosis. 37
The decreased levels of Ang(1–7) in TGM`(rTon) can be attributed to modulation of the N-domain ACE isoform in these animals whose activity and expression are increased. N-domain ACE cleaves Ang(1-7), considered a specific substrate for the N-domain ACE active site of the somatic, as well as for the soluble (65 kDa) N-domain ACE isoform. 38 Yamada et al. (1998) 39 reported that the hydrolysis of Ang(1–7) by ACE to form Ang(1–5) appears to be an important pathway for inactivation of this peptide.40,41 Possibly, alternatives pathways have contributed to the low levels of Ang(1–7), mainly through the action of N-domain ACE on this peptide in the kidney. Ang(1–7) is a specific substrate for N-domain ACE, which is found in the mesangial, proximal and collecting duct cells. 42 Despite the increase of ACE2 activity, possibly the N-domain ACE activation found in TGM’(rTon) is responsible for the peptide degradation. Further studies are necessary to understand the modulation of these enzymes.
The expression of ACE2 is increased in young diabetic rats and has a renoprotective role by increasing the intrarenal levels of Ang(1–7). 43 In the kidney, Ang(1–7) reduces fluid absorption, induces diuresis, natriuresis, inhibits Na+-K+ATPase, and enhances the vasodilator effect of bradykinin (BK).44–46 In our model, the decrease of Ang(1–7) may not facilitate the vasodilator effects of Ang(1–7) and cause renal damage, but we did not detect morphological alterations in the kidney in histological analysis.
Ang I levels in renal tissue of TGM’(rTon) were statistically lower than in control animals, although renin activity was higher in this group. Ang I is also a substrate for ACE2, a carboxypeptidase enzyme and homologue of ACE, expressed predominantly in the kidney, heart and blood vessels, that produces Ang(1–9). We did not measure the ACE2 activity in the kidney; however, its protein expression is significantly increased, indicating that it may be involved in Ang I degradation. ACE2 has a high affinity for Ang II to form Ang(1–7), which is also formed by the action of ACE on Ang(1–9).47,48 Possibly the degradation of Ang I can also result from the action of ACE, due to high levels of activity and protein expression found in this study. As described in the literature, ACE3,4 and/or tonin13,21,22 pathways may contribute to the low levels of Ang I. The low levels of Ang I can also be explained by the activation of other enzymes, including the neutral endopeptidase (NEP), which is found in tubular and glomerular epithelial cells.49,50 This endopeptidase is also an important element of the intrarenal RAS, since it mediates the conversion of Ang I to Ang(1–7).
Indeed, Bauer et al. (1999) 51 demonstrated that the kidney has a remarkable capacity to degrade Ang I and Ang II, considerably higher than that in the pulmonary and systemic circulation. They also concluded that the ability of the kidneys to convert circulating Ang I to Ang II (21%) is of minor importance for endocrine generation of Ang II but could be useful for the paracrine production.
Recent studies have revealed intratubular conversion of Ang II to Ang III by amino peptidase A. 52 These data show the complexity of RAS tissue, indicating that more studies are needed to better understand the action of this system.
Results obtained in this study show increased activity of the N-domain isoform, in both groups, in renal tissue. This was confirmed by the increase of the protein expression of N-domain ACE in the transgenic group. Higher levels of activity and protein expression of N-domain ACE observed in renal homogenate suggested that in TGM`(rTon) the modulation of this isoform may occur, probably through the activation of proteinases capable of releasing it. Secretases, sheddases or convertases are able to cleave somatic ACE from the membrane-bound form, generating a soluble form of the protein that has properties either identical to or subtly different from those of the membrane bound. 53 Recently our group identified and purified secretases described as serine proteinases able to liberate N-domain ACE isoform in mesangial cells related especially to hypertension. 54
We suggest that the environment of tonin abundance may increase N-domain ACE liberation in the transgenic mouse by a secretase described as a serine protease and its activity, explaining the low levels of Ang(1–7) in its specific substrate. 42 This environment may also activate other pathways or cell signaling or alter the gene expression of different peptides or enzymes in order to maintain corporal homeostasis. Taken together, our data show the role of tonin as an important modulator of renal RAS.
Despite some studies having described important physiological effects of tonin, the physiological role of this enzyme remains unclear. We have made some progress toward a more precise definition of tonin-Ang II’s role as part of this amazing but still puzzling system of Ang II-generating enzymes. Most knowledge to date on tonin comes from rodents and the presence of tonin in human tissues has not been clearly reported.
Footnotes
Conflict of interest
None declared.
Funding
This work was supported by the Conselho Nacional de Desenvolvimento Científico e Tecnológico; Fundação de Amparo a Pesquisa do Estado de São Paulo (grant number 2009/03261-4; 2010/51); and Fundação de Amparo a Pesquisa do estado de Minas Gerais (Pronex).