
Abstract
Introduction:
The renin-angiotensin system (RAS), and particularly angiotensin II, is involved in the control of energy balance, glucose homeostasis and kidney functions. The integrated impact of the RAS on glucose homeostasis is still a matter of debate.
Materials and methods:
We used a model of constitutive RAS activation in double transgenic mice (dTGM) carrying both human angiotensinogen and human renin genes. We evaluated energy balance, measured renal functions, performed glucose and insulin tolerance tests, and used ramipril to inhibit the angiotensin-converting enzyme.
Results:
dTGM had a lower physical activity and an increased food intake without change in body weight. Renal impairment was characterized by low-grade albuminuria. High urinary output secondary to polydipsia was associated with proximal tubule dysfunction. Compared to controls, dTGM had a lower hyperglycemia induced by an intraperitoneal glucose administration. This decrease was not due to changes in insulin sensitivity and/or secretion. dTGM had an increased creatinine production and a lower epididymal fat mass. Acute inhibition of angiotensin-converting enzyme with ramipril did not suppress this improved glucose tolerance profile.
Conclusion:
Chronic RAS activation is not sufficient to cause insulin resistance in mice. Moreover, adaptation to constitutive RAS activation in mice results in a better glucose tolerance.
Introduction
The renin-angiotensin system (RAS) is involved in the control of metabolism and renal physiology. Metabolic functions of RAS include the regulation of embryogenesis of the white adipose tissue,1,2 body weight and composition, 3 basal metabolic rate2,4,5 and fluid and food intake. 6 Renal functions regulated through RAS include embryogenesis of the kidney 7 and sodium handling determining blood pressure. 8 Interestingly, in mice the knock-out of the genes encoding renin, angiotensinogen and angiotensin II type 1 receptor (AT1R) are all characterized by decreased body weight and/or resistance to diet-induced obesity.4,5,9 These metabolic traits may result from chronic kidney failure,10–12 which induces protein wasting 13 and lipolysis. 14 Conversely, chronic kidney failure secondary to severe and lifelong hypertension due to constitutive activation of the RAS may cause energy imbalance. Accordingly, the Tsukuba hypertensive mouse (THM) strain expressing the human angiotensinogen and renin genes shows cardiac hypertrophy and glomerulosclerosis.15,16 The impact of chronic kidney disease on energy metabolism in this model has not been extensively assessed, but body weight seems unchanged at an early age. 15
Overall, the role of the RAS in glucose homeostasis and insulin resistance remains controversial. Angiotensin II, which is the main hormone of the RAS, has opposite effects on insulin sensitivity. It lowers insulin sensitivity through AT1R in diabetic rats 17 and in hypertensive rats. 18 AT1R is a potent activator of nicotinamide adenine dinucleotide pnicotinamide phosphate (NADPH) oxydase and augments production of oxygen-reactive species, which are thought to participate to the establishment of insulin resistance. 19 In obesity, the RAS is activated both at the systemic level20,21 and locally in the visceral adipose tissue.22,23 In the absence of obesity, the RAS causes glucose intolerance independently from insulin resistance of the hormone target tissues, but is associated with increased insulin clearance 24 and/or decreased insulin secretion. 25 In contrast, angiotensin II enhances insulin sensitivity via angiotensin II type 2 receptor (AT2R) in obese rats 1 and it may also be processed into angiotensin 1,7, which enhances insulin sensitivity via its Mas receptor. 26 These contradicting effects are reminiscent of the results from human studies. Indeed, meta-analysis of randomized controlled trials suggests that inhibition of the RAS may contribute to the prevention of type 2 diabetes. 27 However, an effort specifically designed to address this question did not confirm this beneficial effect. 28
To improve our understanding of the integrated role of the RAS in energy metabolism, glucose homeostasis and kidney functions, we took advantage of double transgenic mice (dTGM) expressing the human angiotensinogen and renin genes (R+/A+), a constitutive RAS activation model which has been previously described. 29 dTGM are hypertensive but do not seem to have a severe form of kidney disease or a reduced lifespan despite an increased angiotensin II level and renin activity. 29 dTGM have the same body weight as wild-type mice (WT), suggesting a balanced energy metabolism.30,31 The expression of the human genes in these mice are found in the same tissues and cells as in humans probably because the transgenes contain non-coding sequences located upstream and downstream from the coding sequences.31–33 In the present study, we used these dTGM to measure global energy balance and the renal functions. We also characterized glucose and insulin-regulated metabolism by performing glucose tolerance tests (GTTs) and insulin tolerance tests (ITTs). Finally, we blocked the angiotensin-converting enzyme (ACE) with ramipril to assess the role of angiotensin II in glucose homeostasis.
Methods
Ethics approval
All procedures employed on animals were approved by the university animal care and use committee at the University of Nice Sophia-Antipolis (France).
Animals
Heterozygous mice for human angiotensinogen (hAng), strain number B6.Cg-Tg(hAGT)2041Sig/J (R−/A+), and heterozygous mice for human renin (hRen), strain number B6.Cg-Tg(hREN)9Sig/J (R+/A−), were recovered after cryopreservation in the Jackson Laboratory (Maine, USA). Progenitors were amplified in our animal facility by breeding hAng and hRen mice with WT mice (WT, R−/A−) from the same genetic background (C57Bl/6J) obtained from the Charles River Laboratory (St Germain sur l’Arbresle, France). Because the hRen gene is located on the X chromosome, a sex-linked mode of inheritance of the hRen gene was observed. A normal Mendelian inheritance of the hAng gene was found. Only heterozygous mice for hRen and/or hAng gene were used in our study. Male dTGM carrying both the hAng and the hRen genes (R+/A+) were generated by breeding heterozygous hAng transgenic male mice with heterozygous hRen transgenic female mice. Approximately 12.5% of the offspring were male and double transgenic. There was no apparent increased mortality in the mice as already described.29,34 dTGM were identified using specific primers and polymerase chain reaction (PCR) of genomic DNA purified from a tail biopsy sample.31,33 Mice were fed a standard mouse chow diet (A03, Charles River Laboratory, St Germain sur l’Arbresle, France) or a high-fat diet with 60% energy in fat (D12492, Research Diet, New Brunswick, NJ, USA) and water ad libitum. Mice were held collectively in cages (three to five per cage). Diet intake and body weight were monitored weekly. Water intake and urinary output were measured after 24 hours housing in metabolic cages (Techniplast, Buguggiate, Italy). The experiments were performed only in male mice except for the GTT, which was performed in females also. At the end of the experiment, mice were sacrificed by cervical dislocation and tissues were harvested, weighed and processed for several molecular and histological analysis.
Glucose and insulin tolerance tests and insulin secretion assay
Glucose and insulin tolerance tests were performed on mice fasted for 18 hours and six hours, respectively. For the GTT, mice were injected with 1 or 2 g of glucose per kg of body weight depending on age. For the insulin tolerance test, mice were injected with 0.75 IU/kg body weight (Umulin Rapid, Lilly, Suresnes, France). Venous blood was obtained from the tail vein. Blood was collected before administration of glucose (time 0) and at 15, 30, 45, 60, 90 and 120 minutes after intraperitoneal glucose/insulin injection. For the insulin secretion assay, blood was collected before glucose administration (0) and at 2, 10 and 20 minutes after intraperitoneal injection of glucose (2 g/kg body weight). Insulin was measured with an ultrasensitive enzyme-linked immunosorbent assay (ELISA) kit (Mercodia, Uppsala, Sweden).
Glomerular filtration rate (GFR)
After isofluorane anesthesia of the mice, a silastic catheter was inserted in their left femoral vein for infusion of fluorescein isothiocyanate (FITC)-inulin (Sigma-Aldrich, Lyon, France) diluted in isotonic saline buffer. A suprapubic incision was performed to collect urine through iterative puncture of the urinary bladder. After a 30-minute equilibration period, the clearance of inulin was measured during three successive 30-minute collection periods. Venous blood was obtained from the tail vein at the beginning and end of each collection period. GFR was calculated as follows: [U]inulin × urinary output/[([B]Inulin a + [B]inulin b)]/2, with [U]inulin for urinary inulin fluorescence, [B]Insulin a for inulin fluorescence in blood at the beginning and [B]inulin b at the end of each collection period. The GFR value is the mean value of three collection periods.
Blood pressure measurement
Blood pressure was monitored at the 17th and 30th week of life and was measured using the tail cuff method 35 with the BP 2000 apparatus (Visitech, Apex, NC, USA). Briefly, 10 preliminary unrecorded measurements were performed to allow the mice to warm up, and to obtain a reproducible flow waveform after placement into the machine. A set of 10 measures was performed for each mouse (seven dTGM and eight WT) and values were selected when tail cuff inflation gave a typical flow waveform. Individual values are the mean of multiple measurements. Mean arterial pressure (MAP) was calculated from diastolic blood pressure (DBP) and systolic blood pressure (SBP) as follows: MAP = DBP + (SBP–DBP)/3.
Locomotor activity
dTGM and WT mice were individually placed for a week in wheel cages (Intellibio, Seichamps, France) with free access to chow diet and water. Every day, mice were weighed, food intake was monitored and distance run was calculated (expressed in km/day). There were six dTGM mice and six WT mice.
Rectal temperature measurement
Rectal temperature was measured three times in a subset of seven dTGM and in nine WT mice with a TK-610B thermometer (Farnell, Leeds, United Kingdom).
Ramipril administration
Mice (seven dTGM and nine WT) were submitted to forced enteral feeding with deionized water between 5 p.m. and 6 p.m. for five consecutive days (20 µl water/g body weight (BW)/day). After a 10-day recovery period, the same mice were submitted to forced enteral feeding with deionized water including ramipril (10 µg/g BW/day) between 5 p.m. and 6 p.m. for five consecutive days. After both periods of forced enteral feeding, GTTs were performed on the morning of day 6 after an overnight fast, and blood pressure was measured on the afternoon of the same day.
Glucose transport in the isolated soleus
Mice were sacrificed by cervical dislocation and soleus muscles were dissected and prepared for incubation. Soleus muscles were incubated first for one hour at 37°C in 3 ml of oxygenated (95% O2–5% CO2) Krebs-Henseleit buffer (KHB) supplemented with 8 mM glucose, 32 mM mannitol, and 0.1% (w/v) bovine serum albumin (BSA) (radioimmunoassay grade, Sigma Chemical). Following this initial incubation, the muscles were placed for 10 minutes at 37°C in 3 ml of KHB containing 40 mmol/l mannitol, 0.1% (w/v) BSA, in the absence or presence of insulin (10−8 Mol/l or 10−7 Mol/l). Then, 1 mM 2-deoxy-[1,2-3H] glucose (2-DG) (300 µCi/mmol; Sigma Chemical) was added for 10 minutes incubation at 37°C. Thereafter, the muscles were removed and washed. Finally, the specific intracellular accumulation of 2-DG was determined. 36
Isolation of renal tubules
After pentobarbital anesthesia of the mice, a silastic catheter was inserted into the abdominal aorta. The left kidney was rinsed with saline and infused with collagenase. Proximal convoluted tubules (PCT) were dissected from collagenase-treated kidneys. 37 For RNA extraction, tubules were isolated under RNAse-free conditions. 38 Afterwards, mice were sacrificed by cervical dislocation.
Reverse transcription (RT) PCR
To determine whether hAng and hRen mRNA were present in the soleus and extensor digitorum longus (EDL) of dTGM, we used RT-PCR. Muscles were collected after cervical dislocation of the mice and total RNA was extracted. Kidney RNA was used as an internal positive control because it has been shown that hRen and hAng mRNA are expressed at a high level in the kidney.31,33 RT-PCR was performed with the cDNA reverse transcription kit (Qiagen, Courtaboeuf, France) on a T3000, Göttingen, Germany) using oligo-dT primers. For PCR amplification, 2 µl of the RT reaction were used. PCR was performed with Redtaq PCR reaction mix (Sigma-Aldrich, Lyon, thermocycler (Biometra France) on a T3000 thermocycler. PCR products were visualized with GelRed staining after agarose gel electrophoresis. Primers were designed to allow a non-ambiguous identification of each fragment according to their expected length. Normalization of the PCR was ascertained through glyceraldehyde 3-phosphate dehydrogenase (GAPDH) amplification.
Real-time q-PCR
RNA was extracted from pools of 40 to 50 microdissected tubules according to the technique described 38 and RNA pellets were diluted in 5 µl of water. RT was performed on 4 µl of tubular extract. The remaining 1 µl of RNA extract was used for RNA dosage. RT was performed on a T3000 thermocycler (Biometra, Göttingen, Germany) with a high-capacity cDNA RT kit (Qiagen, Courtaboeuf, France) according to the manufacturer’s protocol. A negative control with water was performed to exclude the possibility of unspecific amplification due to primer duplicate or coupling. However unspecific amplification due to DNA contamination can be excluded as most primer couples were exon spanning. qPCR was performed in the presence of cDNA corresponding to 80 ng of RNA. RNA extracted from whole kidney according to the same procedure was used as an internal standard for PCR. Specific gene expression was calculated relative to the 36b4 housekeeping gene by the comparative threshold cycle method (2−ΔΔCT) using a 7000 system (Applied Biosystems). Results were expressed as arbitrary units. Specific primers (sequences available on request) were designed using the Primer 3 software.
Histology
For hematoxylin eosin (HES) coloration, kidneys were removed after anesthesia with pentobarbital, cut in halves along the transversal axis and fixed in 3% (v/v) paraformaldehyde before paraffin embedding. Histology was performed on 3 µm kidney slices. For electronic microscopy (JEM-1200EX-II, Jeol, Croissy-sur-Seine, France), kidneys were cut in small slices along the transversal axis and fixed in glutaraldehyde 10% (v/v) in phosphate buffer before resin embedding.
Biological markers
Urinary levels of glucose, phosphates, proteins and creatinine, and serum levels of creatinine were determined with a Vitros 350 automatic analyzer (Orthoclinical Diagnostics, Issy les Moulineaux, France). Urine was acidified to 1.5<pH<5.0 to dissociate phosphate crystals before dosage of phosphates. Blood glucose was measured with a glucometer (One-touch Ultra, Lifescan, Issy les Moulineaux, France). Albumin was measured in diluted urine with a mouse albumin ELISA kit (Bethyl Laboratory, Montgomery, TX, USA). To determine amino acid urinary levels, urine was collected after reflex urination and immediately stored on ice before freezing. Amino-acid levels were determined by capillary electrophoresis on these urinary samples. 39
Urinary protein electrophoresis
Urine from six to eight mice of the same age and same genotype was pooled and concentrated (Minicon concentrator, Millipore). Electrophoresis was performed on acrylamide gel (30 to 100 µg of protein) to separate proteins according to their molecular mass. Gels were stained with Coomassie blue.
Statistical analyses
Results were expressed as mean ± standard error. Quantitative variables were compared by Student’s t test. The threshold for statistical significance was set at p < 0.05.
Results
Assessment of hypertensive phenotype
Blood pressure was higher in dTGM than in WT mice throughout life. For example, at the 30th week of life, SBP was 123 ± 4 in dTGM vs 97 ± 2 in WT mice (p < 0.002), DBP was 97 ± 4 vs 80 ± 2 (p < 0.001) and MBP was 106 ± 4 vs 86 ± 2 mm Hg (p < 0.001). This phenotype was in accordance with constitutive RAS activation.
Impact of constitutive RAS activation on energy balance
The four groups of littermate mice (R−/A+, R+/A−, R−/A− and R+/A+) from the eighth to the 21st week of age (six to 10 mice per group) exhibited no significant difference in weight gain. Therefore, only dTGM (R+/A+) and WT mice (R−/A−) mice are represented in Figure 1, panel (a). On a weekly based estimation, food intake was comparable in the four groups despite a trend toward a higher food intake in dTGM. On this weekly measure, differences in food intake between dTGM and WT mice were not statistically significant. Considering the mean value of food intake over a six-week period, dTGM ate significantly more than WT mice (Figure 1, panel (b)). Physical activity in wheel cages was lower in dTGM compared to WT mice according to daily measure. This was statistically significant on three different days. Mean locomotor activity registered during a week was lower in dTGM compared to WT mice (4.9 ± 0.3 versus 6.1 ± 0.1, p < 0.03) as illustrated in Figure 1, panel (c). The rectal temperature reflecting basal metabolic rate was the same in dTGM and WT mice (Figure 1, panel (d)). Remarkably, the weight gain was significantly lower in R+/A+ mice on a high-fat diet compared to R−/A− mice, but food intake was comparable in R−/A+, R+/A−, R−/A− and R+/A+ mice on high-fat diet (data not shown).
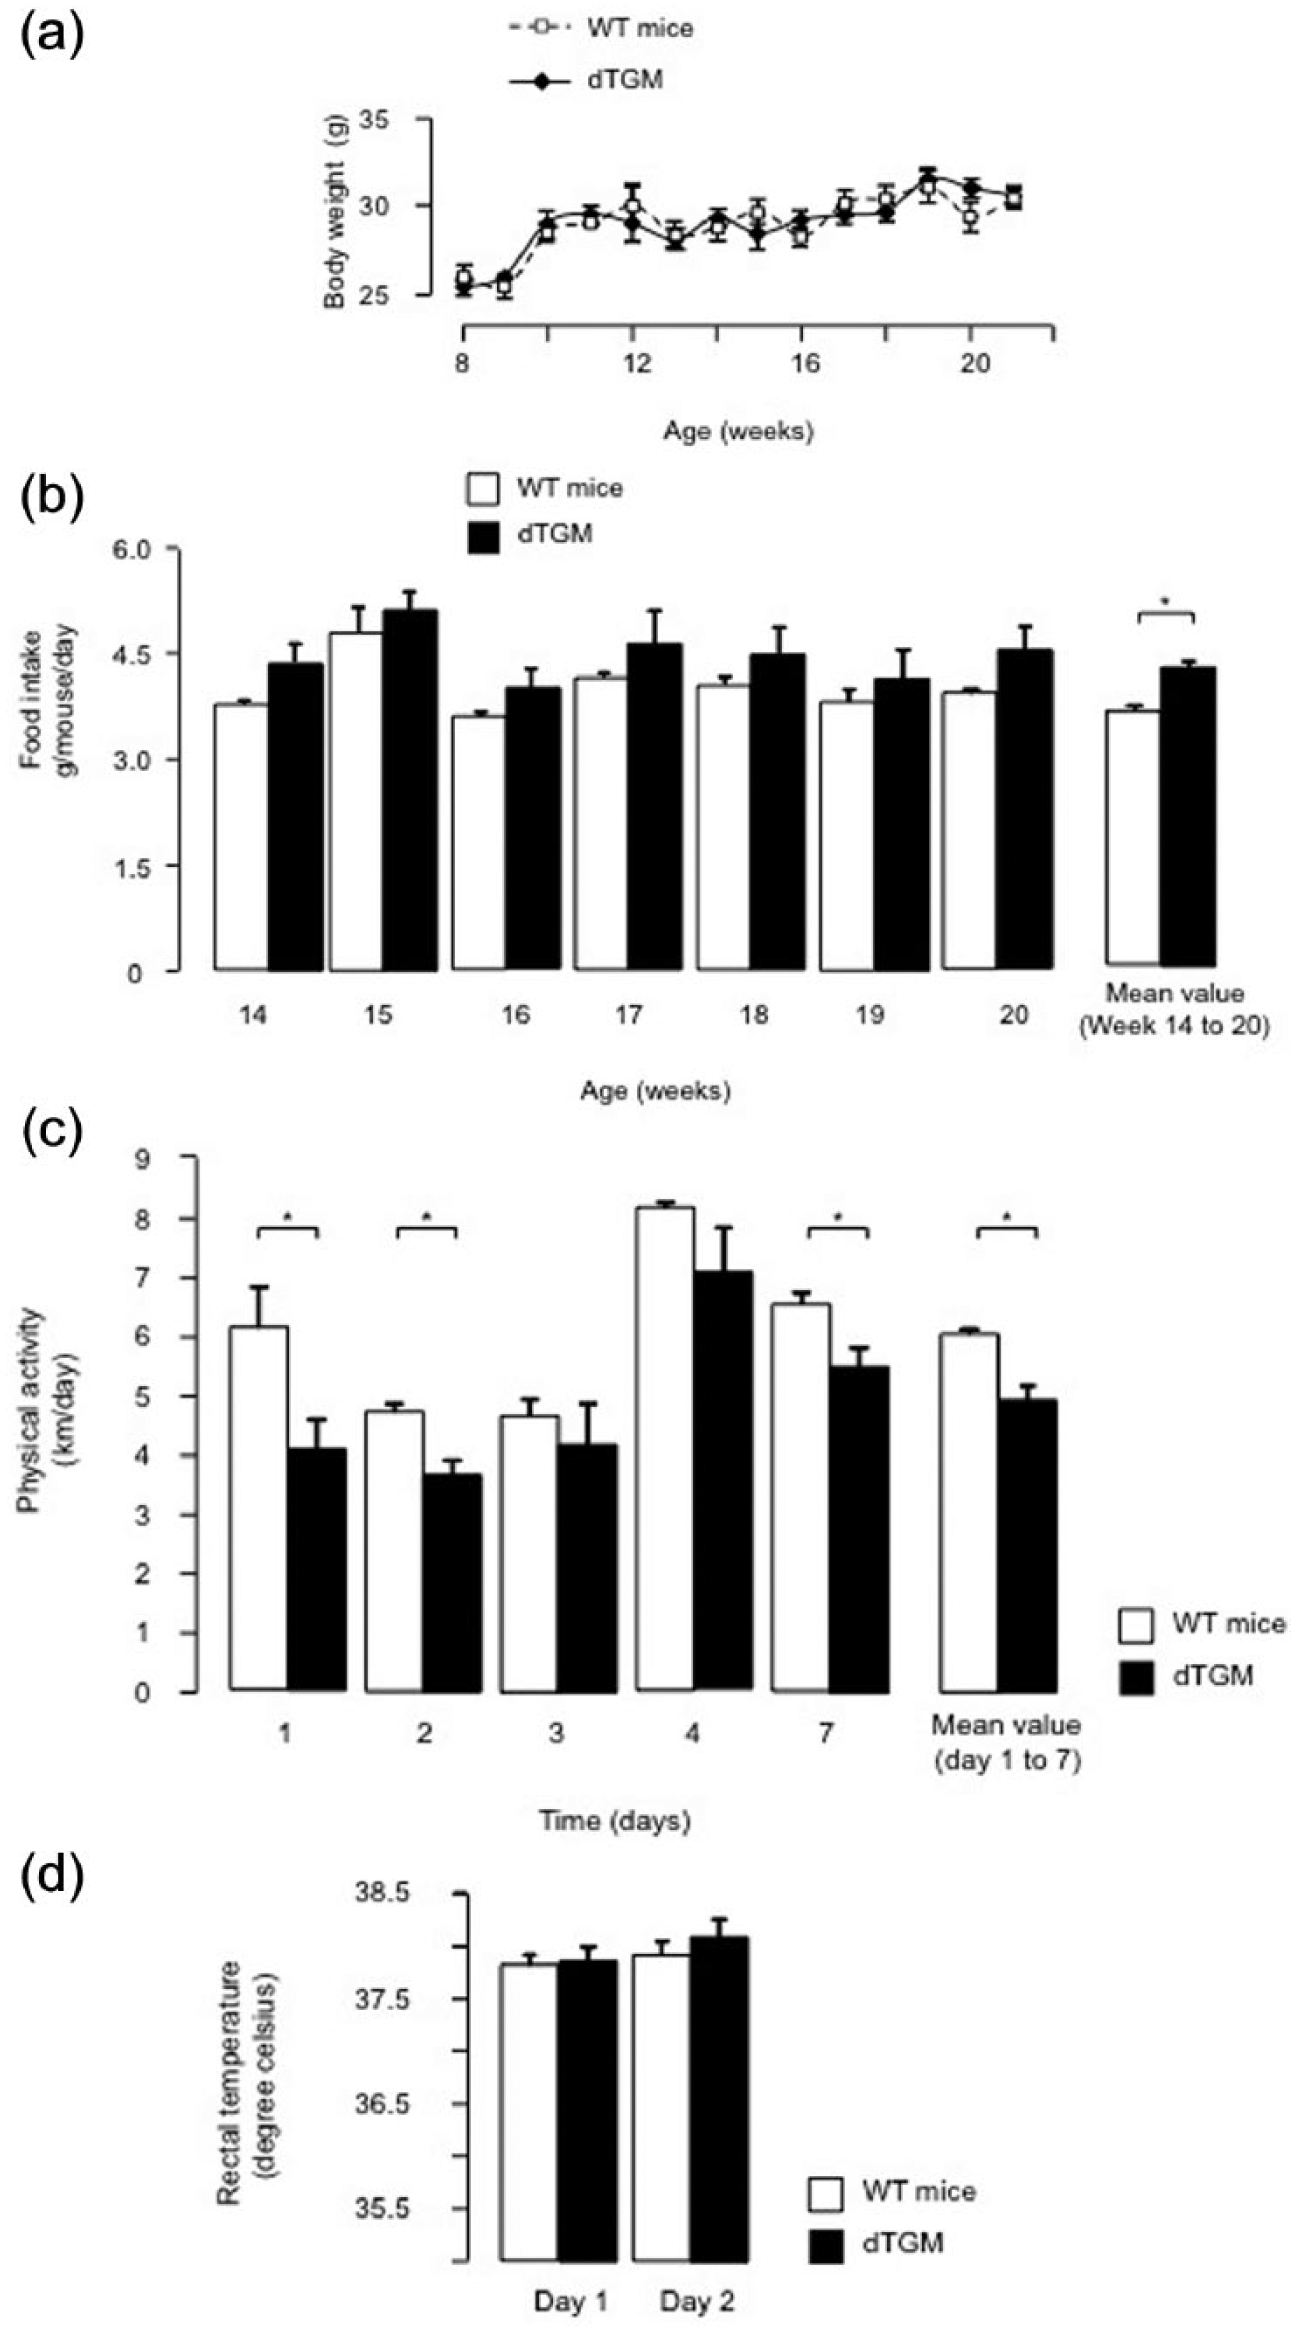
(a and b) Body weight and food intake. (c and d) Physical activity and rectal temperature.
Impact of constitutive RAS activation on structural and functional aspects of the kidney
The three groups of littermate mice (R−/A+, R+/A− and R−/A−) exhibited no significant difference in serum creatinine and urinary protein concentration. Compared to dTGM, these three groups presented significantly lower serum creatinine and urinary protein concentration. Therefore, we chose to use WT mice (R−/A−) as the control group throughout the study. Kidney morphology was analyzed in our dTGM because of the role of RAS in kidney development. 7 However, optic and electronic microscopic analysis failed to detect alterations of the epithelial structure from the slit diaphragm to the distal tubule. Note that numerous vesicles under the brush border of the proximal tubule were found in dTGM and were not present in WT mice (Figure 2, panel (a)). GFR measured by the urinary clearance of inulin was not different between dTGM and WT mice (Table 1). Urinary protein output was increased in dTGM compared to WT mice (Table 1), and this was partly accounted for by the enhanced excretion of a protein, with 70 kDa molecular mass corresponding to that of albumin (Figure 2, panel (b)). Accordingly, urinary albumin output was significantly increased in dTGM compared to WT mice (Table 1). Stimulation of the brain RAS notably results in polydipsia. 40 Consistent with this, we found that dTGM drink more and have an increased urinary output. We also observed that they have an increased urinary glucose output (Table 2). The proximal tubule is the only segment of the nephron where the capture of glucose, amino acids, phosphates and proteins occurs. Therefore, we measured the urinary output of these compounds and it was indeed higher in dTGM compared to WT mice (Tables 1 and 2). The mRNA levels of proteins involved in glucose capture were measured in whole kidney extract and in isolated proximal convoluted tubule (PCT). However, in the PCT from our dTGM compared to the PCT from WT mice, we found no statistically significant difference in the mRNA levels of the sodium-glucose co-transporters type 1 and 2 (SGLT1 and SGLT2), the glucose transporter type 1 and 2 (GLUT1 and GLUT2) and the alpha-1 subunit of the Na, K-ATPase (data not shown).
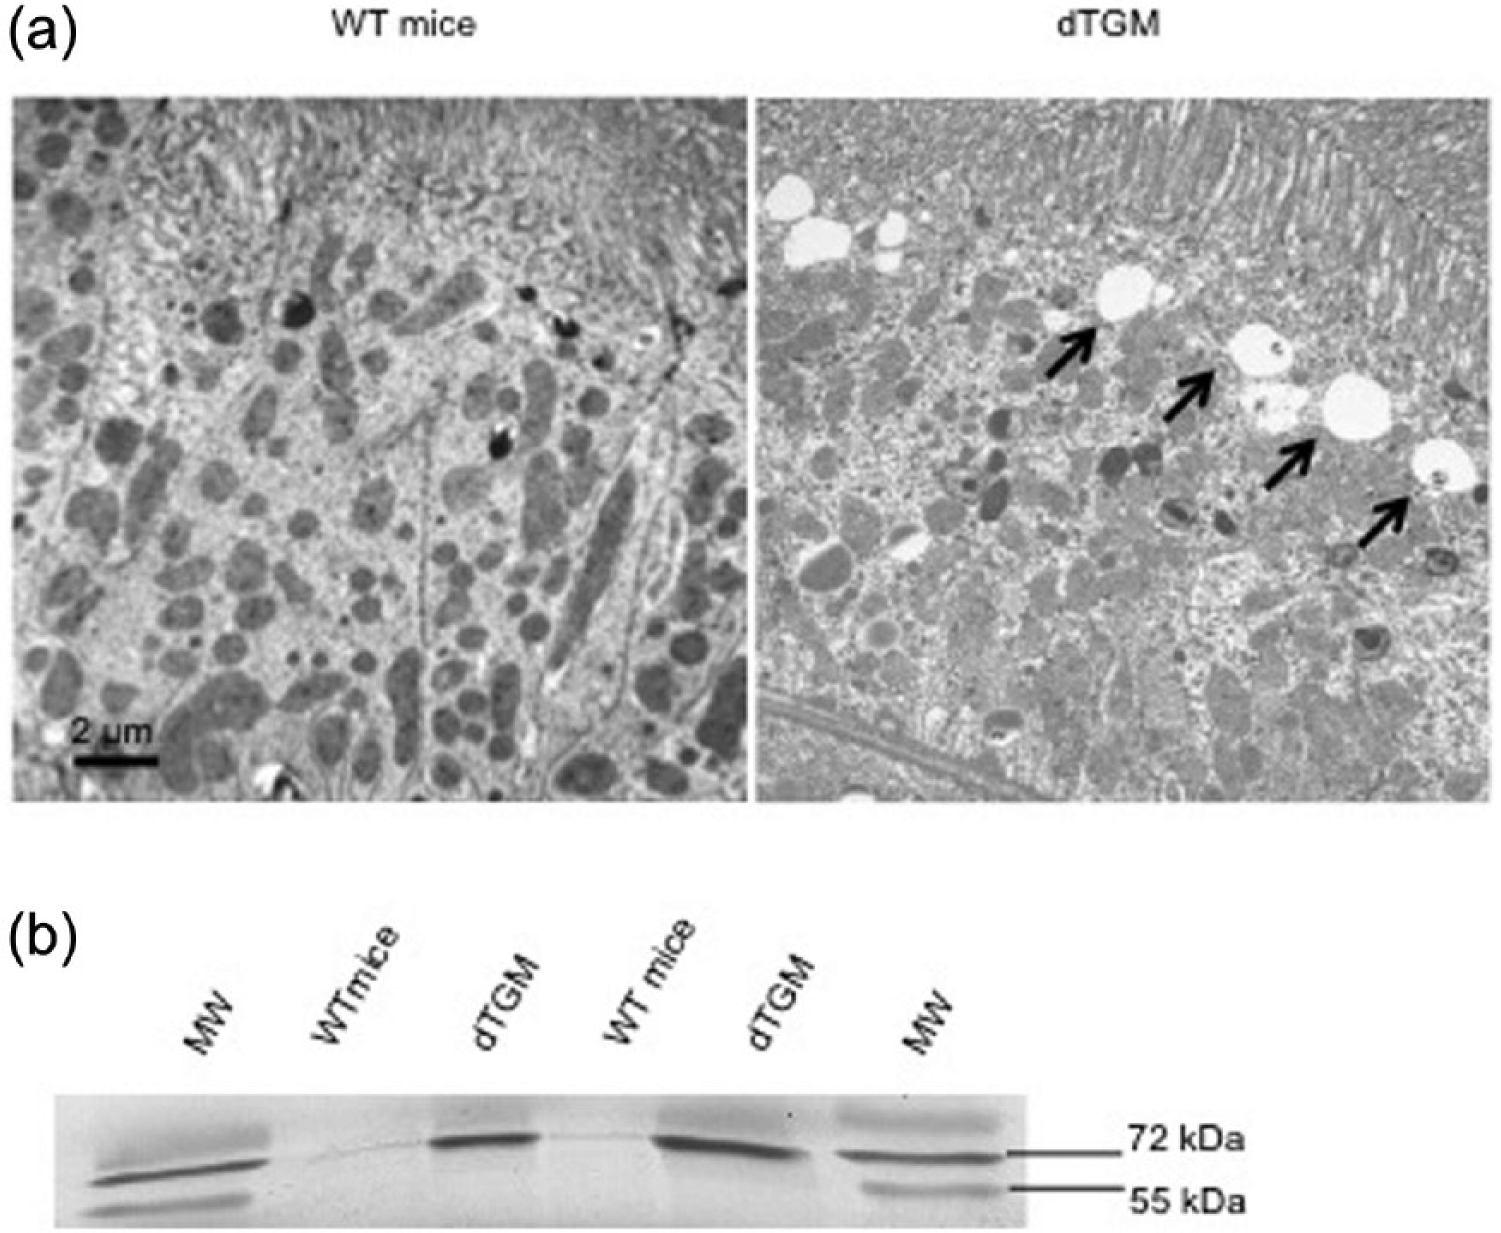
Proximal tubule cell and proteinuria. (a) Proximal tubules were enlarged 4000-fold using electronic microscopy. The experiment was performed in two mice in each group. Black arrows show vesicles under the brush border. (b)Two independent urinary collections from six dTGM and WT mice were pooled and concentrated. One hundred µg of protein were loaded on a 7.5% acrylamide gel under reducing conditions and Coomassie staining was performed. MM: molecular mass markers are present on each side. dTGM: double transgenic mice; WT: wild type.
Kidney function and proteinuria.

Urinary protein and albumin were measured at 24-hour urine collection and protidemia was determined on blood samples taken from tail vein (n = 6 in each group). Glomerular filtration rate was measured with inulin clearance on anesthetized mice (n = 3 in each group). Values are mean ± SEM. aSignificant difference between dTGM and WT mice; p < 0.05. BW: body weight; dTGM: double transgenic mice; WT: wild type.
Water intake, blood creatinine and urinary parameters.

Mice were housed in individual metabolic cages for 24 hours with free access to water and chow. Water intake was measured. Urine was collected and glucose, phosphates and creatinine were measured in this 24-hour urine collection. Amino acids were measured on reflex miction and 24-hour urinary output was estimated with diuresis. Creatinine was determined on blood samples taken from tail vein. There were six mice per group. Values are mean ± SEM. aSignificant difference between dTGM and WT mice; p < 0.05. dTGM: double transgenic mice; WT: wild type.
Impact of the constitutively activated RAS on glucose tolerance
GTTs on male mice aged 6 weeks to 47 weeks were similar in R−/A+, R+/A− and R−/A− mice. Therefore only dTGM (R+/A+) and WT mice (R−/A−) are represented. dTGM exhibited lower blood glucose levels after glucose administration at all ages studied, i.e. 6, 14, 20, 25 and 47 weeks (Figure 3, panels (a–c), weeks 14 and 20 not shown). Glucose excursion was lower in dTGM than in WT mice mainly during the initial phase of the GTT, where the glycemia reflects for the greater part glucose distribution. Accordingly, the areas under the GTT curve between T0 and T30 were statistically lower in dTGM compared to WT mice, and this was the case at all ages except at 14 weeks due to experimental variability (Figure 4, panel (a)). Conversely, the areas under the GTT curve between T30 and T120 were not different between dTGM and WT mice (Figure 4, panel (b)). Together these results are compatible with a better glucose tolerance following constitutive RAS activation. Note that female double transgenic R+/A+ mice did not present this phenomenon. Therefore, the following experiments were performed solely in male mice.

Glucose tolerance tests at different ages.
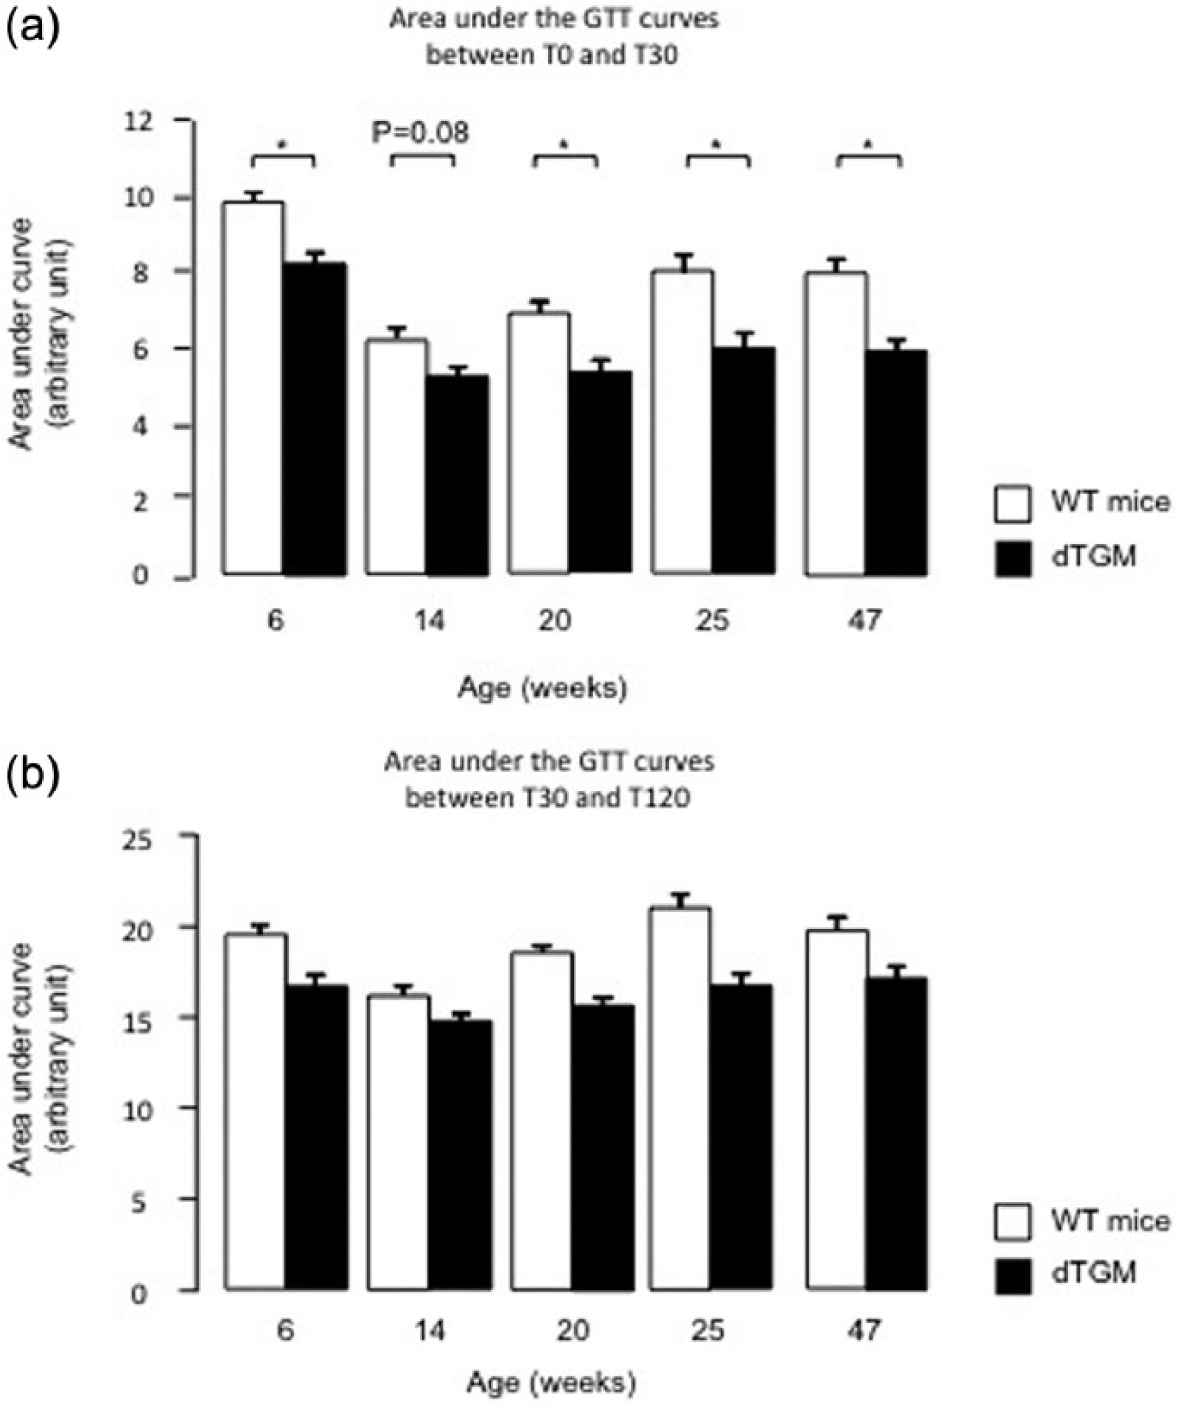
Areas under the curve of glucose tolerance tests.
Impact of the constitutively activated RAS on insulin sensitivity and secretion
Insulin tolerance tests at the different ages did not reveal significant differences between the four groups, indicating a similar insulin sensitivity in dTGM and WT mice (data not shown). Glucose-induced insulin secretion measured in 9-week-old mice showed that the insulin secretion profile was comparable in dTGM and WT mice (Figure 5), although at a similar early age the glucose tolerance was the most divergent between WT mice and dTGM (see Figure 3, panel (a)).

Insulin secretion test.
Role of angiotensin II in the improved glucose tolerance of dTGM
As shown in Figure 6 (panels (a) and (b)), ramipril did not suppress the difference in glycemia routinely observed between dTGM and WT mice during the early phase of the GTT. Fifteen minutes after glucose administration the glycemia was lower in dTGM compared to WT mice. Accordingly, the area under the curve between T0 and T30 was significantly lower in dTGM than in WT mice (Figure 7, panel (a)). However, the area under the curve between T30 and T120 was comparable between dTGM and WT mice (Figure 7, panel (b)). As expected, ramipril significantly lowered blood pressure in dTGM and in WT mice (Table 3).

Effect of ramipril on glucose tolerance tests.

Effect of ramipril on areas under the curve of glucose tolerance tests.
Effect of gavage with or without ramipril on blood pressure.

Tail cuff blood pressure was measured in littermate mice after five consecutive days of forced enteral water administration (gavage) without ramipril (R–) or with ramipril (R+). The same mice were used successively for the R– and R+ experiment. There were seven dTGM mice and nine WT mice. Values are mean ± SEM. aSignificant difference between R– and R+; p < 0.05. dTGM: double transgenic mice; WT: wild type.
Altered glucose homeostasis associated with constitutively activated RAS
Renal glucose spillage in dTGM is in line with the better glucose tolerance observed in dTGM compared to WT mice. Quantitatively, glucose loss in dTGM accounts for less than 3% of the glucose injected during a GTT. In contrast, mean area under the GTT curve is 18% lower in dTGM compared to WT mice. Note that glucose output does not increase after a glucose load in dTGM. Because the glucose clearance is due to the capture of blood glucose by insulin target tissues, we compared the weight of some of these tissues in dTGM and WT mice. Visceral white adipose tissue mass from epididymal fat pads was significantly lower in dTGM (1223 ± 276 versus 3012 ± 518 mg, p < 0.0001) compared to WT mice (Table 4). This difference did not support an increased glucose clearance resulting from enhanced glucose incorporation in the WAT. Because skeletal muscle accounts for the bulk of glucose clearance after an acute glucose administration, we analyzed whether the improved glucose tolerance could be due to selective enhanced glucose incorporation in the muscle. EDL and soleus muscle displayed no weight difference in dTGM compared to WT mice (Table 4). These two small muscles from the leg were chosen because the soleus muscle expressed both human transgenes in contrast to the EDL muscle, which expressed only the hAng gene (Figure 8). Insulin-induced glucose transport was measured in isolated soleus muscles but no difference between dTGM and WT mice was revealed (data not shown). Further, we analyzed whether the improved glucose tolerance could be due to increased energy consumption in the skeletal muscle. Because creatinine is the non-enzymatic degradation product of creatine in the skeletal muscle, its urinary level reflects muscular energy consumption. Interestingly, the urinary creatinine level was increased in dTGM compared to WT mice (Table 2), suggesting an increased energy turnover in muscle and/or an increased muscular mass at the expense of the white adipose tissue (Table 4).
Weight of insulin target tissues.

Tissues were dissected and weighed in littermate mice. Values are mean ± SEM. aSignificant difference between dTGM and WT mice; p < 0.05. dTGM: double transgenic mice; WT: wild type; EDL: extensor digitorum longus.

Genes expression in muscles and kidney from dTGM and WT mice.
Discussion
The first key observation of our study based on the use of constitutive RAS activation in mice is a mild energy imbalance resulting in a lower fat pad mass in dTGM compared to WT mice. This is likely to result from several compensatory mechanisms. Actually, the higher food intake (Figure 1, panel (b)) did not favor weight gain despite the decreased spontaneous locomotor activity observed in dTGM compared to WT mice (Figure 1, panel (c)). Body weight (Figure 1, panel (a)) and body temperature (Figure 1, panel (d)) were comparable in dTGM and WT mice, but the visceral fat pad mass was decreased (Table 4), suggesting an impaired capacity for lipid use and/or storage. In line with these data, we observed a resistance to weight gain in dTGM on a high-fat diet compared to WT mice. Similarly, constitutive RAS activation in Ren TgMK mice, resulting in hypertension and high angiotensin II level, reduces visceral adiposity and protects against diet-induced obesity. 24 Moreover, chronic angiotensin II administration in rats led to weight loss at the expense of fat mass. 3 In light of a recent study with specific brain RAS activation in mice, 30 it is likely that the mild wasting phenotype observed in our dTGM results from a balanced activation between brain RAS and peripheral RAS. Actually brain RAS is involved in the control of metabolic functions,41,42 and angiotensin II may be produced in the brain of dTGM 29 or may be taken up from the circulation. Selective hyperactivity of brain RAS is associated to reduced activity of peripheral RAS and this imbalance results in a severe wasting phenotype in mice that is reversed with parenteral administration of angiotensin II. 30 The lower visceral adiposity observed in our dTGM was not accounted for by chronic kidney disease, which is defined as renal damage or decreased GFR.43,44 Our dTGM exhibited kidney damage, as shown by albuminuria (Table 1), but they did not have a reduced GFR (Table 1). Therefore they did not have a severe form of kidney disease that could have resulted in protein wasting 13 or lipotoxicity. 14 In contrast, the Tsukuba hypertensive mice (THM) expressing the hAng and hRen genes suffer from cardiac hypertrophy and glomerulosclerosis secondary to severe hypertension.15,16 These variable phenotypes probably result from different levels of expression of the human transgenes secondary to divergent locations of hRen, which is on the X chromosome in dTGM, but not in THM. 45 Finally, our dTGM showed proximal tubule dysfunction attested by increased renal output of glucose as well as of phosphate, amino acid and protein (Tables 1 and 2). This is associated with accumulation of vesicles under the brush border of the proximal tubule (Figure 2, panel (b)). These vesicles could be due to increased protein capture secondary to abnormal protein leakage from the glomeruli, which is reminiscent of the minimal change disease in humans. The mRNAs of the glucose transporters (GLUT1 and 2) and sodium-glucose cotransporters (SGLT1 and 2) were unchanged in isolated PCT from dTGM compared to WT mice. This does not exclude molecular dysfunction at the protein level. However, it is possible that the higher urinary flux in dTGM partly explains the urinary spillage of compounds that are specifically recaptured in the proximal tubule. In dTGM, the higher urinary output is the consequence of higher water intake resulting from a crosstalk between brain RAS and peripheral steroids. Actually, the stimulation of AT1R in the subfornical organ of the brain causes polydipsia 40 and adrenal glands maintain elevated drinking in mice, 30 probably through a mineralocorticoid regulation of brain AT1R. 46
In our model of constitutive RAS activation characterized by a lower visceral adiposity without difference in body weight, we found an improved glucose tolerance that was predominant in the first 30 minutes after glucose administration (Figures 3 and 4). This feature suggests that the ameliorated glucose tolerance is due to an enlarged distribution space rather than a change in insulin-stimulated glucose uptake. As the skeletal muscle accounts for the bulk of glucose clearance during a GTT, its increased capacity to use glucose could contribute to the better glucose tolerance in dTGM. Remarkably, the higher creatinine production (Table 2) without change in body weight suggests a modification of the body composition at the advantage of skeletal muscle and at the expense of white adipose tissue (Table 4). Note that the female dTGM did not have an improved glucose tolerance, which could be due to action of male hormones on muscle metabolism and/or to tissue mosaicism in females, because the hRen is located on the X chromosome. Quantitatively, the creatinine overproduction in dTGM compared to WT mice (43%) is higher than the mean value of the difference in the area under the GTT curves between dTGM and WT mice (18%). This suggests that a proportional muscle mass increase or muscle energy turnover augmentation in dTGM could quantitatively account for this higher glucose tolerance. Note that angiotensin II may act as a growth factor in skeletal muscle from rats. 47 The improved glucose tolerance persisted after acute ACE inhibition with ramipril (Figures 6 and 7). This is in line with a modification of body composition that is not acutely reversed. However, the weight of the soleus and EDL muscle, the first carrying both human transgenes and the second lacking the hRen gene, was not different in dTGM compared to WT controls. However, this does not exclude whole body muscle mass modifications in dTGM. Therefore, the higher creatinine production could be accounted for by a higher rate of energy turnover in the skeletal muscle and/or by a change in muscle mass. Glucosuria may contribute to the improved glucose tolerance seen in dTGM. However, its magnitude does not seem to be sufficient to explain by itself the better glucose tolerance observed in dTGM.
The constitutive RAS activation in dTGM did not change insulin sensitivity at the organismal level or at the level of isolated skeletal muscles. This is in line with the results obtained with Ren TgMK mice, another model of constitutive RAS activation. Actually in Ren TgMK mice, insulin sensitivity assessed with euglycemic hyperinsulinemic clamp was unchanged compared to control mice. 24 Moreover, constitutive RAS activation in our study did not modify insulin secretion (Figure 5). In contrast, insulin secretion was impaired in obese Otsuka Long-Evans Tokushima Fatty rats (OLETF) through AT1R, 25 and insulin clearance was increased through overexpression of renin in the liver of Ren TgMK mice. 24 Therefore, our study and the observations in Ren TgMK mice support the view that the association of RAS activation and hypertension, which are features of metabolic syndrome, do not induce insulin resistance in mice in the absence of visceral fat accumulation. In contrast, in the obese situation, RAS activation at the systemic level21,22 and locally in the visceral adipose tissue22,23 is closely associated with insulin resistance and hypertension. 48 Hence, the correlation of RAS activation with dyslipidemia and hyperglycemia in obesity, but not RAS activation alone, seems to be involved in dysregulation of glucose homeostasis.
The strength of our study is the comprehensive description of energy metabolism and renal functions of the mice exposed to constitutive RAS activation. However, caution is required because of several facts. First, we did not perform a complete evaluation of the energy expenditure. However, it has been proposed that heat production could reflect basal metabolic rate in rodents. A positive correlation exists between infrared emission 3 or body temperature (measured with a rectal dye 4 or with telemetry 30 ) and oxygen consumption and carbon dioxide release. Nevertheless, the 24-hour temperature measurement with telemetry shows that differences may be significant only at certain time points. 30 Therefore, our temperature measurements in dTGM do not exclude a possible effect of RAS on body temperature regulation. Second, we did not evaluate the body composition of our mice, which would be a better way to prove an increased energy metabolism in skeletal muscle or an increased muscle mass at the expense of the white adipose tissue. Finally, we did not measure the fat content of the stool. Energy loss might also occur in feces as documented for example in Ren1c−/− mice. 5 However, the quantity and aspect of the stool were unchanged in dTGM.
In conclusion we demonstrate, for the first time to the best of our knowledge, that constitutive RAS activation accounts for a better glucose tolerance in mice, independently from insulin and angiotensin II action. Simultaneously, we show that RAS activation leads to modifications of fuel distribution and/or use secondary to adaptive processes related to the RAS’ broad array of effects. This integrated approach supports the view that RAS activation and hypertension are not sufficient to cause insulin resistance in mice. Finally, our findings dovetail with the conclusion from a human randomized control trial showing the lack of effect of ramipril given to humans for the purpose of preventing diabetes.
Footnotes
Acknowledgements
We thank INSERM for providing G. Favre with a “Contrat d’Interface pour Hospitalier 2010-2014.” Special thanks to N. Gautier, who measured the muscle glucose transport, and to C. Caruba, who measured the urinary amino acids. We are indebted to Charly Bessadier, Clément Molina and Emilie Murris for help with the animal studies and to Dr Patricia Panaia-Ferrari for the biochemical assays. Special thanks to the members of the “Laboratoire de PhysioMédecine Moléculaire” in Nice and Sophia-Antipolis University for technical help with renal clearance and to Dr Laure-Hélène Noël for her expert advice in renal pathology.
Authors’ contributions
G. Favre designed the study, performed the main experimental work and wrote the paper. P. Lebrun measured the muscle glucose transport, interpreted data and wrote the paper. P. Lopez designed the primers for PCR, extracted the muscle for the genotype, interpreted the results and wrote the paper. C. Butori and P. Hofman performed the electron microscope imaging and interpreted the data. V. Esnault and E. Van Obberghen designed the study and wrote the paper.
Conflict of interest
None declared.
Funding
This work was supported by Inserm, Université de Nice Sophia Antipolis, Conseil Régional PACA and Conseil Général des Alpes-Maritimes, by the European Foundation for the Study of Diabetes (EFSD/Lilly; European Diabetes Research Programme; 2011), by Fresenius Medical Care and Aviesan/AstraZeneca, the “Diabetes and the vessel wall injury” program and by the Agence Nationale de la Recherche (ANR blanc n°RPV12004AAA).